



Introduction
With the growing prevalence of obesityReference Flegal, Carroll, Ogden and Curtin 1 , Reference Ogden, Carroll, Curtin, Lamb and Flegal 2 and its associated risk factors for cardiovascular diseases and pediatric health conditions,Reference Fagot-Campagna, Pettitt and Engelgau 3 – Reference Strauss 5 evidence-based strategies to prevent obesity have become increasingly important. Alongside this, the interest in framing chronic disease etiology within a life-course approach has put the focus on critical periods of development.Reference Ben-Shlomo and Kuh 6 Interestingly, obesity has been associated with changes during critical periods of infant development; for example, rapid weight gain during infancy has been associated with subsequent obesity both in humanReference Dennison, Edmunds, Stratton and Pruzek 7 – Reference Ong and Loos 9 and animal models.Reference Faust, Johnson and Hirsch 10 , Reference Plagemann, Harder and Rake 11 The potential for intervention during these periods has also been observed.Reference Oken and Gillman 12
Although formula feeding has been shown to be safe in growing children and animals,Reference Bernt and Walker 13 , Reference Quigley and Drewry 14 it has also been associated with an increased risk for childhood and adult obesity.Reference Grummer-Strawn and Mei 15 , Reference Stettler, Stallings and Troxel 16 In fact, many studies have demonstrated the protective effect of breast feeding against future obesity.Reference Victora, Barros, Lima, Horta and Wells 17 – Reference Yan, Liu, Zhu, Huang and Wang 19 This could be due to formula-fed infants tending to have greater protein intakes than breast-fed infants,Reference Michaelsen and Greer 20 bioactive factors present in breast milk modulating adipocyte differentiation,Reference Hauner, Rohrig and Petruschke 21 , Reference Petruschke, Rohrig and Hauner 22 or the higher blood insulin concentrations in formula-fed infants stimulating fat deposition.Reference Lucas, Sarson and Blackburn 23 Interestingly, formula-fed infants also display a more rapid weight gain and growth rate, slower glucose clearance, with greater adiposity, HDL/LDL ratios, and lean body mass, than breast-fed infants.Reference Heinig, Nommsen, Peerson, Lonnerdal and Dewey 24 – Reference Ravelli, van der Meulen, Osmond, Barker and Bleker 26 Formula-fed human and animal infants also tend to have higher serum concentrations of insulin-like growth factor 1 (IGF1) than breast-fed infants.Reference de Zegher, Sebastiani and Diaz 27
IGF1 is an endocrine- and paracrine-acting polypeptide that mediates the action of insulinReference Gluckman 28 and growth hormone (GH)Reference Le Roith, Bondy, Yakar, Liu and Butler 29 , Reference Liu and LeRoith 30 throughout the body via the stimulation of DNA synthesis and mitosis in various cells. It stimulates cell growth, chondrocyte proliferation and maturation at the growth plate for long-bone growth, skeletal muscle formation and growth, and adipocyte differentiation and lipid accumulation.Reference Liu and LeRoith 30 – Reference van der Eerden, Karperien and Wit 34 Serum IGF1 levels generally increase with childhood age before peaking at puberty and decreasing thereafter.Reference Brabant, von zur Muhlen and Wuster 35 , Reference Juul, Bang and Hertel 36 Thus, it has an important role regulating pre- and post-natal growth; its crucial role in fetal and neonatal growth has been demonstrated in the disruption of the IGF1 gene in miceReference Beck, Powell-Braxton, Widmer, Valverde and Hefti 37 and humans,Reference Woods, Camacho-Hubner, Savage and Clark 38 and IGF1 infusions have been linked to an increased growth trajectory.Reference Eremia, de Boo, Bloomfield, Oliver and Harding 39
Studies have shown positive correlations between infant serum IGF1 concentrations and body weight (BW), body mass index (BMI), body length, and adiposity;Reference Ong, Langkamp and Ranke 25 however, IGF1 therapy has shown differing effects on body adiposity in children.Reference Laron, Anin, Klipper-Aurbach and Klinger 40 , Reference Laron, Ginsberg, Lilos, Arbiv and Vaisman 41 It has been suggested that IGF1 levels may be responsible for the increased BW gain in formula-fed infants;Reference Field, Diego and Hernandez-Reif 42 or alternatively, IGF1 may be responsible for partitioning that weight gain into statural growth instead of fat deposition, and that other mechanisms may explain rapid gains in BW, BMI, and adiposity.Reference Ong, Langkamp and Ranke 25
Circulating IGF1 levels are regulated by nutrition (mainly quantity and quality of dietary protein) in early infancy,Reference Hoppe, Udam and Lauritzen 43 before transitioning to GH-regulation.Reference Hill and Hogg 44 It is therefore possible that higher IGF1 levels in formula-fed infants may be due to greater protein intake.Reference Hoppe, Udam and Lauritzen 43 , Reference Madsen, Larnkjaer, Molgaard and Michaelsen 45 , Reference Socha, Grote and Gruszfeld 46 However, as breast milk concentration of IGF1 is highest at parturition before declining rapidlyReference Xu 47 (hence showing an opposite trend with increasing infant serum IGF1 levels from birth to puberty), the effect of orally administered IGF1 on circulating IGF1 levels has been studied across many animal models. The presence of IGF1-receptors in the gastrointestinal tract (GIT) in piglets suggest luminal and parental actions of IGF1;Reference Van Ginneken, Van Haver, Oste and Weyns 48 indeed there is evidence in animal models that IGF1 can survive the digestive process in the GITReference Rao, Philipps, Williams, McCracken and Koldovsky 49 and may be absorbed into the general circulationReference Kimura, Murakawa, Ohno, Ohtani and Higaki 50 , Reference Xu and Wang 51 to cause increased serum IGF1 concentrations,Reference Baumrucker and Blum 52 which in turn enhance growth of selective tissues.Reference Kim, Ryu, Seo, Lee and Ko 53 However, other animal studies have shown that orally administered IGF1 is neither absorbed, nor has an effect on circulating serum IGF1 concentrations, BW, or other parameters in vivo.Reference Burrin, Davis, Fiorotto and Reeds 54 – Reference Donovan and Odle 56
A specialized form of mammalian breast milk is colostrum, secreted in the first few days post-parturition, containing a host of nutrient and non-nutrient compoundsReference Donovan and Odle 56 essential for offspring health and growth;Reference Widdowson, Colombo and Artavanis 57 , Reference Widdowson and Crabb 58 it has been shown that colostrum-fed piglets show a proportionally greater increase in skeletal muscle protein synthesis than in milk-fed piglets.Reference Burrin, Shulman, Reeds, Davis and Gravitt 59 In addition, the most abundant and well-characterized growth factor present in colostrum is IGF1,Reference Francis, Upton, Ballard, McNeil and Wallace 60 which starts out at high concentrations early in lactation before tapering off.Reference Donovan and Odle 56 The impact of colostrum on serum IGF1 concentrations has been studied in only a handful of studies. In calves, dietary bovine colostrum has been shown to increase serum IGF1 concentrations significantly more in than calves on milk-replacer or formula milk;Reference Blum and Baumrucker 61 this may be due to direct transportation of colostral IGF1 into the circulation. In athletes, bovine colostrum supplementation may increase serum IGF1 concentrations due to either direct absorption or enhanced stimulation of IGF1 synthesis.Reference Mero, Miikkulainen and Riski 62
Studies have shown that both human and bovine milk contains 1–25 ng/ml of IGF1.Reference Eriksson, Duc, Froesch and Zapf 63 With concerns surrounding formula milk and its associated obesity risk, alongside the role that IGF1 plays in infant growth, prospective milk formulation controlling for IGF1 levels could be beneficial. Therefore, this study aims to investigate the effect of formula milk with or without IGF1 or colostrum supplementation on growth and body composition in infant cynomolgus macaques in comparison with infants that receive breast milk. We expected increased weight, body length, and fat mass in infants fed with formula milk as compared with breast-fed infants. For infants supplemented with pure IGF1 we expected greater body length and less fat mass as compared with the infants fed with formula milk only. We included a group of infants fed with formula milk supplemented with bovine colostrum to explore its effect on growth and body composition.
Methods
Animals
Healthy male and female cynomolgus macaques (Macaca fascicularis) ranging in age from 5 to 6 years and with BWs of 2–4 kg were selected for this study. All animals were housed at the Non-Human Primate Centre of the Singapore Institute for Clinical Sciences at the SingHealth Experimental Medicine Centre (SEMC) in Singapore. SEMC is an Association for Assessment and Accreditation of Laboratory Animal Care (AAALAC) accredited facility. All animal protocols were approved in advance by the Institutional Animal Care and Use Committee (IACUC) of SingHealth (2012/SHS/764).
Breeding and parturition
In total, 24 females and eight males were bred over 6 months with two females to one male at any one time. The size of the cages used was 4270 mm (length) by 2440 mm (width) by 2440 mm (height), and were kept in a sheltered non-air-conditioned facility. Pregnancy was monitored via transabdominal ultrasonography once a month throughout gestation. Infants were grouped into four different groups of n=6 each, and with the following sex composition (Table 1): breast-fed (BF; four females, two males), formula-fed (F; three females, three males), formula-fed+IGF1 (F+IGF1; one female, five males), and formula-fed+bovine colostrum (F+BC; five females, one male). All infants were kept with their dams for the first 3 days; infants receiving formula milk were separated from their dams at day 4 and moved into a custom-built nursery in a sheltered non-air-conditioned facility. BF infants remained with their mothers, in paired groups, in the facility described above for the duration of the study.
Sex composition of treatment groups

Hand rearing of infant macaques
Initially, formula-fed infants were kept in pairs in an incubator (Rcom MX-BL500, Korea); temperatures were maintained at 27–31°C and humidity at ambient conditions (~70%). At the age of 2–4 weeks, infants were slowly introduced to, and eventually moved out into, group-housing of no more than six animals in small custom-built stainless steel nursery cages, sized at 1000 mm (length) by 520 mm (width) by 1700 mm (height). At the age of 8–16 weeks, infants were again introduced to and eventually moved out into group-housing of six to eight animals in three custom-built stainless steel gang cages, sized at 4270 mm (length) by 2440 mm (width) by 2440 mm (height). At 6 months of age, gates between the three gang cages were opened so that the monkeys could socialize in a larger colony in a larger play area (three times the size of a single gang cage). Throughout the hand-rearing stages, a custom-built stainless steel frame was draped with brown cotton cloth to create a surrogate mother for hand-reared infants to cling onto and drink from; these surrogates were kept with the infants for as long as they were willing to use them. Once moved into the cages, the monkeys were provided environmental enrichment in the form of manipulable objects, platforms at varying heights, swings, hammocks, and water pools.
Formula feeding of infant macaques
Infant macaques in F, F+IGF1, and F+BC were fed a nutritionally-complete human infant milk formula, in order to replicate the normal use of human infant milk formula. F+IGF1 infants were supplemented with 10 ng/ml of media grade human IGF1 (GroPep Bioreagents, Australia) in their formula milk daily. The human IGF1 peptide is identical to the macaque IGF1 peptide (data not shown), and the concentration was chosen based on our previous work on the average concentration of IGF1 in macaque breast milk (data not shown). F+BC infants were supplemented with 10.6% (w/w) bovine colostrum (Eshcol Pharmaceutical, Singapore) in their formula milk, which provides ~10 ng/ml of IGF1 in their formula milk daily. Following recommendations (Nutrient Requirements of Nonhuman Primates, 2nd edn, 2003), formula-fed infants were offered a total caloric intake of 200 kcal/kg/day in their first few days in the nursery, gradually increasing their intake over 4 weeks to 300 kcal/kg/day thereafter. Softened monkey chows and soft fruits were gradually introduced into their diet at 8 weeks of age. IGF1 and colostrum supplementation was stopped at 16 weeks of age, coinciding with weaning, where caloric intake from milk was gradually reduced and complete monkey chow and fruits were offered. At the age of 6 months, the monkeys were weaned completely off milk. All milk volumes consumed by the formula-fed infant macaques were recorded daily.
Monitoring of growth
Morphometric measurements and Dual Energy X-ray Absorptiometry (DXA) imaging were performed on all infant macaques every month from day 4 to 6 months old. Morphometric measurements of weight and crown rump length (CRL) were done using a weighing scale and measuring tape. DXA imaging procedures were performed in accordance with the manufacturer’s (Hologic Discovery DXA system, USA) default human infant whole body scan mode and analyses were performed using the built-in software.
Serum IGF1 quantification
A sample of 0.5 ml blood was collected via the femoral vein using a 23 G needle, from all infant macaques every month from day 4 to 6 months old. Blood was centrifuged at 3000 rcf for 30 min and serum was collected and subsequently stored in a −80°C freezer. Serum IGF1 levels were quantified with the IGFBP-blocked IGF1 ELISA kit (specific for human IGF1; Alpco 22-IGFHU-E01, USA) in accordance with the manufacturer’s protocol.
Statistical analysis
All data were rank transformed and analyzed with analysis of variance (ANOVA) or analysis of covariance (ANCOVA).Reference Conover 64 Differences in total milk consumption during the period of bottle feeding between groups F, F+IGF1, and F+BC were analyzed with ANOVA with sex as a covariate. ANCOVA was used to determine significant mean differences in growth parameters at 4 and 6 months of age, with sex and the corresponding values at birth from day 1 (for weight and CRL) or 4 [for serum IGF1 concentration, fat, fat-free mass, bone mineral density (BMD)] as covariates for adjustment. Time points with significant differences in mean values as revealed by ANCOVA were analyzed by multiple comparisons with Bonferroni correction. The Statistical Package for the Social Sciences (SPSS, Chicago, IL, USA) was used for all statistical analyses, and the level of statistical significance was set at P<0.05.
Results
In total, 24 infants were divided into four groups with respect to milk source and milk supplementation for the first 4 months of life: breast-fed (BF) infants, infants formula-fed without supplementation (F), infants formula-fed with purified IGF1 supplementation (F+IGF1), and infants formula-fed with bovine colostrum supplementation (F+BC). The calculated nutrient compositions of the unsupplemented and supplemented milk formulas are given in Table 2. The sex composition is displayed in Table 1. After 4 months, infant formula supplementation was stopped. In addition to the measurement of mean daily milk consumption for the first 4 months of life, various other measurements (morphometric measurements, body composition, and serum IGF1 levels) were taken after birth and every month thereafter until the age of 6 months.
Estimated nutrient profiles of formula milk with and without supplements, and of mature Rhesus milk
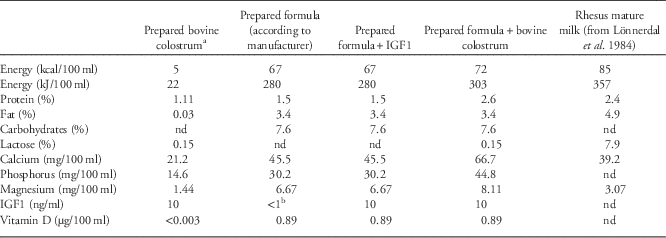
a These values are provided as reference only since reconstituted bovine colostrum on its own was not used in the study. Energy content was calculated. Please see supplementary Table 1 for more details.
b Not detectable with our ELISA with a lower detection limit of 1 ng/ml.
Mean daily milk consumption
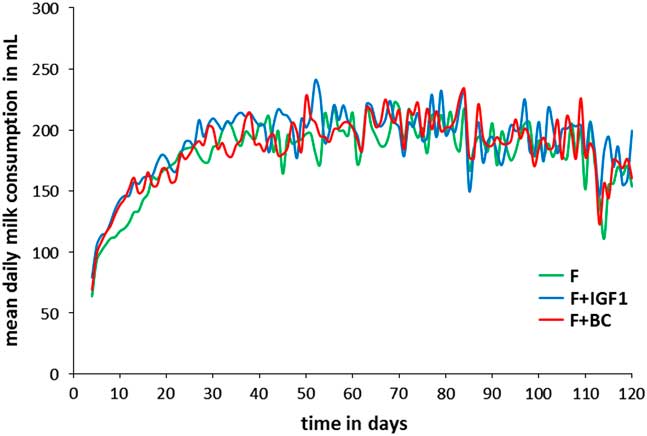
The mean daily milk consumption for infants in F, F+IGF1, and F+BC ranged from 63 to 241 ml during the first 4 to 120 days of their lives (Fig. 1). There was no significant difference in the total milk volume consumed between the three groups during the period of bottle feeding.
Mean daily milk consumption of infant macaques in F (green), F+IGF1 (blue), and F+BC (red) from day 4 to day 120.
Serum IGF1 concentration
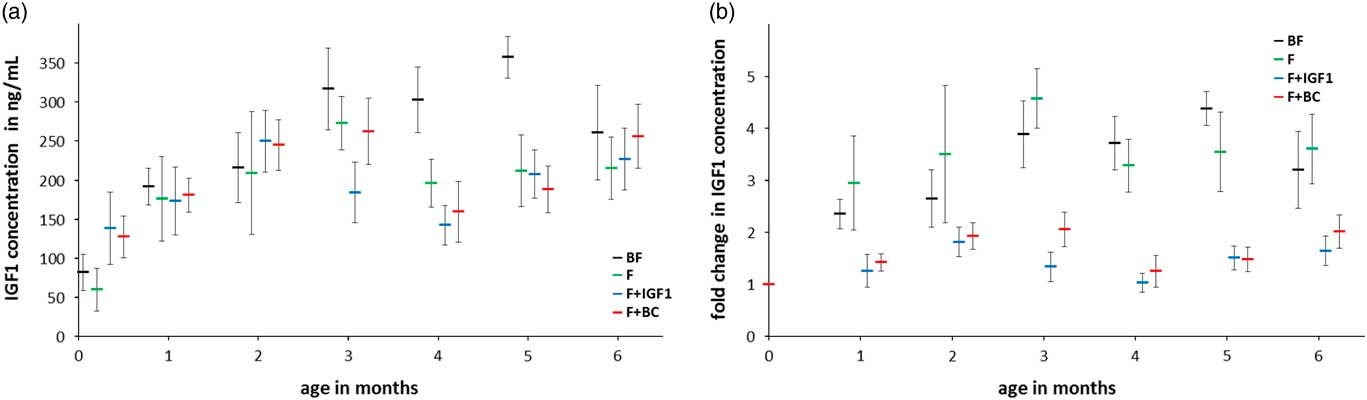
ANCOVA detected a mean difference in total serum IGF1 levels between groups at 4 months but not at 6 months of age (Fig. 2a; ANCOVA 4 months: F 3,18=4.241, P=0.020; 6 months: F 3,18=0.340, P=0.797; Fig. 2b shows the corresponding fold change with respect to day 4). BF infants had significantly higher serum IGF1 levels than infants of the F+IGF1 group (4 months: P=0.024), with no differences between other pairs of groups.
Six months serum IGF1 concentration in BF (black), F (green), F+IGF1 (blue), F+BC (red) groups. (a) Mean serum IGF1 concentration; (b) fold change in serum IGF1 concentration with respect to the mean serum IGF1 concentration at day 4. All error bars denote s.e.m. Note that data labels for each time point have been spread for clarity.
Morphometric measurements
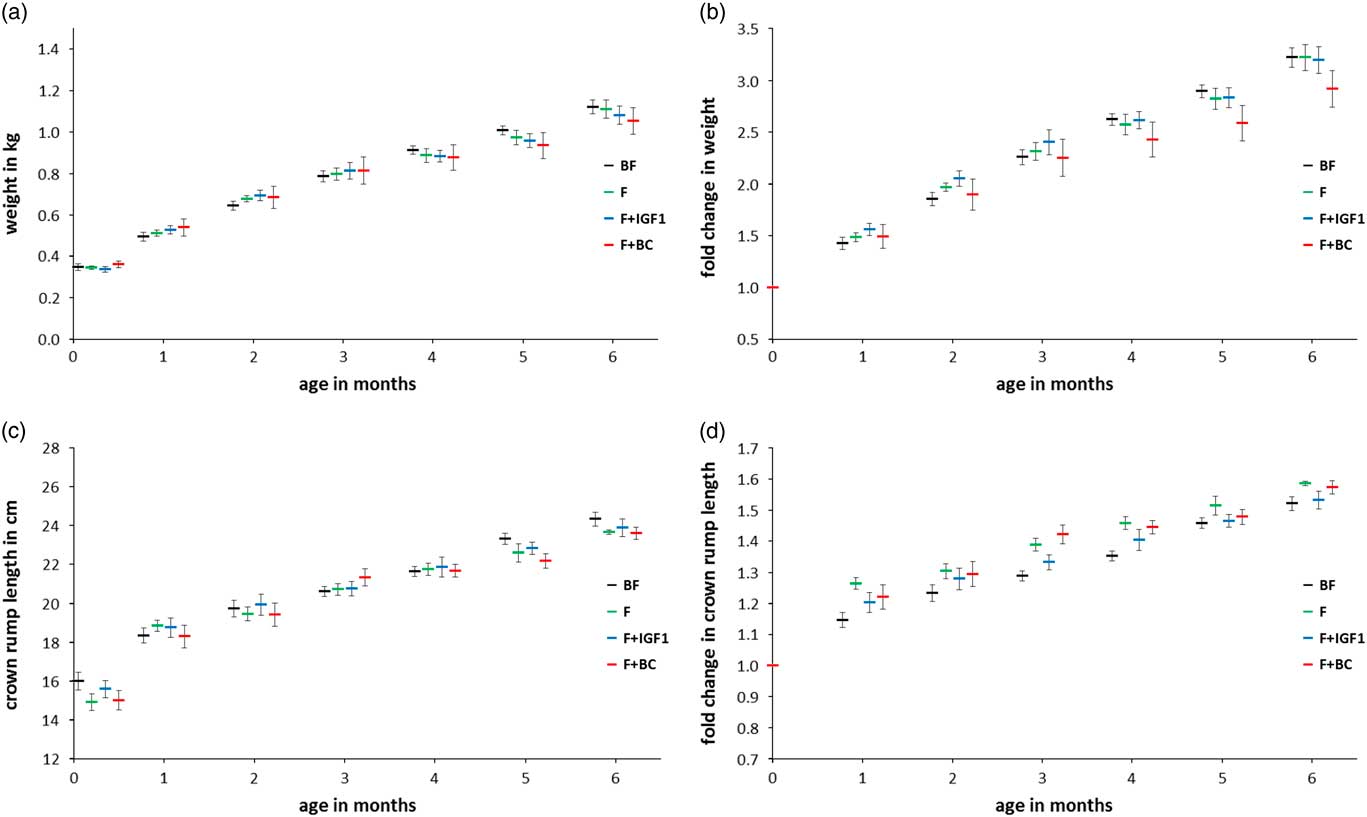
The mean weights and CRL of all infants were examined (Fig. 3a and 3b) and the fold change values with respect to the values at day 1 (Fig. 3c and 3d) were plotted. No significant differences were observed in both the average weight (Fig. 3a) and CRL (Fig. 3c) across groups at 4 and 6 months of age. This suggests that infants of all groups followed a normal growth trajectory.
Six months anthropometric measurements in BF (black), F (green), F+IGF1 (blue), F+BC (red) groups. (a) Mean weight; (b) fold change in weight with respect to the mean weight at birth; (c) mean crown rump length; (d) fold change in crown rump length with respect to the mean crown rump length at birth. All error bars denote s.e.m. Note that data labels for each time point have been spread for clarity.
Body composition
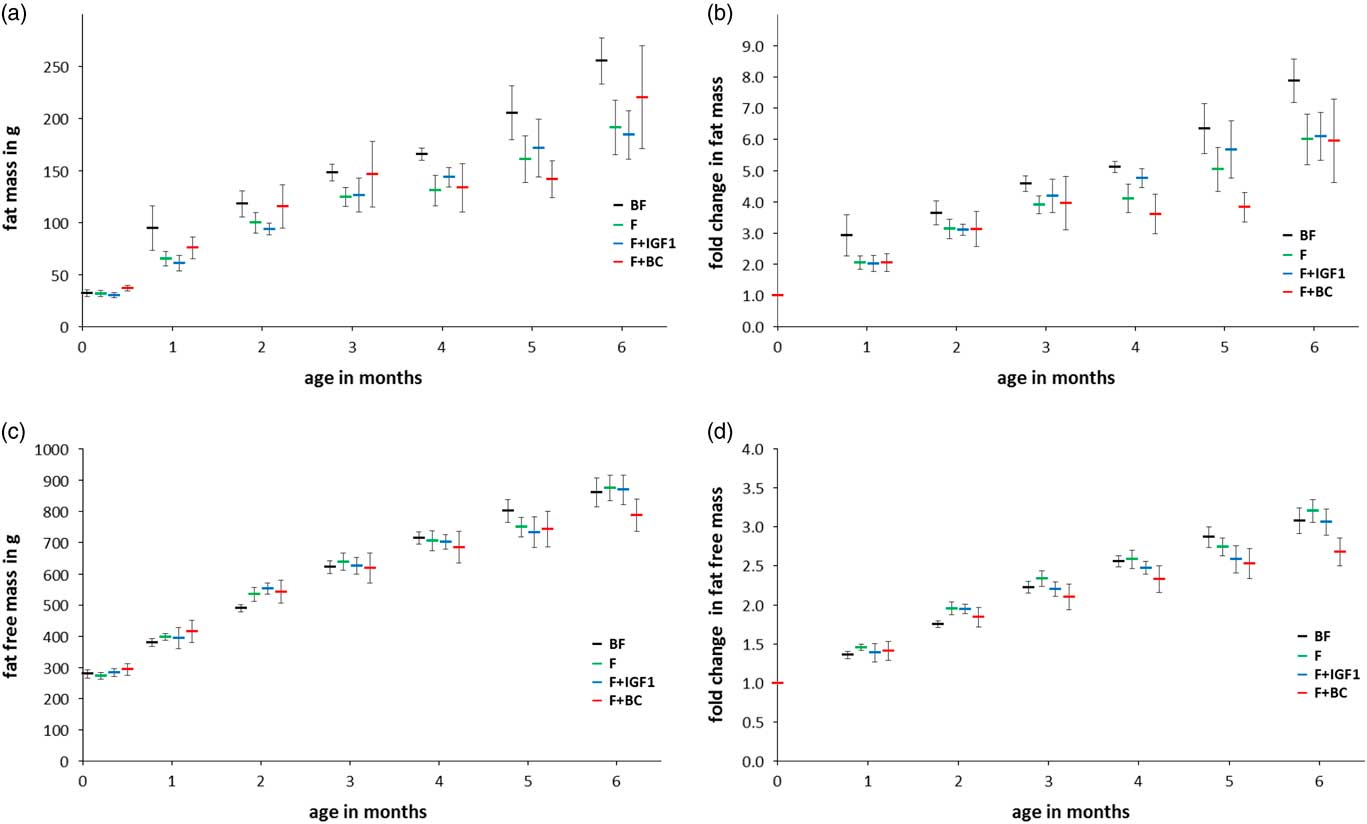
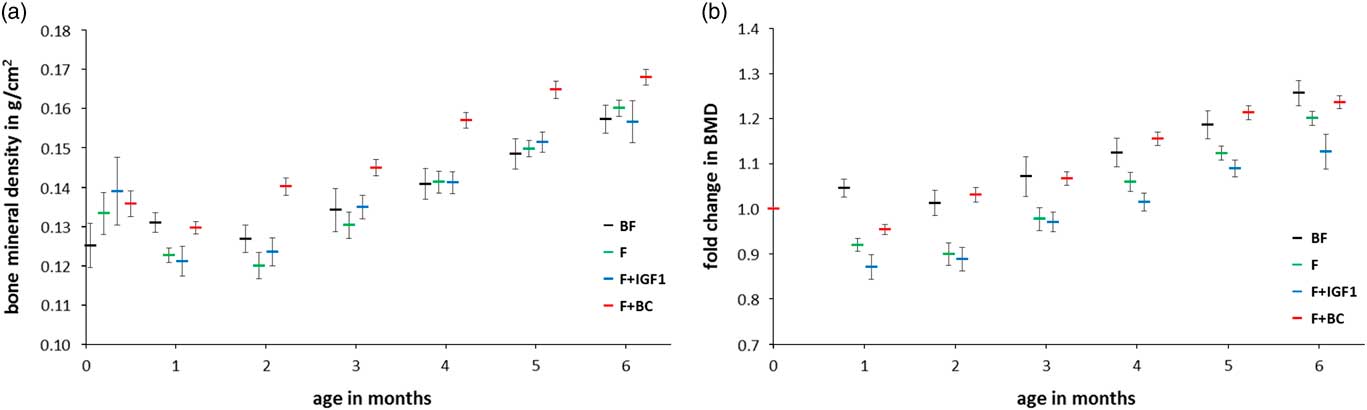
The same statistical analyses were performed after measurement of the amount of fat and fat-free mass in the body of the infant macaques (Fig. 4). No significant differences in fat mass (Fig. 4a and 4b) and fat-free mass (Fig. 4c and 4d) were detected. BMD was significantly different between groups at the age of 4 months but not at 6 months of age (Fig. 5a; ANCOVA: 4 months, F 3,18=6.916, P=0.003; 6 months, F 3,18=1.872, P=0.170; Fig. 5b shows the corresponding fold change with respect to day 4). Infants of the F+BC group had a higher mean BMD at 4 months of feeding as compared with the BF (P=0.012), F (P=0.011) and F+IGF1 (P=0.006) groups. The differences between other pairs of groups were not significant.
Six months fat and fat-free mass measurements in BF (black), F (green), F+IGF1 (blue), F+BC (red) groups. (a) Mean fat mass; (b) fold change in fat mass with respect to the mean fat mass at day 4; (c) mean fat-free mass; (d) fold change in fat-free mass with respect to the mean fat-free mass at day 4. All error bars denote s.e.m. Note that data labels for each time point have been spread for clarity.
Six months bone mineral density measurements in BF (black), F (green), F+IGF1 (blue), F+BC (red) groups. (a) Mean bone mineral density; (b) fold change in bone mineral density with respect to the mean bone mineral density at day 4. All error bars denote s.e.m. Note that data labels for each time point have been spread for clarity.
Discussion
The objective of this study was to investigate the different effects of breast milk, formula milk, and formula milk supplemented with different sources of IGF1 (a purified human form or in bovine colostrum), on different growth measures and serum IGF1 concentrations of infant cynomolgus macaques. There are several limitations in our study and they need to be kept in mind when drawing conclusions from the data. First, as it would have been virtually impossible to feed breast-fed infants with breast milk without contact to their mothers, breast-fed infants were treated differently from formula-fed infants, whereby the latter were transferred to an artificial surrogate while the former were maintained with their dams. Therefore, we were unable to control and account for any metabolic effect that mother contact and nursing could have had on the infants in the breast-fed group. In addition, we do not have measurements to estimate milk intake for the BF group and hence, are unable to compare its macronutrient and energy consumption with the other groups. Results from Hinde et al.Reference Hinde, Power and Oftedal 65 indicate that for Rhesus macaques, the total volume of breast milk produced (and therefore probably ingested) is more important for infant growth and weight than its energy density. Similarly, we did not measure IGF1 intake in the BF group. IGF1 concentration of breast milk is highest at parturition before declining quickly partly because of increased water content. This is accompanied by an increase in milk consumption so that total IGF1 intake depends on both its concentration in the milk as well as volume ingested. For groups F, F+IGF1, and F+BC IGF1 concentration in the milk was kept constant and total IGF1 intake depended only on milk volume ingested which overall, did not differ between groups. Second, as shown in Table 2, protein, fat, carbohydrate, and energy content are higher in Rhesus milkReference Lonnerdal, Keen, Glazier and Anderson 66 (here used as a surrogate for cynomolgus milk) as compared with the formula milk used in our study. Therefore, the cynomolgus neonates of groups F and F+IGF1 had to adapt to a less protein, fat, carbohydrate, and energy dense milk as compared with group BF while the F+BC group had to adapt to milk with less fat, carbohydrates, and energy as compared to BF because the supplementation provided some additional protein and lactose. This also highlights the difference between the F and F+IGF1 groups on the one hand and the F+BC group on the other hand (see Table 2). Further differences in milk composition are listed in Table 2 (see also Supplementary Table 1). There are also temporal changes to the composition of breast milk in non-human primatesReference Hinde, Power and Oftedal 65 , Reference Laudenslager, Natvig, Cantwell, Neville and Reite 67 which were not replicated in our study. In Rhesus macaques for example, fat and protein concentrations (and energy density) are higher in milk for 3–4-month-old infants as compared with milk for 1-month-old infants.Reference Hinde, Power and Oftedal 65 These differences in milk composition further complicate comparison of the BF group with the formula-fed groups whose milk was not adjusted for age. The formula-fed infants might have been able to compensate for such differences by adjusting total milk volume intake. Third, the group size is small (n=6 for each group) and the sex composition is different between groups. Consequently, detection of statistical significant results is limited, but means adjusted for sex have been used for comparisons. Finally, due to the short duration of the study, we were not able to investigate the long-term effects of formula feeding (with and without supplementation), which would be of interest and importance to the scientific community and the public.
This study was unable to replicate significant differences in weight between breast-fed and formula-fed groups, unlike previously reported studies;Reference Heinig, Nommsen, Peerson, Lonnerdal and Dewey 24 , Reference Ong, Langkamp and Ranke 25 , Reference Baker, Michaelsen, Rasmussen and Sorensen 68 , Reference Dewey 69 however, the lack of weight differences between infants that received formula milk (with or without supplementation) supports observations that orally ingested IGF1 does not have an effect on BW.Reference Houle, Schroeder, Odle and Donovan 70 , Reference Ma and Xu 71 In addition, it is likely that neither the differences between breast milk and formula milk nor IGF1 plays an important role in CRL in this model, as the presence or absence of either in the three formula-fed groups before and after 4 months of age did not make a difference in the groups’ mean CRLs. Similarly there were no differences between groups for fat mass and fat-free mass.
Interestingly, we detected a significant difference in BMD at 4 months of age between groups. F+BC infants displayed greater BMD as compared with all other groups; this suggests that colostral supplementation of formula milk appears to increase BMD in formula-fed infants to levels similar or possibly higher than the levels found in breast-fed infants. No differences were detected between the BF group and the F and F+IGF1 group, respectively. Interestingly, a recent study reported that duration of breast feeding was positively associated with BMD at 17 years of age.Reference Molgaard, Larnkjaer, Mark and Michaelsen 72 Our results raise the question whether colostral supplementation could be used to increase BMD in infants that receive formula milk or in pre-term infants who are more prone to a lower BMD than full-term infantsReference Wood, Stenson and Embleton 73 in order to achieve sustained BMD comparable to the levels found in adolescents that were breast-fed. A longer follow up of the development of BMD in our animals would have been necessary to answer this question. Furthermore, IGF1 is known to increase long-bone growth,Reference Liu and LeRoith 30 , Reference Liu, Baker, Perkins, Robertson and Efstratiadis 32 – Reference van der Eerden, Karperien and Wit 34 an effect which is not seen in F+BC infants demonstrating greater BMD than F infants despite having a lower serum IGF1 concentration, nor in the lack of differences between F and F+IGF1 infants. Therefore, it is likely then that compounds in colostrum other than IGF1 are responsible for the effect on BMD seen here. As shown in Table 2, bovine colostrum provides extra calcium, phosphorus, and magnesium, micronutrients that are known to positively influence bone health. Supplementary Table 1 lists additional components of bovine colostrum, besides others vitamins and growth factors that could have affected BMD.
BF infants had a significantly higher mean serum IGF1 level than F+IGF1 infants after 4 months of feeding. This finding could suggests that IGF1 supplementation was possibly acting through a negative feedback loop on serum IGF1 to decrease its levels in F+IGF1 infants. This corresponds to findings where intravenous infusion of high doses of IGF1 into fetal sheep reduced IGF1 mRNA levels in the liver, the primary site of IGF1 synthesis in humans, indicative of a negative feedback loop.Reference Kind, Owens and Lok 74 Similar results were obtained when GH deficient rats were treated with IGF1.Reference Butler, Ambler and Breier 75 , Reference Gluckman and Butler 76 However, the lack of a statistically significant difference in IGF1 levels between the F group, F+IGF1 group, and F+BC group does not support an adjustment via a negative feedback loop, although the fold change in IGF1 levels across the 6-month period of the study is greater for F infants than that for the F+IGF1 and F+BC infants, respectively. Moreover, it is uncertain if orally consumed IGF1 in human purified or bovine colostrum form would be absorbed.Reference Vacher, Bestetti and Blum 77 The difference in milk protein content consumed between groups might also have played a role in the regulation of IGF1 serum levels in our study. These findings are in contrast to studies demonstrating the positive correlation between dietary bovine colostrum supplementation and serum IGF1 concentrations.Reference Mero, Miikkulainen and Riski 62
Comparing only BF infants to F infants, fat mass, fat-free mass, weight, CRL, and BMD between BF and F infants remained similar. These results are not in agreement with previous studies where formula-fed infants showed greater gains in weight, length, and adiposity than their breast-fed counterparts between the ages of 3 and 12 months.Reference Ong, Langkamp and Ranke 25 , Reference Gale, Logan and Santhakumaran 78 IGF1 concentrations were not different between F infants and BF infants after 4 and 6 months, in contrast to previous studies where infants on breast milk would possess lower IGF1 concentrations.Reference Ong, Langkamp and Ranke 25 Furthermore, previous studies have shown correlations between serum IGF1 concentrations and BMI, length, and adiposity,Reference Ong, Langkamp and Ranke 25 results which could not be replicated here due to the inability to control for caloric intake via breast milk in this study. The increased IGF1 concentrations in BF infants could be due to a higher protein intake.Reference Hoppe, Udam and Lauritzen 43 Alternatively, other mechanisms may be responsible for gains in BW and adiposity.Reference Ong, Langkamp and Ranke 25
In conclusion, supplementation of bovine colostrum in formula milk can result in BMD that is higher than that of infants fed with standard formula milk in a cynomolgus macaque model of early human development.
Acknowledgments
The authors thank the staff of the Non-Human Primate Centre of the Singapore Institute for Clinical Sciences for all their help with the care of these animals. The authors also thank Varsha Gupta (Singapore Institute for Clinical Sciences) for statistical advice and Mary Chong (Singapore Institute for Clinical Sciences) for comments on the revised manuscript.
Financial Support
This research was supported by the Singapore National Research Foundation under its Translational and Clinical Research (TCR) Flagship Programme and administered by the Singapore Ministry of Health’s National Medical Research Council (NMRC), Singapore – NMRC/TCR/004-NUS/2008; NMRC/TCR/012-NUHS/2014. Additional funding was provided by the Singapore Institute for Clinical Sciences, Agency for Science Technology and Research (A*STAR), Singapore. The funders had no role in study design, data collection and analysis, decision to publish, or preparation of the manuscript.
Conflicts of Interest
None.
Ethical Standards
The authors assert that all procedures contributing to this work comply with the ethical standards of the relevant national guides on the care and use of laboratory animals [Guidelines on the Care and Use of Animals for Scientific Purposes set by the National Advisory Committee for Laboratory Animal Research (NACLAR) of Singapore] and have been approved by the institutional committee (Institutional Animal Care and Use Committee of SingHealth).
Supplementary material
To view supplementary material for this article, please visit https://doi.org/10.1017/S2040174417000812



