I. INTRODUCTION
Alpha-phase iron(III) oxide (hematite, α-Fe2O3) is a semiconductor possessing characteristics necessary for application in efficient and scalable solar energy conversion devices. For instance, α-Fe2O3 is an attractive photoanode material in a photoelectrochemical (PEC) cell for water splitting application as it offers the most obvious advantage: smaller band gap of 2.2 eV which corresponds to the utilization of 40% of solar irradiation for electron–hole pairs formation. When electron–hole pairs are formed the chemical equilibrium in the PEC cell is disturbed, a photovoltage that gives rise to a photocurrent will be developed. The photocurrent can be measured and the circuit of electrons is completed by electrons transfer process at the cathode|electrolyte interface. Here, hydrogen is producedReference Barroso, Pendlebury, Cowan and Durrant1 and can be collected. At anode, holes are transferred forming oxygen gas.
In competition with charge transfer process is electron and hole recombination. Recombination rapidly diminishes free carriers reducing the photon conversion efficiency hence diffusion of carriers like holes for instance to the electrode|electrolyte interface must be as rapid as possible. It is however known that α-Fe2O3 has a short hole diffusion length (∼2–4 nm) consequently most holes are recombined with free electrons before they can be successfully transferred out.Reference Kennedy and Frese2 Obviously this reduces the solar to hydrogen conversion efficiency of the photoanode as much of the electrons are now recombined with free holes before they are successfully transferred at the cathode to generate hydrogen. Exploiting ordered nanoporous film with pore wall thickness to be as thin as possible has been proposed to overcome these problems as opposed to the use of flat planar film. Within the nanoporous film, holes will only have to travel smaller distance to reach to the electrode|electrolyte interface.Reference Shen3 Moreover, such nanostructure posses higher surface area hence more contact with the electrolyte resulting in larger electrode|electrolyte contact area.
Once holes are successfully being transferred at the electrode|electrolyte interface, electrons can then travel along the long axis of the pore wall towards the back contact to give decent photocurrent then to be transferred at the cathode|electrolyte junction for hydrogen formation. To further reduce scattering of the photoelectrons, a highly crystalline film is desired as it will allow direct and rapid charge transport, and then reduce scattering and recombination.Reference Nishikiori, Qian, El-Sayed, Tanaka and Fujii4
Nanoporous α-Fe2O3 film can be prepared by a polymer precursor methodReference Uekawa and Kaneko5 and more recently by anodic oxidation of iron (Fe).Reference Albu, Ghicov and Schmuki6–Reference Prakasam, Varghese, Paulose, Mor and Grimes10 The latter is more effective for preparing nanoporous α-Fe2O3 film with aligned and perpendicular pores; uniformly sized, rather thin pores wall and equally spaced. In anodic process for nanoporous anodic film formation, electrolyte is the most important parameter: its composition as well as its temperature.Reference Prakasam, Varghese, Paulose, Mor and Grimes10,Reference Cheng, Zheng, Tsang, Zhang, Wang, Dong, Li, Liang, Zapien and Li11 For the formation of ordered nanopores, fluoride ions are routinely added to the electrolyte [which is often organic like ethylene glycol (EG)], without fluoride, the anodic film is compact.
Despite the success in nanostructuring; anodic layer formed on iron by anodization is hydrated, consisted of amorphous film and fluoride rich-phases such as FeF2 which are not photoactive and will affect the transport properties of carriers.Reference Prakasam, Varghese, Paulose, Mor and Grimes10,Reference Zhang, Hossain and Takahashi12,Reference Rozana, Azhar, Anwar, Kawamura, Khairunisak, Matsuda and Lockman13 These undesirable phases can be removed by annealing the as-anodized iron at high temperature. However with annealing comes another issue which is thermal oxidation of the underlying iron foil. Moreover, diffusion of iron ions from the iron substrate outwards will lead to grain growth, which diminishes the porous structure. Annealing can indeed induce the crystallization of α-Fe2O3 which is desirable as the oxide is photoactive but there is also a possibility of barrier layer thickening via the formation of inner oxides like magnetite (Fe3O4) as well as FeO.Reference Schwertmann and Cornell14 Both oxides are not wanted as they are not photoactive and rather poor electronic conductor but at high temperature they are inevitable. Depending on the annealing temperature; Fe3O4 and/or FeO will form underneath the surface α-Fe2O3 and their presence may hinder the flow of photocurrent to the back contact hence reducing the efficiency of solar to hydrogen conversion. A method to reduce their formation is therefore desired. Annealing the as-anodized iron in a rather inert atmosphere may help in reducing the oxidation and in this present work, we investigated on the effect of annealing of the as-anodized iron in nitrogen at various temperatures in an effort to induce crystallization of α-Fe2O3, removing fluoride and hydrated phases but to avoid the thickening of the barrier layer.
Previous reports on utilization of air as annealing atmosphere of anodized iron foil show low photocurrent values. For instance, Lee et al. reported on photocurrent of 0.25 mA/cm2 at 0.39 V versus Ag/AgCl in 1 M KOH (100 mW/cm2, AM 1.5) for air-annealed nanoporous film with a thickness of ∼0.2 µm.Reference Lee, Wang, Kado, Killian and Schmuki15 Similarly in our previous report, a photocurrent of 0.33 mA/cm2 at 0.39 V versus Ag/AgCl was reported utilizing an anodic nanoporous photoanode with a thickness of ∼1.8 µm annealed in air at 450 °C for 3 h.Reference Rozana, Azhar, Anwar, Kawamura, Khairunisak, Matsuda and Lockman13 The relatively low photocurrent values may be attributed to the above mentioned problems: oxidation of iron during annealing, thickening of barrier layer and Fe3O4 and/or FeO formation. In this present work, we investigated on the formation of the nanoporous iron oxide and on the effect of nitrogen annealing to the properties of the nanoporous oxide and on the photocurrent response when the oxide film was illuminated.
II. MATERIALS AND METHODS
0.2 mm thick, 10 × 10 mm2 iron foil (99.99%, Nilaco Corp., Tokyo, Japan) was used in this anodization experiment. The foil was first ultrasonically degreased in acetone for 3 min and ethanol for 3 min, rinsed with deionized water, and dried in a nitrogen stream. Anodization was carried out using a two-electrode system at room temperature, with an iron foil anode and platinum rod cathode separated by 30 mm. Anodization was carried out using a DC power source (GW Instek, GPS 4303; Good Will Instrument Co. Ltd., New Taipei City, Taiwan), for 15 min at a constant 50 V. The electrolyte consisted of 0.35 wt% ammonium fluoride (NH4F, Merck, Darmstadt, Germany) and 2.7 wt% deionized water (H2O, Advantec Aquarius RFD 230 NA, Minato, Japan) in EG (C2H6O2, Merck). After anodization, the sample was rinsed in acetone, ethanol, and deionized water, and then dried in nitrogen. Anodized samples were then annealed in a tube furnace (Model R40/500/12-B170, Nabertherm, Lilienthal, Germany) under nitrogen flow at 300, 450, 500, 600, and 900 °C for 2 h. Annealing in air was also done for comparison.
The surface and cross-sections of fractured anodic film were studied by field-emission scanning electron microscopy (FESEM; Variable Pressure Zeiss Supra 35, Carl Zeiss, Oberkochen, Germany). High-resolution transmission electron microscopy (HRTEM; JEM-2100F, JEOL Ltd., Tokyo, Japan) at an accelerating voltage of 200 kV was used to investigate morphologies. X-ray diffraction (XRD; Bruker D8, Bruker GmBH, Karlsruhe, Germany) with monochromatic Cu Kα radiation was used to investigate crystallinities. Raman spectra were recorded using a JASCO NRS-3100 spectrometer (JASCO Inc., Tokyo, Japan) in ambient air. A 532 nm green laser was focused on the sample using a 20× objective lens.
Photocurrent versus voltage characteristics of the anodized iron foils (surface area ∼1 cm2) were recorded by scanning the potential from −0.1 to +0.5 V (versus Ag/AgCl) at 10 mV/s, using a potentiostat (μAutolab III, Metrohm, the Netherlands). The measurement was done using a three-electrode system, with Pt rod counter electrode and Ag/AgCl reference electrode in solutions containing 1 M NaOH. A xenon light source (LSP-X150, Zolix Instruments, Beijing, China) with an intensity of 100 mW/cm2 was used as solar simulator (AM 1.5) to irradiate the annealed foil. The UV–visible absorbance spectra of the sample were measured using UV–Vis spectrophotometer (JASCO, V-560).
III. RESULTS AND DISCUSSION
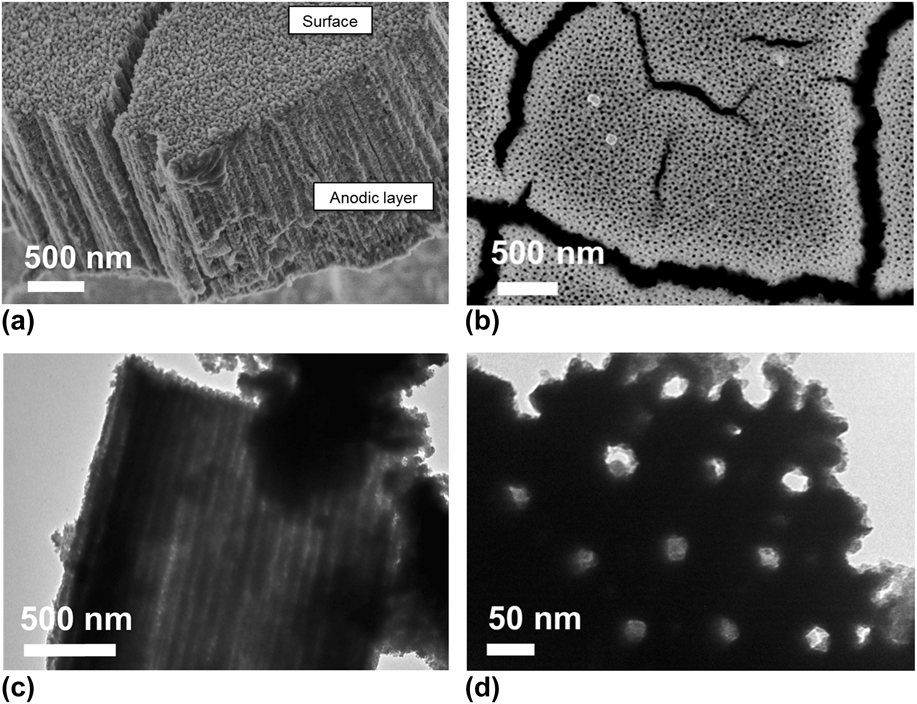
Anodization of iron in an EG electrolyte containing F− produces an anodic layer consisted of highly ordered vertically aligned elongated nanopores, as shown in the FESEM image of the film cross-section in Fig. 1(a). The morphology of the film surface is shown in Fig. 1(b). Elongated pores form channels within the layer, as shown by the transmission electron microscopy (TEM) image in Fig. 1(c). The length of the pores corresponds to the thickness of the anodic layer, and is measured to be ∼1.8 µm. The TEM image in Fig. 1(d) shows that the regular cylindrical pores have diameters of ∼30 nm.
FESEM images of iron oxide film prepared by anodizing iron at 50 V for 15 min in EG containing 0.35 wt% NH4F: (a) film cross-section, (b) film surface and TEM images showing (c) the pore channels and (d) the ordered pores.

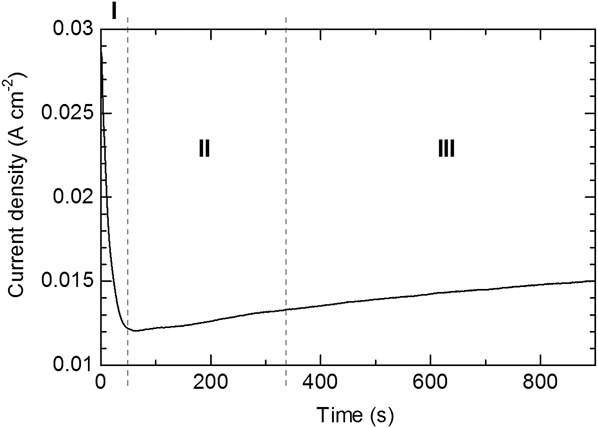
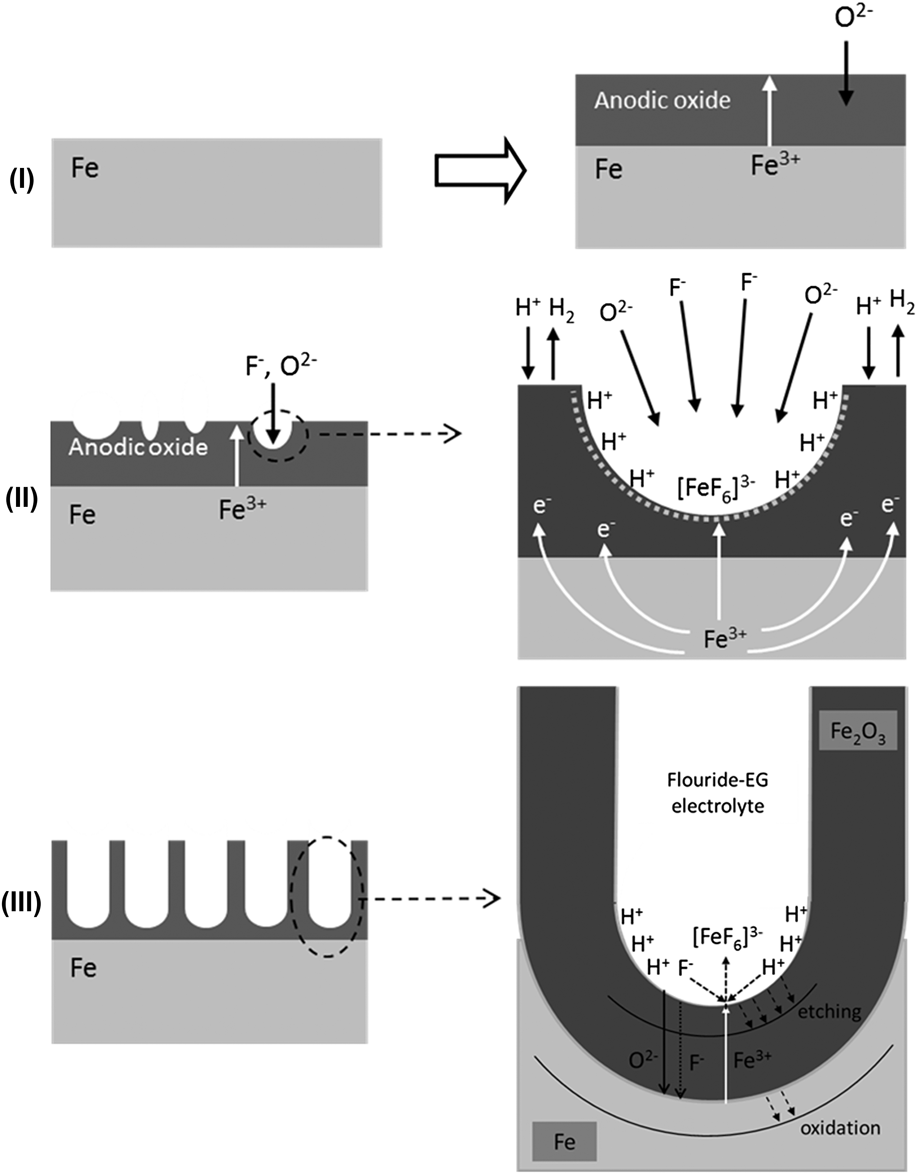
Current density versus time measurements were used to understand the formation of the nanoporous structure, and the resulting curve is shown in Fig. 2. Proposed stages during anodization are shown schematically in Fig. 3. The initial decay in current density [Fig. 2, region (I)] can be explained by the oxidation of the bare iron surface [Fig. 3, step (I)], with the electrolyte forming a thin iron oxide layer. An anodic layer is formed in buffer solution from the rearrangement of oxygen and iron ions, which may be Fe3O4 [Eq. (1)] as proposed by previous authors like Nagayama et al.Reference Nagayama and Cohen16 As oxidation proceeds, the outer part of Fe3O4 is converted to γ-Fe2O3 [Eq. (2)]. It is also possible to achieve oxidation through [Eq. (3)], where γ-Fe2O3 formed as the main component of the anodic layer. Similar reactions are thought to occur in the current H2O-EG electrolyte, forming a barrier layer on the iron surface as shown in Fig. 3, step (II). Further oxidation of γ-Fe2O3 may form a cation vacancy structure.Reference Nagayama and Cohen16 Eventually γ-Fe2O3 will transform to the more stable phase of iron oxide α-Fe2O3.
 $${\rm{3Fe}}\,{\rm{ + }}\,{\rm{4 }}{{\rm{H}}_{\rm{2}}}{\rm{O}} \to {\rm{F}}{{\rm{e}}_{\rm{3}}}{{\rm{O}}_{\rm{4}}}\,{\rm{ + }}\,{\rm{8}}{{\rm{H}}^{\rm{ + }}}\,{\rm{ + }}\,{\rm{8}}{{\rm{e}}^ - }$$
 $$2{\rm{F}}{{\rm{e}}_3}{{\rm{O}}_{\rm{4}}}\,{\rm{ + }}\,{{\rm{H}}_{\rm{2}}}{\rm{O}}\, \to \,3\gamma {\rm{ - F}}{{\rm{e}}_{\rm{2}}}{{\rm{O}}_{\rm{3}}}\,{\rm{ + }}\,{\rm{2}}{{\rm{H}}^{\rm{ + }}}\, + \,{\rm{6}}{{\rm{e}}^ - }$$
 $$2{\rm{Fe}}\,{\rm{ + }}\,3{{\rm{H}}_{\rm{2}}}{\rm{O}}\, \to \,\gamma {\rm{ - F}}{{\rm{e}}_{\rm{2}}}{{\rm{O}}_{\rm{3}}}\,{\rm{ + }}\,{\rm{6}}{{\rm{H}}^{\rm{ + }}}\, + \,{\rm{6}}{{\rm{e}}^ - }$$
Current density–time curve during the anodization of iron at 50 V for 15 min in electrolyte containing 0.35 wt% NH4F.
Stages in the formation of the nanoporous oxide film on iron by anodization process in fluoride-EG electrolyte.
Growth of the anodic layer proceeds by the inward migration of anions to the iron|iron oxide interface, or outward migration of cations, via anion or cation vacancies, respectively [Fig. 3, step (II)]. The migration of ions is determined by the field within the anodic layer, and largely depends on the applied voltage and migration paths (i.e., the generation and concentration of defects such as vacancies). The barrier layer is susceptible to dielectric breakdown and chemical etching or pitting due to F−.Reference Szklarska-Smialowska17,Reference Regonini, Bowen, Jaroenworaluck and Stevens18 Pits form randomly throughout the surface of the anodic layer, as shown in Fig. 3, step (II). The current slightly increases upon breakdown of the barrier layer, indicated by region (II) in Fig. 2.
During pitting, the presence of water in the electrolyte aids the dissolution of the oxide, forming an aquo complex. F− migrates inward to maintain charge neutrality within pits, which increases the local F− concentration.Reference Schmuki19 This leads to dissolution of the barrier layer, exposing the bare metal surface; however, the bare metal surface continuously oxidizes because of the applied anodic potential and in the presence of H2O, oxide forms. This process is accompanied by the release of H+, and therefore an increase in the local H+ concentration [Eqs. (1)–(3)]. The high concentration of F− and H+ within pits leads to rapid dissolution of the growing oxide thus the formation and growth of pores [Eq. (4)]. This is illustrated in Fig. 3, step (II). Complexation of Fe3+ with the F− species in the solution can also be expected to produce the initial pores.
 $${\rm{F}}{{\rm{e}}_2}{{\rm{O}}_{\rm{3}}}\,{\rm{ + }}\,12{{\rm{F}}^ - }\,{\rm{ + }}\,6{{\rm{H}}^{\rm{ + }}}\, \to \,{\rm{\ 2}}{\left[ {{\rm{Fe}}{{\rm{F}}_{\rm{6}}}} \right]^{{\rm{3}} - }}\, + \,3{{\rm{H}}_{\rm{2}}}{\rm{O}}$$
The porosification of iron oxide can therefore be thought of as autocatalytic, whereby initial dissolution initiates further dissolution at the electrolyte|oxide interface within pits. This process deepens and enlarges the pits, forming the stable pores shown in Fig. 3, step (III). The active dissolution front is at the electrolyte|oxide interface at the bottom of the pores, so pores grow inward and become elongated. This process is independent of those occurring at the oxide surface, in which dissolution and/or deposition can occur. The formation of the nanopores is time-dependent, so longer anodization duration deepens the pores (Fig. 3). However, dissolution can occur at the surface because the electrolyte used is rather corrosive [Eq. (4)]. Mild dissolution at the entrances to pores is however required to reveal the pores, and surface etching is sufficient to achieve this in the fluoride-EG electrolyte used.
The FESEM images in Fig. 1 show that the pore size is uniform. Pores can be classified as weak or strong pores.Reference Yasuda, Macak, Berger, Ghicov and Schmuki20 Significant H+ is produced in strong pores, but a lesser amount is produced in weak pores, so their growth rate slows. Weak pores eventually stop growing, because the neighboring metal has already been oxidized by strong pores, which results in the uniform pore size.
Anodic iron oxide is amorphousReference Prakasam, Varghese, Paulose, Mor and Grimes10,Reference Zhang, Hossain and Takahashi12 and may contain a small amount of fluoride phases like FeF2.Reference Albu, Ghicov and Schmuki6,Reference Rozana, Azhar, Anwar, Kawamura, Khairunisak, Matsuda and Lockman13 For instance, Konno et al. suggested that anodic film is amorphous, hydrated, and highly contaminated with fluoride as well as carbon species.Reference Konno, Tsuji, Skeldon, Thompson and Habazaki9 Fluoride or carbon (from EG used) species can be removed by annealing the anodic oxide at high temperature. Moreover, annealing induces crystallization of the oxide and may transform γ-Fe2O3 and hydrated phases to the photoactive α-Fe2O3 phase. Crystalline α-Fe2O3 is preferred as a photoanode in a PEC cell, so annealing is necessary to induce phase formation and crystallization. The annealing conditions must be however carefully controlled as to avoid the oxidation of the underlying iron, thickening of the barrier layer and growth of the surface oxide which can eventually collapse the nanoporous structure. Annealing in the current study was carried out in nitrogen, to avoid growth of new oxide layer. Annealing was carried out at 300, 450, 500, 600, and 900 °C for 2 h.
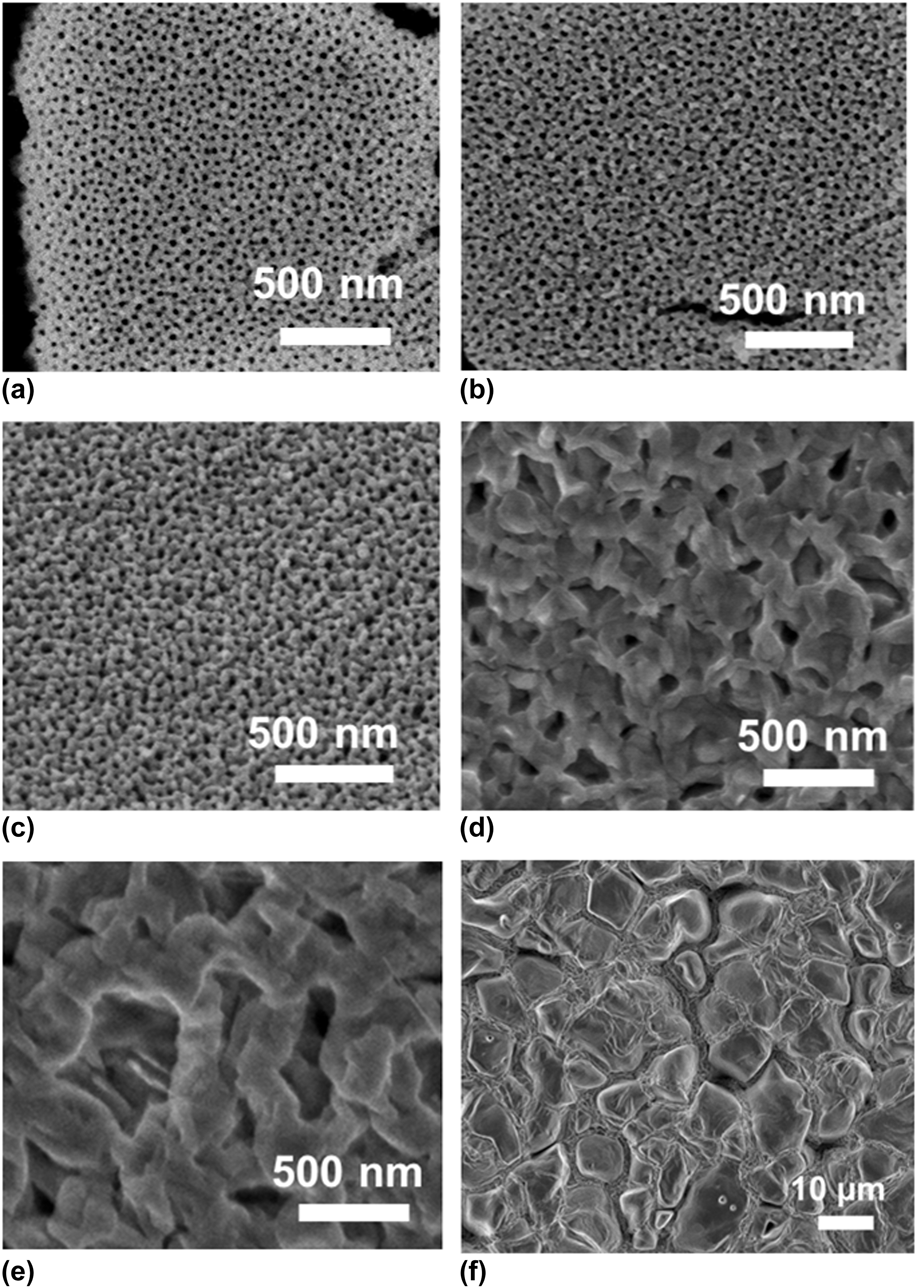
Morphologies of anodic iron oxide annealed at 300–900 °C in nitrogen are shown in Fig. 4. It is obvious that the morphology is significantly affected by the annealing temperature whereby the nanoporous structure retains when the sample was annealed at ≤ 450 °C. Sample annealed at 500 °C has much reduced pore diameters, indicating the growth of the pore wall shrinking the pore diameters. The pores are completely destroyed leaving large grains when sample was annealed at 600 °C. These grains grow into even large crystals upon annealing at 900 °C. Grain growth is inevitable at such high temperatures as diffusion of iron ions from the parent metal leads to the formation of new, possibly iron-rich grains. Annealing temperature must therefore be kept at <500 °C.
FESEM images of iron oxide films annealed for 2 h at different temperatures in nitrogen: (a) as-anodized, (b) 300 °C, (c) 450 °C, (d) 500 °C, (e) 600 °C, and (f) 900 °C.
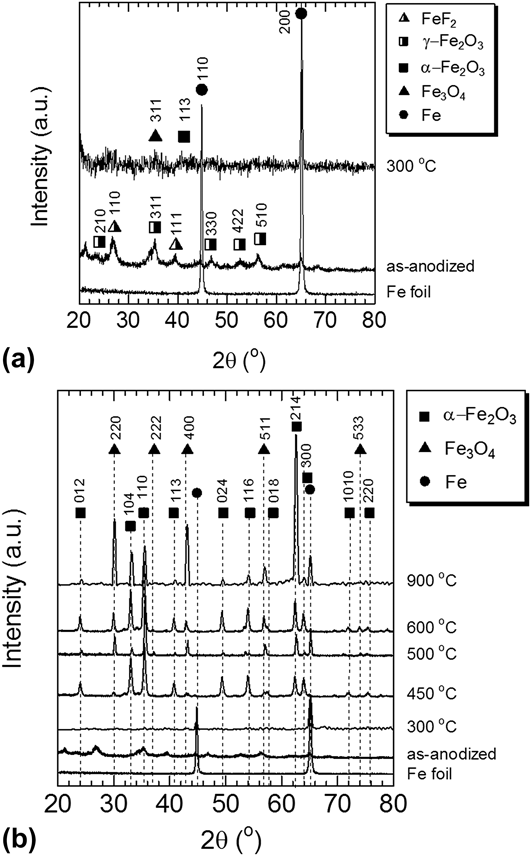
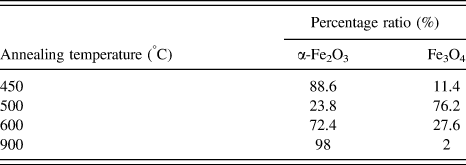
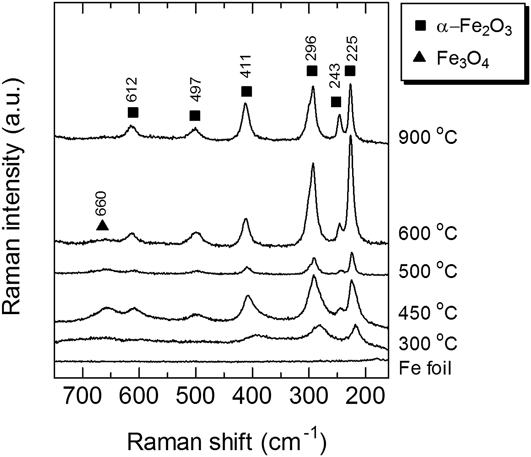
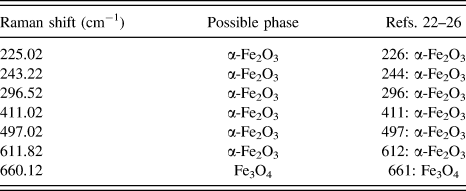
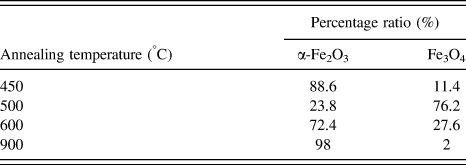
XRD was used to obtain structural information of the annealed samples as shown in Fig. 5. For the ease of observation, XRD of as-anodized and 300 °C samples were plotted together as shown in Fig. 5(a) whereas XRD patterns for all samples are shown in Fig. 5(b). For the as-anodized sample γ-Fe2O3 (JCPDS no. 39-1346) peaks are observed. Formation of this phase is discussed as shown in [Eq. (3)]. Peaks from FeF2 can also be seen. Our findings are consistent with previous reports. For example, Schmuki et al.Reference Albu, Ghicov and Schmuki6 reported on nanoporous iron oxide containing FeF2 (JCPDS no. 03-1324) when iron was anodized in a fluorinated bath, and that the fluoride content decreased upon subsequent annealing. The XRD pattern of our sample annealed at 300 °C contains some very weak peaks which can be indexed to Fe3O4 and α-Fe2O3 but in general the oxide annealed at this temperature seems to be rather amorphous [α-Fe2O3 (JCPDS no. 33-0664) and Fe3O4 (JCPDS no. 19-0629)]. The FeF2 peak then disappeared. Annealing at 450 °C crystallizes the oxide whereby peaks of α-Fe2O3 and Fe3O4 are clearly observed and indexed according to the JCPDS cards as mentioned above. By using with Rietveld refinement method the sample appears to have 88.6% α-Fe2O3 and 11.4% Fe3O4. Annealing at 500 °C resulted in the formation of more Fe3O4 indicating either phase transformation or formation at this temperature (% of phases calculated by Rietveld method is on Table I). Annealing at 600 °C resulted in further crystallization of α-Fe2O3 enhancing the XRD peaks of this oxide phase along with the Fe3O4 phase. Even though α-Fe2O3 is a fully oxidized form of iron oxide, and is the most stable, at the interface between α-Fe2O3 and the metal foil, Fe3O4 may have formed and similar to thermal oxidation of iron, the formation of Fe3O4 is temperature dependent. Various authors have discussed on this transformation especially during high temperature oxidation of iron as reviewed by Chen et al.Reference Chen and Yeun21 Raman spectra were recorded to further investigate the crystallinity of the anodic iron oxide, and are shown in Fig. 6. The Raman peak positions of α-Fe2O3 are similar for samples annealed at 300–900 °C and as in agreement with the XRD, sample annealed at 300 °C contains weak peaks of α-Fe2O3. However in general this sample seems to be rather amorphous. A broad peak of Fe3O4 can be detected at 660 cm−1 for the sample annealed at 450–600 °C. Broad Raman peaks indicate structural disorder which may be due to the incorporation of foreign ions and/or formation of vacancies within the crystals as well as the small crystallite size. The observed Raman peaks are summarized in Table II.Reference Bersani, Lottici and Montenero22–Reference Oh, Cook and Townsend26
XRD patterns of nanoporous anodic iron oxide films: (a) as-anodized and 300 °C (b) 450 °C–900 °C in nitrogen.
Percentage ratio between α-Fe2O3 and Fe3O4 in the annealed samples.
Raman spectra of nanoporous anodic iron oxide films annealed in nitrogen.
Raman shift of anodic iron oxide annealed at 300–900 °C.
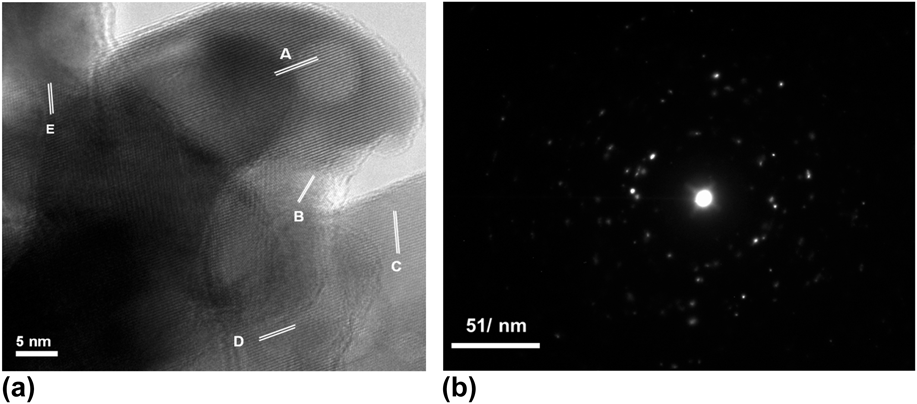
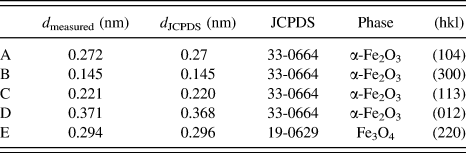
An HRTEM image of the sample annealed at 450 °C for 2 h in nitrogen is shown in Fig. 7(a). Clear lattice fringes with 0.272 nm spacing is observed, corresponding to (104) planes of α-Fe2O3. (300), (113), and (012) planes of α-Fe2O3 and (220) plane of Fe3O4 are also observed as listed in Table III. The selected area electron diffraction (SAED) pattern in Fig. 7(b) shows many diffraction spots, indicating that α-Fe2O3 is polycrystalline. Based on all these findings, annealing in nitrogen appears to have induced crystallization of the desired α-Fe2O3 phase.
(a) HRTEM image of anodic iron oxide annealed for 2 h at 450 °C in nitrogen, and (b) corresponding SAED pattern.
List of lattices fringes observed in Fig. 7(a).
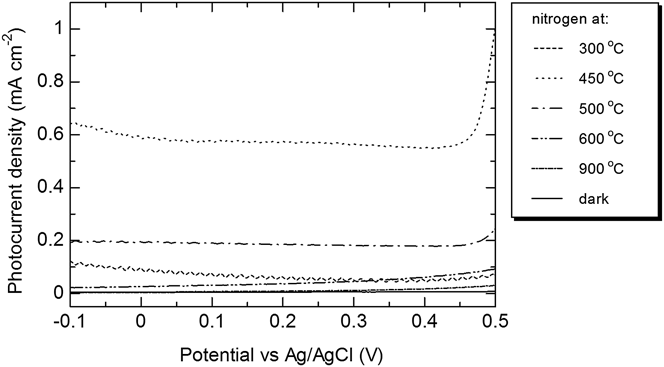
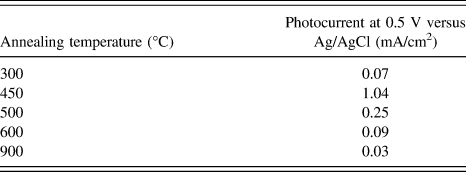
PEC measurements of the nitrogen-annealed anodic iron oxide film on iron foil were recorded in solution of 1 M NaOH. Figure 8 shows the photocurrent versus potential measured relative to an Ag/AgCl standard electrode, under AM 1.5 simulated solar irradiation in 1 M NaOH. The dark current is shown for comparison, and no significant current is generated in the absence of light. Upon irradiation, the sample annealed at 300 °C (barrier layer thickness ∼190 nm) shows a low photocurrent of 0.07 mA/cm2 at 0.5 V versus Ag/AgCl. Recall that the XRD pattern in Fig. 5 reveals that the sample is rather amorphous; suggesting that the crystallinity of the anodic layer affects the generation of photocurrent.
Photocurrent density-potential characteristics of nitrogen-annealed samples in 1 M NaOH.
The sample annealed at 450 °C generates a photocurrent of ∼1.04 mA/cm2 at 0.5 V versus Ag/AgCl. Our result is higher than a photocurrent of ∼0.26 mA/cm2 at 0.6 V versus Ag/AgCl, reported by previous authors (for anodic nanoporous iron oxide annealed at 400 °C for 30 min)Reference Prakasam, Varghese, Paulose, Mor and Grimes10 or a photocurrent of ∼0.45 mA/cm2 at 0.6 V versus Ag/AgCl for air-annealed sample.Reference Rozana, Azhar, Anwar, Kawamura, Khairunisak, Matsuda and Lockman13 This anodic nanoporous iron oxide was predominantly α-Fe2O3 with a small amount of Fe3O4, and had a barrier layer thickness of ∼800 nm.Reference Prakasam, Varghese, Paulose, Mor and Grimes10
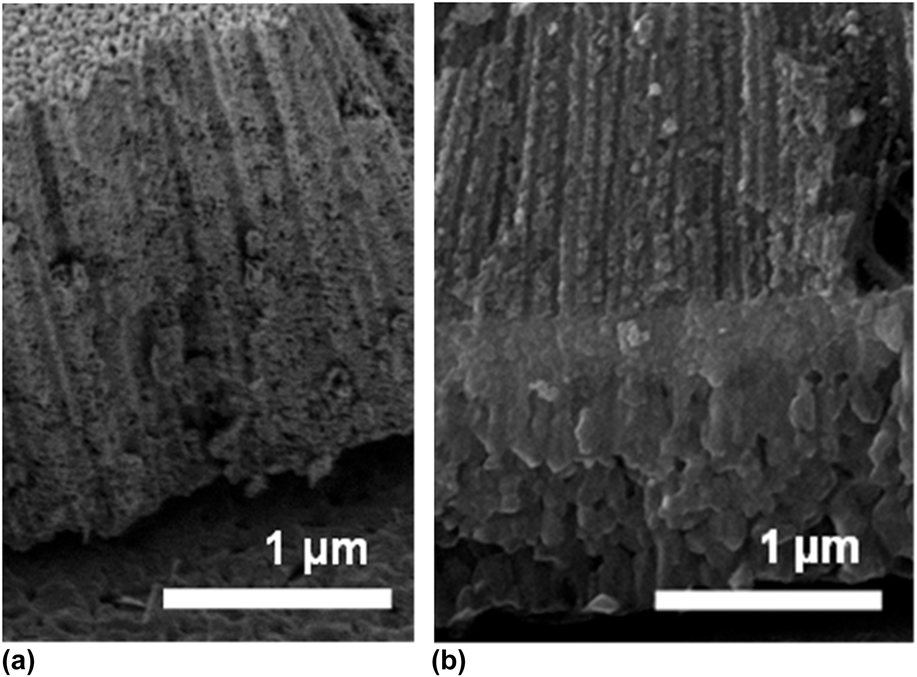
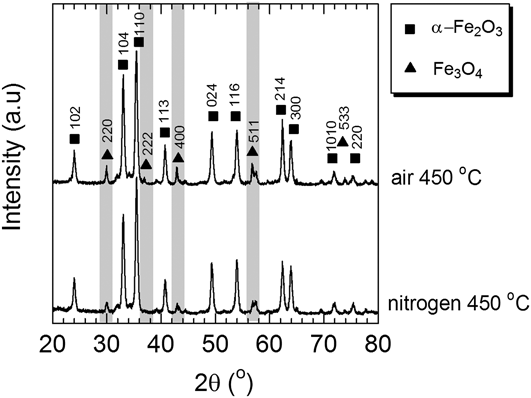
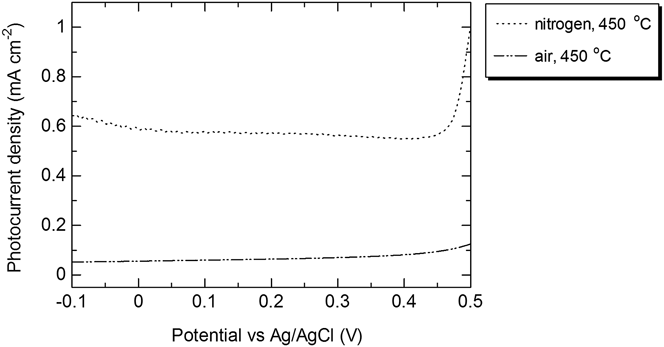
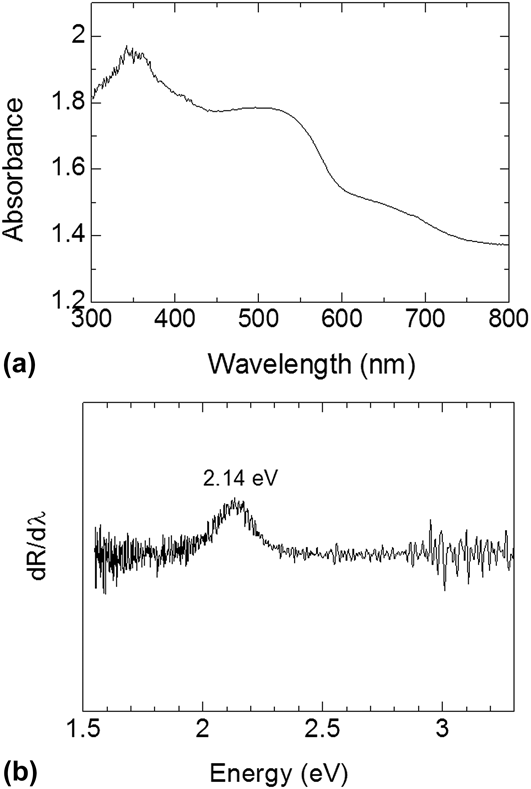
The higher photocurrent for our sample may be attributed to the small thickness of the barrier layer for the nitrogen-annealed sample which is ∼200 nm, as shown in Fig. 9(a). In Fig. 9(b), the cross-section of an air-annealed sample is shown to have barrier layer thickness of >1 µm. We compared the XRD patterns of the air-annealed and the nitrogen-annealed samples as in Fig. 10. From this figure, Fe3O4 peaks for air-annealed sample are seen to be more intense than the sample annealed in nitrogen indicating phase transformation (or formation) to Fe3O4 during annealing in air. The thicker barrier layer for the air-annealed sample is thought to have consisted of Fe3O4 and as Fe3O4 is not exactly a good electronic conductor, transport of electrons to the back contact through this layer is more sluggish. Moreover, at high temperature FeO as well as nonstoichiometric α-Fe2O3 may also have formed. For ease of comparison, the photocurrent versus voltage plots of the air-annealed sample and nitrogen-annealed samples are shown in Fig. 11. As can be seen, the air-annealed samples have a photocurrent of 0.13 mA/cm2 at 0.5 V versus Ag/AgCl. To further investigate the characteristic of nitrogen-annealed sample, UV–Vis absorbance spectra of sample were produced [Fig. 12(a)]. From here the band gap of the sample was measured to be ∼2.14 eV [Fig. 12(b)]. Annealing in nitrogen does not affect the energy gap of the α-Fe2O3 very much.
FESEM images of nanoporous iron oxide annealed for 2 h at 450 °C in (a) nitrogen and (b) air.
XRD of nanoporous iron oxide annealed for 2 h at 450 °C in nitrogen and air.
Photocurrent comparison of sample annealed in nitrogen and air at 450 °C.
Optical property of nanoporous iron oxide annealed for 2 h at 450 °C in nitrogen: (a) optical absorption spectra and (b) differential reflectance plotted as a function of energy.
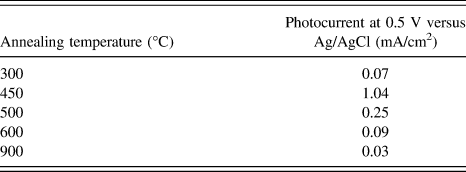
From Fig. 8, it is obvious that photocurrent for sample annealed at 500 °C is lower compared to sample annealed at 450 °C. And samples annealed at even higher temperatures have even smaller photocurrent. Table IV summarizes the photocurrent of all samples at 0.5 V versus Ag/AgCl. High temperature annealing may increase the barrier layer thickness hence lower photocurrent values are produced for these samples. Moreover, annealing at high temperature induces grain growth. Recall that for samples annealed at > 600 °C, the nanoporous structure has completely destroyed for all samples, leaving a flat oxide layer. Such samples have lower surface areas and are similar to flat electrode, it provides longer distance for holes to travel hence much of the photogenerated carriers have recombined, thus lowering the photocurrent. At high temperature, similar to the above mentioned argument, annealing will induce the formation of FeO or Fe3O4.
Photocurrent performance of nitrogen-annealed samples in 1 M NaOH under AM 1.5 (100 mW/cm2).
Annealing in nitrogen of anodic nanoporous iron oxides film is suggested to be used to generate high photocurrent as it avoids forming a new oxide barrier layer but the temperature must be less than 500 °C but above 300 °C. Too high of a temperature as mentioned would induce fast grain growth, diminishing the nanoporous structure and aid to the transformation of semiconducting α-Fe2O3 to the nonphotoconductive FeO and Fe3O4.
IV. CONCLUSION
Anodizing iron foil at 50 V for 15 min results in a 1.8 µm thick anodic oxide film containing uniform, elongated nanopores. The as-anodized anodic layer is however rather amorphous and contains γ-Fe2O3 and FeF2. Annealing removes all these undesired phases and transforms the anodic layer to α-Fe2O3 but annealing must be done above 300 °C to allow for more crystalline α-Fe2O3 formation. However, annealing must be kept at 450 °C, as higher temperature than 450 °C resulted in grain growth hence destruction of the nanoporous structure, thickening of the barrier layer and Fe3O4 formation which has negative effect on the photocurrent. The sample annealed at 450 °C, recorded the highest photocurrent of 1.04 mA/cm2 in 1 M NaOH at 0.5 V versus Ag/AgCl (under AM 1.5 illumination) higher than the photocurrent of air-annealed sample of 0.13 mA/cm2 at 0.5 V versus Ag/AgCl. Nitrogen annealing does not change the energy gap and does not suppress the formation of α-Fe2O3 but the barrier layer thickness of the sample appears to be thinner than the air-annealed sample.
ACKNOWLEDGMENTS
The authors are grateful for support by the ASEAN University Network/Southeast Asia Engineering Education Development Network (AUN/SEED-Net), Japan International Cooperation Agency (JICA). Nanomaterials development is supported by OneBAJA Long Term Research Grant Scheme (LRGS), Ministry of Higher Education Malaysia, Project 2, 304/PBAHAN/6050235.