1 Introduction
The dispersion relation of internal waves is given by
 $\unicode[STIX]{x1D714}_{0}^{2}=N_{0}^{2}\sin ^{2}\unicode[STIX]{x1D703},$
with
 $\unicode[STIX]{x1D714}_{0}$
the wave frequency,
 $\unicode[STIX]{x1D703}$
the angle of phase propagation with respect to the vertical,
 $z$
the direction antiparallel to gravity and
 $N_{0}$
the Brunt–Väisälä frequency, here assumed constant. The group propagation is always orthogonal to the phase propagation (Sutherland Reference Sutherland2010), thus
 $\unicode[STIX]{x1D703}$
also represents the angle of energy propagation with respect to the horizontal plane, and is fixed for monochromatic waves. This property results in geometric focusing or defocusing upon reflection at a sloping topography. Repeated geometric focusing in closed domains can project the wave energy onto closed orbits, known as wave attractors (Maas & Lam Reference Maas and Lam1995; Maas et al.
Reference Maas, Benielli, Sommeria and Lam1997). In the vicinity of internal wave attractors, energy is dissipated by viscous dissipation (Hazewinkel et al.
Reference Hazewinkel, van Breevoort, Dalziel and Maas2008), or lost to nonlinear wave–wave interactions (Scolan, Ermanyuk & Dauxois Reference Scolan, Ermanyuk and Dauxois2013; Brouzet et al.
Reference Brouzet, Ermanyuk, Joubaud, Sibgatullin and Dauxois2016a
, Reference Brouzet, Ermanyuk, Joubaud, Pillet and Dauxois2017a
; Dauxois et al.
Reference Dauxois, Joubaud, Odier and Venaille2018). Internal wave attractors are studied most thoroughly in the classical quasi-two-dimensional trapezoidal set-ups (Maas & Lam Reference Maas and Lam1995; Maas et al.
Reference Maas, Benielli, Sommeria and Lam1997; Maas Reference Maas2005, Reference Maas2009; Swart et al.
Reference Swart, Sleijpen, Maas and Brandts2007; Grisouard, Staquet & Pairaud Reference Grisouard, Staquet and Pairaud2008; Harlander Reference Harlander2008; Hazewinkel et al.
Reference Hazewinkel, van Breevoort, Dalziel and Maas2008, Reference Hazewinkel, Tsimitri, Maas and Dalziel2010; Scolan et al.
Reference Scolan, Ermanyuk and Dauxois2013; Brouzet et al.
Reference Brouzet, Ermanyuk, Joubaud, Sibgatullin and Dauxois2016a
,Reference Brouzet, Sibgatullin, Scolan, Ermanyuk and Dauxois
b
, Reference Brouzet, Ermanyuk, Joubaud, Pillet and Dauxois2017a
,Reference Brouzet, Sibgatullin, Ermanyuk, Joubaud and Dauxois
b
), geometries which are also popular in studies on closely related inertia wave attractors (Manders & Maas Reference Manders and Maas2003; Klein et al.
Reference Klein, Seelig, Kurgansky, Ghasemi, Borcia, Will, Schaller, Egbers and Harlander2014; Troitskaya Reference Troitskaya2017). Recent studies also examine internal wave attractors confined to more sophisticated domains, resembling simplified ocean topography (Tang & Peacock Reference Tang and Peacock2010; Echeverri et al.
Reference Echeverri, Yokossi, Balmforth and Peacock2011; Hazewinkel, Maas & Dalziel Reference Hazewinkel, Maas and Dalziel2011; Wang et al.
Reference Wang, Zheng, Lin, Dai and Qiao2015; Guo & Holmes-Cerfon Reference Guo and Holmes-Cerfon2016). Applying standard boundary layer theory, Klein et al. (Reference Klein, Seelig, Kurgansky, Ghasemi, Borcia, Will, Schaller, Egbers and Harlander2014) establish the importance of the Ekman boundary layers for inertial wave attractors. Surprisingly, the role of energy dissipation at rigid boundaries for internal wave attractors still remains an open question, even for the simplest domain, the classical quasi-two-dimensional (quasi-2-D) trapezoid. The energy loss at the wave attractor – and in the broader sense internal wave beams – can have far-reaching consequences for the mixing budget of stratified fluids, such as the deep oceans (Wunsch & Ferrari Reference Wunsch and Ferrari2004) and marginal seas (Lamb Reference Lamb2014).
In this paper, we apply standard boundary layer theory to quantify the frictional damping mechanisms of internal wave attractors in the classical quasi-2-D laboratory set-up. Frictional dissipation takes place in two types of viscous layers: the shear layers in the interior along the attractor and the boundary layers at the rigid boundaries.
Internal wave damping through interior shear layers, first described by Thomas & Stevenson (Reference Thomas and Stevenson1973), has been studied extensively over the past decades, and in particular in the context of internal wave attractors by Dintrans, Rieutord & Valdettaro (Reference Dintrans, Rieutord and Valdettaro1999), Swart (Reference Swart2007), Hazewinkel et al. (Reference Hazewinkel, van Breevoort, Dalziel and Maas2008), Brouzet et al. (Reference Brouzet, Ermanyuk, Joubaud, Sibgatullin and Dauxois2016a ) and inertial wave attractors by Dintrans et al. (Reference Dintrans, Rieutord and Valdettaro1999), Rieutord, Georgeot & Valdettaro (Reference Rieutord, Georgeot and Valdettaro2001, Reference Rieutord, Georgeot and Valdettaro2002), Ogilvie (Reference Ogilvie2005), Jouve & Ogilvie (Reference Jouve and Ogilvie2014). A simple model for an equilibrium wave attractor spectrum, with the energy input at the basin scale (low wavenumbers) and dissipation only through internal shear at high wavenumbers, has been derived by Hazewinkel et al. (Reference Hazewinkel, van Breevoort, Dalziel and Maas2008). Although the structure of their theoretical spectrum resembles their experimentally observed spectrum of an internal wave attractor in the classical quasi-2-D trapezoidal set-up, the discrepancy hints at significant dissipation at the rigid boundaries. Grisouard et al. (Reference Grisouard, Staquet and Pairaud2008) performed 2-D numerical simulations, designed to replicate the laboratory experiment by Hazewinkel et al. (Reference Hazewinkel, van Breevoort, Dalziel and Maas2008) with free-slip boundaries. Their simulations underestimates the energy dissipation at high wavenumbers, also indicating an additional energy sink at the walls in the laboratory. The fully 3-D simulations by Brouzet et al. (Reference Brouzet, Sibgatullin, Scolan, Ermanyuk and Dauxois2016b ) signify significantly increased dissipation rates in the lateral boundary layers. Our theoretical analysis shows that adding dissipation at the rigid boundaries closes the gap between the model and observations in Hazewinkel et al. (Reference Hazewinkel, van Breevoort, Dalziel and Maas2008).
Stokes boundary layers in homogenous fluids are well understood and are described in many text books on fluid mechanics, e.g. Schlichting & Gersten (Reference Schlichting and Gersten2000). The stratified boundary layers for monochromatic internal waves are to some extent analogous to homogenous Stokes boundary layers, but differ in a number of fundamental aspects, such as the characteristic thickness of the boundary layer. The thickness of the stratified boundary layer is given by
 $$\begin{eqnarray}d_{0}=\unicode[STIX]{x1D707}^{-1}\left(\frac{\unicode[STIX]{x1D708}}{\unicode[STIX]{x1D714}}\right)^{1/2},\quad \text{with }\unicode[STIX]{x1D707}=\sqrt{\left|\frac{\sin ^{2}\unicode[STIX]{x1D711}}{\sin ^{2}\unicode[STIX]{x1D703}}-1\right|}\end{eqnarray}$$
dependent on the angle
 $\unicode[STIX]{x1D711}$
of the boundary (with respect to the horizontal) and the internal wave inclination,
 $\unicode[STIX]{x1D703}$
. Note that horizontal boundaries (
 $\unicode[STIX]{x1D711}=0$
), investigated by Renaud & Venaille (Reference Renaud and Venaille2018), coincide with the homogeneous case,
 $\unicode[STIX]{x1D707}=1$
. For near-critical reflections (
 $\unicode[STIX]{x1D711}\sim \unicode[STIX]{x1D703}$
) the boundary layer thickness
 $d_{0}$
tends to infinity, making different approaches, such as in Dauxois & Young (Reference Dauxois and Young1999), necessary. The theoretical investigation on stratified rotating boundary layers by Swart et al. (Reference Swart, Manders, Harlander and Maas2010) stresses the importance of these critical cases (
 $\unicode[STIX]{x1D711}\sim \unicode[STIX]{x1D703}$
) for the generation of internal inertia waves by oscillating boundaries. Kistovich & Chashechkin (Reference Kistovich and Chashechkin1995a
,Reference Kistovich and Chashechkin
b
) computed the boundary layer of a reflecting internal wave beam, but did not account for the dissipative energy loss inside the boundary layer. Vasiliev & Chashechkin (Reference Vasiliev and Chashechkin2003) constructed asymptotic solutions for internal wave fields generated by a rigid plane vibrating along its surface. We now investigate a situation in which the energy flux is in opposite direction, i.e. the wave attractor loses energy to the rigid walls. The objective is to understand and quantify the damping induced by stratified boundary layers on wave attractors. Partial results are also reported in Beckebanze & Maas (Reference Beckebanze and Maas2016).
The structure of this paper is as follows. The formulation of the problem is described in § 2. In § 3, we construct inviscid wave attractor solutions. Internal shear, lateral wall boundary layers and boundary layers at the reflecting walls are subsequently added in respectively §§ 4–6. In § 7, we compare our extended model for the equilibrium wave attractor spectrum with the laboratory experiment and 3-D simulations. Conclusions are drawn in § 8.
2 Preliminaries
In this paper we consider monochromatic internal waves in a linearly stratified Boussinesq fluid inside a trapezoidal tank
 $$\begin{eqnarray}D=\{(x,y,z)\in \mathbb{R}|-l_{y}\leqslant y\leqslant l_{y},-l_{x}\leqslant x\leqslant l_{x},0\leqslant z\leqslant \min [h,(l_{x}-x)\tan \unicode[STIX]{x1D6FC}]\},\end{eqnarray}$$
with
 $z$
antiparallel to gravity. We anticipate ratios
 $\sin \unicode[STIX]{x1D703}=\unicode[STIX]{x1D714}_{0}/N_{0}$
of wave frequency
 $\unicode[STIX]{x1D714}_{0}$
over Brunt–Väisälä frequency
 $N_{0}$
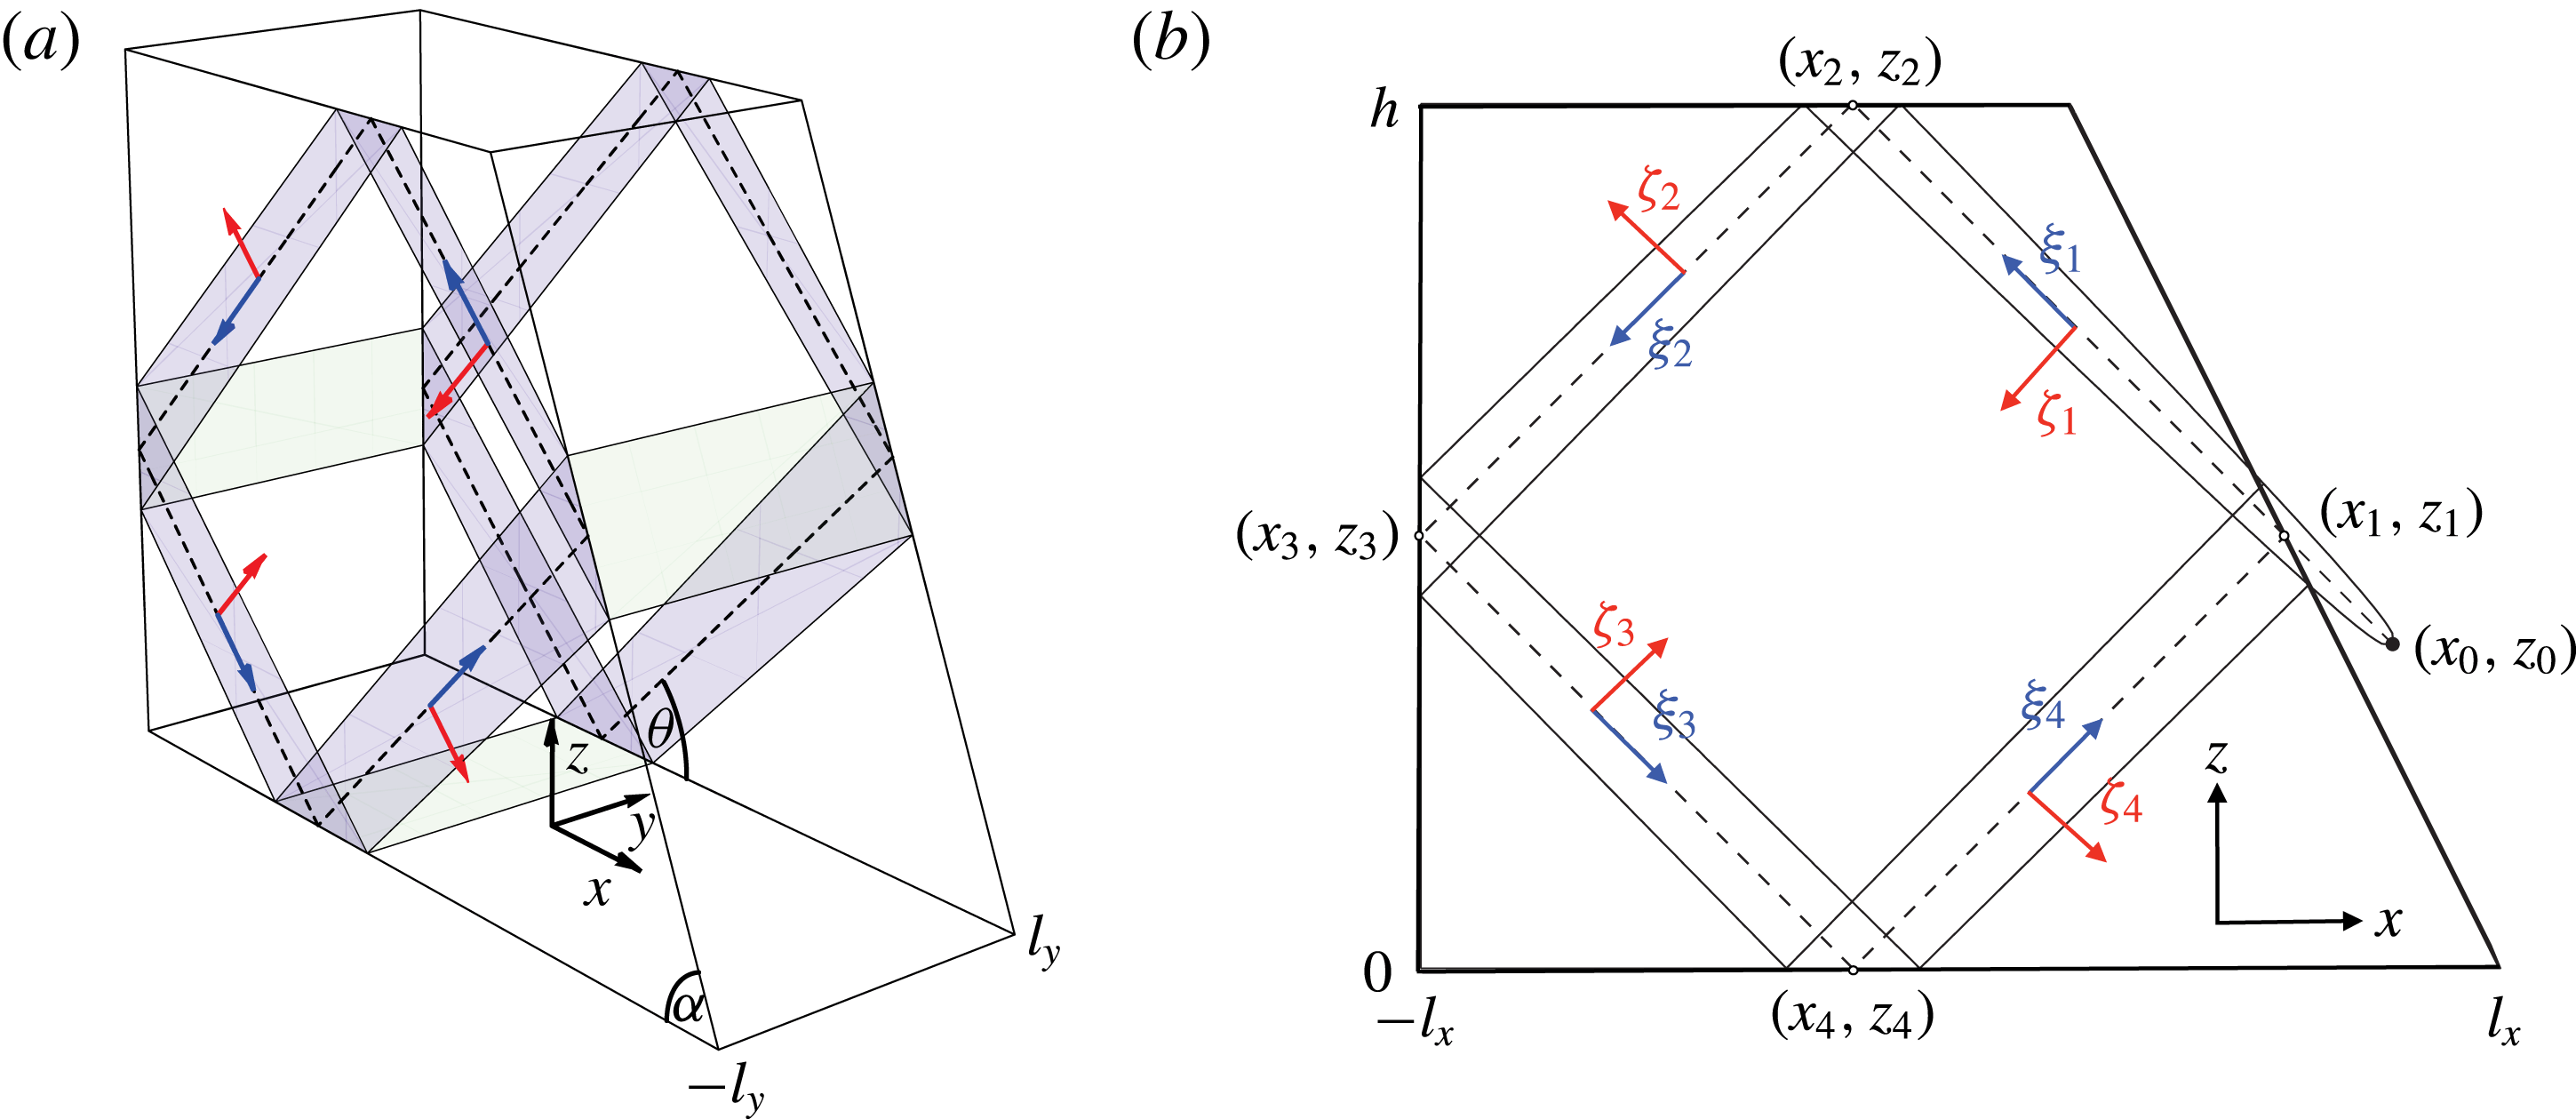
, such that the internal wave motion is predominantly confined to a neighbourhood around the theoretical inviscid wave attractor, as illustrated in figure 1(a,b). The Cartesian coordinates,
 $(x,y,z)$
, are dimensionalized with the length scale
 $\unicode[STIX]{x1D706}_{0}$
, which we assume to be the characteristic wavelength of the predominant wave motion – the viscous wave attractor – measured in the cross-beam direction. Note that scaling the non-dimensional half-bottom-length,
 $l_{x}$
, half-width,
 $l_{y}$
, and height,
 $h$
, with the same length scale,
 $\unicode[STIX]{x1D706}_{0}$
, leaves the angle of the inclined wall,
 $\unicode[STIX]{x1D6FC}$
, and the energy propagation angle,
 $\unicode[STIX]{x1D703}$
, both with respect to the horizontal, invariant. We require
 $l_{y}\gtrapprox 1$
, i.e. the dimensional width,
 $W=2l_{y}\unicode[STIX]{x1D706}_{0}$
, is at least of the same order of magnitude as the wave attractor cross-beam length scale,
 $\unicode[STIX]{x1D706}_{0}$
.
Schematic view of the 3-D trapezoidal domain
 $D$
(a), and its side view (b). The viscous wave attractor interacts with the rigid boundaries of
 $D$
(free slip at surface,
 $z=h$
) primarily in the shaded areas (a), as it is confined to a region around the theoretical inviscid wave attractor orbit (dashed lines in a,b). The black dot in (b) to the right of the inclined wall indicates the virtual source. The phase propagation is along coordinates
 $\unicode[STIX]{x1D701}_{n}$
,
 $n=1,2,3,4$
(red arrows), whereas the energy propagation is along
 $\unicode[STIX]{x1D709}_{n}$
(blue arrows) at an angle
 $\unicode[STIX]{x1D703}$
with respect to the horizontal
 $x$
. The thickening of the wave attractor in the energy propagation direction is due to viscous damping, as discussed in § 5, and it is balanced by the focusing reflection at inclined wall with angle
 $\unicode[STIX]{x1D6FC}$
.

We consider sufficiently weak monochromatic forcing, generating only small-amplitude wave motion. This means that the Stokes number,
 $U_{0}/\unicode[STIX]{x1D714}_{0}\unicode[STIX]{x1D706}_{0}$
, with
 $U_{0}$
the dimensional scale of the internal wave velocity, is small such that all nonlinear advection terms can be neglected.
Under these assumptions, the (linearized) equations governing the dimensionless velocity field
 $\boldsymbol{u}=(u,v,w)$
, buoyancy
 $b$
and pressure
 $p$
of the Boussinesq fluid, with scaled Brunt–Väisälä frequency
 $N=N_{0}/\unicode[STIX]{x1D714}_{0}=\pm 1/\text{sin}\unicode[STIX]{x1D703}$
, are given in subscript-derivative notation by
 $$\begin{eqnarray}\boldsymbol{u}_{t}=-\unicode[STIX]{x1D735}p+b\hat{\boldsymbol{z}}+\unicode[STIX]{x1D6FF}^{2}\unicode[STIX]{x0394}\boldsymbol{u}+\boldsymbol{f}\,\text{e}^{-it},\quad b_{t}=-N^{2}w,\quad \unicode[STIX]{x1D735}\boldsymbol{\cdot }\boldsymbol{u}=0.\end{eqnarray}$$
Here,
 $\unicode[STIX]{x1D6FF}=d_{0}/\unicode[STIX]{x1D706}_{0}\ll 1$
is the non-dimensional Stokes boundary layer width, with
 $d_{0}=\sqrt{\unicode[STIX]{x1D708}/\unicode[STIX]{x1D714}_{0}}$
, and
 $\unicode[STIX]{x1D708}$
the kinematic viscosity constant. We assume the fluid to be salt stratified, and neglect diffusivity by considering an infinite Schmidt number (ratio of kinematic viscosity over mass diffusivity, typically approximately 700 for salt-stratified fluids). The forcing
 $\boldsymbol{f}=\boldsymbol{f}(x,z)$
is assumed to be uniform in the transverse
 $y$
-direction. For mathematical convenience, we consider
 $\boldsymbol{f}$
to be a localized source, located outside the trapezoidal domain,
 $D$
, as illustrated in figure 1(b). This enables us to describe the viscous wave attractor as four branches of a viscous internal wave beam (Ogilvie Reference Ogilvie2005). The downside of this approach is a slight violation of the impermeability boundary condition at the inclined wall near the wave attractor upon incorporating viscous attenuation. In fact, the energy input into the closed domain
 $D$
occurs through spatially non-uniform oscillations at the inclined wall, on which we have no control a priori. We accept this disadvantage, which also underlies the theoretical 2-D spectra by Hazewinkel et al. (Reference Hazewinkel, van Breevoort, Dalziel and Maas2008), because it is irrelevant for the energy loss through the boundary layers of a quasi-2-D weakly viscous wave attractor – the main objective of the presented analysis.
We solve the governing equations (2.2) asymptotically with no-slip boundary conditions,
 $\boldsymbol{u}=0$
, at the boundary of the trapezoidal domain
 $D$
(except at the free surface,
 $z=h$
, where we impose free slip), by expanding the velocity vector
 $\boldsymbol{u}$
in the small parameter
 $\unicode[STIX]{x1D6FF}$
,
 $$\begin{eqnarray}\boldsymbol{u}=\boldsymbol{u}_{0}+\unicode[STIX]{x1D6FF}\boldsymbol{u}_{1}+O(\unicode[STIX]{x1D6FF}^{2}),\end{eqnarray}$$
and similarly for buoyancy
 $b$
and pressure
 $p$
. We start in § 3 by solving (2.2) at
 $O(\unicode[STIX]{x1D6FF}^{0})$
with free-slip boundary conditions for
 $\boldsymbol{u}_{0}$
. Free slip means that we only require the normal derivative of tangential velocity to vanish. Viscous attenuation is added in § 4, and in § 5, we extend
 $\boldsymbol{u}_{0}$
such that it vanishes at the lateral walls (surfaces along dashed theoretical attractor in figure 1(a), blue online). In § 6, we add correction terms in order to satisfy the no-slip boundary condition also at the reflection sides (green surfaces in figure 1(a), green online).
3 Wave attractor branches in interior
It is convenient to express the four wave attractor branches in the rotated and shifted coordinates
 $[\unicode[STIX]{x1D709}_{n},\unicode[STIX]{x1D701}_{n}]$
,
 $n=1,2,3,4$
, given by
 $$\begin{eqnarray}\left[\begin{array}{@{}c@{}}\unicode[STIX]{x1D709}_{1,3}\\ \unicode[STIX]{x1D701}_{1,3}\end{array}\right]=\mp \left[\begin{array}{@{}cc@{}}\cos \unicode[STIX]{x1D703} & -\!\sin \unicode[STIX]{x1D703}\\ \sin \unicode[STIX]{x1D703} & \cos \unicode[STIX]{x1D703}\end{array}\right]\left[\begin{array}{@{}c@{}}x-x_{1,3}\\ z-z_{1,3}\end{array}\right],\quad \left[\begin{array}{@{}c@{}}\unicode[STIX]{x1D709}_{2,4}\\ \unicode[STIX]{x1D701}_{2,4}\end{array}\right]=\mp \left[\begin{array}{@{}cc@{}}\cos \unicode[STIX]{x1D703} & \sin \unicode[STIX]{x1D703}\\ \sin \unicode[STIX]{x1D703} & -\!\cos \unicode[STIX]{x1D703}\end{array}\right]\left[\begin{array}{@{}c@{}}x-x_{2,4}\\ z-z_{2,4}\end{array}\right],\end{eqnarray}$$
with
 $[x_{n},z_{n}]$
the reflection points of the attractor, see figure 1(b). The theoretical inviscid wave attractor (dashed lines in figure 1) corresponds to
 $\unicode[STIX]{x1D701}_{n}=0$
, for
 $n=1,2,3,4$
.
The inviscid
 $O(\unicode[STIX]{x1D6FF}^{0})$
-velocity field generated by a monochromatic, localized source, describing the first wave attractor branch (labelled with the super-script
 $1$
), can be written as
 $$\begin{eqnarray}\boldsymbol{u}_{0}^{[1]}=\hat{\unicode[STIX]{x1D743}}_{1}U(\unicode[STIX]{x1D701}_{1})=\left[-\cos \unicode[STIX]{x1D703},0,\sin \unicode[STIX]{x1D703}\right]U(\unicode[STIX]{x1D701}_{1}),\quad U(\unicode[STIX]{x1D701})=\int _{0}^{\infty }\hat{U} (k)\exp \left[\text{i}(k\unicode[STIX]{x1D701}-t)\right]\,\text{d}k,\end{eqnarray}$$
where
 $k$
is the non-dimensional wavenumber (scaled by
 $\unicode[STIX]{x1D706}_{0}^{-1}$
). Physical quantities are always the real part of the presented expression, and the hat on a coordinate always denotes the unit vector pointing in the direction of this coordinate, i.e.
 $\hat{\unicode[STIX]{x1D743}}_{1}$
is the unit vector along the first wave attractor branch. The Fourier spectrum
 $$\begin{eqnarray}\hat{U} (k)=\frac{1}{2\unicode[STIX]{x03C0}}\int _{-\infty }^{\infty }U(\unicode[STIX]{x1D701})\exp [-\text{i}\unicode[STIX]{x1D701}k]\,\text{d}\unicode[STIX]{x1D701}\end{eqnarray}$$
of the along-wave-beam velocity component
 $U$
depends on the unspecified localized source at
 $(x_{0},z_{0})$
. The main objective of the presented analysis is to derive constraints for
 $\hat{U} (k)$
, based on geometric wave focusing (this section), and viscous dissipation (§§4–6). Note that
 $\hat{U} (k)=0$
for
 $k\leqslant 0$
because no energy can propagate towards the source (by assumption).
Subsequent free-slip reflections of the first wave attractor branch at the surface,
 $z=h$
, at the vertical wall,
 $x=-l_{x}$
, and at the bottom,
 $z=0$
, lead to the following velocity fields for the second, third and fourth wave attractor branches:
 $$\begin{eqnarray}\boldsymbol{u}_{0}^{[n]}=\hat{\unicode[STIX]{x1D743}}_{n}U(\unicode[STIX]{x1D701}_{n})\quad \text{for }n=2,3,4.\end{eqnarray}$$
The fourth branch returns to the inclined wall,
 $z=(l_{x}-x)\tan \unicode[STIX]{x1D6FC}$
, where the free-slip boundary condition reads
 $$\begin{eqnarray}\text{Re}\left[\left(\boldsymbol{u}_{0}^{[1]}+\boldsymbol{u}_{0}^{[4]}\right)\boldsymbol{\cdot }\hat{\boldsymbol{n}}_{\unicode[STIX]{x1D6FC}}\right]=0,\end{eqnarray}$$
with
 $\hat{\boldsymbol{n}}_{\unicode[STIX]{x1D6FC}}=[\sin \unicode[STIX]{x1D6FC},0,\cos \unicode[STIX]{x1D6FC}]$
a normal vector of the inclined wall. On the inclined wall,
 $z=(l_{x}-x)\tan \unicode[STIX]{x1D6FC}$
, we have
 $$\begin{eqnarray}\boldsymbol{u}_{0}^{[1]}\boldsymbol{\cdot }\hat{\boldsymbol{n}}_{\unicode[STIX]{x1D6FC}}=-\!\sin [\unicode[STIX]{x1D6FC}-\unicode[STIX]{x1D703}]\int _{0}^{\infty }\hat{U} (k)\exp \left[\text{i}k\frac{\sin [\unicode[STIX]{x1D6FC}-\unicode[STIX]{x1D703}]}{\cos \unicode[STIX]{x1D6FC}}\left(x-x_{1}\right)-\text{i}t\right]\,\text{d}k\end{eqnarray}$$
and
 $$\begin{eqnarray}\boldsymbol{u}_{0}^{[4]}\boldsymbol{\cdot }\hat{\boldsymbol{n}}_{\unicode[STIX]{x1D6FC}}=\sin \left[\unicode[STIX]{x1D6FC}+\unicode[STIX]{x1D703}\right]\int _{0}^{\infty }\hat{U} (k)\exp \left[\text{i}k\frac{\sin [\unicode[STIX]{x1D6FC}+\unicode[STIX]{x1D703}]}{\cos \unicode[STIX]{x1D6FC}}(x-x_{1})-\text{i}t\right]\,\text{d}k.\end{eqnarray}$$
Substitution of
 $k\rightarrow \unicode[STIX]{x1D6FE}k$
in (3.6), with
 $$\begin{eqnarray}\unicode[STIX]{x1D6FE}=\frac{\sin [\unicode[STIX]{x1D6FC}+\unicode[STIX]{x1D703}]}{\sin [\unicode[STIX]{x1D6FC}-\unicode[STIX]{x1D703}]},\end{eqnarray}$$
such that the exponential terms in (3.6) and (3.7) become identical, and inserting (3.6) and (3.7) into (3.5) gives
 $$\begin{eqnarray}\text{Re}\left[\int _{0}^{\infty }(\hat{U} (\unicode[STIX]{x1D6FE}k)-\hat{U} (k))\exp \left[\text{i}k\frac{\sin [\unicode[STIX]{x1D6FC}+\unicode[STIX]{x1D703}]}{\cos \unicode[STIX]{x1D6FC}}(x-x_{1})-\text{i}t\right]\,\text{d}k\right]=0.\end{eqnarray}$$
Satisfying the free-slip boundary conditions at the four reflecting walls for all times
 $t$
thus imposes the spectral constraint
 $$\begin{eqnarray}\hat{U} (\unicode[STIX]{x1D6FE}k)=\hat{U} (k).\end{eqnarray}$$
Solutions to this functional equation are non-unique (see Beckebanze & Keady Reference Beckebanze and Keady2016, pp. 185–186 for a more rigorous analysis of this functional equation). The non-uniqueness is apparent by writing
 $\hat{U} (k)=P(\log _{\unicode[STIX]{x1D6FE}}(k))$
, which satisfies (3.10) for arbitrary function
 $P$
with period
 $1$
:
 $\hat{U} (\unicode[STIX]{x1D6FE}k)=P(\log _{\unicode[STIX]{x1D6FE}}(\unicode[STIX]{x1D6FE}k))=P(1+\log _{\unicode[STIX]{x1D6FE}}(k))=P(\log _{\unicode[STIX]{x1D6FE}}(k))=\hat{U} (k)$
. For all these spectra (except
 $P=0$
) the velocity expressions (3.2) and (3.4) are non-integrable for points on the inviscid wave attractor,
 $\unicode[STIX]{x1D701}_{n}=0$
(dashed lines in figure 1
b), confirming the results by Rieutord et al. (Reference Rieutord, Georgeot and Valdettaro2001). The exact self-similar wave attractor solution by Maas (Reference Maas2009) in terms of countable infinite Fourier coefficients is an example of such spectrum
 $\hat{U} (k)$
(where
 $P$
is a superposition of Dirac delta functions). The self-similar structure of wave attractors is reflected by the
 $\log _{\unicode[STIX]{x1D6FE}}$
-periodicity of the spectra. Next, we regularize the singularity on the inviscid wave attractor by adding viscous attenuation.
4 Internal shear layer dissipation
Incorporating weak viscous attenuation in an asymptotic wave beam expression was first done by Thomas & Stevenson (Reference Thomas and Stevenson1973), and has been achieved using different procedures (see §6 of Voisin (Reference Voisin2003) for an overview). Here, we determine the effect of viscosity on the spectrum
 $\hat{U} (k)$
– an exponential attenuation factor – and incorporate it in the inviscid spectral decompositions for the velocity field, (3.2) and (3.4). We briefly demonstrate this analysis because of its similarity with the damping mechanisms caused by the rigid walls, presented in §§ 5 and 6.
For notational convenience, we drop the superscript
 $[n]$
, and consider a wave attractor branch with velocity
 $U$
in the along-energy-propagation direction
 $\unicode[STIX]{x1D709}$
, and phase propagation along
 $\unicode[STIX]{x1D701}$
. Upon incorporating continuity and buoyancy equations, one can write the governing equation for
 $U$
as
 $$\begin{eqnarray}-\unicode[STIX]{x0394}U+N^{2}\left(\sin ^{2}\unicode[STIX]{x1D703}~U_{\unicode[STIX]{x1D701}\unicode[STIX]{x1D701}}+2\cos \unicode[STIX]{x1D703}\sin \unicode[STIX]{x1D703}U_{\unicode[STIX]{x1D701}\unicode[STIX]{x1D709}}+\cos ^{2}\unicode[STIX]{x1D703}U_{\unicode[STIX]{x1D709}\unicode[STIX]{x1D709}}\right)=-\text{i}\unicode[STIX]{x1D6FF}^{2}\unicode[STIX]{x1D6E5}^{2}U.\end{eqnarray}$$
This equation is solved at
 $O(\unicode[STIX]{x1D6FF}^{0})$
by
 $U(\unicode[STIX]{x1D701})$
as defined in (3.2), provided the non-dimensional dispersion relation,
 $1=N^{2}\sin ^{2}\unicode[STIX]{x1D703}$
, holds. The velocity function
 $U$
is still an
 $O(\unicode[STIX]{x1D6FF}^{0})$
-solution if we let the spectrum
 $\hat{U} (k)$
to be weakly dependent on the along-beam coordinate
 $\unicode[STIX]{x1D709}$
, that is to say, if
 $\hat{U} _{\unicode[STIX]{x1D709}}\in O(\unicode[STIX]{x1D6FF})$
. We assume
 $\hat{U} _{\unicode[STIX]{x1D709}}\in O(\unicode[STIX]{x1D6FF}^{2})\subset O(\unicode[STIX]{x1D6FF})$
. Equation (4.1) at
 $O(\unicode[STIX]{x1D6FF}^{2})$
then becomes
 $$\begin{eqnarray}2N^{2}\sin \unicode[STIX]{x1D703}\cos \unicode[STIX]{x1D703}U_{\unicode[STIX]{x1D701}\unicode[STIX]{x1D709}}=-\text{i}\unicode[STIX]{x1D6FF}^{2}U_{\unicode[STIX]{x1D701}\unicode[STIX]{x1D701}\unicode[STIX]{x1D701}\unicode[STIX]{x1D701}}.\end{eqnarray}$$
This is solved by
 $$\begin{eqnarray}U=\int _{0}^{\infty }\hat{U} (k,\unicode[STIX]{x1D709})\exp \left[\text{i}k\unicode[STIX]{x1D701}-\text{i}t\right]\,\text{d}k,\quad \hat{U} (k,\unicode[STIX]{x1D709})=\hat{U} (k)\exp \left[-\unicode[STIX]{x1D6FF}^{2}\frac{\tan \unicode[STIX]{x1D703}}{2}k^{3}(\unicode[STIX]{x1D709}-\unicode[STIX]{x1D709}_{0})\right],\end{eqnarray}$$
for arbitrary
 $\hat{U} (k)$
, and where
 $\unicode[STIX]{x1D709}_{0}$
is the along-wave-attractor distance to the virtual localized source. Adding weak viscous attenuation to the 2-D wave attractor velocity field is thus achieved by replacing
 $\hat{U} (k)\rightarrow \hat{U} (k)\exp \left[-\unicode[STIX]{x1D6FF}^{2}(\tan \unicode[STIX]{x1D703}/2)k^{3}(\unicode[STIX]{x1D709}-\unicode[STIX]{x1D709}_{0})\right]$
in the velocity fields (3.2) and (3.4).
Note that the real (imaginary) part
 $U(\unicode[STIX]{x1D701},\unicode[STIX]{x1D709})$
in (4.3) is even (odd) in
 $\unicode[STIX]{x1D701}$
around
 $\unicode[STIX]{x1D701}=0$
. This symmetry is preserved among reflections at horizontal or vertical boundaries, whereas reflections at inclined boundaries break it. All attractors include symmetry-breaking reflections, hence, their velocity fields cannot be symmetric around the inviscid attractor orbit,
 $\unicode[STIX]{x1D701}=0$
, when including viscous attenuation. Describing the wave attractor branches nevertheless by a viscous wave beam emitted from a virtual point source leads to a slight violation of the impermeability boundary condition at the inclined wall. Instead, the viscous wave attractor satisfies an oscillating boundary constraint at the inclined wall, with the spatial scale of the wall oscillation corresponding to the cross-beam thickness. Physically, the internal waves are thus generated by spatially non-uniform oscillations of the inclined wall.
Incorporating the viscous attenuation in the impermeability constraint (3.9) at the reflection point
 $(x_{1},z_{1})$
results in the modified spectral constraint
 $$\begin{eqnarray}\hat{U} (\unicode[STIX]{x1D6FE}k)=\hat{U} (k)\exp \left[-\unicode[STIX]{x1D6FF}^{2}\frac{\tan \unicode[STIX]{x1D703}}{2}k^{3}{\mathcal{L}}\right],\end{eqnarray}$$
where
 ${\mathcal{L}}=L_{a}/\unicode[STIX]{x1D706}_{0}$
is the non-dimensional length of the wave attractor. We consider
 $L_{a}\gg \unicode[STIX]{x1D706}_{0}$
, such that the discussed asymmetry of the attractor is negligible. As a consequence, the attenuation rate
 $-\unicode[STIX]{x1D6FF}^{2}(\tan \unicode[STIX]{x1D703}/2)k^{3}{\mathcal{L}}$
per attractor cycle can be orders of magnitude larger than
 $O(\unicode[STIX]{x1D6FF}^{2}k^{3})$
, namely if
 ${\mathcal{L}}\gtrsim \unicode[STIX]{x1D6FF}^{-1}\gg 1$
(note that by assumption, the most energetic wavenumber is non-dimensionalized to
 $2\unicode[STIX]{x03C0}$
).
The spectral constraint (4.4) for the velocity field is equivalent to the constraint for the buoyancy gradient spectrum,
 $A(k)$
, given by Hazewinkel et al. (Reference Hazewinkel, van Breevoort, Dalziel and Maas2008) upon correcting for a missing factor
 $1/2$
in their viscous attenuation rate, and a missing factor
 $\unicode[STIX]{x1D6FE}^{-1}$
on the right-hand side of their recursive relation
 $A_{n}^{2}=\unicode[STIX]{x1D6FE}^{3}A_{n-1}^{2}$
, where
 $A_{n}$
and
 $A_{n-1}$
are the buoyancy gradient spectra before and after the reflection from the slope, respectively.
The constraint (4.4) for
 $\hat{U} (k)$
now admits integrable finite-energy spectra:
 $$\begin{eqnarray}\hat{U} (k)=P(\log _{\unicode[STIX]{x1D6FE}}(k))\exp \left[-\unicode[STIX]{x1D6FD}_{1}k^{3}\right],\quad \text{with }\unicode[STIX]{x1D6FD}_{1}=\frac{\unicode[STIX]{x1D6FF}^{2}{\mathcal{L}}\tan \unicode[STIX]{x1D703}}{2(\unicode[STIX]{x1D6FE}^{3}-1)}\end{eqnarray}$$
for continuous period-
 $1$
functions
 $P$
. The function
 $P(\log _{\unicode[STIX]{x1D6FE}}(k))$
in the spectral solution (4.5) still reflects the geometric wave focusing, which projects the internal wave field distribution on any wavenumber interval
 $[k,\unicode[STIX]{x1D6FE}k]$
onto
 $[\unicode[STIX]{x1D6FE}k,\unicode[STIX]{x1D6FE}^{2}k]$
, whereas the exponential term accounts for the energy dissipation upon travelling once around the wave attractor. If the energy input occurs within a low wavenumber interval, say
 $I_{\ast }=[k_{\ast },\unicode[STIX]{x1D6FE}k_{\ast }]$
, with distribution
 $E(k)$
, then
 $P(m)=\sqrt{E(\exp [\log (\unicode[STIX]{x1D6FE})m])}$
defines
 $P(m)$
for all
 $m>\log _{\unicode[STIX]{x1D6FE}}(k_{\ast })$
(by periodic continuation) and we take
 $P(m)=0$
for
 $m<\log _{\unicode[STIX]{x1D6FE}}(k_{\ast })$
(no energy at wavenumbers smaller than
 $k_{\ast }$
). If the energy input is spread over a wider interval than
 $I_{\ast }$
, then one can split it into several intervals, define corresponding functions
 $P$
for each interval and superimpose the resulting spectra. For mathematical convenience, we take
 $P(m)$
to be periodic with period
 $1$
in the following.
If the energy input is discrete, say occurring only at fixed wavenumber
 $k_{\ast }$
, then the function
 $P$
must have a spike at
 $\log _{\unicode[STIX]{x1D6FE}}(k_{\ast })$
(a Dirac delta function), and
 $P$
thus consists of a superposition of Dirac delta functions by periodic continuation. The spectrum
 $\hat{U} (k)$
then peaks at wavenumbers
 $k_{\ast }\unicode[STIX]{x1D6FE}^{n}$
for
 $n=0,1,2,\ldots$
. The (discrete) spectral model derived by Hazewinkel et al. (Reference Hazewinkel, van Breevoort, Dalziel and Maas2008) corresponds to this special case. We also discuss this discrete case in the comparison section, § 7.
In the next section, we show that the dissipation at the lateral walls also adds an exponential attenuation factor to the spectral constraint (4.4).
5 Dissipation at lateral walls
In this section we extend the wave attractor velocity field to the lateral walls,
 $y=\pm l_{y}$
, where we apply the no-slip boundary condition. Again, we do this for one (arbitrary) wave attractor branch with interior velocity field
 $\boldsymbol{u}_{0}=\hat{\unicode[STIX]{x1D743}}U$
, and phase speed along
 $\hat{\unicode[STIX]{x1D73B}}$
. Using the stretched coordinate
 $\unicode[STIX]{x1D702}=\unicode[STIX]{x1D6FF}^{-1}y$
, the momentum equations for
 $u_{0}$
and
 $w_{0}$
are given by
 $$\begin{eqnarray}-\!\text{i}u_{0}=-p_{0_{x}}+u_{0_{\unicode[STIX]{x1D702}\unicode[STIX]{x1D702}}},\quad \text{i}\cot ^{2}\unicode[STIX]{x1D703}w_{0}=-p_{0_{z}}+w_{0_{\unicode[STIX]{x1D702}\unicode[STIX]{x1D702}}}.\end{eqnarray}$$
In these two equations, the partial time derivatives have already been replaced by
 $-\text{i}$
. It is the buoyancy,
 $b_{0}=-\text{i}\sin ^{-2}\unicode[STIX]{x1D703}~w_{0}$
, which adds to the time derivative of the vertical velocity component,
 $w_{0}$
, producing the factor
 $-\text{cot}^{2}\unicode[STIX]{x1D703}$
. Outside the boundary layers, the along-wave-beam velocity component
 $U$
is related to the pressure gradient in
 $\unicode[STIX]{x1D701}$
-direction by
 $$\begin{eqnarray}-\!\text{i}\hat{\unicode[STIX]{x1D709}}_{x}U=-\hat{\unicode[STIX]{x1D701}}_{x}p_{0_{\unicode[STIX]{x1D701}}}\quad \Rightarrow \quad p_{0_{\unicode[STIX]{x1D701}}}=-\text{i}\cot \unicode[STIX]{x1D703}U,\end{eqnarray}$$
which solves the momentum equations in the unstretched coordinates at
 $O(\unicode[STIX]{x1D6FF}^{0})$
, i.e. (5.1) without the diffusive terms. Here,
 $\hat{\unicode[STIX]{x1D709}}_{x}=\pm \cos \unicode[STIX]{x1D703}$
is the
 $x$
-component of the unit vector
 $\hat{\unicode[STIX]{x1D743}}$
, and similarly
 $\hat{\unicode[STIX]{x1D701}}_{x}=\pm \sin \unicode[STIX]{x1D703}$
, the sign again depending on the branch. Solving (5.1) with no-slip boundary conditions at the walls,
 $\unicode[STIX]{x1D702}=\pm \unicode[STIX]{x1D6FF}^{-1}l_{y}$
, and interior velocity field
 $\hat{\unicode[STIX]{x1D743}}U$
in the centre plane,
 $\unicode[STIX]{x1D702}=0$
, gives
 $$\begin{eqnarray}u_{0}=\hat{\unicode[STIX]{x1D709}}_{x}\left(1-\frac{\cosh [\text{i}^{-1/2}\unicode[STIX]{x1D702}]}{\cosh [\text{i}^{-1/2}\unicode[STIX]{x1D6FF}^{-1}l_{y}]}\right)U,\quad w_{0}=\hat{\unicode[STIX]{x1D709}}_{z}\left(1-\frac{\cosh [\text{i}^{1/2}\cot \unicode[STIX]{x1D703}\unicode[STIX]{x1D702}]}{\cosh [\text{i}^{1/2}\cot \unicode[STIX]{x1D703}\unicode[STIX]{x1D6FF}^{-1}l_{y}]}\right)U.\end{eqnarray}$$
The presence of stratification (non-zero buoyancy) causes the factor-
 $\cot \unicode[STIX]{x1D703}$
difference in the thicknesses of the boundary layer,
 $\unicode[STIX]{x1D6FF}$
and
 $\unicode[STIX]{x1D6FF}\tan \unicode[STIX]{x1D703}$
, for respectively horizontal and vertical velocity components, making
 $(u_{0},0,w_{0})$
divergent near the walls. This peculiar twist of the stratification on the boundary layer thickness was previously found by Vasiliev & Chashechkin (Reference Vasiliev and Chashechkin2003) in their theoretical study on 3-D internal wave generation by an inclined plane oscillating in the planar direction.
Note that the
 $y$
-momentum equation is satisfied at
 $O(\unicode[STIX]{x1D6FF})$
by choosing an appropriate pressure
 $p_{2}(\unicode[STIX]{x1D702})$
, which is
 $O(\unicode[STIX]{x1D6FF}^{2})$
, and thus negligible. By the continuity equation at
 $O(\unicode[STIX]{x1D6FF}^{0})$
in stretched coordinate
 $\unicode[STIX]{x1D702}$
,
 $$\begin{eqnarray}u_{0_{x}}+w_{0_{z}}=-v_{1_{\unicode[STIX]{x1D702}}},\end{eqnarray}$$
we get the
 $O(\unicode[STIX]{x1D6FF})$
transversal velocity component
 $$\begin{eqnarray}v_{1}=\cos \unicode[STIX]{x1D703}\sin \unicode[STIX]{x1D703}\left(\text{i}^{1/2}\frac{\sinh [\text{i}^{-1/2}\unicode[STIX]{x1D702}]}{\cosh [\text{i}^{-1/2}\unicode[STIX]{x1D6FF}^{-1}l_{y}]}-\text{i}^{-1/2}\tan \unicode[STIX]{x1D703}\frac{\sinh [\text{i}^{1/2}\cot \unicode[STIX]{x1D703}\unicode[STIX]{x1D702}]}{\cosh [\text{i}^{1/2}\cot \unicode[STIX]{x1D703}\unicode[STIX]{x1D6FF}^{-1}l_{y}]}\right)U_{\unicode[STIX]{x1D701}}+V(y).\end{eqnarray}$$
Here,
 $V(y)$
is an undetermined velocity component satisfying
 $V_{\unicode[STIX]{x1D702}}(y)\in O(\unicode[STIX]{x1D6FF})$
, that is to say, slowly varying in the transversal
 $y$
-direction. The impermeability boundary condition (
 $v_{1}=0$
) at both walls translates to
 $$\begin{eqnarray}\displaystyle \left.\begin{array}{@{}c@{}}V(\pm l_{y})=\pm \unicode[STIX]{x1D70E}U_{\unicode[STIX]{x1D701}},\quad \text{with}\\ \unicode[STIX]{x1D70E}=\cos \unicode[STIX]{x1D703}\sin \unicode[STIX]{x1D703}(\text{i}^{-1/2}\tan \unicode[STIX]{x1D703}\tanh [\text{i}^{1/2}\cot \unicode[STIX]{x1D703}\unicode[STIX]{x1D6FF}^{-1}l_{y}]-\text{i}^{1/2}\tanh [\text{i}^{-1/2}\unicode[STIX]{x1D6FF}^{-1}l_{y}]).\end{array}\right\} & & \displaystyle\end{eqnarray}$$
In the limit
 $\unicode[STIX]{x1D6FF}^{-1}l_{y}\gg 1$
, the expression simplifies to
 $\unicode[STIX]{x1D70E}=-\text{i}^{1/2}\sin \unicode[STIX]{x1D703}\text{e}^{\text{i}\unicode[STIX]{x1D703}}$
. The transversal velocity component
 $V$
enters the continuity equation at
 $O(\unicode[STIX]{x1D6FF})$
in the unstretched coordinates:
 $$\begin{eqnarray}U_{\unicode[STIX]{x1D709}}+\unicode[STIX]{x1D6FF}V_{y}=0.\end{eqnarray}$$
Since
 $U$
is
 $y$
-independent, we get
 $V_{yy}=0$
, hence
 $$\begin{eqnarray}V=\frac{\unicode[STIX]{x1D70E}y}{l_{y}}U_{\unicode[STIX]{x1D701}}.\end{eqnarray}$$
Thus, the transversal velocity
 $v$
decays linearly (hence slowly) towards the centre plane,
 $y=0$
, making the velocity field in the interior truly three-dimensional at
 $O(\unicode[STIX]{x1D6FF}l_{y}^{-1})$
.
The transversal divergence,
 $$\begin{eqnarray}V_{y}=\frac{\unicode[STIX]{x1D70E}}{l_{y}}U_{\unicode[STIX]{x1D701}}=\frac{\text{i}\unicode[STIX]{x1D70E}}{l_{y}}\int _{0}^{\infty }k\hat{U} (k)\exp \left[\text{i}k\unicode[STIX]{x1D701}-\text{i}t\right]\,\text{d}k,\end{eqnarray}$$
is balanced by
 $-\unicode[STIX]{x1D6FF}^{-1}U_{\unicode[STIX]{x1D709}}$
, according to the continuity equation (5.7). This means that
 $U$
must be
 $\unicode[STIX]{x1D709}$
-dependent at
 $O(\unicode[STIX]{x1D6FF})$
. For the velocity expressions (3.2) and (3.4) of the wave attractor, this requires the spectrum
 $\hat{U} (k)$
to be replaced by
 $\hat{U} (k)\exp \left[-\text{i}\unicode[STIX]{x1D6FF}l_{y}^{-1}\unicode[STIX]{x1D70E}k\unicode[STIX]{x1D709}\right]$
. Consequently, the velocity
 $U$
decays in the along-wave-beam direction,
 $\unicode[STIX]{x1D709}$
, with
 $\exp [-\unicode[STIX]{x1D6FF}l_{y}^{-1}\unicode[STIX]{x1D70E}_{0}k\unicode[STIX]{x1D709}]$
, where
 $\unicode[STIX]{x1D70E}_{0}=\text{Re}[\text{i}\unicode[STIX]{x1D70E}]>0$
for
 $\unicode[STIX]{x1D703}\in (0,\unicode[STIX]{x03C0}/2)$
. The imaginary part of
 $\text{i}l_{y}^{-1}\unicode[STIX]{x1D70E}$
, which takes both positive and negative values for
 $\unicode[STIX]{x1D703}\in (0,\unicode[STIX]{x03C0}/2)$
, describes a slight change in tilt in phase propagation direction, that changes from
 $\unicode[STIX]{x1D701}$
to
 $\unicode[STIX]{x1D701}-\unicode[STIX]{x1D6FF}l_{y}^{-1}\text{Re}[\unicode[STIX]{x1D70E}]\unicode[STIX]{x1D709}$
.
Adding the damping by the lateral walls to the constraint for the 2-D viscous wave attractor spectrum, (4.4), gives
 $$\begin{eqnarray}\hat{U} (\unicode[STIX]{x1D6FE}k)=\hat{U} (k)\exp \left[\left(-\unicode[STIX]{x1D6FF}^{2}\frac{\tan \unicode[STIX]{x1D703}}{2}k^{3}-\text{i}\unicode[STIX]{x1D6FF}\frac{\unicode[STIX]{x1D70E}}{l_{y}}k\right){\mathcal{L}}\right].\end{eqnarray}$$
This extended equilibrium wave attractor spectrum constraint is solved by
 $$\begin{eqnarray}\hat{U} (k)=P(\log _{\unicode[STIX]{x1D6FE}}(k))\exp \left[-\unicode[STIX]{x1D6FD}_{1}k^{3}-\unicode[STIX]{x1D6FD}_{2}k\right],\quad \text{with }\unicode[STIX]{x1D6FD}_{2}=\frac{\text{i}\unicode[STIX]{x1D6FF}{\mathcal{L}}\unicode[STIX]{x1D70E}}{l_{y}(\unicode[STIX]{x1D6FE}-1)},\end{eqnarray}$$
for all period-
 $1$
functions
 $P$
.
6 Dissipation at reflecting walls
No-slip reflection of 2-D monochromatic internal waves from a wall has been analysed theoretically for wave beams by Kistovich & Chashechkin (Reference Kistovich and Chashechkin1995a ,Reference Kistovich and Chashechkin b ). Whereas dissipation due to internal shear is included in the analysis by Kistovich & Chashechkin (Reference Kistovich and Chashechkin1995a ,Reference Kistovich and Chashechkin b ), they do not account for the energy loss in the viscous boundary layer, which also weakens the reflected wave beam. We are interested in precisely this energy loss at the reflecting wall, such that we can tell when it is negligible.
To begin with, we consider the inviscid free-slip velocity field at the inclined wall,
 $z=(l_{x}-x)\tan \unicode[STIX]{x1D6FC}$
, as this is the most general prescription of a planar reflecting boundary. Expressed in the rotated and shifted coordinate system of the inclined wall,
 $$\begin{eqnarray}\left[\begin{array}{@{}c@{}}x^{\prime }\\ z^{\prime }\end{array}\right]=\left[\begin{array}{@{}cc@{}}\cos \unicode[STIX]{x1D6FC} & -\!\sin \unicode[STIX]{x1D6FC}\\ \sin \unicode[STIX]{x1D6FC} & \cos \unicode[STIX]{x1D6FC}\end{array}\right]\cdot \left[\begin{array}{@{}c@{}}x-x_{1}\\ z-z_{1}\end{array}\right],\end{eqnarray}$$
with
 $z^{\prime }$
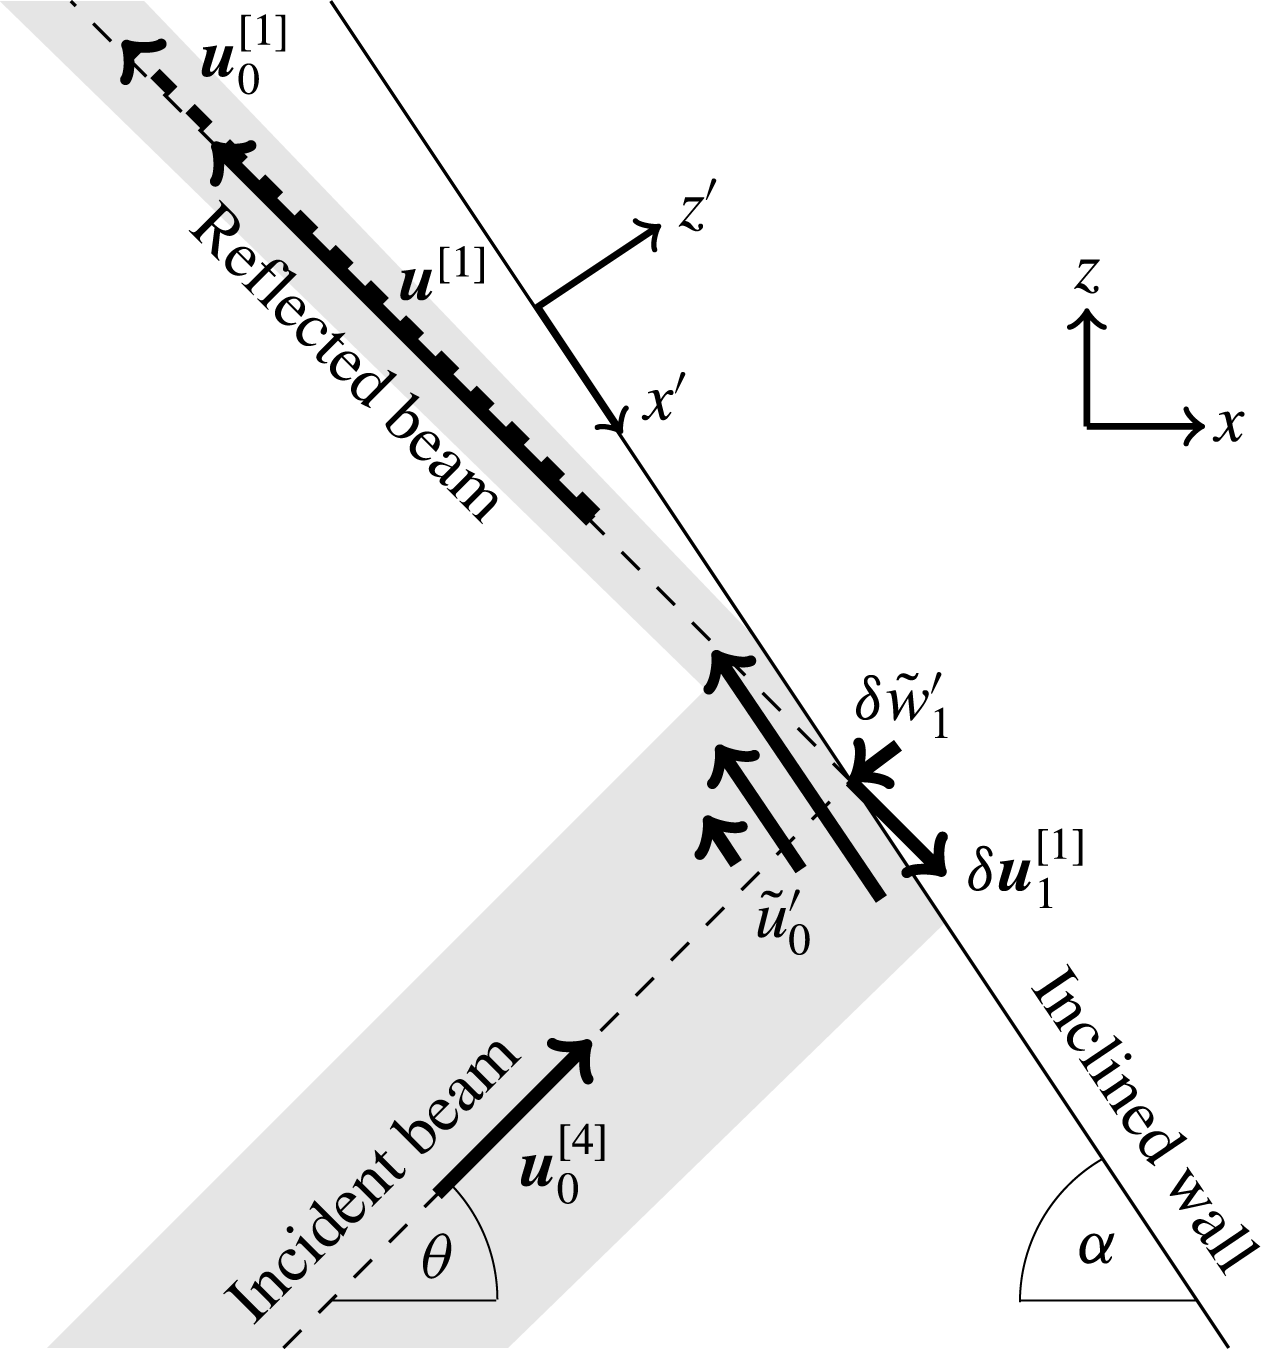
normal to the wall (see sketch in figure 2), the inviscid free-slip velocity field at the inclined wall,
 $z^{\prime }=0$
, is given by
 $$\begin{eqnarray}\boldsymbol{u}_{0}^{[1]}+\boldsymbol{u}_{0}^{[4]}=\hat{\boldsymbol{x}}^{\prime }\tilde{U} (x^{\prime }),\quad \tilde{U} (x^{\prime })=\frac{-\!\sin 2\unicode[STIX]{x1D703}}{\sin [\unicode[STIX]{x1D6FC}-\unicode[STIX]{x1D703}]}\int _{0}^{\infty }\hat{U} (k)\exp \left[\text{i}k\sin [\unicode[STIX]{x1D6FC}+\unicode[STIX]{x1D703}]x^{\prime }-\text{i}t\right]\,\text{d}k,\end{eqnarray}$$
where we have used the velocity expressions from § 3 and the inviscid spectral constraint (3.10).
This sketch illustrates the velocity components involved in the reflection of the wave attractor (dashed line, wave motion confined to shaded area) at the inclined wall (solid line), with arrows pointing in the energy propagation directions. The velocity field of the reflected beam,
 $\boldsymbol{u}^{[1]}=\boldsymbol{u}_{0}^{[1]}+\unicode[STIX]{x1D6FF}\boldsymbol{u}_{1}^{[1]}+O(\unicode[STIX]{x1D6FF}^{2})$
, is – due to focusing – larger in amplitude than the incident beam velocity,
 $\boldsymbol{u}_{0}^{[4]}$
, but weaker than the free-slip reflected velocity field,
 $\boldsymbol{u}_{0}^{[1]}$
(dashed arrow). The velocity component
 $\tilde{u} _{0}^{\prime }$
, pointing along the wall, annihilates the free-slip velocity field
 $\boldsymbol{u}_{0}^{[1]}+\boldsymbol{u}_{0}^{[4]}$
at the wall,
 $z^{\prime }=0$
, and decays exponentially towards the interior. By mass conservation, it generates the velocity component
 $\tilde{w}_{1}^{\prime }$
at
 $O(\unicode[STIX]{x1D6FF})$
, normal to the wall, which itself is cancelled by
 $\hat{\boldsymbol{z}^{\prime }}\boldsymbol{u}_{1}^{[1]}$
at
 $z^{\prime }=0$
. Contrary to
 $\tilde{u} _{0}$
and
 $\tilde{w}_{1}$
, the component
 $\boldsymbol{u}_{1}^{[1]}$
does not decay towards the interior; it is the correction on the reflected beam due to damping by the no-slip reflection.

The task is now to find a quasi-2-D correction velocity field,
 $\tilde{\boldsymbol{u}}=[\tilde{u} ,0,\tilde{w}]$
, such that it annihilates the free-slip velocity (6.2) at the inclined wall,
 $z^{\prime }=0$
, and decays exponentially towards the interior. Using the stretched coordinate
 $Z=\unicode[STIX]{x1D6FF}^{-1}z^{\prime }$
, the
 $x^{\prime }$
-momentum equation at
 $O(\unicode[STIX]{x1D6FF}^{0})$
, governing the velocity component
 $\tilde{u} _{0}^{\prime }=\tilde{u} _{0}\cos \unicode[STIX]{x1D6FC}-\tilde{w}_{0}\sin \unicode[STIX]{x1D6FC}$
in the direction along the inclined wall, becomes
 $$\begin{eqnarray}\text{i}\left(\frac{\sin ^{2}\unicode[STIX]{x1D6FC}}{\sin ^{2}\unicode[STIX]{x1D703}}-1\right)\tilde{u} _{0}^{\prime }=\tilde{u} _{0_{ZZ}}^{\prime }.\end{eqnarray}$$
As previously in (5.1), we have replaced the partial time derivatives with
 $-\text{i}$
, and used
 $\tilde{b}_{0}=\text{i}(\sin \unicode[STIX]{x1D6FC}/\sin ^{2}\unicode[STIX]{x1D703})\tilde{u} _{0}^{\prime }$
. The pressure gradient is absent because the pressure is not modified by the no-slip boundary. Solving (6.3) for
 $\tilde{\boldsymbol{u}}_{0}=\hat{\boldsymbol{x}^{\prime }}\tilde{u} _{0}^{\prime }$
such that it annihilates (6.2) at
 $z^{\prime }=Z=0$
and vanishes in the interior,
 $Z^{\prime }\rightarrow -\infty$
, gives
 $$\begin{eqnarray}\tilde{\boldsymbol{u}}_{0}=-\hat{\boldsymbol{x}^{\prime }}\tilde{U} (x^{\prime })\exp \left[\text{i}^{1/2}\unicode[STIX]{x1D707}Z\right]\quad \text{with }\unicode[STIX]{x1D707}=\sqrt{\frac{\sin ^{2}\unicode[STIX]{x1D6FC}}{\sin ^{2}\unicode[STIX]{x1D703}}-1}.\end{eqnarray}$$
By the continuity equation at
 $O(\unicode[STIX]{x1D6FF}^{0})$
in stretched coordinate
 $Z$
,
 $$\begin{eqnarray}\tilde{u} _{0_{x^{\prime }}}^{\prime }+\tilde{w}_{1_{Z}}^{\prime }=0,\end{eqnarray}$$
with
 $\tilde{w}_{1}^{\prime }$
the
 $O(\unicode[STIX]{x1D6FF})$
-velocity component normal to the wall, we get
 $$\begin{eqnarray}\tilde{w}_{1}^{\prime }=i^{-1/2}\unicode[STIX]{x1D707}^{-1}\tilde{U} _{x^{\prime }}(x^{\prime })\exp \left[\text{i}^{1/2}\unicode[STIX]{x1D707}Z\right]+F(x^{\prime },z^{\prime }).\end{eqnarray}$$
Here,
 $F$
is an undetermined velocity component, with spatial variations of
 $O(1)$
, similar to
 $V$
in the previous section. Previously, we were able to find a linear function in
 $y$
for
 $V$
, such that the impermeability boundary conditions at opposite lateral walls are satisfied. This procedure fails here (because there is no opposite inclined wall), and we must take
 $F=0$
. As a consequence,
 $\tilde{w}_{1}^{\prime }$
describes an apparent flow through the inclined wall,
 $z^{\prime }=Z=0$
. This apparent flow through the wall,
 $$\begin{eqnarray}\tilde{w}_{1}^{\prime }(x^{\prime },Z=0)=-\text{i}^{1/2}\frac{\unicode[STIX]{x1D6FE}\sin 2\unicode[STIX]{x1D703}}{\unicode[STIX]{x1D707}}\int _{0}^{\infty }k\hat{U} (k)\exp \left[\text{i}k\sin [\unicode[STIX]{x1D6FC}+\unicode[STIX]{x1D703}]x^{\prime }-\text{i}t\right]\,\text{d}k,\end{eqnarray}$$
can be balanced by absorbing some
 $O(\unicode[STIX]{x1D6FF})$
-fraction of the incident wave beam (see also illustration in figure 2). Consequently, the viscously reflected beam with velocity field
 $\boldsymbol{u}^{[1]}=\boldsymbol{u}_{0}^{[1]}+\unicode[STIX]{x1D6FF}\boldsymbol{u}_{1}^{[1]}+O(\unicode[STIX]{x1D6FF}^{2})$
is weaker than the inviscid velocity field,
 $\boldsymbol{u}_{0}^{[1]}$
. We write
 $$\begin{eqnarray}\boldsymbol{u}^{[1]}=\hat{\unicode[STIX]{x1D709}}_{1}\int _{0}^{\infty }\hat{U} (k)\exp [-\unicode[STIX]{x1D6FF}R_{\unicode[STIX]{x1D6FC}}k]\exp \left[\text{i}k\unicode[STIX]{x1D701}_{1}-\text{i}t\right]\,\text{d}k,\end{eqnarray}$$
such that
 $$\begin{eqnarray}\boldsymbol{u}_{1}^{[1]}=-\hat{\unicode[STIX]{x1D709}}_{1}R_{\unicode[STIX]{x1D6FC}}\int _{0}^{\infty }k\hat{U} (k)\exp \left[\text{i}k\unicode[STIX]{x1D701}_{1}-\text{i}t\right]\,\text{d}k,\end{eqnarray}$$
where
 $\unicode[STIX]{x1D6FF}\text{Re}[R_{\unicode[STIX]{x1D6FC}}]>0$
is the dissipation rate (per wavenumber) due to the reflection.
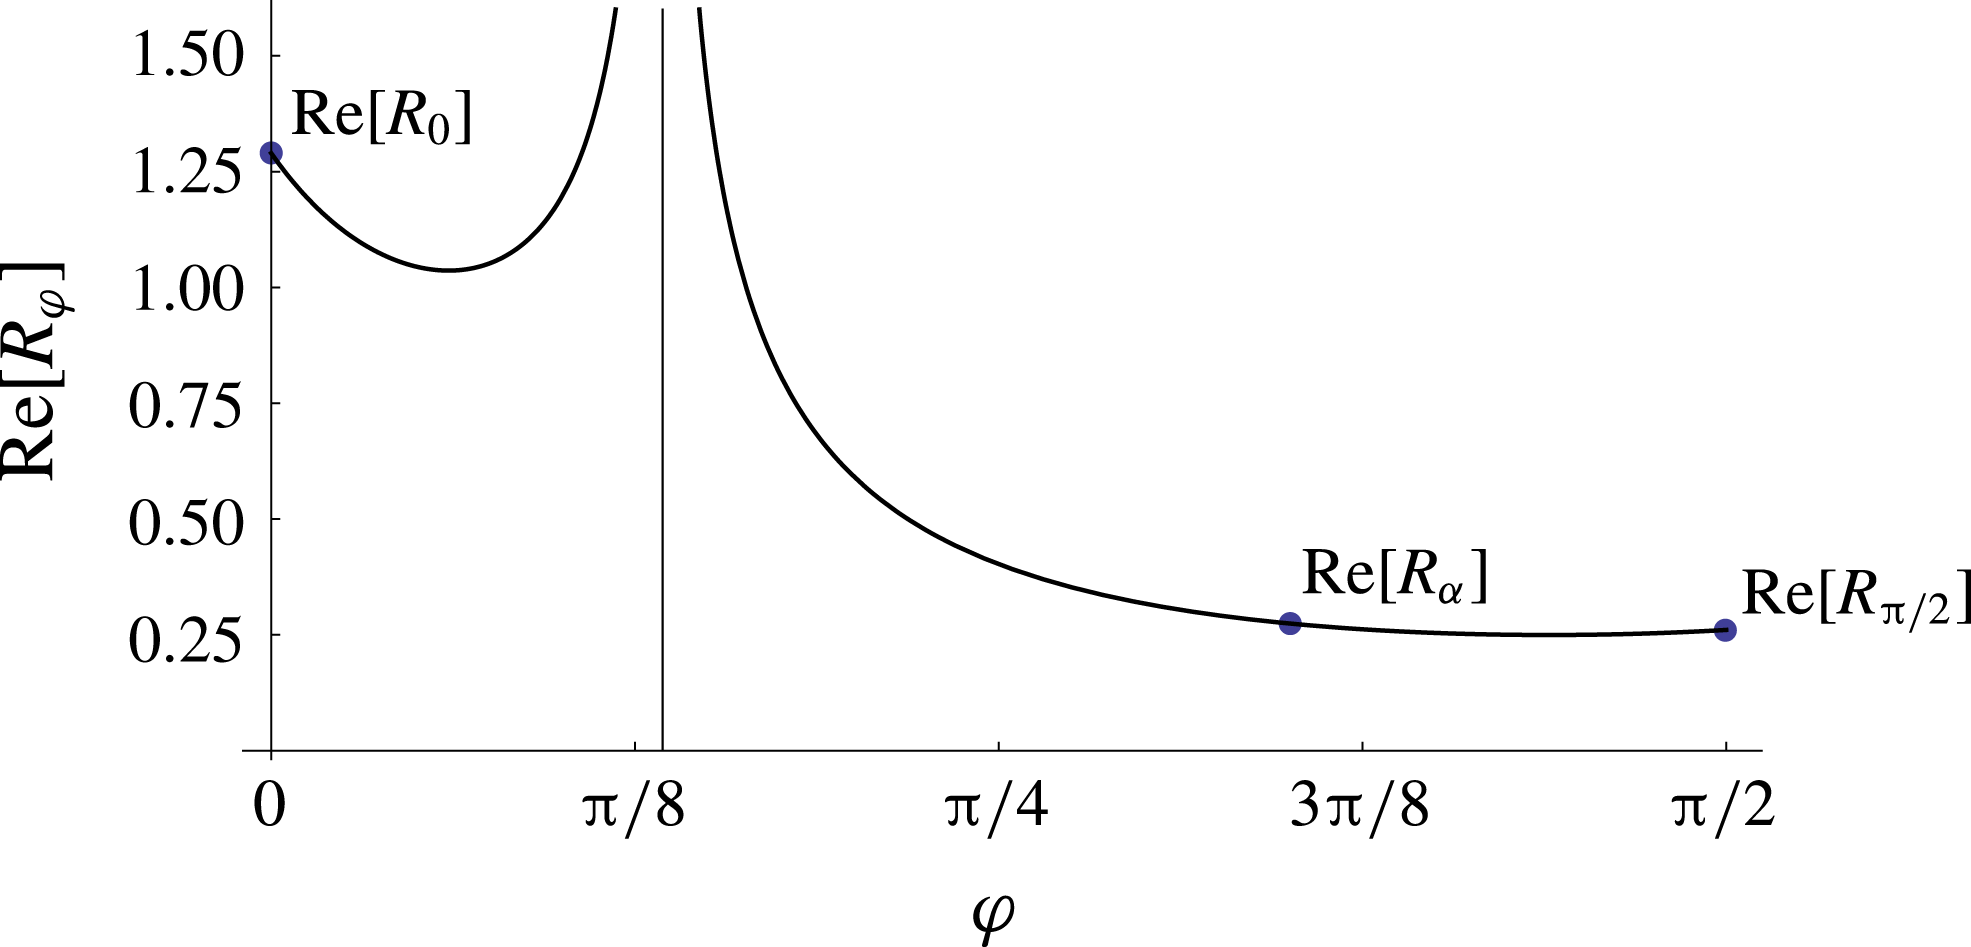
This figure presents the
 $O(\unicode[STIX]{x1D6FF})$
-dissipation rate,
 $\text{Re}[R_{\unicode[STIX]{x1D711}}]$
, as a function of the angle
 $\unicode[STIX]{x1D711}$
of the reflecting wall with respect to the vertical, for
 $\unicode[STIX]{x1D703}=0.42$
rad. As to be expected,
 $R_{\unicode[STIX]{x1D711}}$
blows up at the critical reflection angle,
 $\unicode[STIX]{x1D711}=\unicode[STIX]{x1D703}=0.42$
(vertical asymptote). The total dissipation by no-slip reflections of a wave attractor such as in figure 1(a) is the sum of dissipation rates at the bottom (
 $\text{Re}[R_{0}]$
), the inclined wall (
 $\text{Re}[R_{\unicode[STIX]{x1D6FC}}],$
here
 $\unicode[STIX]{x1D6FC}=1.1$
) and the vertical wall (
 $\text{Re}[R_{\unicode[STIX]{x03C0}/2}]$
).

The complex-valued reflection dissipation rate
 $R_{\unicode[STIX]{x1D6FC}}$
is determined by the impermeability condition at
 $O(\unicode[STIX]{x1D6FF})$
:
 $$\begin{eqnarray}\tilde{w}_{1}^{\prime }+\boldsymbol{u}_{1}^{[1]}\boldsymbol{\cdot }\hat{\boldsymbol{z}^{\prime }}=0\quad \text{at }z^{\prime }=0.\end{eqnarray}$$
Substituting (6.7) and (6.9) into (6.10) and noting that on the inclined wall,
 $z^{\prime }=0$
, we have
 $\unicode[STIX]{x1D701}_{1}=\sin [\unicode[STIX]{x1D6FC}-\unicode[STIX]{x1D703}]x^{\prime }$
, gives
 $$\begin{eqnarray}R_{\unicode[STIX]{x1D6FC}}=\text{i}^{1/2}\frac{\sin 2\unicode[STIX]{x1D703}}{\unicode[STIX]{x1D707}\sin [\unicode[STIX]{x1D6FC}-\unicode[STIX]{x1D703}]}.\end{eqnarray}$$
We can readily use expression (6.11) to determine the dissipation rates due to the reflections at respectively the flat bottom (
 $\unicode[STIX]{x1D6FC}\rightarrow 0$
) and the vertical wall (
 $\unicode[STIX]{x1D6FC}\rightarrow \unicode[STIX]{x03C0}/2$
):
 $$\begin{eqnarray}R_{0}=\text{i}^{-1/2}2\cos \unicode[STIX]{x1D703}\quad \text{and}\quad R_{\unicode[STIX]{x03C0}/2}=\text{i}^{1/2}2\sin \unicode[STIX]{x1D703}\tan \unicode[STIX]{x1D703}=\text{i}\tan ^{2}\unicode[STIX]{x1D703}R_{0}.f\end{eqnarray}$$
The dissipation rate (real part of (6.11)) as a function of the angle of the reflecting boundary is shown in figure 3. In laboratory and numerical set-ups, the surface of the fluid,
 $z=h$
, is typically free, so the most appropriate constraint on this boundary is free slip (because vertical variations are negligibly small), i.e. no dissipation by reflection. The full viscous 3-D equilibrium wave attractor spectrum must thus satisfy
 $$\begin{eqnarray}\hat{U} (\unicode[STIX]{x1D6FE}k)=\hat{U} (k)\exp \left[-\unicode[STIX]{x1D6FF}^{2}\left({\mathcal{L}}/2\tan \unicode[STIX]{x1D703}\right)k^{3}-\unicode[STIX]{x1D6FF}\left(\text{i}\unicode[STIX]{x1D70E}l_{y}^{-1}{\mathcal{L}}+R_{\unicode[STIX]{x1D6FC}}+R_{0}+R_{\unicode[STIX]{x03C0}/2}\right)k\right].\end{eqnarray}$$
Solutions to this spectral constraint are given by
 $$\begin{eqnarray}\hat{U} (k)=P(\log _{\unicode[STIX]{x1D6FE}}(k))\exp \left[-\unicode[STIX]{x1D6FD}_{1}k^{3}-\unicode[STIX]{x1D6FD}_{2}k-\unicode[STIX]{x1D6FD}_{3}k\right],\quad \text{with }\unicode[STIX]{x1D6FD}_{3}=\unicode[STIX]{x1D6FF}\frac{R_{\unicode[STIX]{x1D6FC}}+R_{0}+R_{\unicode[STIX]{x03C0}/2}}{\unicode[STIX]{x1D6FE}-1},\end{eqnarray}$$
for arbitrary period-
 $1$
functions
 $P$
. If not stated otherwise we always consider
 $P=$
constant in the following.
7 Comparison with laboratory experiments and 3-D simulations
We validate our theoretical results by comparing it with experimental spectral results by Hazewinkel et al. (Reference Hazewinkel, van Breevoort, Dalziel and Maas2008) and Brouzet (Reference Brouzet2016) in §§ 7.1 and 7.2 respectively. Section 7.2 also includes a comparison with fully 3-D numerical simulations, replicating one of the experiments by Brouzet (Reference Brouzet2016).
7.1 Comparison with laboratory experiment by Hazewinkel et al. (Reference Hazewinkel, van Breevoort, Dalziel and Maas2008)
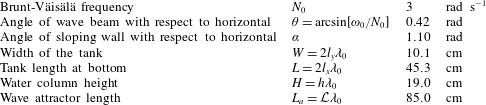
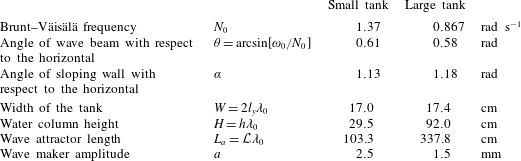
Hazewinkel et al. (Reference Hazewinkel, van Breevoort, Dalziel and Maas2008) studied the equilibrium spectrum of internal wave attractors in the classical trapezoidal set-up, both in the laboratory and with a simple model. The parameter values relevant for the comparison with our theory are listed in table 1. Using synthetic schlieren techniques, they directly measured the buoyancy gradient field,
 $[b_{x},b_{z}]$
. Spatial variations of this buoyancy gradient field for each wave attractor branch are primarily in the corresponding phase propagation directions,
 $\unicode[STIX]{x1D701}$
. Figure 4 reproduces the normalized modulus of the observed spectrum
 $\hat{A}(k)=(-\text{i}/\sin \unicode[STIX]{x1D703})k\hat{U} (k)$
of the buoyancy gradient,
 $b_{\unicode[STIX]{x1D701}}$
, pointing in the phase propagation direction of the first wave attractor branch, along transect
 $S_{1}$
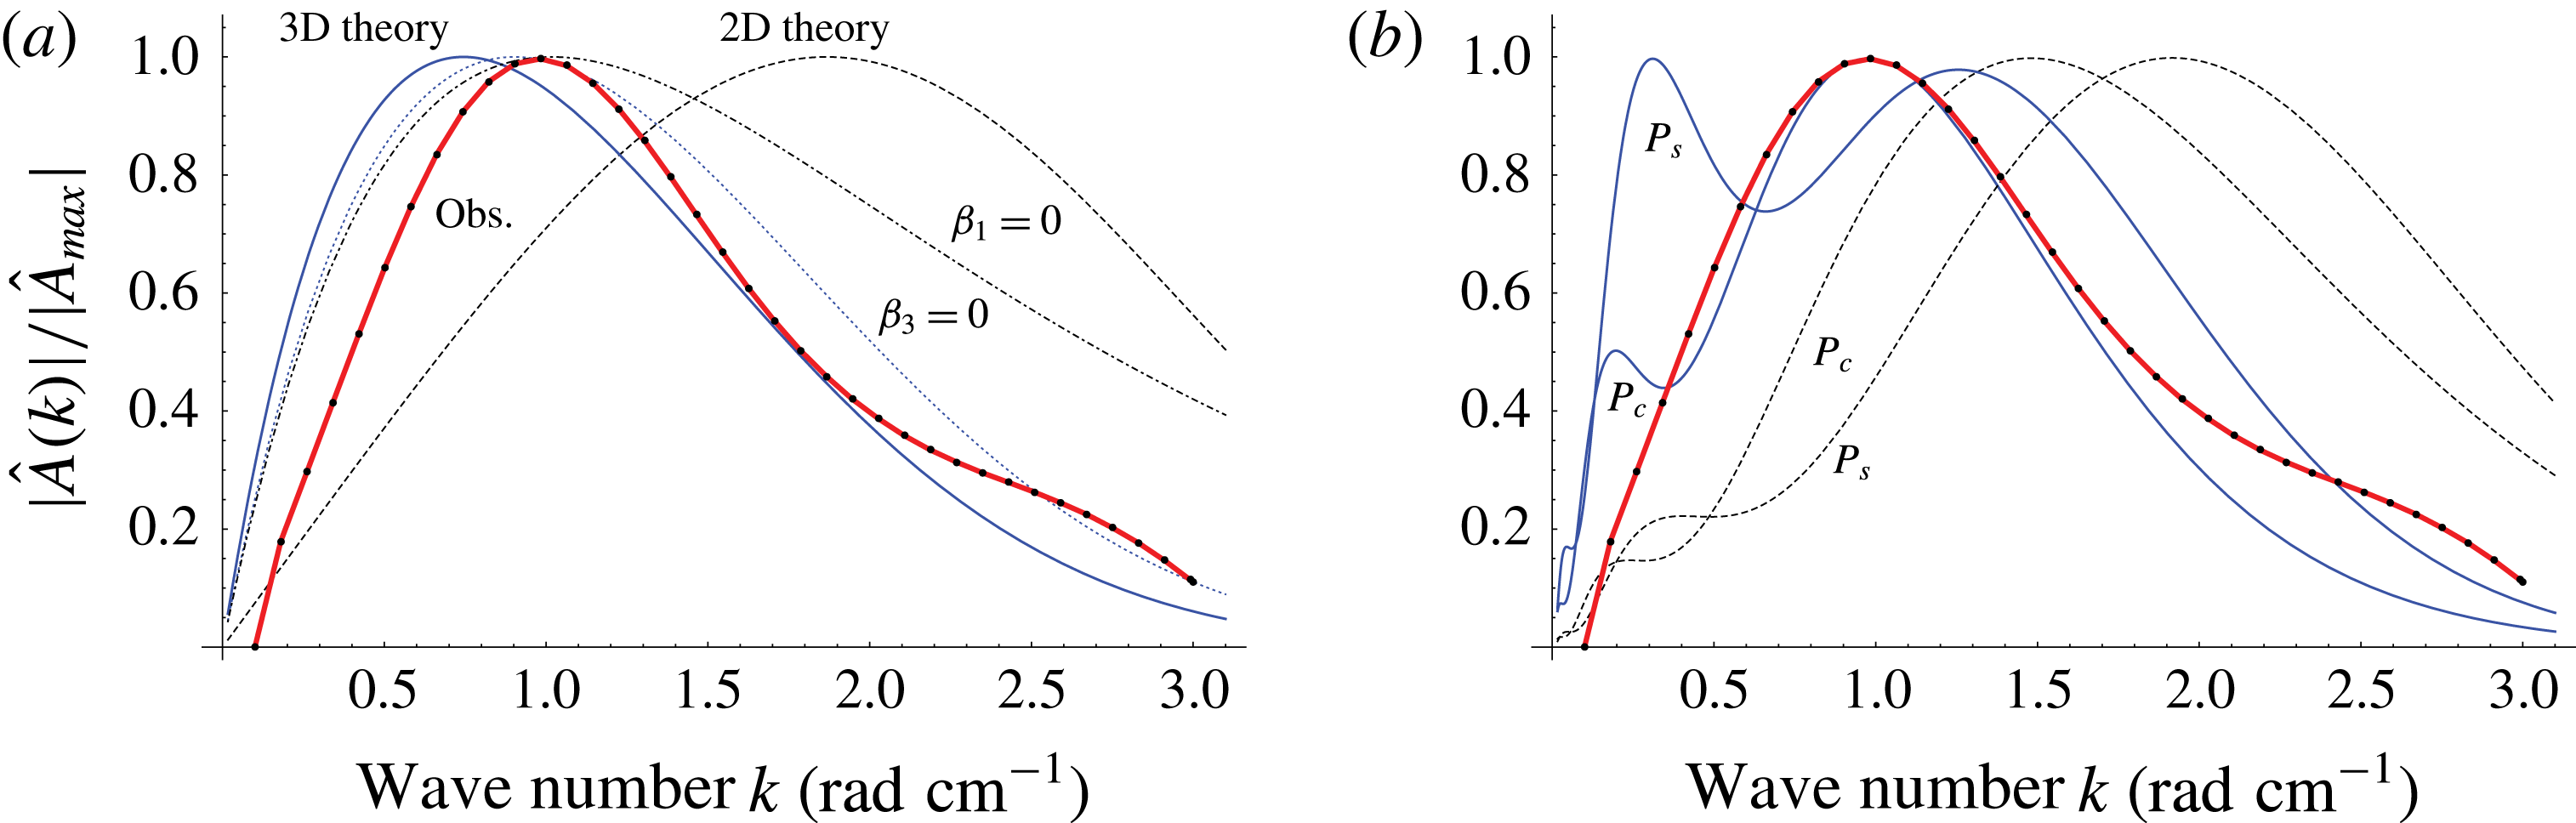
as shown in figure 1(a) in Hazewinkel et al. (Reference Hazewinkel, van Breevoort, Dalziel and Maas2008). For comparison, figure 4 shows our theoretical 3-D wave attractor spectrum (thick blue solid line) for different period-
 $1$
functions
 $P$
in (6.14). Additionally, we present the theoretical 2-D spectrum including internal shear dissipation only ((4.5), dashed line in figure 4), which corresponds to the 2-D theoretical spectrum by Hazewinkel et al. (Reference Hazewinkel, van Breevoort, Dalziel and Maas2008), their (4.6), for
 $P=$
constant and upon correcting mathematical mistakes in their analysis, mentioned in § 4. Note that Hazewinkel et al. (Reference Hazewinkel, van Breevoort, Dalziel and Maas2008) seemingly achieved a good fit in their figure 6 because they changed their input wavenumber,
 $k_{in}=2\unicode[STIX]{x03C0}/H$
(in their notation
 $k_{0}$
), while keeping the same
 $k_{in}$
fixed in their (4.6). Correct application of their theory reveals that their theoretical spectrum does not depend on their input wavenumber,
 $k_{in}$
, and that the theoretical 2-D spectrum predicts the attractor wavelength to be a factor 2 smaller than observed. The mismatch between the 2-D spectra and observation supports our striking and unexpected conclusion that dissipation at the rigid walls must be substantial.
To illustrate the importance of the different dissipation mechanisms, we also present in figure 4 the spectra excluding dissipation upon reflection ((5.11), dotted blue line) and excluding internal shear dissipation ((6.14) with
 $\unicode[STIX]{x1D6FD}_{1}=0$
, black dashed-dotted line) for
 $P=$
constant.
Three conclusions can be directly inferred from the comparison in figure 4.
Parameter values of the laboratory experiment by Hazewinkel et al. (Reference Hazewinkel, van Breevoort, Dalziel and Maas2008).

Normalized modulus of the buoyancy gradient spectra,
 $\hat{A}(k)\propto k\hat{U} (k)$
. The red curves with black dots reproduce the observed spectrum by Hazewinkel et al. (Reference Hazewinkel, van Breevoort, Dalziel and Maas2008). Theoretical spectra are presented in plot (a) with
 $P=$
constant and in plot (b) with
 $P_{s}(k)=3+\sin (2\unicode[STIX]{x03C0}k)$
,
 $P_{c}(k)=3+\cos (2\unicode[STIX]{x03C0}k)$
: 3-D spectrum ((6.14), thick blue) and 2-D spectrum ((4.5), black dashed). Panel (a) also shows the spectra excluding dissipation upon reflection ((5.11), i.e.
 $\unicode[STIX]{x1D6FD}_{3}=0$
, dotted blue) and excluding internal shear dissipation ((6.14) with
 $\unicode[STIX]{x1D6FD}_{1}=0$
, black dashed-dotted).

-
(i) The full 3-D wave attractor spectrum fits the observed spectrum reasonably well for the choices
 $P=$
constant and
$P(k)=P_{c}(k)=3+\cos (2\unicode[STIX]{x03C0}k)$
. The contact surface of the wave attractor with the tank boundaries (shaded surfaces in figure 1
a) consists primarily (
${\sim}73\,\%$
) of those at the lateral walls. It thus comes as no surprise that in this particular laboratory set-up, with
$\unicode[STIX]{x1D6FD}_{3}\approx 0.28\unicode[STIX]{x1D6FD}_{2}$
, neglecting dissipation at the reflecting walls still results in good fits with the observation (see also relatively small difference between solid and dotted blue lines in figure 4
a). Hence, dissipation occurs primarily in the internal shear layers and in the lateral boundary layers, and secondarily also at the reflecting rigid boundaries.
-
(ii) Neglecting internal shear dissipation ((6.14) with
$\unicode[STIX]{x1D6FD}_{1}=0$
, dashed-dotted line) leads to a spectrum whose peak coincides with the observation. However, at large wavenumbers, this spectrum diverges from the observation. This indicates that the neglected internal shear dissipation, which is cubic in wavenumber
$k$
, is the dominant dissipation mechanism at high wavenumbers in the laboratory experiment. -
(iii) The discrepancy between the full 3-D spectrum for
$P_{c}(k)=3+\cos (2\unicode[STIX]{x03C0}k)$
and
$P_{s}(k)=3+\sin (2\unicode[STIX]{x03C0}k)$
shows that the shape of the theoretical spectrum depends strongly on this period-
$1$
function,
$P$
. As discussed in § 4, the precise nature of the
$P$
is set by the spatial structure of the energy input, i.e. by the geometry of the tank used in the experiment by Hazewinkel et al. (Reference Hazewinkel, van Breevoort, Dalziel and Maas2008). This means that the energy input strongly influences the spatial structure of the equilibrium wave attractor, and upscaling of a laboratory set-up generally does not leave the wave attractor invariant. Despite the sensitivity on
$P$
, we can only achieve reasonable fits between theory and observations if we include dissipation at the rigid boundaries, which is dominated by lateral walls dissipation.








7.2 Comparison with laboratory experiments by Brouzet (Reference Brouzet2016) and 3-D simulation
Parameter values of the laboratory experiments by Brouzet (Reference Brouzet2016).
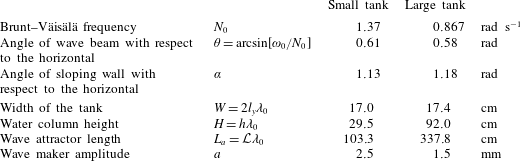
Following Scolan et al. (Reference Scolan, Ermanyuk and Dauxois2013), Brouzet (Reference Brouzet2016) performed laboratory experiments on wave attractors in a trapezoidal tank using a wave generator. They especially carried out experiments in two trapezoidal tanks with almost identical lateral width (
 $W$
), but with differences in height (
 $H$
) and attractor length (
 $L_{a}$
) of approximately a factor 3 (see table 2 for parameter values). Here, we briefly describe the experiments for a comparison with our theory
In both experimental set-ups, the internal waves are generated by a sinusoidally shaped wave maker (Gostiaux et al.
Reference Gostiaux, Didelle, Mercier and Dauxois2007) situated on the left side of the tank, with the vertical wavelength corresponding to half the height of the water column, so
 $k_{in}=\unicode[STIX]{x03C0}/H\cos \unicode[STIX]{x1D703}$
. Previous experiments (Scolan et al.
Reference Scolan, Ermanyuk and Dauxois2013), also reported in Brouzet et al. (Reference Brouzet, Ermanyuk, Joubaud, Sibgatullin and Dauxois2016a
,Reference Brouzet, Sibgatullin, Scolan, Ermanyuk and Dauxois
b
, Reference Brouzet, Ermanyuk, Joubaud, Pillet and Dauxois2017a
), show that triadic resonance instabilities arise if the wave maker amplitude,
 $a$
, exceeds a critical values in the range
 $2.5$
–3 mm, dependent on the position of the attractor. Both experiments presented here are stable, and a steady state is reached after a spin-up of approximately
 $20$
wave periods.
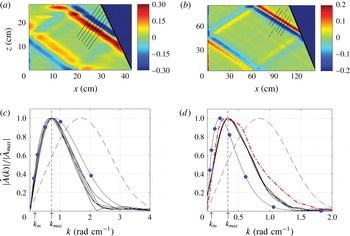
Figure 5(a,b) presents two snapshots of the observed buoyancy gradient field,
 $b_{\unicode[STIX]{x1D701}}$
, in steady state, with the derivative taken in the phase propagation direction of the first branch. The Fourier spectra along the depicted transects are shown in figure 5(c,d). (The experimental non-dimensional buoyancy gradient
 $b_{\unicode[STIX]{x1D701}}=g/(\unicode[STIX]{x1D70C}_{0}N_{0}^{2})\unicode[STIX]{x1D70C}_{\unicode[STIX]{x1D701}}^{\prime }$
, where
 $\unicode[STIX]{x1D70C}_{0}=1000$
kg m
 $^{-3}$
the background density,
 $g$
gravitational acceleration, coordinate
 $\unicode[STIX]{x1D701}$
now understood dimensional, and
 $\unicode[STIX]{x1D70C}^{\prime }$
the density perturbation, is first projected onto 1000 data points along each depicted transect; then it is Fourier transformed using Fast Fourier transform in MATLAB with zero padding to get 10 000 data points in Fourier space.) For comparison, figure 5(c,d) also present the theoretical spectra with and without rigid-wall dissipation for
 $P=$
constant (solid and dashed lines, respectively). Figure 5(d) also includes the spectrum of the numerical simulation (simulation output is directly saved on an inclined
 $(\unicode[STIX]{x1D701},y)$
-plane (
 $40\times 173$
grid-points), which intersects the first wave attractor branch at the dot-dashed transect in figure 5(b). The simulated density perturbation is differentiated with respect to
 $\unicode[STIX]{x1D701}$
, averaged in the
 $y$
-direction (excluding 10 grid points in lateral boundary layer) and
 $\unicode[STIX]{x1D714}_{0}$
-Hilbert filtered over the last 63 wave periods of the simulation (simulation lasted 107 wave periods), before computing the spectrum (with zero padding to get 120 data points in Fourier space).) for the large tank set-up, discussed below.
The dots on the solid blue line of the fully dissipative spectra indicate the hypothetical spikes of
 $\hat{U} (k)$
at
 $k=\unicode[STIX]{x1D6FE}^{n}k_{in}$
,
 $n=0,1,2,\ldots$
, which occur according to our theory if the energy is confined to precisely
 $k_{in}$
. Such spikes are by no means visible in the experimental and simulated spectra. We believe that due to imperfections in the laboratory set-up and numerics in the simulation, the experimental and simulated energy inputs do not occur precisely at
 $k_{in}$
, but over a continuous range of wavenumbers near
 $k_{in}$
. The spectra with
 $P=$
constant capture such continuous energy input over a range of wavenumbers. We have no reason to believe that
 $P=$
constant is the best representation of the actual energy input. Different period-
 $1$
functions
 $P$
(not shown) lead to similar discrepancies between 3-D theory and experimental spectra in figure 5(d).
Experimental results by Brouzet (Reference Brouzet2016) in the small and large tank set-ups. (a,b) Snapshots of the buoyancy gradient,
 $b_{\unicode[STIX]{x1D701}}$
, in the phase propagation direction
 $\unicode[STIX]{x1D701}$
of first branch, derived from observed field
 $[b_{x},b_{z}]$
after Hilbert filtering at
 $\unicode[STIX]{x1D714}_{0}$
. (c,d) Normalized modulus of experimental buoyancy gradient spectra,
 $|\hat{A}|/|\hat{A}_{max}|$
, (black lines) along the depicted transects of the first attractor branch in (a,b). For comparison, corresponding 3-D theoretical spectra (solid blue) and 2-D spectra (dashed blue) for
 $P=$
constant; the blue dots indicate the discrete 3-D spectra with energy input only at
 $k_{in}$
. The red dot-dashed curve in (d) shows the numerical spectrum taken along the dot-dashed transect in (b) after
 $\unicode[STIX]{x1D714}_{0}$
-Hilbert filtering simulated steady-state time series of the large tank set-up. See text for additional explanation.

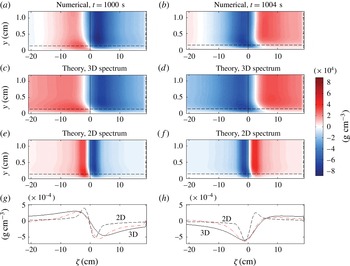
Snapshots (a–f) of the density perturbation (
 $=$
proportional to buoyancy
 $b$
) in an inclined plane,
 $\unicode[STIX]{x1D709}=$
constant, along the phase propagation direction
 $\unicode[STIX]{x1D701}$
(dot-dashed transect in figure 5
b), and in the vicinity of one lateral wall (here
 $y=0$
). Simulated density perturbation at times
 $t=1000$
s (a), and 0.3 wave periods later, at
 $t=1004$
s (b), are plotted on top of corresponding theoretical density perturbation for the fully dissipative attractor (3-D spectrum, plots c,d) and for internal shear dissipation only (2-D spectrum, plots e,f). The (buoyancy) boundary layer widths,
 $d_{0}\tan \unicode[STIX]{x1D703}=0.13$
cm and
 $d_{0}\unicode[STIX]{x1D707}$
at respectively lateral wall (
 $y=0$
) and inclined wall (
 $\unicode[STIX]{x1D701}=19$
cm), are indicated by the dashed lines; the solid line shows the centre of the wave attractor. In (g) and (h) comparison of simulated (dot-dashed red) and theoretical (3-D in solid, 2-D in dashed) density perturbations in the panels above along
 $y=d_{0}\tan \unicode[STIX]{x1D703}=0.13$
cm (dashed in above graphs).

Despite small discrepancies in figure 5(d), it is clear that for both experimental set-ups the correspondence between the observation and our 3-D model is best. This supports our new conclusion that dissipation at the rigid walls (mostly at the lateral walls) is significant even for very small ratios of boundary layer thickness over lateral width,
 $d_{0}/W\sim O(10^{-2})$
.
Fully 3-D simulations are run for the ‘large tank’ set-up (see table 2) with the method of spectral elements, which combines the accuracy and high resolution of spectral methods with geometric flexibility of finite element methods (see Brouzet et al. (Reference Brouzet, Sibgatullin, Scolan, Ermanyuk and Dauxois2016b
), Sibgatullin & Kalugin (Reference Sibgatullin and Kalugin2016) for details on the numerical method). Figure 6 presents two snapshots of the steady-state buoyancy field in a
 $\unicode[STIX]{x1D709}=$
constant plane (dot-dashed transect in figure 5
d), intersecting the first wave attractor branch in the phase-propagating direction,
 $\unicode[STIX]{x1D701}$
. We present only
 ${\sim}6$
% of the transversal wall-to-wall distance, to magnify the boundary layer structure near the lateral wall (here at
 $y=0$
). For comparison, we show the theoretical buoyancy field for spectra with and without rigid-wall dissipation. The theoretical buoyancy field for the fully dissipative spectra (middle panels, maximum amplitude scaled to maximum amplitude of simulation) agrees with the numerical simulation remarkably well. In contrast, neglecting rigid-wall dissipation leads to a much thinner wave attractor, which might even be unstable to triadic resonance instabilities for this experiment.
Figure 6 also visualizes the complex structure of the buoyancy field in the lateral boundary layer, which is of relevance to secondary processes, such as mean flow generation. In fact, we find that the transversal velocity component,
 $v$
, (not shown) is dominated by a mean component. Our linear theory cannot capture the induced mean flow, discussed in §4.4 of Brouzet (Reference Brouzet2016), which increases continuously throughout the simulated 107 wave periods.
Last but not least: the comparison of buoyancy gradient spectra in figure 5(d) shows that simulated and experimentally observed spectral properties agree very well, thereby confirming that wall dissipation is also important for the numerical simulation.
Our results suggests that similar 2-D simulations by Grisouard et al. (Reference Grisouard, Staquet and Pairaud2008), meant to replicate quasi-2-D laboratory set-ups, probably miss significant dissipation at the lateral walls. We speculate that the lateral wall dissipation shifts the onset of triadic resonance instabilities towards stronger energy input, i.e. larger wave attractor amplitude
 $a$
in the experiments by Scolan et al. (Reference Scolan, Ermanyuk and Dauxois2013) and Brouzet (Reference Brouzet2016).
7.3 Scaling of wave attractors
There is an ongoing debate on the scaling of wave attractors (Rieutord et al.
Reference Rieutord, Georgeot and Valdettaro2001; Ogilvie Reference Ogilvie2005; Grisouard et al.
Reference Grisouard, Staquet and Pairaud2008; Hazewinkel et al.
Reference Hazewinkel, van Breevoort, Dalziel and Maas2008; Brouzet Reference Brouzet2016; Brouzet et al.
Reference Brouzet, Sibgatullin, Ermanyuk, Joubaud and Dauxois2017b
). Our new analysis predicts that the scaling of wave attractors depends on the type of energy dissipation. We define the characteristic wavelength of the attractor as
 $2\unicode[STIX]{x03C0}/k_{max}$
, where
 $k_{max}$
is the dimensional wavenumber corresponding to the maximum of the spectrum. Considering only internal shear dissipation ((4.5) with
 $P=$
constant), we get the characteristic attractor wavelength
 $\unicode[STIX]{x1D706}_{0}^{I}=2\unicode[STIX]{x03C0}/k_{max}=2\unicode[STIX]{x03C0}\left(3\unicode[STIX]{x1D6FD}_{1}\right)^{1/3}$
, where
 $\unicode[STIX]{x1D6FD}_{1}$
is now understood as the dimensional equivalent of its non-dimensional definition in (4.5), taking
 $d_{0}$
instead of
 $\unicode[STIX]{x1D6FF}$
, and
 $L_{a}$
instead of
 ${\mathcal{L}}$
. We recover
 $\unicode[STIX]{x1D706}_{0}^{I}\propto \left(L_{a}\unicode[STIX]{x1D708}/N_{0}\right)^{1/3}$
, as originally found by Rieutord et al. (Reference Rieutord, Georgeot and Valdettaro2001) and numerically verified by Grisouard et al. (Reference Grisouard, Staquet and Pairaud2008). Damping only by the lateral walls ((5.11) with
 $\unicode[STIX]{x1D6FD}_{1}=0$
) results in an attractor wavelength
 $\unicode[STIX]{x1D706}_{0}^{W}=2\unicode[STIX]{x03C0}\text{Re}[\unicode[STIX]{x1D6FD}_{2}]\propto (L_{a}/W)\left(\unicode[STIX]{x1D708}/N_{0}\right)^{1/2}$
, with
 $\unicode[STIX]{x1D6FD}_{2}$
also understood to be dimensional. Interestingly, this attractor length scale,
 $\unicode[STIX]{x1D706}_{0}^{W}$
, is independent of the actual size of the 3-D tank, because scaling both
 $L_{a}$
and
 $W$
leaves
 $\unicode[STIX]{x1D706}_{0}^{W}$
invariant. The dissipation at the lateral walls is negligible only if
 $\unicode[STIX]{x1D706}_{0}^{I}\gg \unicode[STIX]{x1D706}_{0}^{W}$
, which is the case when
 $$\begin{eqnarray}W\gg L_{a}^{2/3}d_{0}^{1/3}\unicode[STIX]{x1D70E}_{0}\frac{[\cot \unicode[STIX]{x1D703}~2(\unicode[STIX]{x1D6FE}^{3}-1)/3]^{1/3}}{2(\unicode[STIX]{x1D6FE}-1)}.\end{eqnarray}$$
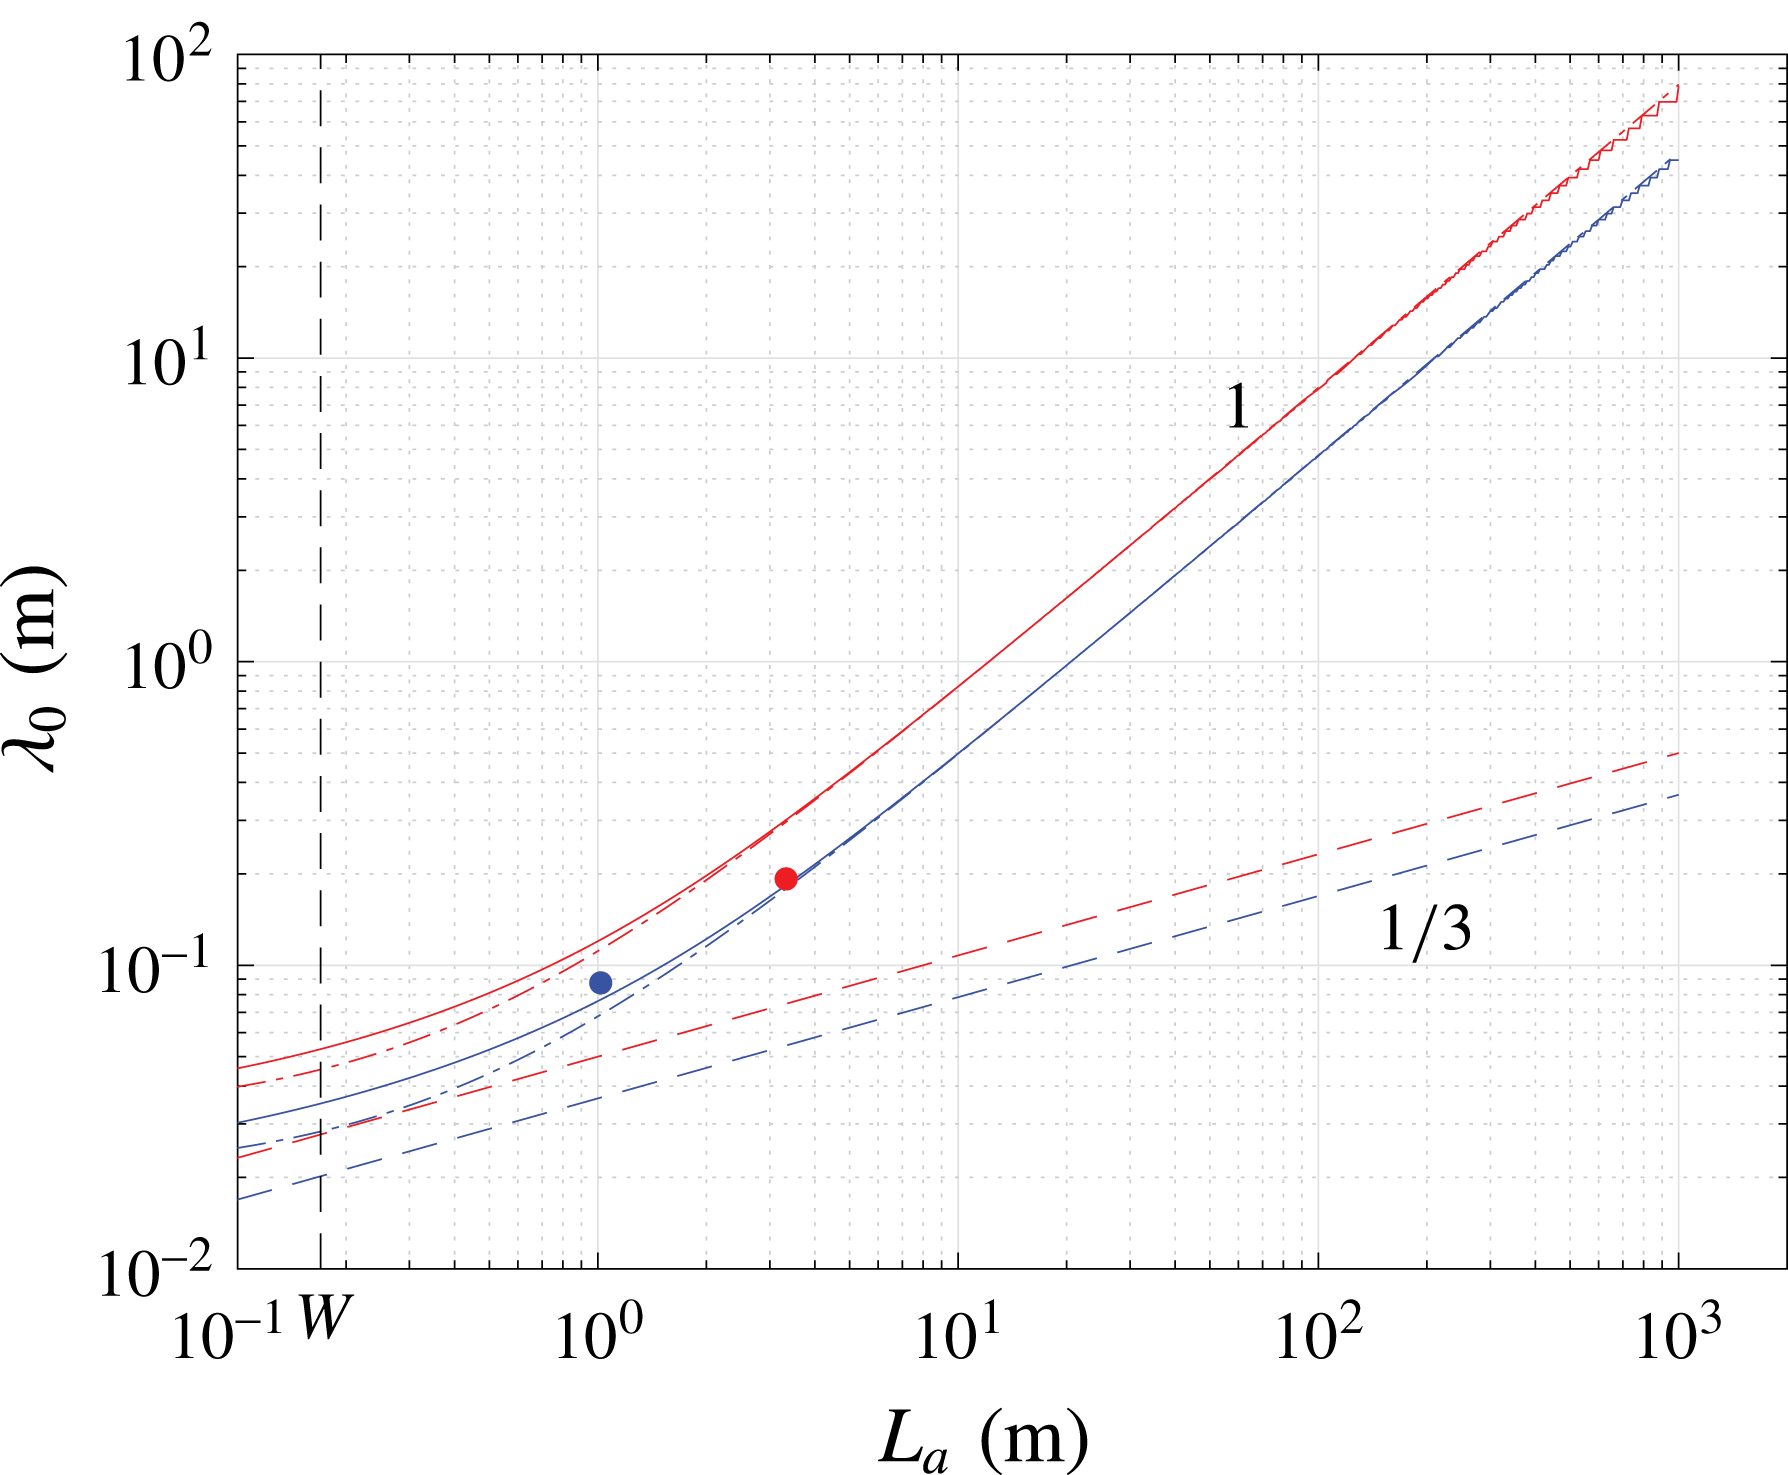
Figure 7 shows
 $\unicode[STIX]{x1D706}_{0}$
as a function of
 $L_{a}$
for the parameter values of the small and large tank set-ups by Brouzet (Reference Brouzet2016), with the dots showing the experimentally observed characteristic wavelengths (corresponding to
 $k_{max}$
indicated in figure 5
c,d). The two graphs do not coincide due to slightly different parameter values, most prominently differences in angle
 $\unicode[STIX]{x1D6FC}$
for the two set-ups. One can distinguish two different regimes: (i) For
 $L_{a}\gg W$
, lateral wall dissipation dominates, so
 $\unicode[STIX]{x1D706}_{0}^{W}\propto L_{a}$
. (ii) For
 $W\lesssim L_{a}$
, internal shear dissipation contributes significantly, so
 $\unicode[STIX]{x1D706}_{0}^{I}\propto L_{a}^{1/3}$
. The presented experiments fall into the transition between region (i) and (ii). This stresses the importance of previously unrecognized dissipation at rigid lateral walls.
Theoretical wavelength
 $\unicode[STIX]{x1D706}_{0}$
, as function of orbital attractor length,
 $L_{a}$
, for parameter values corresponding to ‘small tank’ (blue) and ‘large tank’ (red), with the dots showing the observed wavelength at the actual orbital lengths (1 m and 3 m, respectively). Solid lines: scaling of
 $\unicode[STIX]{x1D706}_{0}$
as a function of
 $L_{a}$
for fixed
 $W$
and fully dissipative attractor (value
 $W=0.17$
m is marked). Dashed lines: scaling for internal shear damping only (
 $\unicode[STIX]{x1D706}_{0}^{I}\propto L_{a}^{1/3}$
). Dot-dashed lines: rigid-wall dissipation only (
 $\unicode[STIX]{x1D706}_{0}^{W}\propto L_{a}$
).

8 Concluding remarks
From our theoretical analysis it is evident that the structure of a wave attractor in equilibrium is primarily determined by wave focusing, viscous dissipation at the rigid boundaries (mostly at the lateral walls), as well as viscous dissipation in the internal shear layers. Contrary to what was previously suggested, we show that the quasi-2-D experiments by Hazewinkel et al. (Reference Hazewinkel, van Breevoort, Dalziel and Maas2008) cannot be captured by the theoretical spectrum of a 2-D steady-state wave attractor, which takes only internal shear dissipation into account. We close the gap between observations and theory by adding viscous dissipation at the lateral walls, which are the primary contact surfaces of the attractor and the rigid boundaries in the experiment by Hazewinkel et al. (Reference Hazewinkel, van Breevoort, Dalziel and Maas2008). It is clear that rigid-wall dissipation also plays an important role in the experiments by Scolan et al. (Reference Scolan, Ermanyuk and Dauxois2013) and Brouzet (Reference Brouzet2016).
Contrary to previous studies, we find that the shape of the equilibrium wave attractor in the classical trapezoidal set-up is not only dependent on the properties of the stratified fluid (viscosity
 $\unicode[STIX]{x1D708}$
, Brunt–Väisälä frequency
 $N_{0}$
), the geometry of the tank (width
 $W$
, wave attractor length
 $L_{a}$
, sloping wall angle
 $\unicode[STIX]{x1D6FC}$
) and forcing frequency
 $\unicode[STIX]{x1D714}_{0}$
, but also on the nature of the energy input, which determines the period-
 $1$
function
 $P$
in (4.5), (5.11) and (6.14). Whereas the fluid properties and geometry determine the characteristic cross-beam wavelength of the wave attractor, the nature of the energy input sets the fine structure of the equilibrium wave attractor. The role of the period-
 $1$
function
 $P$
remains vague, and more research is needed to understand the relation between a single wavenumber energy input and a continuous steady-state wave attractor spectrum.
The striking unresolved problem is the following: if the energy input is discrete, as one may argue for the ‘small tank’ and ‘large tank’ set-ups, then the period-
 $1$
function
 $P$
should consist of Dirac delta functions, leading to a discrete spectrum. However, the experimental and simulated spectra with supposedly discrete energy input are smooth. It is unclear whether the energy input is not as discrete in spectral space as we imagined, or whether some other mechanism (not captured by our theory) effectively smooths the wave attractor spectrum.
In the ocean, sites where internal waves propagate parallel to a rigid vertical boundary over long distances are sparse; the channel between two coral atolls studied by Rayson et al. (Reference Rayson, Bluteau, Ivey and Jones2016) being such exceptional example. Wave beam reflection at bottom topography is much more common. To the best of our knowledge, we are the first to explicitly determine the dissipation due to such reflection. Our assumption of a stable laminar boundary layer holds in the ocean for semi-diurnal tides with amplitudes up to 32 m (Bukreev Reference Bukreev1988). For internal tides with wavelengths of the order of 100 m (
 $k_{0}=0.06~\text{rad}~\text{m}^{-1}$
), we find that the velocity amplitude decay due to non-critical reflection,
 $d_{0}k_{0}R_{\unicode[STIX]{x1D6FC}}$
, can amount up to
 ${\sim}1$
%. For larger wavelengths, the decay is even smaller, confirming that dissipation due to laminar reflection is typically negligible in the ocean. Probably more important is the three-dimensionality of the boundary layer velocity field occurring for reflecting wave beams, which happens if incoming and outgoing beams point in different horizontal directions. It is well known that the 2-D steady-state similarity linear solutions for collinear viscous wave beams by Tabaei & Akylas (Reference Tabaei and Akylas2003) can also be valid in the nonlinear regime. This may change in the vicinity of the rigid boundary, where Reynolds stresses may become large. Consequences can be the generation of strong mean flows, such as observed experimentally by Bordes et al. (Reference Bordes, Venaille, Joubaud, Odier and Dauxois2012) and Grisouard et al. (Reference Grisouard, Leclair, Gostiaux and Staquet2013), and in the simulations by King, Zhang & Swinney (Reference King, Zhang and Swinney2010) and by K. Raja (personal communication), or triadic resonance instability (Scolan et al.
Reference Scolan, Ermanyuk and Dauxois2013; Brouzet et al.
Reference Brouzet, Ermanyuk, Joubaud, Sibgatullin and Dauxois2016a
, Reference Brouzet, Ermanyuk, Joubaud, Pillet and Dauxois2017a
). Both scenarios may result in the breakdown of the internal wave beam, strong energy dissipation near the reflecting boundary and potentially vertical mixing (Dauxois et al.
Reference Dauxois, Joubaud, Odier and Venaille2018).
Acknowledgements
We thank T. Dauxois, E. Ermanyuk, J. Frank, S. Joubaud and K. Raja for helpful discussions, and three anonymous reviewers for their input leading to an improved manuscript. I.N.S. is partially supported by the Russian Foundation for Basic Research 15-01-06363, and the Russian Science Foundation 14-50-00095. The numerical simulations were performed on the supercomputer Lomonosov of Moscow State University. F.B. is grateful for support by NWO Mathematics of Planet Earth grant 657.014.006.