1. Introduction
The conditions of the Jurassic Period have been recognized as a typical example of a greenhouse climate (Berner & Kothavala, Reference Berner and Kothavala2001; Jenkyns, Reference Jenkyns2003; Dera et al. Reference Dera, Brigaud, Monna, Laffont, Pucéat, Deconinck, Pellenard, Joachimski and Durlet2011; Vajda et al. Reference Vajda, Pole and Sha2016). The abnormal environmental and climate conditions during late Early Jurassic time have long been a focus of geologists. In particular, this includes the Toarcian Oceanic Anoxic Event (T-OAE), first proposed in the 1980s (Jenkyns, Reference Jenkyns1985, Reference Jenkyns1988), which has been regarded as a significant global climatic and/or geological event with effects that have been observed worldwide (Al-Suwaidi et al. Reference Al-Suwaidi, Angelozzi, Baudin, Damborenea, Hesselbo, Jenkyns, Manceñido and Riccardi2010; Han et al. Reference Han, Hu, Kemp and Li2018; Ruebsam et al. Reference Ruebsam, Müller, Kovács, Pálfy and Schwark2018). The responses of this global event primarily include the temporary and/or permanent disappearance of some marine biota (Palliani et al. Reference Palliani, Mattioli and Riding2002; Aberhan & Baumiller, Reference Aberhan and Baumiller2003; Ruban, Reference Ruban2004; Erba et al. Reference Erba, Bottini, Faucher, Gambacorta and Visentin2019; Ros-Franch et al. Reference Ros-Franch, Echevarria, Damborenea, Mancenido, Jenkyns, Al-Suwaidi, Hesselbo and Riccardi2019), a rise in marine temperature (Jenkyns, Reference Jenkyns2003; Suan et al. Reference Suan, Mattioli, Pittet, Mailliot and Lécuyer2008; Dera et al. Reference Dera, Pellenard, Neige, Deconinck, Puceat and Dommergues2009) and anomalies in geochemical indexes (McArthur et al. Reference McArthur, Donovan, Thirlwall, Fouke and Mattey2000; Kemp et al. Reference Kemp, Coe, Cohen and Schwark2005; Hesselbo & Pieńkowski, Reference Hesselbo and Pieńkowski2011).
The biotic, environmental and geochemical records of this global event are primarily based on marine sequences, while fewer studies have been conducted on continental sequences. Several phenomena of terrestrial ecosystems are believed to be responses to global warming during the late Early Jurassic period, such as alterations in the composition of the macroflora and palynoflora (Vakhrameyev, Reference Vakhrameyev1982, Reference Vakhrameyev1991; Wang et al. Reference Wang, Mosbrugger and Zhang2005), geochemical indexes that indicate an arid climate (Fu et al. Reference Fu, Wang, Zeng, Feng, Wang and Song2017) and the enhancement of atmospheric partial pressure of CO2 (pCO2) (McElwain et al. Reference McElwain, Wade-Murphy and Hesselbo2005; Zhou et al. Reference Zhou, Wang and McElwain2018). In fact, data from the terrestrial system not only supplement that of the marine system, but also provide more accurate climate fluctuation records and highlight differences between continental and oceanic responses to global warming. For example, the early stages of volcanogenic global warming were more severe for the terrestrial ecosystem than the marine ecosystem, and changes in the diversity and composition of plants were initially more rapid in the terrestrial ecosystem (Slater et al. Reference Slater, Twitchett, Danise and Vajda2019). Nevertheless, an understanding of the effect of global warming on the continents is currently insufficient and incomplete compared with that of the ocean.
The Chinese Jurassic strata are dominated by terrestrial sequences, providing favourable materials for the study of the Jurassic palaeoenvironment and palaeoclimate. This study focuses on the Tianshifu Basin, eastern Liaoning, China, which is filled with Lower–Middle Jurassic fluvial and lacustrine sediments and is rich in plant fossils (Liaoning Bureau of Geology and Mineral Resources, 1989; Xu et al. Reference Xu, Yang, Tao, Liang, Zhao, Li, Kong, Li, Wan and Peng2003). To explore the continental climate features of the late Early Jurassic period, the flora and geochemical features were studied by investigating the evolutionary trend of the flora (based on macro-plant fossils) as well as by analysing the isotopic ratios of organic carbon (δ13Corg), total organic carbon (TOC), total nitrogen (TN) and total sulphur (TS) in the rock samples.
2. Geological setting
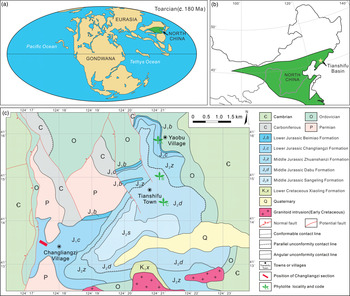
The Tianshifu Basin is a small-scale faulted basin that covers an area of c. 12.5 km2 and is located on the NE edge of the North China Plate (Fig. 1a, b). The basin is filled with Lower–Middle Jurassic fluvial and lacustrine sediments that can be divided into the Beimiao and Changliangzi formations (Lower Jurassic) and the Zhuanshanzi, Dabu and Sangeling formations (Middle Jurassic) (LBGMR, 1989; Xu et al. Reference Xu, Yang, Tao, Liang, Zhao, Li, Kong, Li, Wan and Peng2003).
(a) Palaeogeographic map of the late Early Jurassic period, redrawn after Scotese (Reference Scotese2004); (b) location of the Tianshifu Basin (the yellow star indicates the study area); and (c) generalized geological map of the Tianshifu Basin. Location of the Changliangzi section and phytolite are presented.

In complete contrast to the relatively stable tectonic background of the periods prior to the Mesozoic, a series of NE faults and folds began to form in the Mesozoic in eastern China, the formation of which was accompanied by intense volcanic activity and magmatic intrusion under the impact of the NW subduction of the Palaeo-Pacific Plate. In general, eastern Liaoning experienced a period of long-term uplift and suffered intense weathering and denudation during the Jurassic period. Several small-scale inland lake basins, including the Tianshifu Basin, were formed exclusively in faulted and lowland areas (LBGMR, 1989; Wu et al. Reference Wu, Hou and Li2007 b).
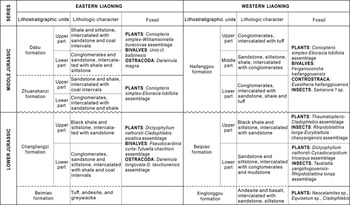
The Changliangzi Formation, which is also known as Changliangzi Black Shale, is primarily exposed in the north and SW of the Tianshifu Basin (Fig. 1c). The age of the Changliangzi Formation is generally considered to be late Early Jurassic, based on faunal and floral characteristics (Zheng & Zhang, Reference Zheng and Zhang1990 a, b). In addition, the Lower–Middle Jurassic strata in eastern Liaoning can be compared with that in western Liaoning in terms of lithological character, fossils and unconformity formed in the regional tectonic movement (Fig. 2) (Xu et al. Reference Xu, Yang, Tao, Liang, Zhao, Li, Kong, Li, Wan and Peng2003). The Beipiao Formation in western Liaoning is considered to be contemporaneous with the Changliangzi Formation in eastern Liaoning (Xu et al. Reference Xu, Yang, Tao, Liang, Zhao, Li, Kong, Li, Wan and Peng2003). It is also thought that the underlying Xinglonggou Formation formed during the Early Jurassic period (Shao & Yang, Reference Shao and Yang2008) and the overlying Haifanggou Formation, which is contemporaneous with the Zhuanshanzi and Dabu formations, formed during Middle Jurassic time (Chang et al. Reference Chang, Zhang, Hemming, Mesko, Fang, Martinius, Howell and Good2014). The age of the Beipiao Formation in western Liaoning, that is, the Changliangzi Formation in the Tianshifu Basin, is therefore considered to be late Early Jurassic (Toarcian).
Stratigraphic correlation of Lower–Middle Jurassic strata between eastern and western Liaoning, after Xu et al. (Reference Xu, Yang, Tao, Liang, Zhao, Li, Kong, Li, Wan and Peng2003). The wavy lines and the dotted lines represent angular unconformity contacts and parallel unconformity contact, respectively.

The Changliangzi Formation consists of an association of fluviolacustrine clastic sediments that can be divided into two parts: the lower part is dominated by conglomerates, sandstone and siltstone and is intercalated with shale and coal intervals, and the upper part is composed of black shale and siltstone that contains several sandstone layers (LBGMR, 1989; Xu et al. Reference Xu, Yang, Tao, Liang, Zhao, Li, Kong, Li, Wan and Peng2003). The upper part of the Changliangzi Formation is well-preserved in the study region, but the lower part is absent as a result of tectonic movement and human activities. Nevertheless, the Changliangzi Formation in the study area can still provide useful material to research the continental palaeoclimate and palaeoenvironment of the late Early Jurassic period.
3. Materials and methods
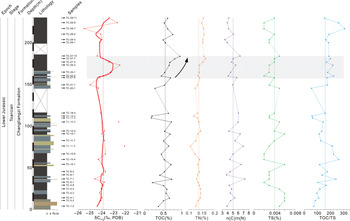
Rock samples were collected throughout the Changliangzi section in the SW Tianshifu Basin (Fig. 1c), and a total of 76 samples, with approximate average weight 500 g each, were obtained from an outcrop using a geological hammer. From the 76 rock samples, including sandstone, siltstone, mudstone and shale, 36 fine-grained samples, which may contain more organic matter (OM), were selected and prepared for geochemical analyses (Fig. 3). The samples were washed with distilled water using a supersonic cleaner to remove superficial contaminants, dried, crushed into small fragments and then ground into a powder.
Stratigraphic column of the Changliangzi section. Sample localities, organic carbon isotopes (δ13Corg) values, total organic carbon (TOC) contents, total nitrogen (TN) contents, total sulphur (TS) contents, atomic ratios of carbon to nitrogen (n(C)/n(N)), and ratios of total carbon and total sulphur (TOC/TS) are presented. Three-point moving averages of δ13Corg are plotted in thick red lines. The grey block represents the segment with the δ13Corg positive shift in the interval of c. 158–184 m. The vertical dotted lines represent the mean value of each parameter for the complete sedimentary succession. At the bottom of the stratigraphic column: c – clay; s – sand; fs – fine sand; cs – coarse sand.

TOC and TS analyses of the 36 samples were conducted using a Leco-344 automatic carbon and sulphur analyser at the Lanzhou Center for Oil and Gas Resources, Institute of Geology and Geophysics, Chinese Academy of Sciences. Prior to testing, the powdered samples were treated with 5% HCl for 24 hours to remove inorganic carbon, rinsed repeatedly with deionized water until the pH of the liquid was neutral, and then dried. TN analyses were conducted using an EA 3000 elemental analyser at the Nanjing Institute of Geography and Limnology, Chinese Academy of Sciences.
In addition, δ13Corg was analysed using a MAT 253 mass spectrometer at the Lanzhou Center for Oil and Gas Resources. Prior to these analyses, powdered samples weighing 0.1–1 g were dissolved in 50 mL of 5% HCl, heated until one-third of the volume remained, and subsequently rinsed repeatedly with deionized water until the pH of the liquid became neutral. Samples were then dried at 40–60°C for 12 hours prior to analyses, and results were determined in accordance with the PDB standard.
A total of 44 plant macrofossils were collected from three areas: those from the upper part of Changliangzi Formation (late Early Jurassic) come from a gully in the west of Yaobu village, and those from the Dabu Formation (Middle Jurassic) come from a road slope to the NE of the town of Tianshifu and from a coal gangue pile to the SE of Tianshifu town (Fig. 1c).
It must be stated that the isotopic record is only from the Changliangzi section (the upper part of the Changliangzi Formation, late Early Jurassic). Moreover, the plant macrofossils collected from the upper part of the Changliangzi and Dabu formations are from an unknown horizon and are not constrained by isotopic results.
4. Results
4.a. Petrography and sedimentary environment
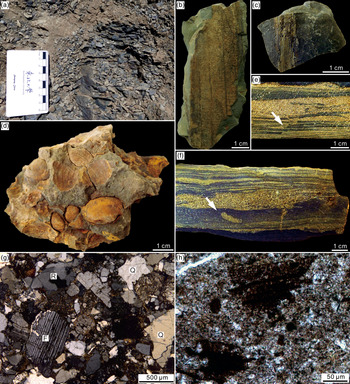
The examined section of the Changliangzi Formation has a thickness of c. 230 m, containing a succession of shale, siltstone and sandstone. The middle to lower part of this section (c. 0–167 m) is primarily composed of grey-green siltstone and black shale interrupted by occasional intervals of grey-yellow fine and coarse sandstone (Fig. 4a). The siltstone and fine sandstone are generally thin-bedded (c. 5–20 mm) and contain sporadic stalk fragments and abundant well-preserved bivalves (Fig. 4b–d). Consecutive or non-consecutive bedding composed of grey-yellow fine sand and black clay is found in unfossiliferous fine sandstone, which sometimes has faulted lamina and a sand-ball structure (Fig. 4e, f). In contrast with the fine sandstone, the interval of the coarse sandstone is thicker (c. 10–20 cm), has a massive structure, and is marked by poorly sorted and angular grains of quartz, feldspar and rock debris with tiny mineral and clay filling interstices (Fig. 4g). The uppermost Changliangzi section (at a height of c. 167–230 m) is dominated by black shale with nearly no siltstone or sandstone intervals. There are a few phytoclasts but no benthic fossils; however, black OM with a residual plant structure was identified (Fig. 4h).
Pictures of typical outcrop, hand specimen and micrographic image of the Changliangzi section. (a) Outcrop pictures exhibiting shale and siltstone, c. 26.80 m; (b, c) stalk fragments in siltstone from c. 54.50 m and 90.76 m, respectively; (d) well-preserved bivalves in fine sandstone from c. 104.78 m; (e, f) sedimentary structure in unfossiliferous fine sandstone from c. 88.71 m, where the white arrow in (e) and (f) indicates faulted lamina and sand-ball structure, respectively; (g) micrographic image of coarse sandstone from c. 8.70 m under crossed polars (Q – quartz; F –feldspar; R – rock debris); and (h) micrographic image of organic matter with residual plant structures in black shale from c. 169.56 m.

The sedimentological and petrographic characteristics of the strata of the Changliangzi section are indicative of lacustrine facies. The low-maturity sandstone and large numbers of benthic organisms in the middle to lower part of the section are interpreted as having formed in a shallow lake near an eroding upland. In contrast, the pure-black shale rich in OM in the uppermost part of the section suggests deeper lake conditions. This deepening lacustrine sequence is consequently well-represented in the Changliangzi section within the Tianshifu Basin.
4.b. Flora
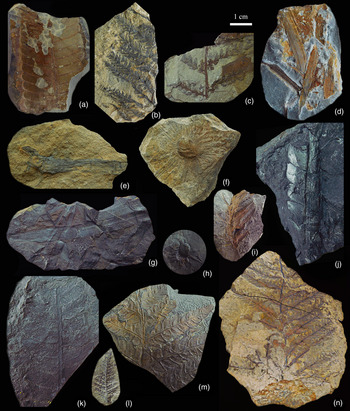
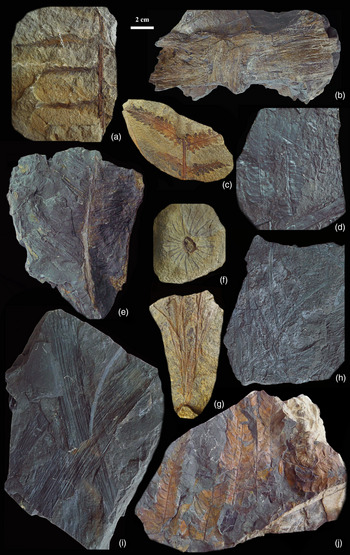
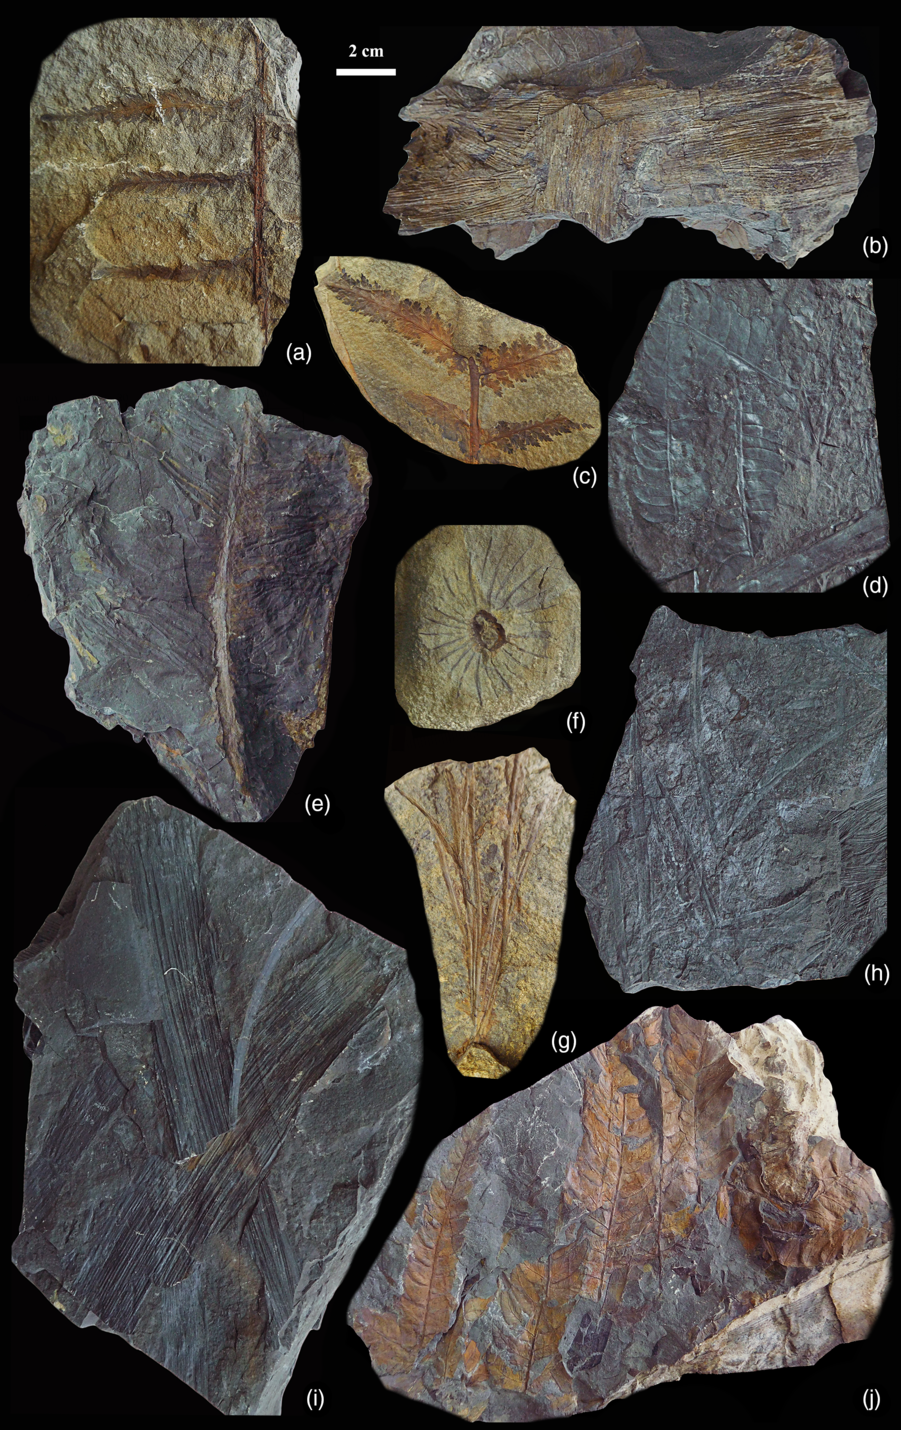
The Tianshifu Basin is rich in Early and Middle Jurassic plant fossils, and we identified a total of 17 genera and 37 species of plant macrofossils collected from the upper part of the Changliangzi Formation and the Dabu Formation (Table 1, Figs 5, 6).
List and vertical distribution of the plant macrofossils in the Tianshifu Basin

Pictures of phytolite in the Tianshifu Basin (Part I). Sample localities are represented by PL (phytolite locality) and the alphabetic code corresponds to that shown in Figure 1c. (a) Pterophyllum sp., Dabu Formation, PL-B; (b) Coniopteris burejensis (Zalessky) Seward, Changliangzi Formation, PL-A; (c) Coniopteris gaojiatianensis Zhang, Changliangzi Formation, PL-A; (d) Podozamites lanceolatus (Lindley et Hutton) Braun, lower Changliangzi Formation, PL-A; (e) Equisetum sibiricum (Heer), Changliangzi Formation, PL-A; (f) Equisetum laterale Phillips, Changliangzi Formation, PL-A; (g) Todites cf. shensiensis (Pán) Sze, Dabu Formation, PL-C; (h) Sphenobaiera longifolia (Pomer) Florin, Dabu Formation, PL-C; (i) Equisetum ilmijense (Prynada), Dabu Formation, PL-C; (j) Elatocladus sp., Dabu Formation, PL-B; (k) Cladophlebis ichiinensis Sze, Dabu Formation, PL-C; (l) Coniopteris tatungensis Sze, Dabu Formation, PL-B; (m) Cladophlebis asiatica Chow et Yeh, Dabu Formation, PL-B; and (n) Cladophlebis delicatula Yabe et ⓞishi, Changliangzi Formation, PL-A.

Pictures of phytolite in the Tianshifu Basin (Part II). Sample localities are represented by PL (phytolite locality) and the alphabetic code corresponds to that shown in Figure 1c. (a) Klukia cf. exilis (Phillips, Reference Phillips1829) Raciborski Reference Raciborski1890 emend. Harris, Changliangzi Formation, PL-A; (b) Neocalamites sp., Changliangzi Formation, PL-A; (c) Coniopteris hymenophylloides Brongniart, Changliangzi Formation, PL-A; (d) Todites williamsoni (Brongniart) Seward, Dabu Formation, PL-C; (e) Nilssonia sp., Dabu Formation, PL-B; (f) Equisetum guojiadianense Zhang et Zheng, Changliangzi Formation, PL-A; (g) Sphenarion latifolia (Turutanova–Ketova) Harris, Dabu Formation, PL-B; (h) Pityophyllum longifolium (Nathorst) Moeller, Dabu Formation, PL-C; (i) Neocalamites cf. hoerensis (Schimper) Halle, Dabu Formation, PL-C; and (j) Todites williamsoni (Brongniart) Seward, Changliangzi Formation, PL-A.
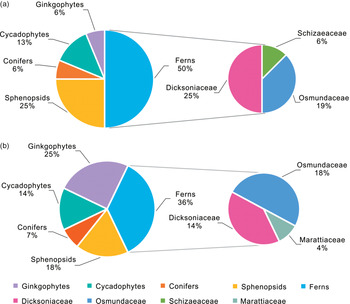
The plants of the upper part of the Changliangzi Formation (late Early Jurassic) were collected in a gully to the west of the village of Yaobu (Fig. 1c, phytolite locality (PL-) A) and include 10 genera and 16 species. This flora is dominated by ferns, which make up half of the total number of plants, and contain Dicksoniaceae, Osmundaceae and Schizaeaceae. Dicksoniaceae (25%) dominates and mainly includes Coniopteris. Osmundaceae accounts for 19% and consists of Cladophlebis and Todites. Schizaeaceae (6%) is relatively rare and is composed of Klukia. The second-most abundant representatives of this flora are the sphenopsids (25%), including Equisetites (19%) and Neocalamites (6%). Cycadophytes occur and make up 13%, represented by Pterophyllum and Nilssonia. In addition, both ginkgophytes and conifers contribute only 6% and are represented by Baiera and Podozamites, respectively (Fig. 7a).
Proportion of plant composition of the upper flora of the Changliangzi Formation and the Dabu Formation. It is revealed that the plant composition of the Dabu Formation is different from that of the upper part of the Changliangzi Formation, especially the significant increase in ginkgophytes, indicating a potential climate change. Floral composition of (a) the upper part of the Changliangzi Formation; and (b) the Dabu Formation.

The plants of the Dabu Formation (Middle Jurassic) were collected from a road slope to the NE of the town of Tianshifu (Fig. 1c, PL-B) and from a coal gangue pile to the SE of the town of Tianshifu (Fig. 1c, PL-C), and include 16 genera and 28 species. This flora has a higher diversity but is still characterized by the predominance of ferns (36%), which include Osmundaceae, Dicksoniaceae and Marattiaceae. Osmundaceae accounts for 18% and still includes Cladophlebis and Todites. Dicksoniaceae decreases to 14% and is composed of Coniopteris and Dicksonia. Marattiaceae replaces Schizaeaceae with a lower content of 4%, and is represented by Marattiopsis. Ginkgophytes (25%) have a higher content and diversity than in the Changliangzi Formation, including Baira and Sphenobaiera together with Sphenarion, Ginkgo and Czekanowskia. Sphenopsids account for 18% and are represented by Equisetites (11%) and Neocalamites (7%). The number and species of cycadophytes (14%) are similar to the above flora. Conifers are still lower in abundance (7%) and consist of Pityophyllum and Elatocladus (Fig. 7b).
4.c. Geochemical characteristics
There are distinct variations in the values of δ13Corg and the content of TOC, TN and TS throughout the Changliangzi section (Fig. 3), ranging from −25.5‰ to −22.1‰ (average, −23.8‰), 0.18% to 0.95% (average, 0.56%), 0.104% to 0.186% (average, 0.139%) and 0.002% to 0.006% (average, 0.004%), respectively. The δ13Corg remain close to the average and demonstrate only small fluctuations in the intervals of 0–158 m and 184–230 m of the Changliangzi section (Fig. 3). The positive shift of δ13Corg is recorded in a 26-m-thick interval (158–184 m) and includes a maximum excursion of 1.3‰ compared with the average (Fig. 3). The TOC contents in the intervals of 0–158 m and 184–230 m fluctuate slightly between 0.37% and 0.73% (average, 0.57%) and 0.50% and 0.76% (average, 0.59%), respectively, with the exception of samples TC-5-1, TC-17-2, TC-18-2 and TC-20-1. These samples have excessively low TOC values that could be related to the relatively coarse-grained siltstone, which has a higher deposition rate. The TOC values in the interval of 158–184 m gradually increase in the range of 0.45–0.95% (average, 0.68%). There is no obvious trend for TN and TS. Significantly, the positive excursion of δ13Corg and the increase in TOC content are accompanied by a variation in facies from shallow-lake to deep-lake, which indicates that there were environmental and/or climatic changes within the Tianshifu Basin.
In addition, the atomic ratios of TOC to TN (n(C)/n(N)) were calculated for their special significance in determining the sources of OM (Meyers, Reference Meyers1994, Reference Meyers2003). It should be noted that when sediments have a low OM content (TOC < 0.3%), atomic C/N ratios can be greatly depressed; the value of n(C)/n(N) then provides a misleading indication of the OM origin (Meyers, Reference Meyers1997). The data for samples TC-5-1, TC-17-2, TC-18-2 and TC-20-1 were therefore not considered to be appropriate for use in such calculations. For other samples, effective values of n(C)/n(N) range from 3.54 to 7.28 with an average value of 5.03 (Table 2). The TOC/TS ratios were calculated because sulphate reduction coupled with the oxidation of sedimentary organic matter would be reflected in the TOC/TS ratios (Wu et al. Reference Wu, Andreas, Bernd, Li and Wang2007 a). The TOC/TS ratios fluctuate greatly from 56.00 to 310.00 with an average of 160.74 (Fig. 3; Table 2).
Lithology and results of organic carbon isotopes (δ13Corg), total organic carbon (TOC), total nitrogen (TN) and total sulphur (TS) analyses. Atomic ratios of TOC to TN (n(C)/n(N)) and ratios of TOC to TS (TOC/TS) were also calculated

5. Discussion
5.a. Climate as inferred by flora
5.a.1. The climatic significance of flora
Interpretations of the continental climate are primarily based on the flora, which is considered to be very sensitive to environmental and climatic changes and is a useful palaeoecological and palaeoclimate proxy. Although no fossil plant samples of the early–middle Early Jurassic period have been found in the Tianshifu Basin in eastern Liaoning, plant assemblages do occur in the lower part of the Beipiao Formation in western Liaoning. In this study, ferns, cycadophytes, ginkgophytes, conifers and sphenopsids were identified from the material collected in the Tianshifu Basin. In addition to the plant fossils collected in this study, those genera and species recorded by previous researchers are also considered. Moreover, lycopsids and bryophytes were recorded in the Dabu Formation and the lower part of the Beipiao Formation, respectively (Zhang & Zheng, Reference Zhang, Zheng and Yu1987; LBGMR, 1989; Zheng & Zhang, Reference Zheng and Zhang1990 a, b). The climatic implications of the plants involved in this study are described in the following (Table 3).
Palaeoclimate types of major Early–Middle Jurassic plants in eastern Liaoning, mainly after Vakhrameyev (Reference Vakhrameyev1991), Van Konijnenburg-Van Cittert (Reference Van Konijnenburg-Van Cittert2002), Wang et al. (Reference Wang, Mosbrugger and Zhang2005), Deng (Reference Deng2007), Pole (Reference Pole2009), Bomfleur et al. (Reference Bomfleur, Pott and Kerp2010), Schrank (Reference Schrank2010), Sun et al. (Reference Sun, Tao, Sun, Chen, Li and Zhao2010), Zhang et al. (Reference Zhang, Dai, Heimhofer, Wu, Wang and Pan2014), and Li et al. (Reference Li, Wang, Vajda and Liu2018)

a Anomozamites, Lycopodites, Tyrmia and Ctenis were not collected in this study, but were recorded by Zhang & Zheng (Reference Zhang, Zheng and Yu1987), LBGMR (1989) and Zheng & Zhang (Reference Zheng and Zhang1990 a, b).
Ferns were the main group of the Mesozoic flora, and had strict climatic and environmental requirements (Buatois et al. Reference Buatois, Labandeira, Mángano, Cohen, Voigt, Mángano and Buatois2016). The different families preferred different environments: the Osmundaceae was mainly adapted to a warm and humid climate, while the Schizaeaceae, Marattiaceae and Dipteridaceae are generally regarded as good indicators of a tropical–subtropical climate (Vakhrameyev, Reference Vakhrameyev1991; Van Konijnenburg-Van Cittert, Reference Van Konijnenburg-Van Cittert2002). During Jurassic time, the Dicksoniaceae was abundant from the tropics to the poles (Deng, Reference Deng2007); they are therefore not regarded as a useful Jurassic climate proxy. During Mesozoic time, Cycadales were distributed primarily in the tropical–subtropical zone and were adapted to a dry climate (Bomfleur et al. Reference Bomfleur, Pott and Kerp2010; Sun et al. Reference Sun, Tao, Sun, Chen, Li and Zhao2010). However, there were some cycad-like genera, such as Anomozamites, Pterophyllum and Nilssonia, that were more abundant in the temperate zone (Deng, Reference Deng2007). The ginkgophytes were mainly restricted to temperate regions during Mesozoic time, indicating a seasonal climate (Vakhrameyev, Reference Vakhrameyev1991). However, the Czekanowskiales are believed to represent a relatively cold climate (Vakhrameyev, Reference Vakhrameyev1991; Bomfleur et al. Reference Bomfleur, Pott and Kerp2010). Extant Conifers are widely distributed in temperate and cold zones. The Podozamitaceae, Taxodiaceae and the form genus Elatocladus generally indicate a temperate and humid climate, while many Pinaceous species can withstand severe cold (Wang et al. Reference Wang, Mosbrugger and Zhang2005; Pole, Reference Pole2009; Bomfleur et al. Reference Bomfleur, Pott and Kerp2010). Mesozoic sphenopsids mainly included Neocalamites and Equisetites, and were distributed globally but primarily found in warm regions (Deng, Reference Deng2007; Zhang et al. Reference Zhang, Dai, Heimhofer, Wu, Wang and Pan2014). Bryophytes usually grow under more or less humid conditions (Wang et al. Reference Wang, Mosbrugger and Zhang2005; Li et al. Reference Li, Wang, Vajda and Liu2018). Lycopsids were relatively rare in the Mesozoic, with some adapted to a humid climate (e.g. Lycopodites) and others to drier conditions (Deng, Reference Deng2007; Schrank, Reference Schrank2010).
5.a.2. Climate change during Early–Middle Jurassic time
According to the plant macrofossils (Table 3), the climate of the Early–Middle Jurassic period in eastern Liaoning can be indicated by computing the proportion of plant taxa (on a specimen basis) representing a temperate and humid, tropical–subtropical and moderate–cool climate (Fig. 8).
Climate change diagram as inferred by flora. Based on the proportions of plant taxa, the upper part of the Changliangzi Formation (late Early Jurassic) was warmer than the lower part of the Beipiao Formation (early–middle Early Jurassic) and the Zhuanshanzi and Dabu formations (Middle Jurassic). Stippling – data from this study; shading – data from LBGMR (1989), Zhang & Zheng (Reference Zhang, Zheng and Yu1987), Zheng & Zhang (Reference Zheng and Zhang1990 b).

Within the lower–middle Lower Jurassic strata (the Beipiao Formation), plants that represent a temperate and humid climate had an absolute advantage (74%). The plants indicating a tropical–subtropical and moderate–cool climate were both rare and present in the same proportion (6%).
Within the upper Lower Jurassic deposits (the upper part of the Changliangzi Formation), the temperate and humid climate still ruled, and the related plants accounted for 69% (73% in previous studies), while drought-resistant plants increased to 10% (in previous studies). Plants that represent a moderate–cool climate virtually disappeared.
The climate of the Middle Jurassic period was obviously different from that during the late Early Jurassic period. Plants that were adapted to a temperate and humid climate in the Dabu Formation increased to 75% (in this study) or 70% (in previous studies). Drought-tolerant plants of the Zhuanshanzi and Dabu formations were obviously less prevalent than those of the Changliangzi Formation, with a content of 5% (in previous studies) and 4% (in this study), respectively. Hekistotherms significantly increased to 9% (in previous studies) in the Zhuanshanzi Formation and 7% (in this study) and 6% (in previous studies) in the Dabu Formation.
It is obvious that plant groups that grow best under a temperate and humid climate dominated the whole flora, suggesting that this was the climate for eastern Liaoning during the Early–Middle Jurassic period. Although the proportion of plants that are more representative of hot and cool climates is relatively low, their climatic significance is still of great importance. Within the upper part of the Changliangzi Formation, there is an increase in the proportion of thermophilic plants and a decrease in the psychrophilic plants compared with the lower part of the Beipiao Formation (contemporaneous with the lower part of the Changliangzi Formation, but there are no isotopic data). Although the change in the proportion of plants is relatively small and the inferred difference in temperature was also small, this still suggests a warmer climate during the late Early Jurassic period in contrast to the earlier and later Jurassic periods.
5.b. Implications of geochemical characteristics
5.b.1. Organic matter: provenance and contents
Sedimentary organic matter (OM) may provide important information regarding the environment of palaeolakes, with the two most important being the source of the OM and the abundance of the biota that produced the OM (Meyers, Reference Meyers2003). Plants are the primary contributors to OM in lacustrine sediments (Meyers & Lallier-Vergès, Reference Meyers and Lallier-Vergès1999), and the types of plants that provide sedimentary OM largely affect interpretation of other geochemical indexes, especially the organic carbon isotope composition (Meyers, Reference Meyers1997, Reference Meyers2003). The provenance of OM should therefore be determined before the interpretation of changes in the organic carbon isotope composition.
The C/N ratios and organic carbon isotopes are regarded as reliable indicators for distinguishing the origin of sedimentary OM (whether phytoplankton or various land plants). These two indicators are widely applied in research on lacustrine or coastal environments (Meyers & Horie, Reference Meyers and Horie1993; Meyers, Reference Meyers1994). OM produced from atmospheric CO2 by C4 land plants usually contains an average δ13C value of c. −14‰, and the δ13C value of OM produced from atmospheric CO2 by C3 land plants and lacustrine algae is c. −27‰, on average. Protein-rich OM from lacustrine algae has C/N values that are commonly between 4 and 10, whereas protein-poor OM from land plants usually has C/N values of 20 or greater (Meyers, Reference Meyers1994). Atomic C/N ratios and the δ13Corg of sediments from the Changliangzi section range from 3.54 to 7.28 and −25.5‰ to −22.1‰, respectively. These analytical results are in accordance with the geochemical characteristics of the OM obtained from aquatic algae. A discrimination diagram was compiled to combine the values of atomic C/N ratios and organic carbon isotopes (Meyers & Lallier-Vergès, Reference Meyers and Lallier-Vergès1999), and all points are found to fall in or near the range of lacustrine algae (Fig. 9). The OM is therefore determined as being predominantly derived from lacustrine algae.
Atomic C/N ratios (n(C)/n(N)) and organic carbon isotope (δ13Corg) identifiers of OM produced by lacustrine algae, C3 land plants and C4 land plants (Meyers & Lallier-Vergès, Reference Meyers and Lallier-Vergès1999). Data are from Table 2.

The TOC concentration is a primary proxy for describing OM abundance, and the TOC contents are mainly controlled by the initial production of biomass and the subsequent degree of degradation. An increasing TOC value generally means a rise in aquatic OM productivity and/or preservation (Meyers, Reference Meyers2003). In the Changliangzi section, the TOC contents of sediment in the interval of the δ13Corg positive shift (158–184 m) gradually increase and are almost greater than average (Fig. 3). The high TOC values may indicate a high primary productivity or a high preservation of OM, or a combination of both. In the interval of 158–184 m, the TOC values correlate positively with the TN values (correlation coefficient of 0.6938, Fig. 10), suggesting that the contents of inorganic nitrogen are nearly constant (Talbot & Johannessen, Reference Talbot and Johannessen1992), so that the variations in TOC/TN can represent the changes in primary productivity. The increase in TOC contents is therefore not due to an increase in primary productivity, because there was no significant increase in the TOC/TN ratios (Fig. 3). Furthermore, the correlation between TOC and TN indicates that the high values of TOC may be related to the high rates of OM preservation (Lebreton-Anberrée et al. Reference Lebreton-Anberrée, Li, Li, Spicer, Zhang, Su, Deng and Zhou2016). The high TOC/TS ratios in the interval of 145–184 m also indicate a reducing environment because a higher TOC/TS ratio normally corresponds to stronger reduction conditions (Wu et al. Reference Wu, Andreas, Bernd, Li and Wang2007 a) (Fig. 3). We therefore propose that the increase in OM in the interval of the δ13Corg positive anomaly is attributed to the good preservation of OM rather than high primary productivity.
Cross-plot of total nitrogen (TN) against total organic carbon (TOC) in the interval of 158–184 m in the Changliangzi section.

5.b.2. Driving factors of δ13Corg shift
In a lacustrine system, the carbon isotope composition of depositional OM is primarily controlled by its sources and relates to the proportion of OM produced in a lake environment and derived from terrestrial input (Henderson & Holmes, Reference Henderson and Holmes2009). In this study, the origin of sedimentary OM is considered stable and almost entirely formed from aquatic phytoplankton. The organic carbon isotope compositions therefore originate from within the lake and are related to the δ13C of dissolved inorganic carbon utilized during photosynthesis. It is therefore considered that the changes in dissolved inorganic carbon are responsible for the δ13Corg shift.
In a lake, the annual overturn of water and the rapid dissolution of biogenic carbonates maintain an equilibrium between atmospheric CO2 and dissolved CO2 (Meyers & Horie, Reference Meyers and Horie1993). Under equilibrium in lakes, phytoplankton generally preferentially use dissolved CO2, while dissolved HCO will be used when the available dissolved CO2 is limited (Meyers & Lallier-Vergès, Reference Meyers and Lallier-Vergès1999; Wang et al. Reference Wang, Liu, Peng and Wang2013). The δ13C value of algal OM could increase in the latter case because the dissolved HCO is characterized by a heavier carbon isotope (δ13C c. 1‰) compared with dissolved CO2 (δ13C c. −7‰) (Meyers & Horie, Reference Meyers and Horie1993; Meyers, Reference Meyers1994).
Several changes in internal or external conditions can break this equilibrium and significantly affect the type and isotopic composition of dissolved inorganic carbon that is utilized by aquatic algae during photosynthesis. For example, high primary productivity can cause δ13Corg to increase (Meyers & Horie, Reference Meyers and Horie1993). In addition, an increase in water temperature triggers rapid phytoplankton growth, and more dissolved inorganic carbon is assimilated, thereby resulting in a positive excursion of δ13Corg (Wang et al. Reference Wang, Liu, Peng and Wang2013). Meanwhile, the concentrations of dissolved CO2 are lower in warmer waters (Rau et al. Reference Rau, Takahashi and Des Marais1989); this leads to the selective uptake of isotopically heavier HCO by phytoplankton, which then produces a positive δ13Corg bias. Moreover, aquatic plants have thicker and more stagnant boundary layers in low-turbulence lentic systems than in fast-moving water, thereby restraining the ability of the plants to obtain fresh carbon and promoting greater 13C-depletion (France, Reference France1995). Furthermore, an increase in the atmospheric partial pressure of CO2 (pCO2) causes a high equilibrium concentration of dissolved CO2 in lakes, and consequently leads to a negative migration of δ13Corg (Meyers & Horie, Reference Meyers and Horie1993).
We have shown that there is no significant change in primary productivity, so a productivity change can be ruled out as the reason for the positive migration of the δ13Corg. Furthermore, the effects of the increase in atmospheric pCO2 that have been recorded elsewhere during late Early Jurassic time (McElwain et al. Reference McElwain, Wade-Murphy and Hesselbo2005) would cause a carbon isotope shift to a lighter isotopic ratio, not heavier. Therefore, the most likely cause of the positive shift of δ13Corg recorded in this paper is climate warming. The warmer water could have produced algae blooms and a decline in the amount of dissolved CO2, leading to a positive shift in the carbon isotope composition of algal OM. Furthermore, high temperature enhances lake stability (Jöhnk et al. Reference Jöhnk, Huisman, Sharples, Sommeijer and Stroom2008), and poor water circulation can promote a positive change in δ13Corg. The positive change in organic carbon isotopes of sediments in the Changliangzi section consequently appears to preserve a record of climate warming during the late Early Jurassic period.
5.c. Early Jurassic (Toarcian) climate events
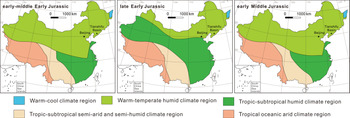
In this study, the increase in plants representing a tropical–subtropical climate and the positive excursion of δ13Corg recorded in the upper part of Changliangzi Formation both confirm that the Tianshifu Basin experienced a climatic warming event during the late Early Jurassic (Toarcian) period. This climate change is not restricted to the one basin, but can be distinguished in many regions in northern China. A marked decline in floral diversity and a conspicuous increase in thermophilic plants are well known in the lower Jurassic successions across northern China (Deng et al. Reference Deng, Lu, Fan, Fang, Li and Liu2012). There is even a considerable presence of drought-tolerant plants in NW China (Wu et al. Reference Wu, He and Mei1986; Li et al. Reference Li, He, Wu, Mei and Li1988), and a peak value in the percentage of Classopollis pollen is apparent during late Early Jurassic time, which also indicates a high temperature and a drought-prone climate (Wang et al. Reference Wang, Mosbrugger and Zhang2005; Yan et al. Reference Yan, Yuan, Zhao, Wei and Li2006; Tao et al. Reference Tao, Cui and Chen2013; Yang et al. Reference Yang, Zhang, Ge and Pan2013). In addition, within the upper Lower Jurassic interval, the coal-bearing strata become interrupted by coal-free strata, and the ‘variegated’ or ‘red beds’ that appeared only in southern China during the early Early Jurassic and Middle Jurassic periods also appear in northern China (Deng et al. Reference Deng, Lu, Fan, Fang, Li and Liu2012). Based on palaeontology, sedimentology and geochemistry, and the stomatal index and stomatal ratio of fossilized plants, Deng et al. (Reference Deng, Lu, Zhao, Fan, Wang, Yang, Li and Sun2017) (Fig. 11) found that the boundary of climate zones during the late Early Jurassic period moved towards the North Pole, in contrast to that during the early–middle Early Jurassic and early Middle Jurassic periods.
The Early–Middle Jurassic climatic regions of China (after Deng et al. Reference Deng, Lu, Zhao, Fan, Wang, Yang, Li and Sun2017).

Moreover, the high percentage of Classopollis in early Jurassic successions of Siberia, Europe and central Asia (Vakhrameyev, Reference Vakhrameyev1982, Reference Vakhrameyev1991), rising marine temperatures in Europe (Suan et al. Reference Suan, Mattioli, Pittet, Mailliot and Lécuyer2008; Dera et al. Reference Dera, Pellenard, Neige, Deconinck, Puceat and Dommergues2009), and intensified storm events and extreme warmth in the Tibetan Himalaya (Han et al. Reference Han, Hu, Kemp and Li2018) indicate that similar climatic events occurred globally. A raised atmospheric pCO2 has been indicated by a short-lived negative carbon isotope excursion during Toarcian time and has been considered to be related to CO2 released from the Karoo–Ferrar volcanism and methane from the dissociation of methane clathrate and magma-intrusion into Gondwana coals (Hesselbo et al. Reference Hesselbo, Gröcke, Jenkyns, Bjerrum, Farrimond, Morgans Bell and Green2000; Svensen et al. Reference Svensen, Planke, Malthe-Sørenssen and Jamtveit2004; Kemp et al. Reference Kemp, Coe, Cohen and Schwark2005; Burgess et al. Reference Burgess, Bowring, Fleming and Elliot2015). Meanwhile, a sharp enhancement of atmospheric pCO2 has also been recorded during research on terrestrial leaf stomatal density (McElwain et al. Reference McElwain, Wade-Murphy and Hesselbo2005). This suggests that large releases of greenhouse gas inevitably promoted warm greenhouse conditions during late Early Jurassic time. The climate change in the Tianshifu Basin and in other regions in northern China may therefore be in some way associated with the enhanced global greenhouse effect during the Toarcian Age. The increase in thermophilic plants and the positive carbon isotope excursion in the upper part of the Changliangzi Formation in the Tianshifu Basin are also likely to result from climate warming driven by the enhanced greenhouse effect.
6. Conclusion
The Tianshifu Basin in eastern Liaoning, NE China, contains a set of lacustrine sediments and abundant plant fossils of Early–Middle Jurassic age, allowing assessment of climate and biodiversity during a time of major global changes. The floral features indicate that eastern Liaoning was primarily characterized by temperate and humid conditions during the Early to Middle Jurassic period, but with a warming event during the latter part of the Early Jurassic period, possibly coeval with the Toarcian event. The Changliangzi section, representing the late Early Jurassic, shows a transformation from shallow-lake facies to deep-lake facies. A positive excursion of organic carbon isotopes correlates with the deepening of the palaeolake. We consider that high temperatures could be the primary driving factors of δ13Corg positive migration; the positive change in organic carbon isotopes in this study therefore appears to be due to climate warming during late Early Jurassic time.
Furthermore, the climate warming reflected by the flora variations and the positive excursion of the δ13Corg in the Tianshifu Basin is consistent with those climate events recorded in the marine and other continental sequences elsewhere, which are considered to be associated with the enhanced global greenhouse effect during late Early Jurassic time. The palaeobotanic and isotopic data resulting from this study therefore provide new continental evidence supporting global warming during late Early Jurassic time. It has been confirmed that the continental record of climate change complements the marine change, even though the record from land is still relatively scarce. Increased terrestrial data are consequently urgently needed to improve understanding of the Jurassic palaeoenvironment and palaeoclimate.
Acknowledgements
This research was funded by NSFC grants (nos 41972002 and 41172003). Lanzhou Center for Oil and Gas Resources, Institute of Geology and Geophysics, Chinese Academy of Sciences and Nanjing Institute of Geography and Limnology, Chinese Academy of Sciences are thanked for the geochemical analyses of sediments. We are also grateful for the comments of editors and reviewers, which significantly improved the manuscript.