




No CrossRef data available.
Article contents
The importance of accounting for the uncertainty of published prognostic model estimates
Published online by Cambridge University Press: 01 November 2004
Abstract
Objectives: Reported is the importance of properly reflecting uncertainty associated with prognostic model estimates when calculating the survival benefit of a treatment or technology, using liver transplantation as an example.
Methods: Monte Carlo simulation techniques were used to account for the uncertainty of prognostic model estimates using the standard errors of the regression coefficients and their correlations. These methods were applied to patients with primary biliary cirrhosis undergoing liver transplantation using a prognostic model from a historic cohort who did not undergo transplantation. The survival gain over 4 years from transplantation was estimated.
Results: Ignoring the uncertainty in the prognostic model, the estimated survival benefit of liver transplantation was 16.7 months (95 percent confidence interval [CI], 13.5 to 20.1), and was statistically significant (p<.001). After adjusting for model uncertainty using the standard errors of the regression coefficients, the estimated survival benefit was 17.5 months (95 percent CI, −3.9 to 38.5) and was no longer statistically significant. An additional adjustment for the correlation between regression coefficients widened the 95 percent confidence interval slightly: the estimated survival benefit was 17.0 months (95 percent CI: −4.6 to 38.6).
Conclusions: It is important that the precision of regression coefficients is available for users of published prognostic models. Ignoring this additional information substantially underestimates uncertainty, which can then impact misleadingly on policy decisions.
Information
- Type
- GENERAL ESSAYS
- Information
- International Journal of Technology Assessment in Health Care , Volume 20 , Issue 4 , November 2004 , pp. 481 - 487
- Copyright
- © 2004 Cambridge University Press
In cost-effectiveness studies, an estimate of the survival gain from a new treatment or technology, compared with current practice, is usually required. Ideally, this gain would be estimated within a randomized (controlled) clinical trial. However, it is not always feasible to conduct a clinical trial, particularly when the technology or treatment in question is already used in current practice and no equipoise exists regarding clinical benefit (14). In the absence of a randomized trial, an alternative approach is to compare data from historical controls with data from patients receiving the new treatment. To adjust for selection bias between the two groups of patients, it is necessary to adjust for case-mix differences. Rather than obtaining raw historical data for this purpose, published prognostic models are often used to estimate control group or “shadow” survival (3;11).
The minimum amount of information required from a prognostic model, to predict survival in another cohort, are the estimates of the regression coefficients and the baseline hazard or survival rates at given time points. Given this information, it is possible to compare the mean observed survival for patients who have received the new treatment with their expected survival if they had not. Thus the survival gain of the new treatment may be estimated.
However, there is uncertainty associated with each of the estimates of the regression coefficients, and the authors of some published prognostic models provide their standard errors. This information is usually ignored when estimating control group survival (3;11). Incorporating these standard errors into the calculation of estimated survival gives a more accurate representation of the model uncertainty. Furthermore, these regression coefficients will typically not be independent of each other. Therefore, an even more accurate representation of model uncertainty can be obtained if, in addition to the standard errors, the correlations between the regression coefficients are available. We use Monte Carlo simulation techniques to account for this uncertainty when applying a prognostic model.
Liver transplantation is currently the treatment of choice for certain patients with end-stage liver disease, and it is now considered unethical to withhold treatment due to the high survival rates and improved quality of life after transplantation (12). This study illustrates the importance of properly reflecting the uncertainty associated with prognostic models, using the case of liver transplantation as an example. Three situations are considered: first, where the regression coefficients alone are known (so that model uncertainty is ignored); second, where the regression coefficients and standard errors are known; and third, when the regression coefficients, their standard errors, and the correlations between them are known.
MATERIALS AND METHODS
The CELT Liver Transplant Cohort
During the period December 1995 to December 1997, a total of 122 patients with end-stage primary biliary cirrhosis (PBC), a type of liver disease, were assessed for their suitability as first time liver transplant candidates at one of six Department of Health liver transplant centres in England. These patients are a clinically defined subgroup from a larger cohort used to investigate the cost-effectiveness of the liver transplant program in England and Wales (CELT) (9). Patients were followed-up to the end of September 2001. It was not feasible to collect information on a historical cohort of nontransplant patients during the CELT study.
Of the 122 PBC patients assessed, 94 were listed as suitable transplant candidates, of whom 81 were subsequently transplanted. At the time of transplantation, clinical information was collected to measure the severity of each patient's liver disease. This analysis is based upon a 4-year follow-up period after transplantation.
Survival Post Liver Transplant
The average 4-year transplant survival of the CELT cohort was estimated by calculating the area under the Kaplan-Meier survival curve. Greenwood's formula was used to derive the uncertainty surrounding this estimate (5).
Nontransplant Survival (The Mayo Model)
Survival in the absence of transplantation was calculated using data from the Mayo Clinic cohort (7;10). This historical cohort consisted of 312 patients with PBC, who had been enrolled into either the treatment or placebo arms of two trials assessing the drug D-penicillamine at the Mayo Clinic, Rochester, MN, between January 1974 and May 1984. During these trials, patients had multiple assessments at which clinical and biochemical data were collected. Patients were followed-up until April 1988.
To date, two prognostic models have been published based on these data (7;10). The first, using only the information from the first patient visit to the clinic, predicts survival at yearly intervals up to 7 years using information on serum bilirubin, serum albumin, patient age, prothrombin (blood clotting) time, and the presence of edema. The second model is time dependent and uses information from all clinical visits. It predicts survival at 3-monthly intervals, up to 2 years, using the same variables as the first model. Whereas both published models reported regression coefficients and their standard errors, no information on correlation between regression coefficients was provided. Nor was it possible, retrospectively, to derive the correlation coefficients for the prognostic models as published, as the original Mayo data have been updated to account for minor data errors that were subsequently discovered and to extend the study follow-up period. Therefore, for this study, an alternative prognostic model is derived from the Mayo data to show that incorporating the information from the standard errors and correlation between regression coefficients changes the degree of uncertainty of the model predictions.
A further decision was taken to analyze the Mayo cohort from the point of the patients' last study visit. It was believed that, at the time of this final study visit, the cohort would be more comparable, in terms of disease stage, with the CELT patients to whom it would subsequently be applied than at the time of the first study visit. Nontransplant survival estimates derived from the historical cohort were also calculated from the area under the Kaplan-Meier survival curve.
Using Prognostic Models to Predict Nontransplant Survival
A Cox proportional hazards model was fitted to the Mayo data set, using variables that were common to both the Mayo and CELT cohorts (patient age, gender, serum bilirubin, serum albumin, prothrombin time, presence of edema, and presence of ascites) to adjust for clinical and demographic characteristics that could affect survival. Variables were included in the Cox model regardless of the level of statistical significance. Proportional hazards assumptions were checked before fitting the model. The regression coefficients, their standard errors, and the correlation between them were recorded.
The fitted model for the probability of surviving to time t, was of the following form:

where R is the individual risk score of a patient with covariate values (X1, X2,…, Xk), that is R=β1X1+β2X2+···+βkXk, and R0 is the risk score corresponding to a patient with the average values of the covariates X1 to Xk. S0(t) is the probability of survival to time t for a patient with average covariate values. The baseline survival functions were estimated at 3-monthly intervals up to 4 years.
Nontransplant Survival Using Only the Regression Coefficients
The prognostic model, as derived above, was applied to the CELT cohort to predict the gain in survival after liver transplantation. First, individual probabilities of surviving to time t were calculated up to a period of 4 years, using Equation 1. These individual probabilities were plotted as patient profiles over time, and the area underneath each profile was calculated—the area denotes each patient's expected survival in the absence of transplantation over 4 years. Finally, each individual's survival benefit from transplantation was obtained by subtracting the expected nontransplant survival from the individual's observed CELT transplant survival. The mean probabilities for survival without a transplant at each 3-monthly time point were plotted to illustrate the overall nontransplant survival.
Nontransplant Survival Using Regression Coefficients and Their Standard Errors
Monte Carlo simulation techniques were used to account for the uncertainty in the regression coefficients. A total of 3,000 sets of multivariate normally distributed regression coefficients were randomly generated, with means and standard errors specified to be the same as those derived from the Cox proportional hazards model fitted to the Mayo data using the statistical computer package S-PLUS (16). At this stage, the correlations between regression coefficients were set to zero.
Each of the 3,000 sets of regression coefficients was used to derive prognostic model scores, which were then applied to the CELT cohort. The individual probabilities of surviving to time t was then calculated using Equation 1, generating 3,000 sets of individual estimated survival probabilities in the absence of transplantation at 3-monthly time points. For each of the data sets, the average probability of surviving to time point t in the absence of transplantation was calculated. Each set of average probabilities was plotted to obtain a profile of expected survival over time, and the area under each profile was calculated—this area denotes the average estimated nontransplant survival to 4 years. The average survival gain for each data set was calculated by subtracting the average shadow survival estimates from the average observed transplant survival, obtained from the CELT cohort.
To depict the 95 percent confidence interval for shadow survival estimates using the Mayo model, survival estimates that were less than the 2.5th percentile or greater than the 97.5th percentile were identified and discarded.
Nontransplant Survival Using Regression Coefficients, Standard Errors, and the Correlation Between the Regression Coefficients
It is also possible to produce a set of random variables that additionally account for the correlation between variables. Therefore, a second set of 3,000 Monte Carlo simulations were run, within S-Plus, that accounted both for the standard errors and for the correlations between the regression coefficients. The average probabilities of shadow survival to time t were plotted over time and the average survival benefit after transplantation was calculated, as described above.
RESULTS
The Historical (Mayo) Data and the CELT Data
Table 1 shows the demographic and clinical characteristics of the CELT cohort immediately before transplantation and the Mayo cohort at the final study visit. Age, the proportion of female patients, and the serum albumin levels did not differ significantly between the two cohorts. However, CELT patients had higher serum bilirubin levels, longer prothrombin times, and were more likely to have ascites than the Mayo cohort, indicating that the CELT patients had more severe liver disease.

A simple unadjusted comparison of the observed survival of the two cohorts showed that patient survival to 4 years after transplantation for the CELT cohort was significantly better than survival to 4 years without transplantation in the Mayo cohort (p<.001). The observed average survival after liver transplantation was 41.7 months (95 percent confidence interval [CI], 38.4 to 45.0 months). The observed average 4-year survival benefit after transplantation was estimated to be 14.2 months (CI, 10.0 to 18.4 months).
Fitting the Prognostic Model
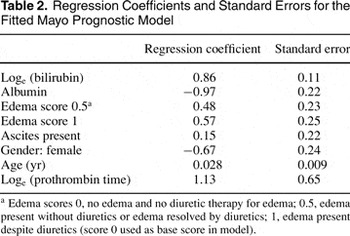
Table 2 presents the regression coefficients and their standard errors for the Cox proportional hazards regression model fitted to the Mayo cohort of PBC patients. The risk score (R0) of a hypothetical Mayo cohort patient with “average” values of the covariates listed in Table 2 was 2.30.

A patient's individual risk score can be derived using the regression coefficients presented in Table 2. The baseline survival functions (S0(t)) at 3-monthly intervals are presented in Table 3. Applying these values to an individual's risk score, using Equation 1, gives individual patients' probabilities of survival.

Estimating Shadow Survival Using the Prognostic Model
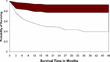
Using the regression coefficients alone and values for S0(t), the estimated 4-year survival in the absence of liver transplantation was derived for the CELT cohort (Figure 1). The average 4-year survival after a liver transplant was 41.7 months (as above) and the estimated 4-year nontransplant survival was 24.9 months. There was a statistically significant gain in survival over 4 years after liver transplantation of 16.7 months (CI, 13.5 to 20.1, p<.001).

Kaplan-Meier posttransplant survival (with 95 percent confidence intervals) and shadow survival estimated from a prognostic model using regression coefficients alone.
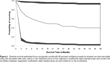
Figure 2 shows the 95 percent range of average shadow survival estimates from the 3,000 simulated data sets after accounting for the uncertainty in the survival estimates using the standard errors of the regression coefficients. It can be seen clearly from the figure that adjusting for model uncertainty using standard errors leads to a wide range in nontransplant survival estimates. Estimated average nontransplant survival was 24.2 months (CI, 3.2 to 45.4 months). The survival gain after transplantation was estimated to be 17.5 months (CI, −3.9 to 38.5).

Shadow survival estimated from a prognostic model with 95 percent confidence bands for shadow survival calculated using the simulated data sets, where (i) the standard errors of the regression coefficients (light shaded area) and (ii) also the correlation between regression coefficients (dark shaded area) are accounted for in the uncertainty.
After accounting for both the standard errors and the correlations (Table 4) between the regression coefficients, the expected nontransplant survival estimate was 24.7 months (CI, 3.1 to 46.3 months) and the estimated survival gain after transplantation was 17.0 months (CI, −4.6 to 38.6). Adjusting for the correlation between regression coefficients very slightly increased the uncertainty, in this case, as can be seen from Figure 2.

DISCUSSION AND CONCLUSIONS
Although evaluations of health technologies are ideally made within randomized trials, this is not always possible (2). In observational comparisons, for example with historical controls, severe biases can result unless adjustment is made for the differences in patient case-mix (1). This study has illustrated how published prognostic models may be used to estimate survival in the absence of a control group and, thereby, estimate the survival benefits of new treatments or technologies. More importantly, it has been shown that knowing the precision of the regression estimates in prognostic models is crucial to represent the appropriate level of uncertainty when applying these estimates to other cohorts.
When estimating shadow survival for a cohort other than the one originally used for fitting a prognostic model, one would expect the model to give different predictions due to differences in case-mix between cohorts (1). While adjustment has been made here for the available prognostic factors, such observational comparisons remain prone to potential biases from unmeasured prognostic factors, changes in ancillary treatments over time, and differences between countries. To reduce these factors to a minimum, we selected a time point in the Mayo patient series intended to increase the similarity with the CELT cohort of patients.
Liver transplantation is currently accepted as the treatment of choice for patients with end-stage liver disease. Therefore, techniques such as the use of prognostic models are necessary for estimating shadow survival. In the example presented in this study, uncertainty in model predictions arose because the prognostic model was derived on a relatively small data set (312 patients) and the standard errors of the regression coefficients were substantial. There was no evidence of a statistically significant survival gain from transplantation after accounting for prognostic model uncertainty using information on the standard errors of the regression coefficients. However, when this extra information was ignored, the survival benefit from transplantation was highly statistically significant. Had the standard errors of the regression coefficients been smaller, then the uncertainty surrounding the estimates of survival in the absence of transplantation would have been less, and it is possible that there would have been evidence of a survival benefit.
Additional adjustments for the correlations between the regression coefficients made, in our example, rather little difference to the uncertainty in estimated shadow survival. This finding was because the correlations were generally rather low (Table 4). Whether incorporating the correlation coefficients makes much difference to the degree of uncertainty of prognostic model estimates, and whether it would increase or decrease, will depend upon the particular data set and the directions and magnitudes of the correlations.
One level of uncertainty that has not been accounted for here is the uncertainty surrounding the survival probabilities S0(t). This determination was beyond the scope of this study but would be possible within a Bayesian implementation (15). It seems likely that this finding would have had little additional impact upon model uncertainty, at least in our example, as was the case with the correlation coefficients. Other aspects of model uncertainty have also not been addressed, such as the choice of covariates and their functional forms (8). The Monte Carlo simulation techniques presented in this study are established methods used to account for prior uncertainty and were relatively simple to perform in the statistical computer package S-PLUS (16). Alternative computer packages could also have been used for this analysis, for example EXCEL/Crystal Ball software (6) or the Bayesian software package BUGS (15).
In this study, we tried to mimic the situation faced in practice by those needing to use published prognostic scores to make evaluations of new technologies. This method was the situation for the full CELT analysis where prognostic models were used to estimate shadow survival for several disease groups (9). Typically, published prognostic models are applied to cohorts other than the one they were fitted to, using information from the regression estimates only (3;11). Even when additional information is given on the standard errors or correlation of the point estimates (4;9;13), it is often ignored. We have shown how important it is to use these standard errors to reflect the true uncertainty in predictions from the model. Authors of future prognostic models need to provide the additional information on standard errors, and ideally correlations, of the regression coefficients. Even when limitation on space precludes this information within a journal, providing access to such extra material on the Web should now be standard practice.
Given that the objectives of the CELT study were to establish the cost-effectiveness of liver transplantation, a natural extension to this work is to explore how adjusting for model uncertainty affects conclusions about cost-effectiveness. This question is currently being explored. Meanwhile, the results presented here have highlighted the importance of accounting for the uncertainty of prognostic model estimates. We have shown that an apparently significant benefit from liver transplantation is no longer evident after model uncertainty has been properly allowed for.
We thank Joanne Benson, Terry Therneau, and Rolland Dickson from the Mayo Clinic, Rochester, Minnesota, for providing us with the original data from the primary biliary cirrhosis Mayo models and Alex Sutton from the University of Leicester for his comments on an earlier draft of this manuscript. We also thank the CELT study team, in particular Professor Martin Buxton, for his comments and suggestions on earlier drafts of this manuscript and Louise Longworth.
These are the members of the CELT study team: Julie Ratcliffe, Tracey Young, Louise Longworth, Stirling Bryan, and Martin Buxton from HERG, Brunel University, Uxbridge, Middlesex UB8 3PH; James Neuberger, Adele Shields, and Julie Truszkowska from Liver & Hepatology Unit, Queen Elizabeth Hospital, Edgbaston, Birmingham B15 2TH; Alex Gimson and Sharon Willmott from the Department of Medicine, Addenbrookes Hospital, Hills Road, Cambridge CB2 2QQ; Steve Pollard and Susan Sheridan from the Liver Transplant Unit, St James' University Hospital, Leeds LS9 7TF; John O'Grady and Susan Landymore from the Institute of Liver Studies, Kings College School of Medicine & Dentistry, Bessemer Road, London SE5 9PJ; Andrew Burroughs and Sheila Jones from the Liver Transplant Unit, Royal Free Hospital, Pond Street NW3 2QG; Digby Roberts and Deborah Smith from the Liver Transplant Unit, The Freeman Group of Hospitals, High Heaton, Newcastle-upon-Tyne NE7 7DN.
The CELT project and this methodological study were both supported financially by the UK Department of Health Policy Research Programme.
The views expressed are those of the authors only. Any errors or omissions are the sole responsibility of the authors.
References
Altman DG,
Royston P.
2000
What do we mean by validating a prognostic model?
Stat Med.
19:
453–
473.Google Scholar
Black N.
1996
Why we need observational studies to evaluate the effectiveness of health care.
BMJ.
312:
1215–
1218.Google Scholar
Bonsel GJ,
Klompmaker IJ,
van 'T Veer F, et al.
1990
Use of prognostic models for assessment of value of liver transplantation in primary biliary cirrhosis.
Lancet.
335:
493–
497.Google Scholar
Christensen E,
Altman DG,
Neuberger J, et al.
1993
Updating prognosis in primary biliary cirrhosis using a time dependent Cox regression model.
Gastroenterology.
105:
865–
1876.Google Scholar
Collett D.
1994
Modelling survival data in medical research.
Texts in Statistical Science.
London:
Chapman & Hall;
Decisioneering, Inc.
1994
Crystal ball: User's guide.
Denver, CO;
Decisioneering, Inc;
Dickson ER,
Grambsch PM,
Fleming TR, et al.
1989
Prognosis of primary biliary cirrhosis: Model for decision making.
Hepatology.
10:
1–
7.Google Scholar
Draper D.
1995
Assessment and propagation of model uncertainty (with discussion)
J R Stat Soc B.
57:
45–
97.Google Scholar
Longworth L,
Young T,
Buxton MJ, et al.
2003
Mid-term cost-effectiveness of the liver transplantation programme of England and Wales for three disease groups.
Liver Transpl.
9:
1295–
1307.Google Scholar
Murtaugh PA,
Dickson ER,
Van Dam GM, et al.
1994
Primary biliary cirrhosis: Prediction of short-term survival based on repeated patient visits.
Hepatology.
20:
126–
134.Google Scholar
Neuberger J,
Altman DG,
Christensen E,
Tygstrup N,
Williams R.
1986
Use of a prognostic index in evaluation of liver transplantation for primary biliary cirrhosis.
Transplantation.
4:
713–
716.Google Scholar
Neuberger J,
Lucey MR.
1994
Liver transplantation: Practice and management.
Annapolis Junction, MD:
BMJ Publishing Group;
Pasha TM,
Dickson ER.
1994
Survival algorithms and outcome analysis in primary biliary cirrhosis: Prediction of short-term survival based on repeated patient visits.
Hepatology.
20:
126–
134.Google Scholar
Powe NR,
Griffiths RI.
1995
The clinical-economic trial: Promise, problems, and challenges.
Control Clin Trials.
16:
377–
394.Google Scholar
Spiegelhalter DJ,
Thomas A,
Best NG.
1999
WinBUGS Version 1.2 User Manual;
Mathsoft Data Analysis Products Division.
2000
S-PLUS 2000 Guide to statistics.
vol. 1 and 2.
Seattle, WA:
Mathsoft Data Analysis Products Division;

Demographic and Clinical Characteristics for the CELT Cohort Immediately Prior to Transplant and the Mayo Nontransplant Cohort at the Time of Final Study Visit
Regression Coefficients and Standard Errors for the Fitted Mayo Prognostic Model

Survival Estimates (S0(t)) Over 4 Years for the Prognostic Model Presented in Table 2
Kaplan-Meier posttransplant survival (with 95 percent confidence intervals) and shadow survival estimated from a prognostic model using regression coefficients alone.
Shadow survival estimated from a prognostic model with 95 percent confidence bands for shadow survival calculated using the simulated data sets, where (i) the standard errors of the regression coefficients (light shaded area) and (ii) also the correlation between regression coefficients (dark shaded area) are accounted for in the uncertainty.

Correlation Between Regression Coefficients for the Prognostic Model Presented In Table 2
 You have
Access
- 3
- Cited by