I. INTRODUCTION
In recent years, fully lamellar γ-TiAl based alloys are widely studied as a new generation of high temperature structural material in aerospace and automotive industries because of the low density, high temperature strength, and creep resistance. Reference Kim, Hong, Na, Yeom and Kim1,Reference Clemens and Mayer2 However, their poor ambient temperature ductility and hot workability restrict their wide applications. The properties of fully lamellar γ-TiAl based alloys are very sensitive to the lamellar orientation. A balance of combination of room-temperature ductility and strength can be achieved when the lamellar orientation is aligned parallel to the tensile stress direction. Reference Johnson, Inui, Muto, Omiya and Yamanaka3,Reference Inui, Oh, Nakamura and Yamaguchi4 The lamellar orientation can be aligned by directional solidification (DS) technique using two main methods, namely seeding Reference Johnson, Inui, Muto, Omiya and Yamanaka3,Reference Johnson, Inui and Yamaguch5–Reference Lee, Johnson, Inui, Oh, Wee and Yamaguchi8 and alloying. Reference Jung, Jang, Oh, Lee and Wee9,Reference Jung, Oh, Park, Kumar and Wee10 According to previous reports, the lamellar orientation of Ti–47Al is aligned parallel to the growth direction (GD) by using Ti–43Al–3Si seeds. Reference Dong, Chen, Guo, Ding, Su and Fu11 The aligned microstructure in Ti–44Al–5Nb–3Cr–1.5Zr (at.%) is also obtained by the addition of β phase stabilizing elements. Reference Lapin, Ondrú and Nazmy12 These studies mainly focus on the control of lamellar orientation by optimizing solidification parameters during DS of TiAl alloys. The data for the dependency of solidification parameters on the microstructural characteristics and development is still scarce in TiAl-based alloys. To effectively and successfully control the final lamellar orientation, the effects of solidification parameters on the microstructural characteristics and detailed information on the microstructure formation and evolution during DS of TiAl-based alloys are needed.
Efforts also have been focused on refining microstructures and improving the mechanical properties by alloying additions of B, Si, W, Cr, V, Mn, and Mo. Reference Dong, Chen, Guo, Ding, Su and Fu11–Reference Hu14 Small additions of B and Si have been shown to refine the lamellar structure in TiAl-based alloys. Reference Imayev, Imayev, Oehring and Appel15,Reference Brotzu, Felli and Pilone16 The addition of W to TiAl alloy can improve their high temperature properties, which acts as solid solution strengthener and stabilizer of β-phase effectively. It has been shown that TiAl alloy modified by 2 at.% W contains numerous fine β-precipitates on lamella interfaces, which can improve the high temperature properties. Reference Yin, Lupinc and Battezzati17,Reference Hodge, Hsiung and Nieh18 However, the excess of W element may segregate in dendrite cores, producing a detrimental effect on creep resistance. The addition of silicon to TiAl alloy improves high-temperature oxidation resistance. The coherent Ti5Si3 particles formed through eutectic transformation along lamellar interfaces enhance creep resistance and inhibit dynamic recrystallization. Reference Lapin, Ondrú and Nazmy12,Reference Yin, Lupinc and Battezzati17,Reference Yu, He, Jin, Guo, Ye and Lupinc19 The aim of the present work is to experimentally investigate the microstructure evolution of the directionally solidified Ti–47Al–1.0W–0.5Si (at.%) alloy under a constant temperature gradient (G). The effects of growth rate (V) on the growth morphology, microstructure parameters, and microhardness are determined. These results will provide a reference to control the microstructures during the DS of TiAl-based alloys. These can be attributed to the complex solidification behavior and microstructure development for the precisely controlling microstructures in multiTiAl-based alloys. These also can facilitate the engineering applications of the lamellar orientation control of TiAl-based alloys.
II. EXPERIMENTAL PROCEDURE
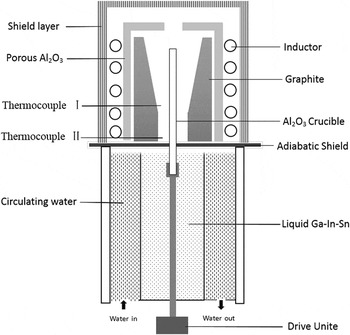
Master ingot with the nominal composition of Ti–47Al–1.0W–0.5Si (at.%) alloy was prepared by using Ti (99.99%), Al (99.99%), Si (99.99%), and Al—50 wt% W with commercial purity in a cold crucible induction furnace under an argon atmosphere. Chemical composition of the ingot was measured by spectral analysis, the results were shown in Table I. The master batch was machined into cylindrical bars with 6 mm diameter and 120 mm length by electric spark machine. DS experiments were performed in Bridgman-type vacuum furnace, which consisted of four zones: an induction coil, a graphite heater, a water cooled liquid metal bath filled with liquid Ga–In–Sn alloy, and an adiabatic zone which was located between the heater and the cooler, as shown in Fig. 1. Samples were placed in an alumina tube with a length of 150 mm and internal/external diameter of 7 mm/8.5 mm. Yttria was coated between the alumina tube and samples to prevent the reaction between the TiAl melt and alumina. The chamber of the furnace was vacuumed to the level of 5 × 10⁻³ Pa and high argon was backfilled to prevent evaporation of aluminum before the DS. The samples were heated to 1773 K within 2 h and thermal stabilized for 30 min, and then were directionally solidified with different growth rates (V) that ranged from 3 to 100 μm/s at a constant temperature gradient of 18 K/mm. The detailed measurements of temperature gradient were presented in the work of Fan et al. Reference Fan, Li, Su, Chen, Guo and Fu20,Reference Fan, Li, Su, Guo and Fu21 After the samples grew to 40 mm, they were quenched into the liquid Ga–In–Sn alloy to preserve the solid–liquid interface.
Chemical compositions of the experimental Ti–47Al–1.0W–0.5Si (at.%) alloy.

Schematic diagram of the Bridgman type apparatus.

The directionally solidified bars were sectioned longitudinally, and cut transversely in the DS regions. Microstructure analysis was performed by optical microscopy, scanning electron microscopy equipped with an energy dispersive spectrometer after being polished and etched by a solution of 10 mL HF + 10 mL HON3 + 180 mL H2O.
The primary dendritic arm spacing was measured by used the linear intercept method as described in Refs. Reference Kaya, Çadırlı and Gündüz22–Reference Böyük and Maraşlı24. Interlamellar spacing was measured on the SEM backscattered electron images according to the method described in Refs. Reference Çadırlı, Kaya and Gündüz25 and Reference Böyük, Maraşlı, Kaya, Çadırlı and Keşlioğlu26. The measured values were the average values and presented in Table II. The microhardness measurements were made with a standardized Vickers measuring test device at a load of 0.98 N (100 g) and a dwell time of 10 (s) on the surface of longitudinal section with polished and slightly etched surfaces. Every value of microhardness was an average of 10 measurements. The values of H V were also given in Table II.
The values of primary dendritic spacing, lamellar spacing and microhardness for directionally solidified Ti–47Al–1.0W–0.5Si (at.%) alloy at various growth rates with constant temperature gradient (G = 18 K/mm).

III. RESULTS AND DISCUSSION
A. Macrostructures
Figure 2 shows the detailed longitudinal macrostructures of Ti–47Al–1.0W–0.5Si samples obtained by the Bridgman DS in quenched bars grown at 3, 5, 10, 20, 50, and 100 μm/s. The columnar grains grow directionally and four regions could be distinguished: nonmolten region (region A), annealing region (region B), DS region with columnar grains (region C), and the quenched region (region D). In region A, the casting grains are retained since the section is placed into the liquid Ga–In–Sn alloy. In the annealing region B, coarse columnar grains form because of the effect of heat treatment of the transitional zone. Once pulling started, numerous columnar grains form and grow competitively. The number of columnar grains decreases with the increase of growth rate (V) and growth length (L) in the DS region due to the increase of competitive growth, as shown in region C. At the end of solidification, a near single and preferred growth crystal is produced in the upper part of the bar usually. The quenched solid–liquid interface freezes the high temperature phases, which needs further analysis of solidification behavior and segregation.
Optical macrostructures of directionally solidified samples in longitudinal section at 3 μm/s (a), 5 μm/s (b),10 μm/s (c), 20 μm/s (d), 50 μm/s (e) and 100 μm/s (f), respectively, under a constant temperature gradient of G = 18 K/mm.

B. Microstructures
1. The quenched solid/liquid interface and determination of the primary phase
Figure 3 shows the interfacial morphologies at different growth rates (V) (a–f) under a constant temperature gradient of G = 18 K/mm, the GD in the figure is from the bottom to the top. The cellular [Figs. 3(a) and 3(b)] and dendritic/cellular [Figs. 3(c)–3(e)] morphologies can be observed at the solid/liquid interface. The morphologies of the interface change from plane to cells, and then to dendrites with the increase of growth rate (V).
Interfacial morphologies of directionally solidified Ti–47Al–1.0W–0.5Si ingots in longitudinal section at 3 μm/s (a), 5 μm/s (b),10 μm/s (c), 20 μm/s (d), 50 μm/s, (e) and 100 μm/s (f), respectively, under a constant temperature gradient of G = 18 K/mm.

Two methods are classified to identify the primary phase during the DS of TiAl alloys.
Reference Zhong, Li, Kou and Li27
Firstly, the primary phase can be determined through the final lamellar orientation.
Reference Yamaguchia, Johnson, Lee and Inui28
The primary phase is β phase, when the resulting microstructure is columnar grains with the lamellar boundaries oriented parallel and 45° to the GD, since the primary phase, and the final lamellar microstructure follows the Burgers orientation relationship:
 $\left\{ {110} \right\}\beta //\left\{ {0001} \right\}\alpha //\left\{ {111} \right\}\gamma$
,
 $\left\langle {111} \right\rangle \beta //\left\langle {11\bar 20} \right\rangle \alpha //\left\langle {110} \right\rangle \gamma$
. The α phase is precipitated first when finally lamellar microstructure is all perpendicular to the heat flow direction since the preferred GD of α phase is
 $\left\langle {0001} \right\rangle$
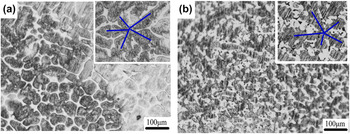
direction. The other method is according to the symmetry of the primary dendrites. The hexagonal α phase exhibits dendrites with 6-fold symmetry, in which the second arms are oriented 60° to the primary dendrite spines. The cubic β phase also can be determined by the 4-fold symmetry. The tilting angle between the primary and secondary dendrite from the longitudinal sections is illustrated in Fig. 3. The α phase is easily found to be the primary phase for Ti–47Al–1.0W–0.5Si by identifying the shape of the dendrites. Figure 4 shows the transverse sections of solid/liquid interface at the growth rates (V) of 20 and 50 μm/s in mushy zone. The 6-fold symmetry of the dendrites indicates that Ti–47Al–1.0W–0.5Si is solidified via α phase at the growth rates (V) of 20 and 50 μm/s. The dendrite arms are not well developed for the constrained dendritic growth.
Reference Lapin and Gabalcová29
The growth morphologies from transverse sections of directionally solidified Ti–47Al–1.0W–0.5Si at the different growth rates (V): (a) 20 μm/s, (b) 50 μm/s, respectively, under a constant temperature gradient of G = 18 K/mm.

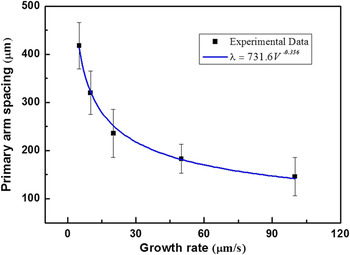
The dendritic length increases with increasing growth rate (V) in dendrite regime. Primary dendrite arms, as well as second dendritic arms, get closer to each other with the increasing growth rate (V) too, as shown in Table II and Fig. 5. The dendritic arm spacing is an important microstructural feature that has an impact on the final structure in directionally solidified alloys. The variation of dendritic arm spacing during DS has been extensively studied. Reference Lapin, Ondrú and Nazmy12,Reference Kaya, Gündüz, Çadırlı and Maraşlı23,Reference Fan, Li, Su, Guo and Fu30 The measured primary dendritic spacing (λ) decreases proportionally with increasing growth rate (V) according to the following relationship Reference Ding, Lin, Qi, Zhang, Song and Chen31 :
 $$\lambda = M{V^n}\quad ,$$
where M is a material constant and n is the exponent of crystallization rate. Regression analysis of experimental data yields an equation in the form:
 $$\lambda = 731.6{V^{ - 0.356}}\quad .$$
Dependence of the primary dendritic arm spacing (λ) on the growth rate (V) in directionally solidified Ti–47Al–1.0W–0.5Si alloy under a constant temperature gradient of G = 18 K/mm.

The result is shown in Fig. 5, and the regression coefficient of the fit is R 2 = 0.99. It agrees to Hunts primary spacing model which indicates λ ∝ V −1/4 ∼ V −1/2.
2. Microstructure in the DS region
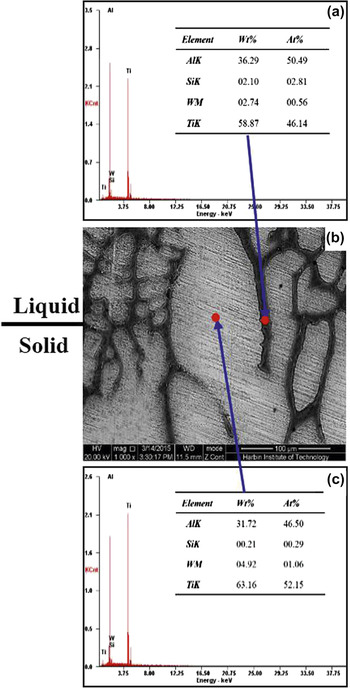
Figure 6 shows the detailed microstructure evolution from initial solidification to steady-state growth and mushy zone with the growth rates (V) ranging from 5 to 100 µm/s. The GDs in the figure are from the bottom to the top. At a relatively low growth velocity of 5 µm/s, the α phase is the primary phase and the directionally solidified region consisted of column grains aligned along the GD, as shown in Fig. 6(a). A fully lamellar structure of γ/α2 is obtained in these column grains after a series of phase transformation, and some lath-shaped Ti5Si3 particles form in the interdendritic region due to the low solubility of Si in the matrix. The formation of Ti5Si3 phase mainly occurs in two ways in TiAl-based alloys, one way is that some isolated large Ti5Si3 rods precipitate in the Si-rich region from the liquid by reaction of L → Ti5Si3. The other way is the eutectic Ti5Si3 phase formed by reactions: L → α + Ti5Si3 and L → λ + Ti5Si3. Reference Fan, Li, Su, Guo and Fu21 In this study, the coherent Ti5Si3 particles are formed by the second method since only 0.5 at.% Si is doped on the master alloy. The elements of Si and Al are rejected into the liquid due to redistribution of solutes, the liquid shift to Al rich composition during DS. EDS analysis shows that interdendritic regions are enriched with Al (50.49 at.%) and Si (2.81 at.%), while the primary α phase is enriched with W (1.06 at.%) and depleted of Al (46.5 at.%), respectively, as shown in Fig. 7. The higher content of Si and Al in the interdendritic region leads to the reaction L → α + Ti5Si3 that occurred in the last solidified liquid phase. From this point of view, phase transformation path determined in this experiment could be described as follows: L → L + α → α + Ti5Si3 → α2 + λ+ Ti5Si3.
The longitudinal section microstructure evolution of directionally solidified Ti–47Al–1.0W–0.5Si at the different growth rates (V): (a) 5 μm/s, (b) 20 μm/s (c) 50 μm/s, (d) 100 μm/s, respectively, under a constant temperature gradient of G = 18 K/mm.

The quenched solid–liquid interface morphologies in directionally solidified Ti–47Al–1.0W–0.5Si alloy at the growth rates (V) of 5 μm/s, energy dispersive spectrometer (EDS) results in interdendrite (a) and dendrite arm (c).

The W element addition acts as solid solution strengthener and stabilizer of β-phase effectively, which also can induce the solute segregation, named S-segregation (Solidification segregation) form during solidification in TiAl-based alloys. Reference Chen, Xu, Teng, Wang and Lin32 The S-segregation will take place at interdendritic region during solidification, in which the composition is characterized by higher Al and Si (silicide). The S-segregation mainly evolves with the discrepancy of the solute distribution coefficient and solidification conditions. Further, S-segregation amplitude increases with the increase of the cooling rate in Ti–47Al–1W–0.5Si alloy, due to the low solute diffusion of the element W, as shown in Figs. 6(a3)–6(d3). Additionally, solute Al enrichment in the interdendritic region may promote the L + α → γ peritectic reaction during primary α growth in the concerned TiAl alloy range, to further increase solute segregation.
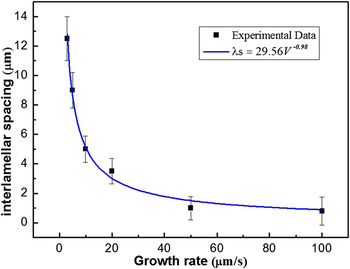
It is clear that the lamellar spacing decreases significantly with the increase of growth rate (V), the lamellar structure is generated during solid-state transformation, Figs. 6(a2)–6(d2). It reveals that the growth rates (V) have great effect on solid-state transformation, the relationship between lamellar spacing (λs) and growth rate (V) during eutectic and eutectoid transformation has been described according to the following relationship Reference Kaya, Çadırlı and Gündüz22 :
 $${\lambda _{\rm{s}}} = K{V^a}\quad ,$$
where K is a material constant and a is the rate exponent. Using regression analysis, the dependencies of the interlamellar spacing on the growth rate (V) in the range of 3 to 100 μm/s can be expressed in the forms of
 $${\lambda _{\rm{s}}}$$
The result is shown in Fig. 8. The regression coefficient of the fit is R 2 = 0.93. The exponential absolute value (0.49) is larger than the 0.41 in Ti–49Al alloy Reference Fan, Li, Su, Chen, Guo and Fu33 and 0.46 in Ti–46Al–2W–0.5Si alloy. Reference Lapin, Ondrú and Nazmy12 Such differences may be attributed to the different compositions of alloys and solidification conditions.
Dependence of the lamellar spacing (λs) on the growth rate (V) in directionally solidified Ti–47Al–1.0W–0.5Si alloy under a constant temperature gradient of G = 18 K/mm.

3. Lamellar orientations
Figures 6(a2)–6(d2) shows the micrographs taken from the steadily grown columnar grains solidified directionally at different growth rates (V) as shown in Fig. 1. It describes that the lamellar microstructure in different samples presents different orientations respective to the GD. As studied in Refs. Reference Johnson, Inui, Muto, Omiya and Yamanaka3 and Reference Kim, Oh, Lee, Inui, Yamaguchi and Wee34, when the body-centered cubic β phase appears from the liquid initially, the final lamellar orientation will be aligned at an angle of 0° or 45° to the GD. Meanwhile, when α is the primary solidification phase, the final lamellar orientation will be perpendicular to the GD. Therefore, the lamellar orientation should be perpendicular to GD. However, the lamellar orientation of the main columnar grain is parallel to GD, as shown in Fig. 6(a2). The orientation in Figs. 6(b2) and 6(d2) are perpendicular to GD, the one in Fig. 6(c2) is aligned about 45°. The reasons for that can be explained as following:
-
(i) During DS process, the lamellar orientation in unmelted region may act as a potential seed influencing the orientation of the lamella in the DS region. It is well known that the top of the seed melts and subsequent growth occurs, causing the orientation of the seeding crystals to be repeated in the solidified alloy during seeding DS. Because the orientation in as-cast grains is stochastic, as shown in Figs. 6(a4)–6(d4), it is reasonable that the final orientation is not perpendicular to GD in Figs. 6(a) and 6(c).
-
(ii) At the initial stage of the DS, the nucleation and competitive growth of crystals should be noted, especially at relatively high growth velocities, which cause some crystal growth deviating from GD severely, as shown in Fig. 2. The GD of new competitive nucleated or retained crystals is not the
 $\left\langle {0001} \right\rangle$
preferred GD, leading to lamellar orientations that are not perpendicular to the GD.
-
(iii) The preferred α dendrite GDs are controlled by the driving forces of interface kinetics, anisotropic interface, or both. Solidification parameters significantly affect the anisotropy of interface energy and further change the dendrite GD. As studied in Ref. Reference Haxhimali, Karma, Gonzales and Rappaz35, the dendrite GDs vary with G/V ratio in DS Al–Zn alloys which were caused by the weak solid–liquid interface energy anisotropy and the solute effect of Al. Similarly, the growth direction of primary α dendrite GDs is related to heat flowing and growth rate (V), which leads to the changing of the lamellar orientation during directional solidification process.

So it is inferred that solidification parameters play an important role on lamellar orientation and spacing in Ti–47Al–1.0W–0.5Si alloy. More work on the correlation between dendrite GD and solidification parameters is necessary.
C. The effect of growth rate (V) on microhardness
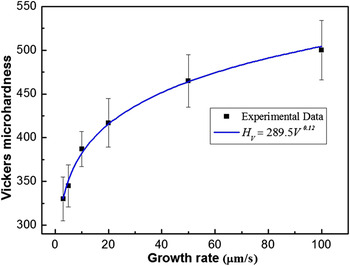
There is a linear relationship between yield stress and microhardness in directionally solidified TiAl alloy, which promises the mechanical properties to be predicted simply and further reflect the processing performance. Reference Fan, Li, Su, Chen, Guo and Fu20,Reference Lapin36 The microhardness is sensitive to chemical composition, solidification processing parameters, and microstructure parameters. In Table II, the microhardness values are measured at the steady-state growth region. The smallest and largest H V are obtained at minimum and maximum growth rate (V), respectively, and the values of H V increase with the increasing values of growth rate (V) at constant G. The variations of the microhardness values with the growth rate (V) are shown in Fig. 9. The relationship between microhardness (H V) and growth rate (V) can be expressed with Hall–Petch type relationships as following Reference Kaya, Gündüz, Çadırlı and Maraşlı23 :
 $${H_{\rm{V}}} = {H_0} + K{V^b}\quad {\rm{,}}$$
where b is exponent values for the growth rate (V), and H 0, K are constants which can be experimentally determined. According to the Eq. (5), the microhardness of materials changes with the growth rate (V). As a result, Eq. (5) can be qualitatively rewritten the as follows Reference Kaya, Gündüz, Çadırlı and Maraşlı23 :
 $${H_{\rm{V}}} \approx K{V^b}\quad {\rm{.}}$$
Dependence of the Vickers microhardness (H V) on the growth rate (V) in directionally solidified Ti–47Al–1.0W–0.5Si alloy under a constant temperature gradient of G = 18 K/mm.

The relationship between H V and V is obtained by using linear regression analysis and the result is given as follows:
 $${H_{\rm{V}}} \approx 289.5{V^{0.12}}\quad {\rm{.}}$$
The regression coefficient of the fit is R 2 = 0.99. The exponent value of growth rate (V) is 0.12, which is lower than 0.14 obtained by Lapin. Reference Lapin, Ondrú and Nazmy12 The values of H V are lower than those measured by Lapin which infers to different growth rates (V) in directionally solidified Ti–47Al–2W–0.5Si alloy. Those different may be attributed to the different solidification conditions and compositions. The microstructure refinement and solute segregation are the reasons for the microhardness variation with the growth rate (V). As discussed above, the microstructure parameters (primary dendritic spacing, lamellar spacing) and solute segregation decrease with the increase of the growth rate (V). Smaller grain size and lamellar spacing can result in higher strength and hardness.
IV. CONCLUSIONS
The effects of growth rate (V) on microstructure evolution and microhardness were investigated under the temperature gradient G = 18 K/mm. The principal results can be summarized as following:
-
(1) The hexagonal α phase is the primary phase in Ti–47Al–1.0W–0.5Si, the primary α phase dendritic arm spacing decreases with increasing growth rate (V) according to λ ∝ V −0.356.
-
(2) The coherent Ti5Si3 particles are formed by eutectic reaction: L → α + Ti5Si3, and S-segregation takes place corresponding to solute W enrichment in primary α phase during the solidification, in which amplitude increases with the increase of the growth rate (V).
-
(3) Interlamellar spacing (λs) decreases with increasing the growth rate (V) according to λs ∝ V −0.49.
-
(4) The hardness increases with increasing growth rate (V) according to H V ∝ 289.5V 0.12.
ACKNOWLEDGMENTS
This project was supported by the National Natural Science Foundation of China (51425402, 51331005).