Introduction
Bread wheat landraces grown in Turkey exhibit great variation. Gen-Banks were established to preserve this diversity and several wheat cultivars have been collected and preserved for years (Akcura et al., Reference Akcura, Kokten, Gocmen Akcacik and Aydogan2016).
Mamluk et al. (Reference Mamluk, Cetin, Braun, Bolat, Bertschinger, Makkouk, Yildirim, Sari, Zencirci, Albustan, Cali, Beniwal and Dusunceli1997) and Mamluk and Nachit (Reference Mamluk and Nachit1994) assessed a series of genotypes composed of Turkey-originated local wheat cultivars through cluster and PCA analyses to find out new resistance sources against bunt disease (Tilletia foetida and Tilletia caries) in durum wheat and identified 26 new resistance sources against bunt disease. In another study investigating worldwide distributions of resistance sources against bunt disease based on geographical regions, Turkey-originated local wheat cultivars were found to have significant variation with regard to resistance to common and dwarf bunt diseases (Bonman et al., Reference Bonman, Bockelman, Goates, Obert, Mcguire, Qualset and Hijmans2006).
Biplot method originated by Gabriel (Reference Gabriel1971), and uses were subsequently expanded by Kempton (Reference Kempton1984) and Zobel et al. (Reference Zobel, Wright and Gauch1988). The extensive usefulness of GGE biplot, where G = genotype effect and GE = genotype-by-environment effect, has been clarified (Yan et al., Reference Yan, Hunt, Sheng and Szlavnics2000). The GGE biplot is a versatile tool for in plant breeding and quantitative genetic. Additionally, GGE biplot helps analyse different types of two-way data such as genotype-by-trait, genotype-by-marker and diallel cross (Yan and Hunt, Reference Yan and Hunt2001).
Recently, the GGE-biplot methodology has been used to determine the stability of disease resistance through multi-location trials, to characterize and identify stability of germplasm, breeding lines and cultivars resistant to diseases such as net blotch (Pyrenophora teres Drechs) in barley (Yan and Falk, Reference Yan and Falk2002), spot blotch disease (Cochliobolus sativus) in wheat (Joshi et al., Reference Joshi, Ortiz-Ferrara, Crossa, Singh, Alvarado, Bhatta, Bhatta, Duveiller, Sharma, Pandit, Siddique, Das, Sharma and Chand2007), fusarium head blight (Fusarium graminearum) and powdery mildew [Blumeria graminis f. sp. tritici (DC.)] in wheat (Kadariya et al., Reference Kadariya, Glover, Mergoum and Osborne2008; Lillemo et al., Reference Lillemo, Singh and Ginkel2010), ascochyta blight (Ascochyta fabae) in faba bean (Rubiales et al., Reference Rubiales, Avila, Sillero, Hybl, Narits, Sass and Flores2012), ascochyta blight [Ascochyta rabei (Pass.) Labr.] in chickpea (Pande et al., Reference Pande, Sharma, Gaur, Basandrai, Kaur, Hooda, Basandrai, Kiran, Babu, Jain and Rathore2013), fusarium wilt (Fusarium udum) in pigeonpea (Sharma et al., Reference Sharma, Ghosh, Telangre, Rathore, Saifulla, Mahalinga and Jain2016).
The present study was conducted with 200 pure lines selected from wheat landraces collected from 18 provinces of seven geographical regions of Turkey to identify their resistance levels to bunt disease (T. foetida) through multi-year evaluations (2012–2014 growing seasons) using the GGE-biplot methodology.
Materials and methods
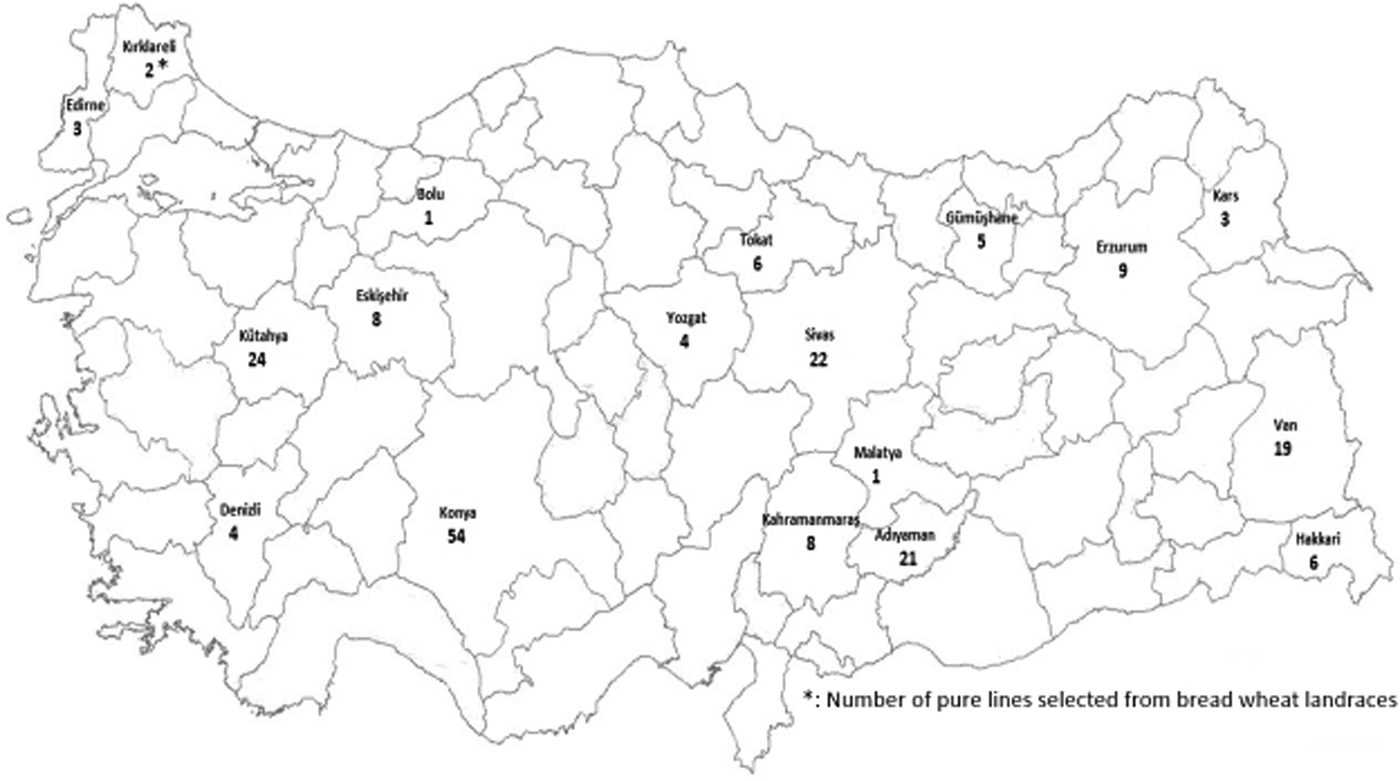
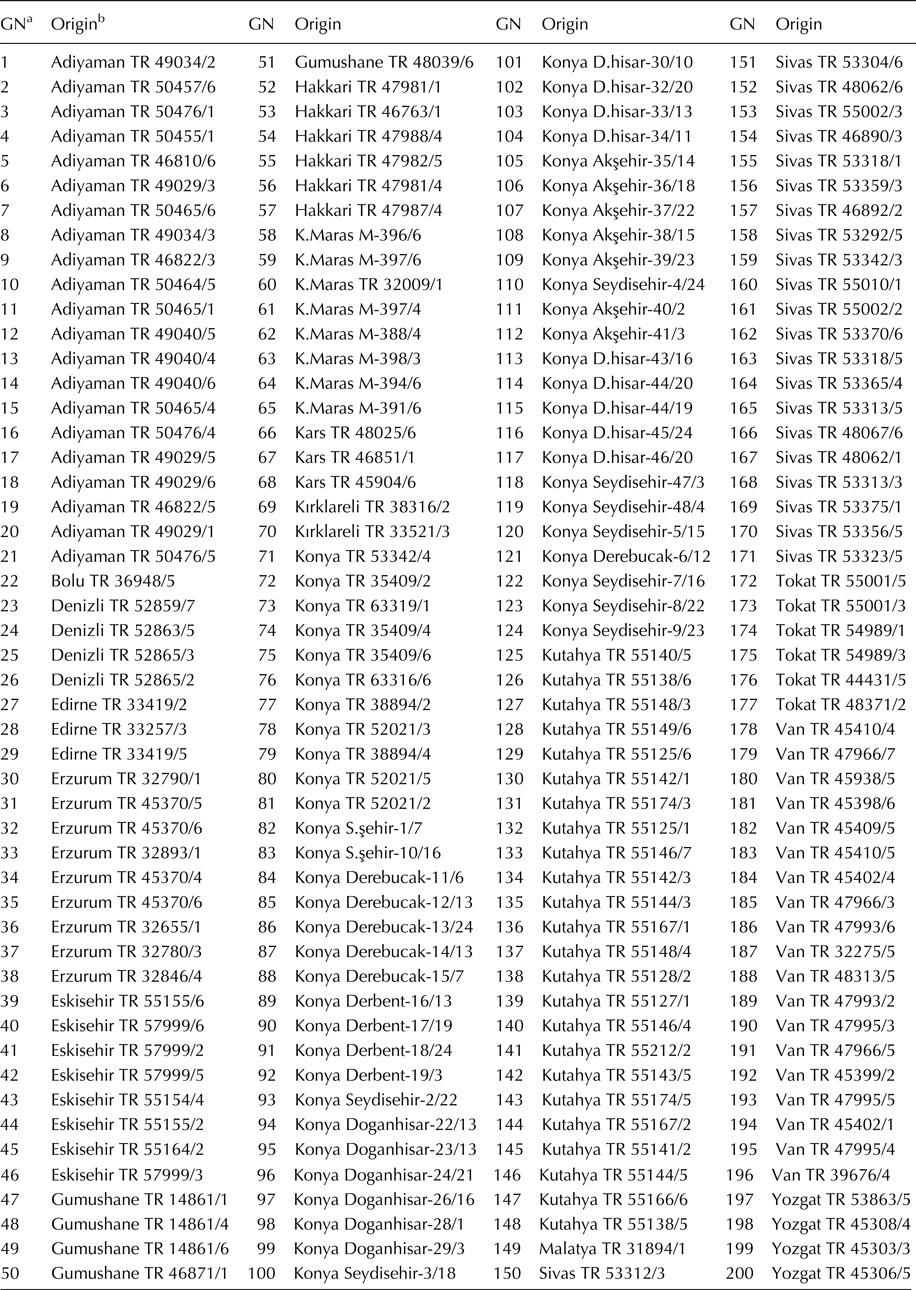
A two hundred pure-line selected from Turkish wheat landraces which stored Turkish National Gen-Bank used as experimental material in this research. While selecting research materials, care was taken to include the provinces with the greatest diversity in wheat landraces and to include material from every province in which wheat landraces were grown (Akcura, Reference Akcura2006). Information about the origins of pure lines and sampling locations were provided in Fig. 1; National Gen-Bank records, provincial information and selection numbers were provided in Table 1.
Originated of pure lines selected from Turkish bread wheat landraces.

Turkish genbank codes, provinces, pure line number of research materials

a Codes used in biplot graph.
b Province/genbank codes/pure line selection number.
The inoculum source used in disease tests was collected in August 2012 from the experimental fields of Field Crops Central Research Institute located in Ankara/Golbasi/İkizce, and bunt disease reaction tests were carried out. Initially, the isolate was identified based on teliospore morphology in collected samples according to Goates (Reference Goates, Wilcoxson and Saari1996). The samples with the common bunt disease [T. foetida (Wall.)], which was the most common one, were reserved as inoculum source according to Akan et al. (Reference Akan, Mert, Çetin, Albostan, Düşünceli and Yazar2005). The present research was conducted under field conditions of İkizce location (longitude: 32°50′ E, latitude: 39°43′ N, altitude: 1225 m) in which bunt disease reaction tests of national/regional wheat breading programmes have been carried out for 10 years.
Infected wheat kernels collected before sowing were smashed in a mortar and sieved to separate the spores from plant material. For sowing, seeds of each genotype were placed in separate paper bags and inoculated with about 0.05% spores at sowing (Akan et al., Reference Akan, Mert, Çetin, Albostan, Düşünceli and Yazar2005). Sowing was performed manually in the first half of November 2012, 2013 and 2014 growing seasons in two replicates over 1 m-long rows with 33 cm row spacing to 5–7 cm depth. After 10 pure lines of test materials were planted, the bunt infested cultivar Little Club (LC) was planted in every 10th rows as a susceptible positive control. Around the experimental plots also, the susceptible cultivars Yakar-99 and LC were sown in four rows as described above. Fertilizer (chemical or organic) and irrigation were not performed in all three growing seasons.
A differential set (CB-DIFF Common Bunt) composed of 17 genotypes with including bunt-resistance genes [Bt0 to Bt15; Heines VI (Bt-0), SEL 2092 (Bt-1), SEL 1102 (Bt-2), Ridit (Bt-3), Turkey 1558 (Bt-4), Hohenheimer (Bt-5), Rio (Bt-6), Sel 50077 (Bt-7), M78–9496 (Bt-8), M82-2098 (Bt-9), M82-2102 (Bt-10), P.I. 178383 (Bt-8,9,10), M82-2123 (Bt-11), P.I. 119333 (Bt-12), P.I. 181463 (Bt-13), Doubi (Bt-14), Carlton (Bt-15)] was used to identify the gene/genes controlling the resistance to disease race/races. The differential set was also sown in the field as the research material.
The experiments were performed in clay-loam soils with a pH of 7.7 under rainfed conditions. The climate in İkizce is semi-arid with cold winters, rainy springs, hot and dry summers. Since both the prevailing northerly winds and the common southerly winds were dry, Ankara/Golbasi/İkizce Basin usually had a relative humidity below 50% during the experimental seasons. The total precipitation was about 200–250 mm.
Statistical analyses
In each growing season, healthy and infected spikes were counted in each genotype of the tested pure line and the differential set between the end of July and the beginning of August when the spikes were matured. Then, percentage of disease incidence was calculated by using the following equation (Akan et al., Reference Akan, Mert, Çetin, Albostan, Düşünceli and Yazar2005; Dumalasova and Bartos, Reference Dumalasova and Bartos2007, Reference Dumalasova and Bartos2010; Dumalasova et al., Reference Dumalasova, Leiova-Svobodova and Bartos2014).
 $$\%\; {\rm Disease}\;{\rm incidence} = \displaystyle{{{\rm No}{\rm.} \;{\rm of}\;{\rm infected}\;{\rm spikes}} \over {{\rm Total\;} \;{\rm no}.{\rm \;} \;{\rm of\;} \;{\rm spikes}}} \times 100.$$
By using resultant average percentages of 3 years, they were grouped as: immune (0.0% incidence), resistant (0.1–10.0% incidence), moderately resistant (10.1–25.0% incidence), moderately susceptible (25.1–45% incidence), susceptible (45.1–70.0% incidence) and highly susceptible (>70.1% incidence).
Before biplot analysis, per cent values of disease reactions of pure lines were subjected to arcsine transformation to normalize the percentile data. The GGE-biplot technique was used to create a genotype-focused GGE-biplot graph to assess the reactions of the pure lines against bunt disease statistically and to select resistant materials for national/regional disease resistance genetic sources (Yan and Falk, Reference Yan and Falk2002; Yan, Reference Yan2014). The statistical theory of GGE-biplot methodology was explained in detail previously (Yan, Reference Yan2014).
The GGE model used to determine the resistance of pure line across years was:
 $${\rm \; \;} Y_{ij} - \mu - \beta _j = \lambda _1 {\rm \;} \xi _{i1} {\rm \;} \eta _{1j} + \lambda _2 {\rm \;} \xi _{i2} {\rm \;} \eta _{2j} + \varepsilon ij,$$
where Y ij = the expected value for pure line i in year j ; μ = the grand mean of all pure line–year combinations; β j = the main effect of year j; λ 1 and λ 2 are the singular values of first and second largest principal components, PC1 and PC2, respectively; ξ i1 and ξ i2 are the eigenvectors of pure line i for PC1 and PC2, respectively; η 1j and η 2j are the eigenvectors of year j for PC1 and PC2, respectively, and ε ij = the residue for each pure line–year combination not explained by PC1 and PC2.
The biplot was constructed by plotting the first two principal components (PC1 and PC2) derived from singular value decomposition of the year-centred data (Yan and Falk, Reference Yan and Falk2002; Yan, Reference Yan2014).
In order to assess the resistance of genotypes, the average environment coordinate (AEC) was plotted by taking the mean of PC1 and PC2 scores for years. A performance line passing through the origin of the biplot was used to determine the mean performance of the genotype. The circles created as taking the AEC axis as the focus improved the efficiency of biplot graph in selecting the ideal pure lines. There were six sections in the graph composed of nested circles and these sections were associated with reaction groups. Based on annual performance of pure lines and variations in bunt disease reactions, the location of pure lines on the graph either moved close to or away from the AEC axis. Furthermore, among genotypes with close disease reaction averages in three growing seasons, the location of the ones with high or low infection rates in any one of the growing seasons moved away from the centre of the graph. While highly resistant ones were in the first section, highly susceptible ones were located in the sixth section.
Results
Bunt disease was developed in the tested genotypes throughout the growing seasons of 2012–2013, 2013–2014 and 2014–2015. In all three growing seasons, 90–100% of bunt infections were observed in the susceptible control cultivars of LC and Yakar-99. Such an outcome indicated the success of inoculation and ruled out that a genotype was falsely classified as resistant due to the lack of viable and infective inoculum.
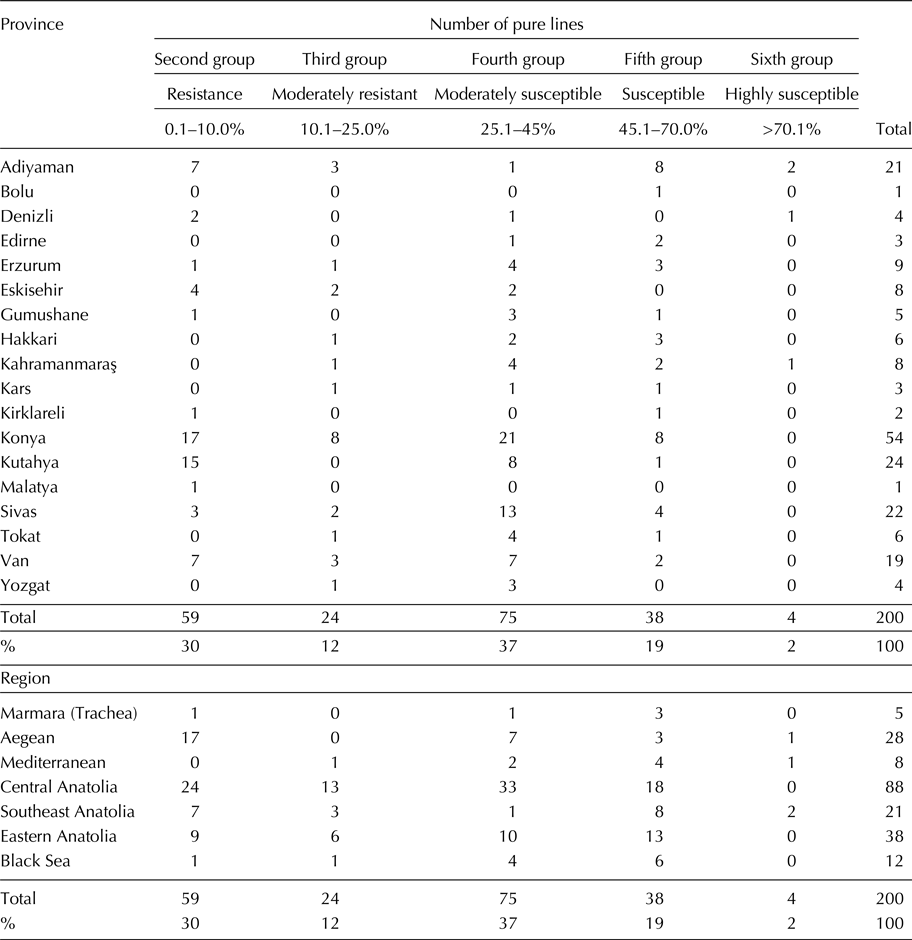
Among the resistance genes in differential set, the inoculum of disease source was virulent/effective on Bt0, Bt2, Bt3, Bt4, Bt6 and Bt7 and avirulent/ineffective on Bt-1, Bt-5, Bt-8, Bt-9, Bt-10, Bt-8,9,10, Bt-11, Bt-12, Bt-13, Bt-14, Bt-15, provincial and regional grouping of the pure lines based on their reactions against bunt disease provided in Table 2.
Provincial and regional grouping of pure lines based on their reactions against bunt disease

Significant differences were observed among the 200 pure lines. The disease incidences of pure lines against the bunt disease ranged from 0.0 to 98.3% in the first growing year, from 0.0 to 94.9% in the second year and from 0.0 to 96.2% in the third growing year.
When 3-year research results were assessed together, it was observed that none of the pure lines was immune; 59 pure lines were resistant; 24 pure lines were moderately resistant; 75 pure lines were moderately susceptible; 38 pure lines were susceptible and four pure lines were highly susceptible.
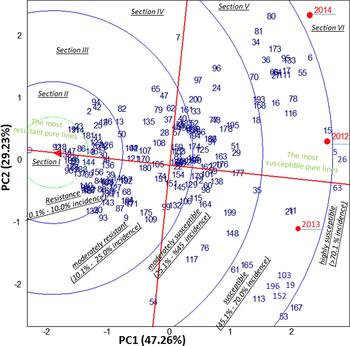
Biplot graph explained 76.49% of the total variation. The GGE-biplot method has recently been used in disease assessment of different plants (Yan, Reference Yan2014; Sharma et al., Reference Sharma, Ghosh, Telangre, Rathore, Saifulla, Mahalinga and Jain2016) and was used for the first time in the assessment of bunt disease in wheat. Low PC1 values (negative values) and PC2 values close to 0.0 in biplot explained the resistance of genotypes to bunt disease in the best fashion. The circles created taking the AEC axis as the focus improved the efficiency of biplot graph in selecting the ideal genotype. There were six sections in the graph composed of nested circles and these sections were associated with reaction groups. Resistance of the pure lines decreased from the first section through the last section. While the most resistant genotypes were located within the inner section indicated by the first circle (with disease infection rates of between 1.8 and 5.4%), the most susceptible genotypes (with an infection rate of ≥70.1%) were located in the outer circle. The disease resistant group (with infection rates of between 0.1 and 10%; composed of 59 genotypes) was located within the second circle.
Discussion
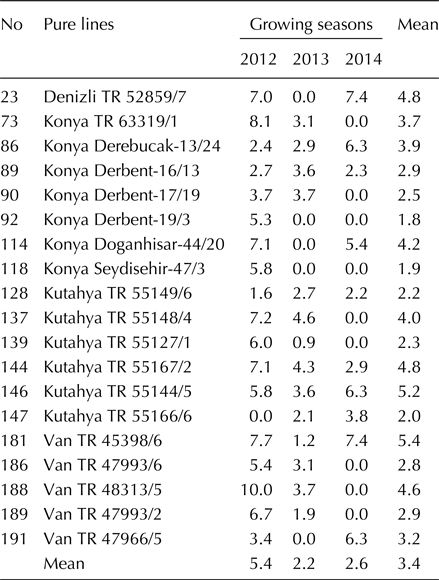
In this study, bunt disease infection rates in susceptible control cultivars (% infected spikes) were close to 100%. In tested pure lines, the greatest infection rate observed was 98.3% in the first year, 94.9% in the second year and 96.2% in the third year. Current findings obtained without chemicals and fertilizers applications and are therefore, unbiased by these factors. The infection rate was relatively lower in the second year. Compared with long-term averages of the Ankara–İkizce location, winter season of the second year was warmer and wetter. Therefore, plants grew faster after a certain period with higher seasonal temperatures. Rapid growth allowed plants to abstain from the systemic disease to some extent. Recently, GGE biplot has been used to characterize and determine stability of germplasm, breeding lines and cultivars resistance to diseases such as anthracnose in water yam (Egesi et al., Reference Egesi, Onyeka and Asiedu2009), chocolate spot disease in faba bean (Villegas et al., Reference Villegas-Fernández, Sillero, Emeran, Winkler, Raffiot, Tay, Flores and Rubiales2009), white rust in brassica (Sandhu et al., Reference Sandhu, Brar, Chauhan, Meena, Awasthi, Rathi, Kumar, Gupta, Kolte and Manhas2015), dry root rot and stunt disease in chickpea (Kumar et al., Reference Kumar, Baranwal, Kumar, Gupta and Kumar2017), yellow mosaic disease in mungbean (Parihar et al., Reference Parihar, Basandrai, Sirari, Dinakaran, Singh, Kannan, Kushawaha, Adinarayan, Akram, Latha, Paranidharan and Gupta2017), grey leaf spot in maize (Acorsi et al., Reference Acorsi, Guedes, Coan, Pinto, Scapim, Pacheco and Casela2017). When the first section of the biplot was assessed separately from the entire graph, it was observed that 19 pure lines were placed in this section (Fig. 2). The average values for disease reactions of these genotypes for three growing seasons were provided in Table 3. These genotypes had quite low infection rates (ranging between 1.8 and 5.4%) in all 3 years. Year-based average disease epidemy was identified as 3.4%.
Genotype, genotype–environment (GGE)-biplot graph created based on disease infection rates of the pure lines selected from Turkish bread wheat landraces.

Bunt disease reactions (%) of the most resistant pure lines placed in the first section of GGE biplot

As the average of 3 years, the lowest bunt infection rates were observed in line numbers 92 (Konya Derbent-18/24), 118 (Konya Seydisehir-47/3), 147 (Kutahya TR 55166/6), 128 (Kutahya TR 55149/6) and 139 (Kutahya TR 55127/1) numbered pure lines (respectively with 1.8, 1.9, 2.0, 2.2 and 2.3%) (Table 3). These pure lines were placed right into the centre of the first section as the most resistant genotypes (Fig. 2). The position of the pure lines in the biplot graph varied based on disease reaction rates of growing seasons. For the first section, such a case indicated the best by the pure lines of 23 (Denizli TR 52859/7), 181 (Van TR 45398/6) and 188 (Van TR 48313/5). The genotypes located over the circle line of the first section (23, 181 and 188-numbered pure lines) had higher infection rates than the others in the most resistant group.
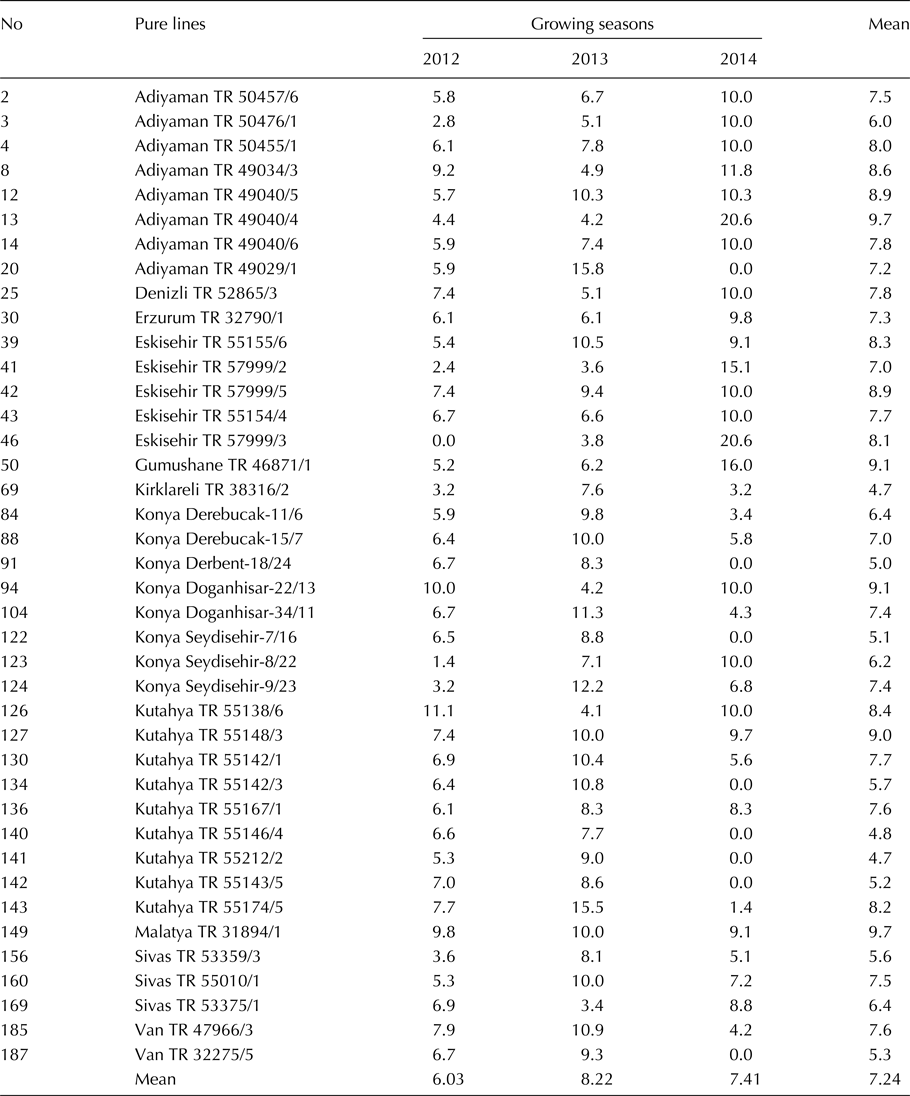
There were 40 pure lines in the second section of the biplot graph. Year-based disease infection rates of these genotypes were provided in Table 4. The average infection rate was 7.2% with the lowest value of 5.3% and the greatest value of 9.7%. The pure lines in this section were resistant to bunt disease. However, they were separated from the first group (the most resistant group) located in the first circle. The second group can be considered as the ideal genetic source to create a variation in disease-resistant sources in wheat breeding programmes. Thus, in bunt disease breeding studies, the genotypes with 10% or less infection rates were assessed as resistant in several studies (Akan et al., Reference Akan, Mert, Çetin, Albostan, Düşünceli and Yazar2005; Dumalasova and Bartos, Reference Dumalasova and Bartos2007, Reference Dumalasova and Bartos2010; Dumalasova et al., Reference Dumalasova, Leiova-Svobodova and Bartos2014).
Bunt disease reactions (%) of the pure lines placed in the second section of GGE biplot

Among the investigated genotypes, 75 pure lines (with infection rates of between 25.1 and 45%) were categorized as moderately susceptible. All of these genotypes were placed within the fourth section of the biplot graph (Fig. 2). The most significant issue in breeding programmes for resistance to diseases in wheat was the identification of resistance sources based on the groups created by the breeders. Therefore, infection rates may vary in the assessment of moderately susceptible group of fungal disease resistance researches. Thus, in some studies, the genotypes with disease infection rates between 10.1 and 20% were accepted as moderately resistant and the ones with infection rates between 20 and 40% were accepted as susceptible (Dumalasova and Bartos, Reference Dumalasova and Bartos2007, Reference Dumalasova and Bartos2010; Dumalasova et al., Reference Dumalasova, Leiova-Svobodova and Bartos2014; Sharma et al., Reference Sharma, Ghosh, Telangre, Rathore, Saifulla, Mahalinga and Jain2016).
All of the susceptible genotypes were placed in the fifth section of biplot graph (Fig. 2). Highly susceptible ones were placed in the sixth section. Based on this assessment, the pure line 92 (Konya Derbent-19/3) with the lowest average disease reaction was placed on far-left over AEC and the pure line 63 (Kahramanmaras M-398/3) with the greatest disease reaction was placed on far-right.
According to 3-year averages, among the pure lines, 59 lines were identified as resistant to bunt disease (0.1–10%). Considering the provinces from where the research materials were collected, it was observed that there were resistant genotypes among the pure lines of 11 provinces (Adiyaman, Denizli, Erzurum, Eskisehir, Gumushane, Kirklareli, Konya, Kutahya, Malatya, Sivas and Van), while no resistant genotypes among the pure lines of seven provinces (Bolu, Edirne, Hakkari, Kahramanmaras, Kars, Tokat and Yozgat). In a study assessing the resistance of USDA – ARS national genetic materials to different bunt diseases (Tilletia tritici, Tilletia laevis and Tilletia controversa), resistance sources included the materials collected from Turkey (Bonman et al., Reference Bonman, Bockelman, Goates, Obert, Mcguire, Qualset and Hijmans2006). That study was quite similar to the presented study with regard to identification of resistant materials in bread wheat materials. Tilletia foetida was the most common bunt disease in Turkey (Iren et al., Reference Iren, Maden and Coskun1982). With this study, pure lines selected from Turkish bread wheat landraces, of which the reactions against bunt disease have not been tested previously, were assessed.
The study results indicated that GGE-biplot method could efficiently be used to group bunt disease-resistant genotypes. Based on the present results, among the genotypes, 19 pure lines identified as the most resistant to bunt disease were transferred to resistance breeding programmes.
Acknowledgements
This paper presents research findings obtained through the 3-year field experiments implemented with the support provided by Turkish Scientific and Technological Research Council (with a project number of 111O255). Acknowledgements were also extended to Associate Professor Dr Zeki GOKALP (a faculty member in Biosystems Engineering Department and a certified-notarized English translator) for his critical English language review of the paper.
Funding
This study was funded by Scientific and Technological Research Council of Turkey (TUBITAK, Project No: 111O255).