Introduction
Infertility presents an ever-growing concern in modern days. According to World Health Organisation (WHO) data, rates of infertility has been in a constant state of elevation over the recent years (Fischer-Holzhausen and Röblitz, Reference Fischer-Holzhausen and Röblitz2022; World Health Organisation, 2023). Paralleling the increase in infertility, use of assisted reproductive technologies (ART) has seen a sharp rise in their use and rapid development. In vitro fertilisation (IVF) and intra cytoplasmic sperm injection (ICSI) represent the most well-known techniques among the entire repertoire of ART. Infertility can derive from female and/or male factors (Brugo-Olmedo et al., Reference Brugo-Olmedo, Chillik and Kopelman2001; Carson and Kallen, Reference Carson and Kallen2021). During ART procedures common measurements include, assessment of female hormones, initial antral follicle count for the females and semen analysis for the males. Suitable couples may go through ART cycles and further assessment of follicle number, metaphase I and II oocyte numbers for the female partner and for males, semen analysis including sperm number, sperm motility and morphology are conducted. Moreover, for the resulting embryos, day 5 grading and day 6 grading is carried out mostly by using the Gardner system to determine the morphological quality. A number of centres choose to culture the embryos until day 5 post fertilisation and thus the blastocysts are graded in three categories of expansion status, trophectoderm quality and inner cell mass quality, respectively (Gardner and Schoolcraft, Reference Gardner and Schoolcraft1999). Furthermore, genetic analysis of the embryos may be applied to choose an unaffected embryo for transfer enabling a “healthy” pregnancy. Evidence towards the integrity of genetic tests prior to implantation remains contradictory (Barad et al., Reference Barad, Albertini, Molinari and Gleicher2022; Cornelisse et al., Reference Cornelisse, Zagers, Kostova, Fleischer, van Wely and Mastenbroek2020; Pagliardini et al., Reference Pagliardini, Viganò, Alteri, Corti, Somigliana and Papaleo2020; Tong et al., Reference Tong, Niu, Wan and Zhang2022; Yan et al., Reference Yan, Qin, Zhao, Sun, Gong, Li, Sun, Ling, Li, Hao and Tan2021). Preimplantation genetic testing for aneuploidy (PGT-A) can be applied to couples to select an embryo with no aneuploidies that may improve embryo development as well as implantation rates (Gulersen et al., Reference Gulersen, Baum, Bornstein, Krantz, Singer and Divon2019; Kimelman and Pavone, Reference Kimelman and Pavone2021; Treff et al., Reference Treff, Eccles, Lello, Bechor, Hsu, Plunkett, Zimmerman, Rana, Samoilenko, Hsu and Tellier2019; Zegers-Hochschild et al., Reference Zegers-Hochschild, Adamson, Dyer, Racowsky, Mouzon, Sokol and Rienzi2017). PGT is accomplished via embryo biopsies followed by different techniques, such as next generation sequencing analyses for PGT-A. In cases with PGT-A when an aneuploid embryo is identified, it can then be avoided during implantation, improving the chances of a successful outcome (Cai et al., Reference Cai, Ding, Lin, Diao, Zhang, Sun and Zhou2019; Gulersen et al., Reference Gulersen, Baum, Bornstein, Krantz, Singer and Divon2019; Hou et al., Reference Hou, Xu, Li, Song, Wang, Zeng, Pan, Zhou and Xu2019; Kimelman and Pavone, Reference Kimelman and Pavone2021; Treff et al., Reference Treff, Eccles, Lello, Bechor, Hsu, Plunkett, Zimmerman, Rana, Samoilenko, Hsu and Tellier2019; Zegers-Hochschild et al., Reference Zegers-Hochschild, Adamson, Dyer, Racowsky, Mouzon, Sokol and Rienzi2017). However, cases may arise where no euploid embryos for a couple is available within the IVF cycle and such occasions might result in needless expenditure and psychological burdens for the couple. Thus, being able to predict the chances of aneuploidies presents a prime potential to reduce failures in ART scenarios.
Despite numerous advances in ART technology, success rates for ART treatments are far from ideal (Kushnir et al., Reference Kushnir, Barad, Albertini, Darmon and Gleicher2017; Qiao et al., Reference Qiao, Wang, Feng, Miao, Wang, Yu, Wei, Yan, Wang, Shen and Sun2014; Sadeghi, Reference Sadeghi2018; Thompson, Reference Thompson2016; Wong et al., Reference Wong, Mastenbroek and Repping2014). Moreover, reasons for failures in ICSI remain to be perplexing due to their complex nature. Similar to causes of infertility itself, causes for ICSI failure are thought to be caused by both maternal and paternal factors. For instance, a lower yield of MII oocytes may be associated with ICSI failure (Miyara et al., Reference Miyara, Aubriot, Glissant, Nathan, Douard, Stanovici, Herve, Dumont-Hassan, Meur, Cohen-Bacrie and Debey2003). Moreover, chromosomal abnormalities in female pronuclei have been associated with ICSI failures as well as abnormalities in meiotic spindle formation (Kilani and Chapman, Reference Kilani and Chapman2014; Miyara et al., Reference Miyara, Aubriot, Glissant, Nathan, Douard, Stanovici, Herve, Dumont-Hassan, Meur, Cohen-Bacrie and Debey2003). A more recent study further links erroneous spindle assembly in oocytes with blastocyst ploidy, suggesting a subsidiary indirect effect of oocyte meiotic spindles on ICSI failure (Tilia et al., Reference Tilia, Chapman, Kilani, Cooke and Venetis2020). Similarly, chromosome abnormalities in sperm have been associated with natural and ART pregnancy losses (Carrell et al., Reference Carrell, Wilcox, Lowy, Peterson, Jones, Erickson, Campbell, Branch and Hatasaka2003; Puscheck and Jeyendran, Reference Puscheck and Jeyendran2007). Additionally, resulting embryos may contribute to the failure of ICSI (Check et al., Reference Check, Graziano, Cohen, Krotec and Check2009; Fortin et al., Reference Fortin, Leader, Mahutte, Hamilton, Léveillé, Villeneuve and Sirard2019; Penzias, Reference Penzias2012; Uyar et al., Reference Uyar, Torrealday and Seli2013). Due to the uncertainties surrounding the complex reasons of ICSI failures, the procedure can still be a gamble at times.
Advances in technology have allowed computational methods to aid in understanding highly intricate pathways and processes. Mathematical modelling studies has been utilised before to understand ART process better (Fischer-Holzhausen and Röblitz, Reference Fischer-Holzhausen and Röblitz2022; Hassan et al., Reference Hassan, Al-Insaif, Hossain and Kamruzzaman2020; Simopoulou et al., Reference Simopoulou, Sfakianoudis, Antoniou, Maziotis, Rapani, Bakas, Anifandis, Kalampokas, Bolaris, Pantou and Pantos2018a; Simopoulou et al., Reference Simopoulou, Sfakianoudis, Maziotis, Antoniou, Rapani, Anifandis, Bakas, Bolaris, Pantou, Pantos and Koutsilieris2018b; Yenkie et al., Reference Yenkie, Diwekar and Bhalerao2013). Furthermore, such studies have provided a scaffold for predictive models to be built upon. Predictive studies started to be employed in various fertility clinics across the world as supportive features to assist the clinicians (Simopoulou et al., Reference Simopoulou, Sfakianoudis, Antoniou, Maziotis, Rapani, Bakas, Anifandis, Kalampokas, Bolaris, Pantou and Pantos2018a; Simopoulou et al., Reference Simopoulou, Sfakianoudis, Maziotis, Antoniou, Rapani, Anifandis, Bakas, Bolaris, Pantou, Pantos and Koutsilieris2018b). Some of these predictive features can be summarised as investigations of morphokinetics via time-lapse microscopy, proteomic considerations and genetic analysis by NGS technologies (Gardner et al., Reference Gardner, Meseguer, Rubio and Treff2015). With the advent of the computer age, image-based predictive artificial intelligence (AI) technologies also exemplify the newer supportive approaches in ICSI (Manna et al., Reference Manna, Nanni, Lumini and Pappalardo2013).
Multiple linear regression is a statistical technique used to model the relationship between one dependent variable and two or more independent variables. The objective of the test is to find the linear combination of the independent variables that best predicts the value of the dependent variable. One advantage of this method over simple linear regression is the incorporation of multiple predictors, therefore allowing for a more comprehensive analysis of how different factors contribute to the outcome. Coefficients for the independent variables are determined using the least squares method, which minimizes the sum of the squared differences between the observed values and the values predicted by the model. This method ensures that the estimated regression line is the best fit for the observed data. Increasing the accuracy of these models and improving upon their prognostic potential may allow avoidance of ICSI failures, sparing couples from unnecessary financial burdens and potentially heavy psychological toll. Moreover, it can allow options for clinicians and infertile couples with regards to their treatment. However, mathematical models still represent a relatively new initiative within the field of reproductive biology and thus require further research before their true potential can be unlocked as prognostic tools. Evaluation of various factors such as number of follicles, MI and MII oocytes and various sperm parameters may allow prediction of the factors that are most predictive of aneuploidy and/or higher morphological quality, hence may enable more effective embryo selection during ART procedures. Therefore, this study aimed to investigate the potential of mathematical models to access predictive features in ART.
Materials and methods
Retrospective data belonging to patients, who undertook intra cytoplasmic sperm injection treatment at British Cyprus IVF Hospital between the years 2016 and 2021 was analysed for this work. All patients were subjected to the same standardized protocols at the clinic for the retrieval and preparation of oocyte and sperm samples as outlined in the following sub-sections below. Data pertaining to a grand sum of 4123 embryos belonging to 765 distinct couples was received in this fashion. Ages for females ranged between 30–60 and for males ranged between 30–73, however for both genders, ages clustered around 30–40 in our dataset. These embryos were screened with PGD-A, via next generation sequencing prior to their vitrification. The study was approved by the IRB of Near East University.
Ovarian stimulation
Controlled ovarian hyperstimulation (COH) was performed with Gonadotropin Releasing Hormone (GnRH) antagonist protocol. On the day of the menstrual cycle, recombinant Follicle Stimulating Hormone (FSH) (150-300 IU, Gonal F, Serono) and/or human Menopausal Gonadotropin (hMG) (75-150 IU, Merional, IBSA) was administered. Ovarian response to stimulants was tracked via transvaginal ultrasound and biochemical screening of serum progesterone (P4) and estradiol (E2) following the sixth day of stimulation. Until the day of ovulation trigger, determined when the leading follicle size exceeds 13 mm, 0.25 mg GnRH antagonist (Cetrotide, Serono) was applied daily. In order to trigger ovulation, 250 mg human Chorionic Gonadotropin (hCG) (Ovitrelle, Serono) or 0.2 mg triptorelin (Gonapeptyle, ferrin) was administered to patients and oocyte retrieval was planned 35 hours after this administration.
Oocyte retrieval and denudation
On the day of oocyte collection (Day 0), the follicle content was aspirated with a needle (Wego, 1816U, PRC) under transvaginal ultrasound guidance. Follicle fluid was sent to the laboratory for the collection of cumulus-oocyte complexes (COC) which were subsequently stored in equilibrated bicarbonate buffered culture media (Continuous Single Culture, CSC, 90164, Irvine Scientific, USA) and cultured at 37℃ with 7% CO2 and 5% O2 until denudation.
The oocytes were denudated using modified Human Tubal Fluid (HTF) (mHTF with HEPES, 90126, Irvine Scientific, USA) with hyaluronidase (Irvine Scientific, CA, USA) exposure in an enzymatic fashion
Semen analysis, intracytoplasmic sperm injection (ICSI), embryo culture and biopsy
Semen samples were prepared as described by Coban et al., (Reference Coban, Serdarogullari, Yarkiner and Serakinci2020). In brief, sperm count was acquired under 200× magnification via Makler® Counting Chamber (Origio, ref: SEF-MAKL, Denmark). Scoring was made adhering to the WHO criteria (World Health Organisation, 2021). Sperm morphology was determined based on Kruger criteria and was assessed by two expert embryologists blindly (Kruger et al., Reference Kruger, Menkveld, Stander, Lombard, Merwe, Van der Zyl and Smith1986). Sperm preparation was initiated with washing of the samples via the two-layer gradient method, where approximately 1.5 mL sperm sample was layered onto 2 mL gradient constituted by 50% and 90% v/v PureSperm and Sperm Washing Solution (PureSperm®100, BioCare, Ref: PS100-250, UK) and was centrifuged for 20 minutes at 300×g. Resultant pellet was then re-suspended with Sperm Washing Solution (Irvine Sci, Cat. Id: 9983, USA) before being centrifuged twice at 300×g for 5 minutes. Final sample was halved where one half was used for the ICSI procedure and the other half was used to conduct the γH2AX assay. ICSI was performed using a single sperm cell that was detected using 10µl PVP (Polyvinylpyrrolidone (PVP) Solution with HSA – 7%, 90121, Irvine Scientific, USA).
Fertilisation check was performed approximately 16–18 hours after the procedure and presence of two pronuclei (2PN) was considered normal fertilisation. Day 3 embryo morphology assessment was carried out using a grading system as described by Ciray et al. (Reference Ciray, Aksoy, Goktas, Ozturk and Bahceci2012). This system incorporates the details of number of blastomeres, blastomere evenness, degree of fragmentation, nucleus details and cytoplasmic characteristics to conclude the assessment. Morphological assessment of the embryos on days 5 and 6 was carried out, adhering to the principles described by Gardner and Schoolcraft (Reference Gardner and Schoolcraft1999) which takes stage of expansion, inner cell mass (ICM) and trophectoderm (TE) cell qualities into consideration to make an evaluation (Gardner and Schoolcraft, Reference Gardner and Schoolcraft1999).
Embryo biopsy and tubing
All embryos were assisted in hatching on day 3 by laser shot (Octax EyeWare, Vitrolife, Sweden) to create a 10–15µm hole in the zona pellucida to increase number of herniating cells. On days 5 and 6, expanded blastocysts were selected for biopsy. Embryos were firmly positioned to avoid disrupting the ICM part and approximately 5–8 trophectoderm cells were biopsied with either flicking or aspiration methods with the assistance of laser shots.
Embryo freezing and thawing
Biopsied embryos were vitrified with vitrification freezing media (Vit Kit-Freeze; 90133-SO, Irvine scientific, USA) after biopsy and thawed before transfer with vitrification thawing media (Vit Kit-Thaw; 90137-SO, Irvine Scientific, USA) using the manufacturer’s instructions. Prior to their transfer, embryos were cultured in CSC for a few hours to affirm recovery status to ensure quality. In cases where the embryos showed signs of degeneration or they failed to start recovery another embryo was thawed for transplantation in their stead.
Parental parameters
For female partners, follicle number, the number of MI and MII oocytes retrieved (referred to as MI oocyte number and MII oocyte number respectively) were examined as maternal parameters.
For male parameters, sperm count, morphology and motility were taken into consideration for the current study. These parameters were evaluated according to the most recent WHO guidelines when determining good and poor quality thresholds for these conditions (World Health Organisation, 2021).
These parameters are commonly recorded at IVF Centres and therefore a model relying on such ‘on hand’ recordings would preclude the need for additional tests for the patients.
Embryo grading system
To grade embryos, two systems were employed in this study. During the grading of day 3 (d3) embryos, a slightly modified version of the system used by Ciray and colleagues was utilised (Ciray et al., Reference Ciray, Aksoy, Goktas, Ozturk and Bahceci2012). This module included 5 parameters in total, number of cells, nuclei status, fragmentation rate, cytoplasmic symmetry and the visual observation of the cytoplasm. In detail, total number of cells represents to the cell count of the embryo on the third day following fertilisation. Nuclei status refers to whether all cells of the embryo carried a single nucleus, recorded as T, or there was presence of multi-nuclear cells within the morula, recorded as Y. Ideally, all cells should be carrying a single nucleus, hence a score of T is desired at this stage. This parameter is referred to as D3 in the current study. Secondly, fragmentation ratio of the embryos was recorded. This scoring was carried out by assigning a number score between 0–70, representing the percentage of fragmentation in the embryo observed by the embryologist. As fragmentation is not desired, a score of 0 indicates the best outcome for this parameter, whereas 70 is associated with the poorest grade. Next, cytoplasmic symmetry was observed under the microscope. If the cytoplasmic distribution was even among the cells of the developing embryo, the quality was denoted as E, and unevenly distributed embryos were recorded as U. In this study, this criterion is referred to as D3 even/uneven and an even distribution is associated with higher quality embryos. Finally, appearance of the cytoplasm was graded as A for clear cytoplasmic appearance which resulted in lighter coloured embryos visually. Contrarily, granulated cytoplasm carrying embryos were graded as K, due to their darker hues during microscopic inspection. Clear cytoplasm is the ideal scenario for day 3 embryos and thus a grade of A encompasses a higher grade embryo. Overall, an ideal day 3 grading could be exemplified as 8TOEA.
For the grading of day 5 (d5) and day 6 (d6) embryos, Gardner criteria were employed (Gardner and Schoolcraft, Reference Gardner and Schoolcraft1999). Accordingly, embryos were investigated for 3 parameters, expansion, trophectoderm quality (TE) and the quality of the ICM. Expansion quality is graded with numbers ranging from 1–6. A grade of 6 indicates the highest quality, where the embryo is hatched out of the zona pellucida layer, whereas a grade of 1 denotes a poor quality embryo. Secondly, cells of the trophectoderm are graded with alphabetical letters A-C. Grade A trophectoderm indicates a high quality trophectoderm layer, consisting of an abundance of cells on the outer layer of the blastocyst. On the other hand, C refers to poorer quality of the trophectoderm. In a similar fashion, inner cell mass is graded as the final quality parameter. Resembling TE grading, a score of A denotes a high quality inner cell mass with many tightly packed cells, ready to drive the formation of embryo proper. Moreover, an ICM grade of C points towards a low quality ICM with very few cells. All in all, according to the Gardner criteria, the best quality embryos are graded as 6AA, whereas the poorest embryos would receive a grade of 1CC.
PGT-A analysis and aneuploidy classification
Genetic analyses of the embryos were carried out by a private genetics lab, by NGS technology to screen for numerical chromosomal abnormalities. Ion ReproSeq PGS kit was used for all PGT-A analyses, screening all 24 chromosomes for aneuploidies as outlined by the manufacturer. For aneuploidy analyses with the mathematical model, PGT-A results were utilised to create two groups euploid and aneuploid. Specific aneuploidies were not considered individually and all were classified into the aneuploid group for the purposes of the current model.
Mathematical modelling
Follicle number, number of oocytes at meiosis I and at meiosis II, abbreviated as MI and MII respectively, in addition to sperm number, sperm motility and morphology scores were classified as independent variables in regression analyses. Dependent variables were Gardner criteria for morphological embryo quality assessment on day 5 post fertilisation (Gardner and Schoolcraft, Reference Gardner and Schoolcraft1999). For the second part of the study, these criteria were replaced by the aneuploidy status of the embryos to assess the predictive power of parental parameters on the euploidy outcome of the resultant embryos. Patient data for 4123 embryos obtained from 765 couples was used to conduct the regression analyses in this study.
To predict each dependent variable, the regression equation was used for each model. The general form of the linear regression equation is:
where y is the dependent variable, b 0 is the intercept, b x is the regression coefficient for the independent variable x and e is the error term (Chatterjee and Hadi, Reference Chatterjee and Hadi2006).
In order to determine the predictive power of female and male factors on the aneuploidy outcome of the embryos, a separate regression analysis was conducted. Regression equations for this case is as follows:
 $${\rm Result} = {b_0} +{b_1} {\rm Follicle \, No}+{b_2}{\rm MI \, No}+{b_3}{\rm MII \, No}$$$+{b_4}{\rm Sperm \, No}+{b_5}{\rm Sperm \, Motility}$$$+{b_6}{\rm Sperm \, Morphology}+e$$
where b 0, b 1, b 2, b 3, b 4, b 5 and b 6 are the regression coefficients for each independent variable, and e is the error term. Based on the results specific equation is as follows:
 $${\rm Regression \, Equation: Result} $$$= -0.12267 + (-0.001018) \times {\rm Follicle \, No} $$$+ (-0.16904) \times {\rm MI \, No} + -0.014676$$$ \times {\rm MII \, No} + 0.1018 \times {\rm Sperm \, No} + 0.0013029$$$ \times {\rm Sperm \, Motility} + (-0.0012664) $$$\times {\rm Sperm \, Morphology}$
Using the values from Table 1, specific regression equations for each dependent variable could be written out: D6 ICM: y = –1.195 + 0.040(Follicle Number) + 0.268(MI Number) + 0.332(MII Number) + 0.0002(Sperm Number) + 0.554(Sperm Motility) – 0.136(Sperm Morphology)
 $$2PN Number: y $$$= 0.386 + 0.014({\rm Follicle \, Number}) $$$+ 0.186({\rm MI \, Number}) $$$$+ 0.175({\rm MII \, Number})$$$ - 0.0002({\rm Sperm \, Number}) $$$+ 0.520({\rm Sperm \, Motility})$$$ - 0.181({\rm Sperm \, Morphology})$
 $$D3: y $$$= -0.303 + 0.011({\rm Follicle \, Number})$$$ + 0.114({\rm MI \, Number}) + 0.096({\rm MII \, Number}) $$$+ 0.0002({\rm Sperm \, Number})$$$ + 0.199({\rm Sperm \, Motility})$$$ - 0.068({\rm Sperm \, Morphology})$
 $$D3 Even/Uneven: y $$$= -2.088 $$$+ 0.062({\rm Follicle \, Number}) $$$+ 0.450({\rm MI \, Number}) $$$+ 0.145({\rm MII \, Number})$$$ - 0.001({\rm Sperm \, Number}) $$$+ 0.437({\rm Sperm \, Motility})$$$ - 0.223({\rm Sperm \, Morphology})$
 $$D3 Cell Number: y$$$ = -23.127 + 0.649({\rm Follicle \, Number}) $$$+ 6.183({\rm MI \, Number}) $$$+ 4.034({\rm MII \, Number})$$$ - 0.013({\rm Sperm \, Number}) $$$+ 4.822({\rm Sperm \, Motility}) $$$- 2.694({\rm Sperm \, Morphology})$$
 $$D5 ICM: y $$$= -0.769 + 0.035({\rm Follicle \, Number}) $$$+ 0.207({\rm MI \, Number}) $$$+ 0.233({\rm MII \, Number}) $$$+ 0.0002({\rm Sperm \, Number})$$$ + 0.350({\rm Sperm \, Motility})$$$ - 0.092({\rm Sperm \, Morphology})$$
 $$D5 Trophoectoderm: y$$$ = -2.901$$$ + 0.092({\rm Follicle \, Number}) $$$+ 0.742({\rm MI \, Number})$$$ + 0.048({\rm MII \, Number})$$$ - 0.001({\rm Sperm \, Number}) $$$+ 0.607({\rm Sperm \, Motility}) $$$- 0.435({\rm Sperm \, Morphology})\;\;\;\;\;\;\;\;\;\;\;\;\;\,\,\,\;$
 $$D5 Expansion: y $$$= -2.306 + 0.066({\rm Follicle \, Number}) $$$+ 0.632({\rm MI \, Number}) $$$+ 0.094({\rm MII \, Number})$$$ + 0.001({\rm Sperm \, Number}) $$$+ 0.772({\rm Sperm \, Motility})$$$ - 0.357({\rm Sperm \, Morphology})$$
 $$D6 TE: y $$$= - 5.390 + 0.140({\rm Follicle \, Number})$$$ + 1.484({\rm MI \, Number})$$$ + 0.344({\rm MII \, Number})$$$ + 0.003({\rm Sperm \, Number}) $$$+ 1.480({\rm Sperm \, Motility})$$$ - 0.986({\rm Sperm \, Morphology})$$
Summary of regression analysis results

To identify the correlations between embryo morphology and aneuploidy status, Logistic Regression model was used which allowed splitting of data to sequentially test the model.
The logistic regression model was used in this study and it is given by the equation:
 $$log \left( {{{P\left( {Y = 1} \right)}}\over{{1 - P\left( {Y = 1} \right)}}} \right) = \;{\beta _0} + \;\mathop \sum \limits_{i = 1}^{11} {\beta _i}{X_i}$$
where: P(Y = 1) is the probability of the positive class. – The coefficients (βi) correspond to the predictor variables (Xi). – The intercept (β0) is −1.50.
Substituting the given coefficients:
 $$log \left( {{{P\left( {Y = 1} \right)}}\over{{1 - P\left( {Y = 1} \right)}}} \right)= -1.50 + 0.02{X_1} - 0.04{X_2}$$$ + 0.08{X_3} + 0.50{X_4} - 0.30{X_5}$$$ + 0.40{X_6} - 0.25{X_7} + 0.60{X_8} $$$- 0.20{X_9} + 0.35{X_{10}} $$$- 0.40{X_{11}}$$
where:
X 1 = D3CellNo
X 2 = D3Fragmentation
X 3 = D6Expansion
X 4 = D3Nucleus
X 5 = D3EvenUneven
X 6 = D3LightDark
X 7 = D5Expansion
X 8 = D5Trophoectoderm
X 9 = D5ICM
X 10 = D6TE
X 11 = D6ICM
The equation describes the relationship between the predictor variables (independent variables) and the log-odds of the outcome variable Y (Result).
All models were developed using the MATLAB 2021a software. Dataset was adjusted to be suitable for the MATLAB models. Performance assessments for the models, model accuracy, precision as well as statistical tests were also conducted using the built in tools and functions of the MATLAB 2021a software. For statistical tests, variables with p < 0.05 were considered to be statistically significant.
Results
In this study, a total of 4123 blastocyst stage embryos from 765 couples were investigated. The morphological analysis and the genetic data were incorporated to develop a mathematical model determining correlations between parental parameters and embryonic features that can be used in the assessment of ICSI cycles.
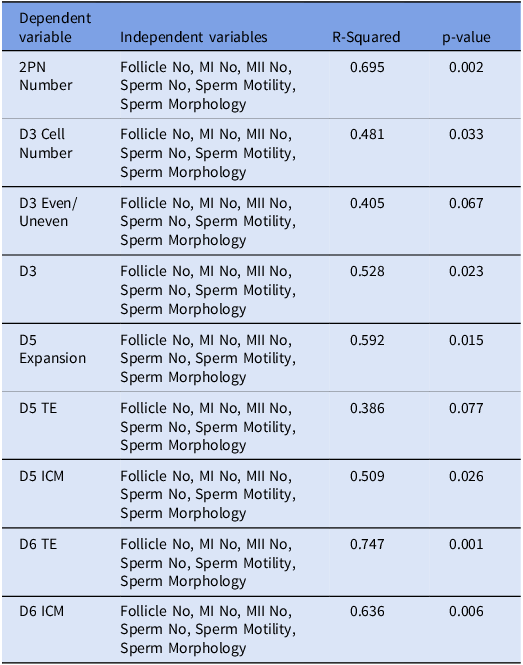
The first avenue of investigation was the predictive potential towards the morphological features of the embryos. Regression analyses were conducted to reveal any potential correlations between follicle numbers, MI numbers, MII numbers, sperm numbers, sperm motility, sperm morphology, i.e., the independent variables and the aforementioned embryonic parameters which constituted the dependent variables. Results showed a significant relationship between the independent variables and all of the dependent variables, except for D3 even/uneven and D5 trophectoderm (Table 1). The R-squared values represent the proportion of the variation in the dependent variable that can be explained by the independent variables included in the model. In other words, it represents the goodness of fit of the regression model for each dependent variable. The R- squared values ranged from 0.386 to 0.747, which indicates that the models explain between 38.6% and 74.7% of the variance in the dependent variables suggesting that the model explains a moderate to high amount of variance in the dependent variables (Figure 1).
Graph representing the R2 values from the regression analysis, showing the strength of the connection between independent values and each unique dependent variable. Exact correlation coefficients for every regression is given at the top of each bar. R2 values between 0.3–0.5 indicate low correlation levels between the assessed variables, while denominations between 0.5–0.7 indicate a moderate correlation. Additionally, values between 0.7–1 correspond to a strong association. Based on this, our model can draw moderate relationships between independent variables and most dependent variables.

In this study, 2PN observed cell numbers, D3 cell number, as well as nuclei singularity at day 3, D5 expansion, D5 ICM, D6 TE and D6 ICM dependent variables had p-values less than 0.05, suggesting that there is a significant relationship between these variables and the independent variables. The results of the regression analysis are represented in Figures 1–3 revealing significant associations between the independent variables (number of follicles, MI oocyte number, MII oocyte number, sperm number, sperm motility and sperm morphology) and various embryonic development variables. The 2PN number, which represents the successful fertilisation of the oocyte by the sperm and suggests no abnormalities were present during this union, was influenced by the independent variables. The R2 value for this test was 0.695 and thus the model can attest to approximately 70% of the variation observed in 2PN outcome, thus confirming a moderate association. Moreover, the model infers a positive correlation between 2PN number and the independent variables as can be observed in Figure 3. Furthermore, the correlation is was statistically meaningful (p = 0.002). An increase in these independent variables was associated with an increase in the 2PN number, indicating successful fertilisation. Individually, sperm motility and morphology, alongside MI oocyte number are the top contributors towards 2PN number. On the other hand, sperm morphology showed an inverse correlation, despite the cumulative effect of parental parameters show a positive association with fertilisation.
Graph representing regression coefficient results for each independent variable. Regression coefficients signify the degree of dependency between the variables. A positive coefficient denotes a positive correlation and a negative value indicates a negative association. Sperm number by itself showed no association with any of the morphological quality markers and sperm morphology individually demonstrated a negative correlation with embryo morphology overall. Remaining independent variables showed positive correlation with embryo morphology individually, similar to their behaviour when analysed collectively.

Graphical representation of regression equations plotted against independent variables. For all dependent variables, the model predicts a positive correlation with the independent variables.

Variable denoted as D3, represented the number of nuclei within embryonic cells. The D3 Cell Number, representing the number of cells in the embryo on day 3 and finally the D3 even/uneven variable, which represented the evenness or unevenness of the number of cells that the embryo possesses on development on day 3. Prediction of day 3 quality markers is also partially possible with the current model. For D3 even/uneven calculated p-value was p = 0.067 and thus the correlation is not statistically significant. Conversely, D3 cell number and D3 had p values 0.033 and 0.023 respectively, corresponding to a significant association between independent variables and them. Furthermore, R2 denominations for these two factors were 0.481 and 0.528 respectively, meaning that the current model can explain the observed variations in low-moderate resolution. Independent variables showed a positive relationship with these particular dependent variables (Figure 3) and especially sperm motility showed to be the biggest contributor to blastomeres with single nuclei, followed by the number of MI and MII stage oocytes retrieved (Figure 2). The regression model further indicated that MI oocyte number had the most significant positive impact on D3 cell number, followed by sperm motility and MII oocyte number (Figure 2).
Results of the current study also showed a predictive potential for embryo morphology on day 5 to an extent. Dependent variables for day 5 were the expansion of the blastocyst, the quality of the trophectoderm on day 5 (D5 TE) and the quality of the inner cell mass (D5 ICM). The regression analysis demonstrated a statistically significant association between the independent variables and D5 ICM quality (p = 0.026). Specifically, the number of MI oocytes had the strongest positive effect, followed by sperm motility and MII oocyte number (Figure 2). The D5 ICM model had an R-squared value of 0.509, indicating that approximately 50.9% of the variation in D5 ICM can be explained by the independent variables. Furthermore, D5 expansion was positively influenced by an increase in the independent variables i.e., an increase in the quality and number of oocytes and sperm cells was precursory to better D5 expansion (Figure 3). Results of the regression analysis indicated that sperm motility had the most substantial positive effect on D5 expansion, followed by MI oocyte number and MII oocyte number (Figure 2). Sperm motility showed a strong positive coefficient for D5 expansion indicating that higher sperm motility is associated with better outcomes for this variable. The R2 value for D5 expansion was 0,592 indicating that the model can moderately predict variations observed in D5 expansion. Contrarily, D5 TE did not show any significant relationship with the independent variables included in the regression model (p = 0.077).
Last but not least, day 6 quality assessment included similar dependent variables as day 5, as described previously. Specifically, the D6 ICM showed a positive relationship with these independent variables, indicating that an increase in their values led to an increase in D6 ICM quality (Figure 3). This correlation was also statistically meaningful (p = 0.006). Among the independent variables, MI oocyte number exhibited the strongest positive effect on D6 ICM, followed by sperm motility and MII oocyte number (Figure 2). The R2 value for D6 ICM was 0.636 corresponding to a moderate association with the independent variables. Similarly, the D6 TE exhibited a significant positive relationship with the independent variables (p = 0.001). The regression model highlighted that the MI oocyte number had the most significant positive impact on D6 TE, followed by sperm motility and MII oocyte number (Figure 2). Likewise, superior sperm motility seems to correlate with better trophectoderm development on day 6. The D6 TE model had an R-squared value of 0.747, insinuating that approximately 74.7% of the variation in D6 TE can be explained by the independent variables included in the model. Validation of the model was done by plotting actual values against predicted values. It can be seen from the resulting graphs that the model has average to high accuracy (Figure 4).
Validation plot for comparison of actual versus predicted values for the mathematical model. Plots reveal that the current model is particularly accurate at predicting results for D6 ICM, D5 ICM, D3 and 2PN variables.

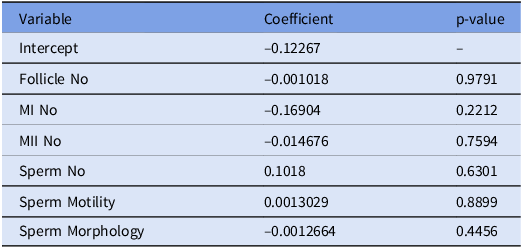
Morphological quality assessment of embryos can provide a good criterion during choosing an embryo for transfer. However, morphological quality represents just one side of the coin. Genetic tests are employed in order to avoid transfer of aneuploid embryos during implantation. Thus, a good prediction algorithm should include the prediction of aneuploidy outcome for the resulting embryos. This analysis as shown in Figures 5 and 6 and Table 2 revealed that follicle number, MI oocyte number and MII oocyte numbers show no statistically significant correlation with the aneuploidy status of the resultant embryos (p > 0.05).
Graphical representation of regression coefficients. Variables showed differing degrees of association with aneuploidy status of the resulting embryos, albeit none proved to be statistically significant.

Graph representing regression analysis and its fit with the actual data, indicating that the error in the regression model is minimal.

Regression coefficients denoting the strength of the connection between each of the independent variables and the aneuploidy status of the embryos

Note: p values provide a measurement of statistical significance for each independent variable.
On the male side, number of sperm exhibited a positive coefficient of approximately 0.1018. This indicates that elevated sperm numbers may be associated with an increased likelihood of euploid embryos. Moreover, the variable sperm motility demonstrated a positive coefficient as well (Table 2). This finding highlights a potential of higher sperm motility in increasing the chances of euploid embryos as the outcome during the fertility treatment. However, the p-values for these two variables remain greater than 0.05 and thus these outcomes seem to be statistically insignificant. Lastly, sperm morphology showed a correlation that was not statistically significant as well (p > 0.05). Overall, the independent variables of the current study don’t seem to possess any premonition capacity towards the aneuploidy status of the resulting embryos.
Figures 6 and 7 illustrate that the error in the regression model is minimal, as evidenced by the high coefficient of determination.
Graph showing the residual plot, showing the error in the regression model is minimum. This figure illustrates the residuals of the regression model, showing the difference between observed and predicted values. The residuals help assess the model’s goodness of fit and identify potential patterns or deviations. Ideally, residuals should be randomly distributed around zero, indicating that the model captures the data well without systematic bias.

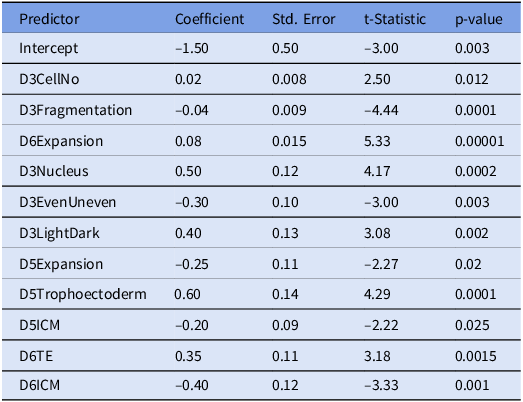
Finally, we aimed to determine whether embryo morphology could predict aneuploidies. For this purpose, logistic regression model was developed. Results of the model can be observed in Table 3 and Figure 8. The coefficients indicate the impact of each predictor on the log-odds of the outcome. A positive coefficient suggests an increase in the likelihood of the positive outcome, while a negative coefficient suggests a decrease. Variables with p < 0.05 were considered to be statistically significant and this was the case for all predictors in this model. Among morphological qualities D3 cell no, D3 Nucleus, D3 Light/Dark, D5 TE, D6 TE and D6 Expansion showed positive association with euploidy. In other words, higher quality in these parameters are encouraging euploid outcomes. In contrast, D3 fragmentation, D3 even/uneven, D5 expansion, D5 ICM and D6 ICM show inverse correlations with euploidy.
Logistic regression coefficients and statistical significance

Note: Coefficients are an indicator of the relationship between embryological morphology and its euploidy status. Positive values indicate a direct correlation whereas negative coefficients suggest an inverse association. P-values are the determinants of the statistical significance. As all p-values are < 0.05 all model outcomes were statistically significant.
Regularized Logistic Regression Model. This figure presents the effect of regularization on model coefficients, demonstrating how the penalty term prevents overfitting and improves generalization by shrinking some coefficients.

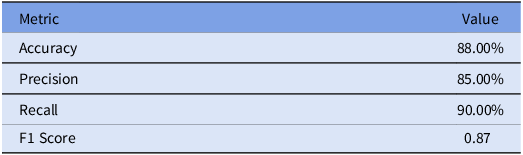
An ROC curve was constructed to evaluate the goodness of fit for the logistic regression model to the actual data (Figure 9). Further performance metrics for the model are summarised in Table 4.
ROC curve for the Logistic Regression Model. The ROC curve illustrates the trade-off between sensitivity and specificity, providing an overall measure of model performance. A higher area under the curve (AUC) indicates a better classification ability.

Performance metrics of the logistic regression model

Note: Accuracy represents the overall correctness of predictions, Precision indicates the proportion of positive identifications that were actually correct, Recall measures the ability to identify all relevant instances, and the F1 Score provides a balanced evaluation of Precision and Recall.
Discussion
IVF Centres around the globe have enabled many infertile couples to achieve their parenthood aspirations. Nevertheless, the success rate of the procedure remains relatively low, despite years of research and improvements (Kushnir et al., Reference Kushnir, Barad, Albertini, Darmon and Gleicher2017; Qiao et al., Reference Qiao, Wang, Feng, Miao, Wang, Yu, Wei, Yan, Wang, Shen and Sun2014; Sadeghi, Reference Sadeghi2018; Thompson, Reference Thompson2016; Wong et al., Reference Wong, Mastenbroek and Repping2014). Furthermore, ICSI remains to be a relatively costly endeavour. Particularly, use of next generation sequencing techniques for aneuploidy identification has recently improved success rates at the cost of increased economic burden (Alison Coates et al., Reference Coates, Kung, Mounts, Hesla, Bankowski, Barbieri, Ata, Cohen and Munné2017; Doroftei et al., Reference Doroftei, Ilie, Anton, Armeanu and Ilea2022; Fishel et al., Reference Fishel, Gordon, Lynch, Dowell, Ndukwe, Kelada, Thornton, Jenner, Cater, Brown and Garcia-Bernardo2010). At infertility clinics, predictive software may allow couples to opt out of treatment plans with low chances of success, possibly sparing them from disappointment and cost. While use of informative algorithms and computer programmes are nothing novel, improving them and exploring their prognostic potential still requires extensive research (Simopoulou et al., Reference Simopoulou, Sfakianoudis, Antoniou, Maziotis, Rapani, Bakas, Anifandis, Kalampokas, Bolaris, Pantou and Pantos2018a; Simopoulou et al., Reference Simopoulou, Sfakianoudis, Maziotis, Antoniou, Rapani, Anifandis, Bakas, Bolaris, Pantou, Pantos and Koutsilieris2018b). This study, therefore, aimed to contribute to the growing body of literature in this field. For this purpose, it was poised to investigate whether parental parameters could be used to predict the quality of the resulting embryos through ICSI. While good quality embryos do not always guarantee implantation nor successful birth, they improve the chances of those events significantly. Therefore, embryo quality is expected to be an important consideration in any prognostic software that could be developed in the future. Qualitative assessment of embryos in this study was divided into two categories. First was the prediction of morphological features of the embryos on day 3 and day 5 post fertilisation as described by Gardner and Schoolcraft (Gardner and Schoolcraft, Reference Gardner and Schoolcraft1999). Secondly, aneuploidy screening was investigated in relation to the oocyte, sperm and embryo quality. Aneuploidy status is a very important parameter in IVF centres as aneuploid embryos may lead to implantation failure, miscarriages or childbirth with congenital defects. Additionally, a prognostic tool that can accurately predict aneuploidy status of the resulting embryos in such a non-invasive manner will have obvious advantages. Our data suggests that mathematically, there is an association between follicle, MI and MII oocyte numbers, sperm number and sperm motility and morphology and the morphological quality of the resulting embryos. On the other hand, the same parameters failed to give an indication towards the aneuploidy status of the embryos, insinuating that the prediction of genetic outcomes may require additional parameters to be incorporated to be accurate.
As stated above, first part of this study was aimed at investigating the prognostic potential of maternal factors such as follicle number, MI and MII oocyte counts, in combination with paternal sperm parameters like sperm count, morphology and motility for predicting morphological quality of the resulting embryos. Among the dependent variables, embryos with two pronuclei were considered as an important parameter. Furthermore, day 3 nucleus numbers (single/multiple), day 3 cell numbers (Even/Uneven) and cell numbers for day 3 were investigated. Finally, ICM and trophectoderm quality for days 5 and 6 as well as expansion for day 5 were considered. Results of the study indicates significant correlations between all the stated dependent variables and independent variables with the exception of day 3 even/unevenness and day 5 trophectoderm. Various established AI technologies are investigated for their potential to determine embryo quality with imaging techniques to predict pregnancy outcomes (Kromp et al., Reference Kromp, Balaban, Cottin, Saiz, Fancsovits, Fawzy, Findikli, Kovacic, Ljiljak, Rodero and Parmegiani2022). The top performing AI in the aforementioned study showed an accuracy of 72% in predicting ICM quality, 73% and 77% for the prediction of trophectoderm and expansion status respectively. Intriguingly, among the three distinct AI learning models investigated trophectoderm accuracy consistently remained the lowest (Kromp et al., Reference Kromp, Balaban, Cottin, Saiz, Fancsovits, Fawzy, Findikli, Kovacic, Ljiljak, Rodero and Parmegiani2022). Furthermore, one of the biggest drawbacks of any AI based prediction and grading system is their reliance on embryo imaging systems which are not found in every fertility clinic. In contrast, to our knowledge, this is the first study to lay the foundations for predicting embryo morphology prior to their inception and thus requires no imaging. Particularly, trophectoderm correlation for day 6 embryos yielded an R-squared value of 0.747, indicating an approximately 75% accurate prediction in relation to the ground-truth data points. Therefore, we conclude that mathematical modelling can present an acceptable substitute to AI systems as a prediction tool for TE quality without necessitating embryo imaging. Moreover, it can be superior in acquiring the data before the conclusion of the 6 day period for the blastocysts to form. Contrarily, R-square values for ICM quality remain lower compared to AI prediction accuracies. This can be prominent in further ICSI success predictions as the ICM will be forming the embryo proper. However, the mathematical model could be improved upon with the addition of further parameters to improve the accuracy. One promising candidate is maternal age, as it has long been associated with pregnancy outcomes and blastocyst quality in ICSI (Janny and Menezo, Reference Janny and Menezo1996).
For the second part of the study, aneuploidy screening results were aimed to be predicted by the same factors. To investigate whether parental parameters could be viable predictors of aneuploidy, regression analyses were conducted again. Contrary to morphological qualities, neither oocyte properties nor sperm qualifications seem to show any correlation with the presence of aneuploidy. These findings suggest that ploidy status of the embryos represent a more complex phenomenon to be prognosed solely from parental factors. For the current study the aim was to assess the ability of mathematical equations in separating aneuploid embryos from their euploid counterparts, with no discrimination towards either single or complex aneuploidies. A similar investigation was conducted previously, utilising AI learning and showed an accuracy roughly 70% (Chavez-Badiola et al., Reference Chavez-Badiola, Flores-Saiffe-Farías, Mendizabal-Ruiz, Drakeley and Cohen2020). However, one of the biggest drawbacks of the study was once again the prerequisite for time-lapse embryo imaging systems which are not widely available. Thus, in the current study, the aim was to use readily available patient data at the clinic and base a prediction of outcoming embryo status based on those. While showing that oocyte and sperm parameters can be adequate for predicting blastocyst score, data indicates that they are insufficient for giving an indication towards the aneuploidy status of the embryos. Intriguingly, a more recent study has identified a method for predicting aneuploidy based on blastocyst morphological quality assessment in reciprocity with maternal age and time-lapse imaging with an accuracy of approximately 70% (Barnes et al., Reference Barnes, Brendel, Gao, Rajendran, Kim, Li, Malmsten, Sierra, Zisimopoulos, Sigaras and Khosravi2023). Combined with the results of this study, current work can be utilised to possibly calculate the chances of obtaining euploid embryos in an indirect manner. This is emboldened further by the fact that blastocyst score was determined to be one of the two most influential factors for aneuploidy prediction by Barnes et al. (Barnes et al., Reference Barnes, Brendel, Gao, Rajendran, Kim, Li, Malmsten, Sierra, Zisimopoulos, Sigaras and Khosravi2023). However, the accuracy of aneuploidy prediction would undoubtedly be hindered if predicted morphological data would be used to make further inferences on the aneuploidy outcome. Moreover, mathematical model investigated in the current study can be expanded upon with further criteria such as maternal and paternal age and biopsy day for the embryos. Particularly in the case of maternal age, various studies as well as unpublished data from our group have found it to be a prominent contributor to both blastocyst scores and aneuploidy (Barnes et al., Reference Barnes, Brendel, Gao, Rajendran, Kim, Li, Malmsten, Sierra, Zisimopoulos, Sigaras and Khosravi2023, Zhan et al., Reference Zhan, Sierra, Malmsten, Ye, Rosenwaks and Zaninovic2020). In order to test this, we have employed a logistic regression model to investigate the correlations between embryo morphology parameters and its euploidy status. Embryo morphology, unsurprisingly proved to be a strong predictor of its euploidy status as evidenced by the p-values observed in Table 3 (all p-values < 0.05). On the other hand, not all parameters related to the aneuploidy status as expected. Parameters D3 cell no, D6 expansion, D3 nucleus, D3 Light/dark, D5 TE and D6 TE showed a positive correlation with euploid outcomes as iterated by positive coefficients output by the model (Table 3). These associations were not surprising. In particular, higher quality trophectoderm associating with euploid outcomes is easily understandable as the trophectoderm constitutes the site of the biopsies for PGT-A analyses. Nevertheless, independent variables D3 fragmentation, D3 even/uneven, D5 expansion, D5 ICM and D6 ICM appear to be negatively correlated with euploid outcomes. This is surprising as a morphologically better embryo would be expected to have higher chances at becoming euploid. In the case of D3 fragmentation, current model suggests that more fragmentation may indicate greater chances for aneuploidy. Fragmented cells are closely associated with higher incidences of aneuploidy in previous research (Cecchele et al., Reference Cecchele, Cermisoni, Giacomini, Pinna and Vigano2022, Lagalla et al., Reference Lagalla, Coticchio, Sciajno, Tarozzi, Zacà and Borini2020). Therefore, consistent with these studies, our model also concludes that higher fragmentation percentages can be indicative of aneuploidies. On the other hand, Pasternak and colleagues (Pasternak et al., Reference Pasternak, Thompson, Rosenwaks and Spandorfer2018) have concluded that fragmentation ratio on day 3 is not a significant predictor of aneuploidy previously. Therefore, this prospect appears to be under debate yet still. The second parameter that was found to be inversely correlated with euploidy was the evenness of the embryo at the morula stage. Morphologically, even embryos are considered to be higher in quality. Therefore, even embryos having increased chances of becoming aneuploid is intriguing. Evenness of the embryo is closely linked to the number of cells. Indeed, previous studies have proven that 8-cell embryos showed the best overall evenness while less or more cells than that had worsened evenness (Wang et al., Reference Wang, Diao, Fang, Zhu, Xu, Lin, Zhang and Chen2022). In addition, morulas with a cell number between 6–9 have better chances for euploidy as opposed to > 9-cells (Kroener et al., Reference Kroener, Ambartsumyan, Pisarska, Briton-Jones, Surrey and Hill2015). In contrast, Embryos with > 11-blastomeres appear to behave more similarly to 8-blastomere embryos as they show less aneuploidies when compared with their 9–11 cell counterparts (Pons et al., Reference Pons, Carrasco, Parriego, Boada, González-Foruria, Garcia, Coroleu, Barri and Veiga2019). Taken together, these data suggest that the contribution of evenness alongside cell number may be more complex than it initially appears. Furthermore, cell count at the morula stage was a positive driver of euploidy in the current model as well as directly related to embryo evenness. Their precise influence on the euploidy status of the embryo may be based on a balance of their antagonistic effects. Next, expansion status yielding opposing coefficients for day5 and day6 data is interesting. Previous studies have demonstrated that the expansion rates are higher in euploid embryos (Huang et al., Reference Huang, Huang, Ahn, Arnett and Huang2019). Consequently, a positive correlation between D6 expansion status and euploidy is unsurprising. On the other hand, D5 expansion shows an inverse correlation with the same outcome. One explanation could be that higher expansion could be associated with elevated levels of cell division. If the embryo expansion is too high too early in its development the lack of cell cycle checkpoint activity at this stage could lead to higher incidences of aneuploidies. Although, more studies are warranted to precisely determine the difference between day5 and day6 expansion in this context. In addition, in the current literature, embryos are known to blastulate slower particularly in patients that are 35 years of age or older. However, when waited until day 7, 43.1% of usable embryos can still found to be euploid (Tiegs et al., Reference Tiegs, Sun, Patounakis and Scott2019). Indicating that slower development or worse expansion at day5 may still lead to euploid embryos when waited longer. This phenomenon may be an explanation for the inverse correlation we have observed with day 5 expansion. Furthermore, it may provide an explanation for the positive association observed between D6 expansion and euploidies. Finally and most intriguingly, higher quality of ICM both on day 5 and day 6 was negatively associated with euploidy. As ICM is the developmental origin of the embryo proper, better quality ICM would be expected to correlate with euploid outcomes and an overall higher chances of a good quality embryo. Current results from the model appear to concur with theories of embryo self-correction mechanisms similar to blastomere extrusions and shunning of aneuploid blastomeres to trophectoderm (Lagalla et al., Reference Lagalla, Coticchio, Sciajno, Tarozzi, Zacà and Borini2020). Shunning of aneuploid embryos to the trophectoderm simultaneously would cause an improvement in the ICM and an increase in observed aneuploidy in the trophectoderm. As trophectoderm is the site of biopsies it could explain the observed increase in aneuploidies by the PGT-A. However, evidence exists in the literature that the relationship between embryo quality and euploidy may not be as linear as it may initially appear. This seems particularly true in cases where patient age is higher than 30. For instance, Coates and colleagues (Coates et al., Reference Coates, Coate, Holmes and Griffin2015) have identified that ICM quality was not significantly associated with euploidy in patient groups < 35 years of age as well as in the 35–39 age group. Furthermore, even overall embryo quality showed non-significant associations with euploidy in < 35-year-old group (A Coates et al., Reference Coates, Coate, Holmes and Griffin2015). Another study has concluded that ICM grade B didn’t correlate with a positive foetal heartbeat. In this study mean patient group ages were 33.4 and 34.4 once again underlying that associations with embryo morphology in this age group may be more complex (Abdala et al., Reference Abdala, Elkhatib, Bayram, Arnanz, El-Damen, Melado, Lawrenz, Fatemi and De Munck2022). More importantly, there are other studies that show negative associations between embryo morphology and euploidy status. For example, excellent grade embryos were found to have significantly higher aneuploidy rates in a study conducted by Salame et al. The authors attribute this observations to the fact that higher grade embryos are biopsied more often as opposed to their poorer quality counterparts (Salame et al., Reference Salame, Dahdouh, Aljafari, Samuel, Koodathingal, Bajpai, Kainoth and Fakih2024). A similar argument can be made for our results as well where most embryos biopsied were of good quality sent to PGT-A testing with the goal of their eventual implantation. In addition, another study concluded that good quality embryos showed an euploidy rate of 39.1% as opposed to average quality embryos’ 42.8%. While excellent grade embryos had an euploidy rate of 56.4% in the same study, it is clear that a negative association can be observed between embryo grade and euploidy or at the very least that it can be inferred that the relationship between the two is complicated (Capalbo et al., Reference Capalbo, Rienzi, Cimadomo, Maggiulli, Elliott, Wright, Nagy and Ubaldi2014). Overall, a maternal age of 30–40 appears to complicate the relationship between embryo morphology and euploidy. This is prominent as in the current study most patients were of the same age gap as stated before. Furthermore, other confounding factors can influence these correlations as well. Among these day of biopsy and cause of infertility in the couple can be named (Salame et al., Reference Salame, Dahdouh, Aljafari, Samuel, Koodathingal, Bajpai, Kainoth and Fakih2024, Thang et al., Reference Thang, Thuy, Dung, Anh, Quy, Ngoc, Linh, Le Thuy, Anh, Thuy, Huong, Hoang and Hugues2024). On the other hand, results where embryo morphology and euploidy status are either non-significantly associated or negatively associated are evident in the current literature (Abdala et al., Reference Abdala, Elkhatib, Bayram, Arnanz, El-Damen, Melado, Lawrenz, Fatemi and De Munck2022, Capalbo et al., Reference Capalbo, Rienzi, Cimadomo, Maggiulli, Elliott, Wright, Nagy and Ubaldi2014, A Coates et al., Reference Coates, Coate, Holmes and Griffin2015, Salame et al., Reference Salame, Dahdouh, Aljafari, Samuel, Koodathingal, Bajpai, Kainoth and Fakih2024). It is important to note that across different clinics and studies there may be differences in embryo grading systems and other pertinent laboratory practices and thus comparisons between such studies as well as the generalisation of any results must be done cautiously as suggested by Thang et al. (Reference Thang, Thuy, Dung, Anh, Quy, Ngoc, Linh, Le Thuy, Anh, Thuy, Huong, Hoang and Hugues2024). Nevertheless, taken together with the performance metrics, as given in Table 4 and Figure 9, the current literature overall supports the current model. Certainly, the overall viability of the embryo is likely to be dependent on both its morphology and its euploidy status and thus these inverse correlations underline the complexity of gauging a viability parameter for embryos in an ART setting once more. While the model created in this study failed to predict aneuploidy results directly, it was successful in predicting morphological outcomes. Additionally, it was able to predict euploidy status based on morphological parameters. Combining the two predictions to assess euploidy outcomes can be a viable strategy. However, successive predictions can compromise the final accuracy of the model. All in all, the current model creates a basis for predicting the euploidy status of the resultant embryo, but coupling these approaches with stronger modelling platforms such as machine learning algorithms may prove more viable in the future.
To summarize, current study establishes an acceptable substitute for image-based AI systems to predict ICSI outcomes. The biggest advantage of utilizing a mathematical model over such systems is the lack of need for additional equipment or measurement. In this sense, it can provide a cheaper and easier to access alternative. This aspect of mathematical modelling constitutes the biggest strength of this study. Furthermore, the model reveals further insights into the factors that may play a role in embryo quality. Finally, the model shows strong predictive power for the quality of embryos on day 5 and day 6. This is particularly important as embryos are usually transplanted to the mother candidate on day 5 or day 6 post fertilisation. Conversely, the study is not without limitations. The model predicts an inverse correlation between sperm morphology and embryo quality which contradicts the current literature. Stronger modelling approaches may be utilized in the future to derive a better fitting model. In addition, the model is based on a cohort subjected to a uniform treatment program. This may be a possible explanation for the lack of connection observed between sperm number and embryo morphology. ICSI involves choosing of a single sperm to be injected directly into the oocyte which may be nullifying the effects of overall sperm number on the embryo morphology in the current model. Therefore, the model may not perform equally in alternate ART methods. Lastly, the current model is insufficient to predict aneuploidy status for the resulting embryos.
There are only a few aneuploidies that are concurrent with life and even then, they are associated with serious conditions in postnatal life. Thus, in ART settings implantation of euploid embryos have been a common practice during recent times. On the other hand, the application of PGT-A have been struggling to fully achieve the expected positive outcomes. Some of this lack of success have been attributed to the inherent damaging effects of the biopsies to the embryo to conduct the chromosomal analysis (Wells, Reference Wells2010). Consequently, in practical settings the opinions are also divided on the usefulness of PGT-A in choosing embryos for implantations with some clinicians opting out of this practice. Therefore, identifying other means of predicting aneuploidies may prove invaluable to the clinicians of ART as it could eliminate the need for biopsies when perfected as well as allowing aneuploidy to be considered in clinics more commonly thus allowing more streamlined guidelines to be followed in clinics worldwide. The aim of the current study was therefore, to test whether parental parameters could be indicative of aneuploidy status of the resulting embryos. The data set in the current study was extensive therefore allowing the generation of a robust algorithm to draw such correlations. Dataset was comprised from 4123 embryos belonging to 765 distinct couples allowing extensive yet diverse data to be used in the generation of the model. All in all our model not only successfully creates a basis for an accurate aneuploidy algorithm to be created but also further underlines some of the theories in the field of embryology that are hard to prove with biological experiments.
In conclusion, this study lays the foundation for a prognostic software that can be developed to be used in IVF centres, where the quality of embryos can be foreseen prior to the fertilisation and embryogenic growth stages. Therefore, giving an insight towards to success rate that can be expected from the treatment plan. In particular, morphological quality of day6 embryos show a strong correlation with parental parameters which can have significant implications for ICSI success rates.
Data availability statement
Anonymised data may be shared on demand.
Author contributions
H. Aytacoglu: Data collection, management and manuscript writing. D. Amilo: Development of the mathematical model and manuscript writing. B. Kaymakamzade: Project development. E. Hincal: Project development. O. Coban: Data collection and embryological analyses. P. Tulay: Project development.
Competing interests
The authors have no competing interests to declare that are relevant to the content of this article.
Funding
Authors declare that no funding was received for conducting this study.
Ethics standards
This research study was conducted retrospectively from data obtained for clinical purposes. Approval was granted by Near East University Board of Ethics (File No: NEU/2023/116-1766)
Consent to Participate: Verbal informed consent was obtained prior to the interview with the participants.
Consent for Publication: Additional consent was obtained from the participants to publish their anonymised data.
Code availability Not applicable.