

Most laypersons would imagine that moods such as increased fear, heightened anxiety, anger, or confusion are aroused through a personal injury (e.g., a workplace injury or motor vehicle accident). They might see the injury initially as the cause of moods but then might also allow some leeway for pre-existing influences or take into account other aspects of a person’s current situation. In this report, mood is defined consistent with the Cambridge Dictionary of Psychology, namely: “An affective state that persists from several minutes to several weeks which directs and colors perceptions, thought and behaviour” (Matsumoto, Reference Matsumoto2009, p. 314).
In other words, they might assume a common-sense type of biopsychosocial approach and visualize mood outcomes consistent with the scenario depicted in Vignette A. This illustrates one extreme of a mood profile following a compensable injury.
Vignette A
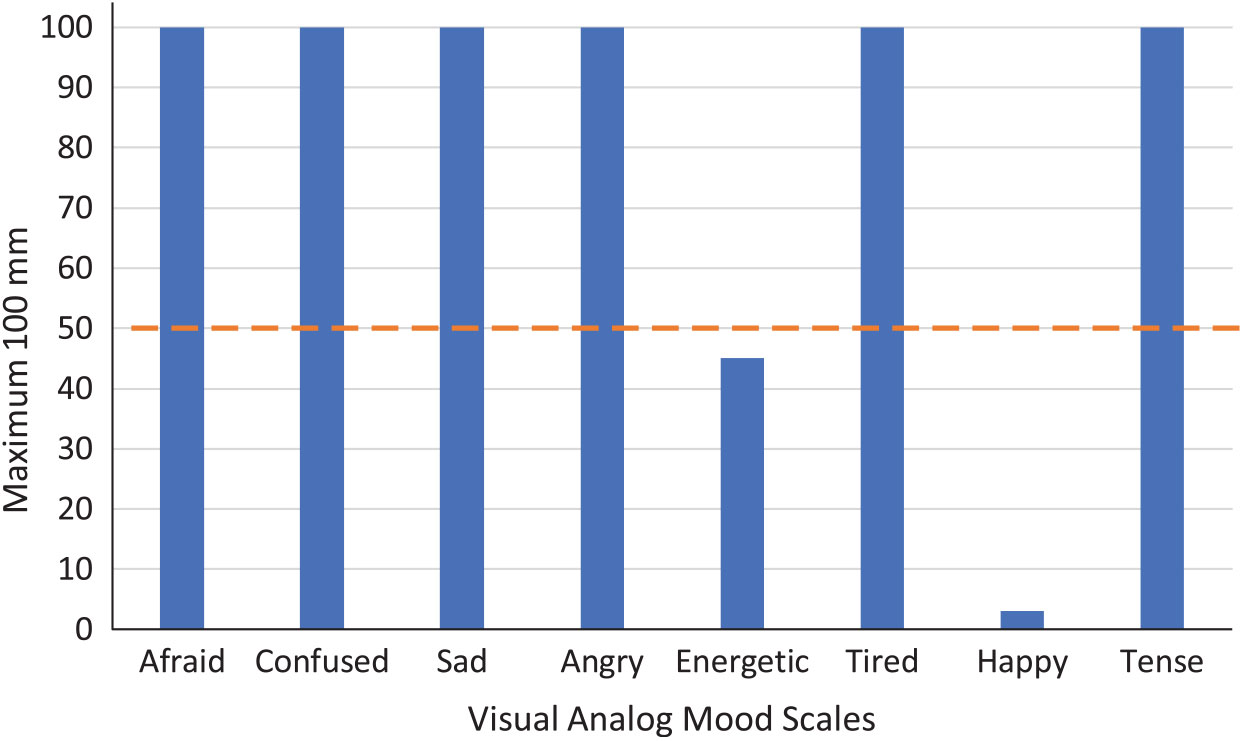
A is a 32-year-old teacher whose high-grade malignant lymphoma was misdiagnosed as a minor complaint four years ago. She underwent a left anterior thoracotomy, went on to complete chemotherapy, radiotherapy, and then stem cell therapy after a further recurrence. She has been in remission for some two years. Her disabilities include, among others, permanent osteoporosis, pre-menopause symptoms, and chronic severe depression. She has not returned to work. A profile of her mood state (Fig. 1) using the Visual Analog Mood Scales (Stern, Reference Stern1997) that are described later in this report indicated a complex picture of someone who was marked by being clinically sad, as well as afraid, confused, and angry in conjunction with being below-average in happiness. This profile does not appear conducive for personal recovery.
On the other hand, our layperson might well be surprised if they encountered someone, such as the person in the scenario listed in Vignette B. In this scenario, there were also catastrophic, life-threatening injuries, but there was no report of fear, sadness, or tension and he was not diagnosed formally with psychological problems.
Case study A – Low positive moods and extreme negative moods.

Vignette B
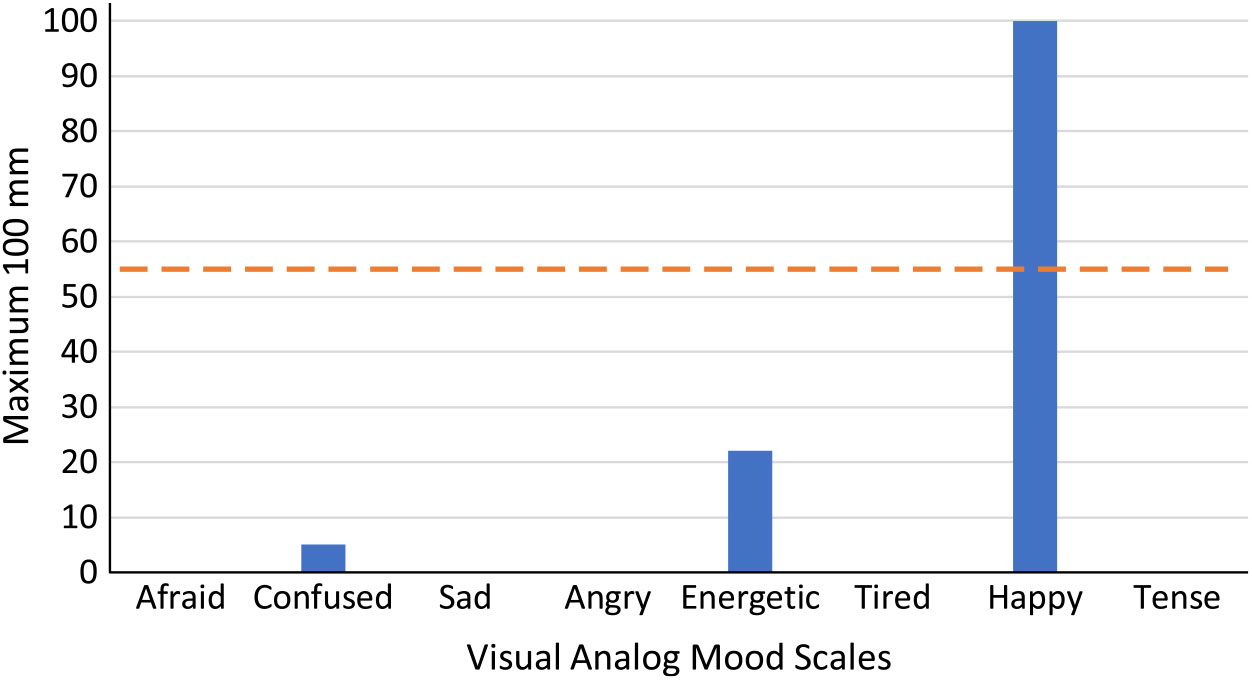
B is a 59-year-old male who was injured in a work-related accident when he was aged around 57 years. He had multiple upper and lower extremity fractures as well as internal injuries, requiring over four months of hospitalization. Further operations will be required, but he is independent in his activities of daily living. His major disabilities relate to mobility, balance, pain, problems with complex tasks. He has been unable to return to his trade as a plumber. It has been two years since his injury and he is still recovering. A snapshot of his mood state (see Fig. 2), using the Visual Analog Mood Scales, indicated a picture of someone who was unusually well-adjusted. There were quite low levels of energy, but this is understandable. There has been some residual anxiety, but the profile appears conducive for personal recovery.
Between these two extremes, there are a myriad of other profiles that one encounters in a rehabilitation practice. They attest to the varied but persistent role of mood in one’s rehabilitation from a personal injury. Initially, clinical concern about the aftermath of injury provided the impetus for this study, but there was also a theoretical interest to investigate the moods that accompany injury.
Case study B – High positive moods and low negative moods.

For the most part, the literature has recognized that depression and anxiety are major sequelae of injury. Recent years have also emphasized post-traumatic stress disorder (Athanasou, Reference Athanasou2016), but positive or negative mood has not been explored thoroughly. A search of relevant literature was made using the Medline database. This revealed 98 021 citations related to “mood,” 688 698 related to “injury,” and 53 932 related to “compensation,” but only 17 for the three combined terms.
As far back as Reference Meyer1904, Meyer recognized what he called a “traumatic insanity,” that is, a form of poorer social adaptation (Lamb, Reference Lamb2015), which has later been characterized as “the basis of the biopsychosocial approach” (Neylan, Reference Neylan2000, p. 406). For instance, in 1937 there were descriptions of psychosis following injury (Symonds, Reference Symonds1937). In 1993, a follow-up study of 188 victims of motor vehicle accidents in the UK gave an account of mood disturbance (albeit emphasizing depression, anxiety) over a 1-year period (Mayou, Bryant & Duthie, Reference Mayou, Bryant and Duthie1993). With reference to traumatic brain injury, mood changes have included “indifference, emotional lability, poor social judgement and disinhibition” (Milders, Fuchs & Crawford, Reference Milders, Fuchs and Crawford2003, p. 157). Similar findings have been described for spinal cord injury in an Australian context, where Craig, Wijesuriya, and Tan (Reference Craig, Wijesuriya and Tran2013) noted elevated depression and anxiety in 41 people with spinal cord injury compared to an able-bodied control group. Blaszczynski et al. (Reference Blaszczynski, Gordon, Silove, Sloane, Hillman and Panasetis1998) indicated “depression, anxiety, irritability, driving phobia, anger, sleep disturbances, and headache” (p. 11) as a consequence of motor vehicle accidents.
Moving beyond traumatic brain injury and spinal cord injury, Wiseman, Foster, and Curtis (Reference Wiseman, Foster and Curtis2013) reviewed 41 papers on the relationship between mental health and physical injury. It was reported that (a) acute stress disorder “is shown to affect up to 33% of those in the general population who are exposed to a traumatic event” (p. 1384); (b) “the incidence of PTSD to be in the range of 30 and 93% of survivors of traumatic physical injury” (p. 1385); and (c) “depression was found to occur in 28–42% of survivors of traumatic physical injury” (p. 1388). The authors concluded with a call for mental health screening following traumatic physical injury. In part, this paper represents a small step in that direction. It is understandable that the available literature has conflated mood with other psychological conditions (especially psychiatric disorders), but mood states that color cognition, conation, and affect may be worthy of investigation in their own right. It is regrettable that the term “mood” does not appear as a topic in the index to major texts (Frank, Rosenthal & Caplan, Reference Frank, Rosenthal and Caplan2010; Palmer, Brown & Hobson, Reference Palmer, Brown and Hobson2013; Shahnasarian, Reference Shahnasarian2011), or it is limited to psychiatric conditions (Falvo & Holland, Reference Falvo and Holland2018; Moroz, Flanagan & Zaretsky, Reference Moroz, Flanagan and Zaretsky2017).
The purpose of this study is to determine the effect on a variety of moods following compensable injuries in an Australian sample. In line with the earlier literature, it is hypothesized that (a) injuries do have a substantive impact on mood but also (b) that this effect might vary for different moods, such as negative moods (e.g., being angry or sad) or positive moods (e.g., being happy or energetic). Additionally, it might be expected that (c) the type of accident or injury has an impact on mood. Furthermore, (d) the relationship between moods and rehabilitation factors will be explored using the Vocational Rehabilitation Index (Cornes, Reference Cornes1990; Cornes & Roy, Reference Cornes and Roy1991). Briefly, the Vocational Rehabilitation Index posits a range of biopsychosocial factors that are linked with rehabilitation potential and which predict return to work, namely, (i) spinal injury (disc, whiplash); (ii) psychological problems; (iii) length of treatment; (iv) various sociodemographic influences such as age and sex; and (v) labor market factors such as occupational skill level or local labor market conditions. Using the answers to these research questions will aid in studying the role of vocational rehabilitation.
1. Method
1.1. Participants
The participants (49 female, 57 male) were aged 17–63 years (M = 39, SD = 11.5 years) and comprised a series of patients who were attending a medical center for vocational rehabilitation assessment following a compensable injury. The mean level of schooling was 10.9 years. In terms of formal post-school qualification, the largest number had no post-school education or training qualification (N = 47), 32 had a certificate or trade qualification, and 25 had a degree or diploma. The group comprised 80 city residents and 26 from country regions, with equal numbers of motor vehicle and work accidents (31% each – all percentages rounded) and 38% with general accidents (e.g., medical negligence and public liability). Involvement was voluntary and written permission was obtained prior to the assessment. No one declined to participate.
The time since injury averaged 4.45 years (SD = 5.04) but ranged up to 45 years (e.g., injuries related to childhood trauma). Whole-person impairment according to the American Medical Association tables was available in some instances and for 37 cases averaged 19% (SD = 8%). Typically, at least a 10% whole-person impairment is required to seek compensation. Just under half had undergone surgery for their condition (N = 62); a small number had been admitted to hospital but did not require surgery (N = 7) and around one-third (N = 37) were not admitted to hospital or had not attended an emergency department. Just under 70% of the sample (N = 74) had a musculoskeletal condition, 11 had a mental disorder, 7 had brain damage, and the remainder were spread across circulatory, disfigurement, hearing loss, nervous system, sight loss, or other conditions. In the overall group, 9% reported whiplash (N = 10) and 31% indicated a disc injury (N = 33). A major psychiatric problem (based solely on available medical information) existed in 61% of the cases (N = 65); and in 26% there was a minor psychiatric problem (N = 28). In this group 38% had not worked since the injury (N = 40), 32% (N = 34) returned to work, and 30% (N = 32) had returned to work at some stage but were now not working.
1.2. Instruments
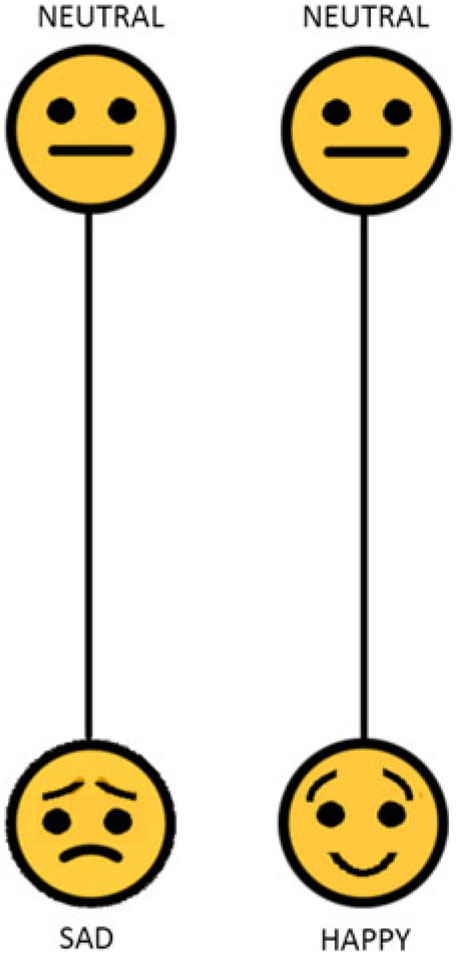
This study utilized the Visual Analog Mood Scales (Stern, Reference Stern1997), which comprises eight ideograms with a verbal descriptor for the following moods: Afraid, Confused, Sad, Angry, Energetic, Tired, Happy, and Tense. An actual item from the scale is not available for copyright reasons, but Fig. 3 provides a comparable representation. The Visual Analog Mood Scales are similar in format to the well-known visual analog scale used for the assessment of pain levels, which is based on a horizontal 10-cm line with two anchors – “no pain” and “pain as bad as it could be” (Burckhardt & Jones, Reference Burckhardt and Jones2003). In the Visual Analog Mood Scales, each mood is displayed on a separate page and the participant indicates their level of mood on a 100-mm vertical line. For the afraid, confused, sad, angry, and tired moods, the neutral face is at the top edge. For the happy and energetic moods, the neutral or opposite face is also at the top. The Visual Analog Mood Scales are especially suitable for those with low literacy levels for whom largely verbal questionnaires are not appropriate but also those with neurological conditions such as aphasia (Corsten, Schimpf, Konrad, Keilmann, & Hardering, Reference Corsten, Schimpf, Konrad, Keilmann and Hardering2015) or stroke (Vickery, Evans, Lee, Sepehri, & Jaheen, Reference Vickery, Evans, Lee, Sepehri and Jaheen2009). The test manual reported test–retest reliability for the single items for 75 undergraduate students, which ranged from 0.49 to 0.76 (Stern, Reference Stern1997, p. 121), and provided evidence of convergent and discriminant validity (Stern, Reference Stern1997, pp. 22–25) with clinical groups.
Example of two representative types of visual analog items (sad, happy).

The Vocational Rehabilitation Index was also used as a framework for investigation in this study. It is an index derived from demographic and medical data resulting in ratings from a minimum of 7 (very good vocational rehabilitation potential) to 24 (very poor vocational rehabilitation potential). The factors and gradings were: (a) age (16–30 years, 1 point; 31–40 years, 2 points; 41–50 years, 3 points; 51+ years, 4 points); (b) sex (male, 1 point; female, 2 points); (c) occupation (professional/intermediate level, 1 point; skilled manual, 2 points; semi-skilled manual, 3 points; other non-manual, 4 points; unskilled manual, 5 points); (d) length of treatment (<6 months, 1 point; 6–12 months, 2 points; 13–18 months, 3 points; 19+ months, 4 points); (d) labor market conditions (low unemployment, 1 point; medium unemployment, 2 points; high unemployment, 3 points); (e) spinal injury (none, 1 point; whiplash or simple fracture, 2 points; lumbar disc lesion or spinal cord injury, 3 points); and (f) psychological problems (nil, 1 point; minor – post-traumatic neurosis or anxiety state, 2 points; major – personality change, cognitive deficit, functional overlay, poor motivation, 3 points). The categorizations of psychological problems were determined on the basis of interview data (e.g., suicide attempt, admission to a psychiatric ward), medical reports especially from psychiatrists or hospital records. The index was developed originally for UK insurers, and research on this Vocational Rehabilitation Index has found application in Australian studies of quality of life (Athanasou, Reference Athanasou2015), return to work following occupational injury (Athanasou, Reference Athanasou2017a), and as a general employability measure (Athanasou, Reference Athanasou2017b).
The main departure from the scoring was that the length of treatment from the Vocational Rehabilitation Index is not easy to determine in compensable cases as, in many instances ,(a) maximal medical improvement had not been reached or (b) medical treatment of some form is ongoing with annual check-ups or further investigations, so the length of time since injury was used as a broad indicator of the length of treatment. The only other variation to add a group “not in the labour force” to occupation was as there were some participants who were not working at the time of their injury. This “not in the labour force” category was not relevant to the original development of the Vocational Rehabilitation Index, which had its beginning in workers’ compensation.
1.3. Procedure
Participants completed the Visual Analog Mood Scales as part of a vocational rehabilitation assessment. The assessment involved a structured interview covering personal, educational, vocational, social, and health backgrounds as well as a battery of assessments (literacy, mental status, vocational interest, grip strength, shoulder strength, malingering evaluation, mental status). The Vocational Rehabilitation Index was calculated separately and after the assessment by the author. The complete anonymous dataset is available free of charge from the author upon request.
1.4. Analysis
The results were analyzed using the JASP (2018) statistical software. Descriptive statistics, non-parametric Mann–Whitney or Kruskal–Wallis, parametric Student’s t-test, and univariate ANOVA comparisons were undertaken. For the Student’s t-test, effect size was given by Cohen’s d; for the Mann–Whitney test, effect size was given by the rank biserial correlation; and χ 2 was used as the effect size for Kruskal–Wallis and ANOVA. Statistical power for the mean values was determined and the required sample size for eight mood scales (95% CI, mean ±10) varied from 25 to 31 compared with the actual sample size of 106 in this study. Statistical details are available free of charge from the author upon request.
2. Results
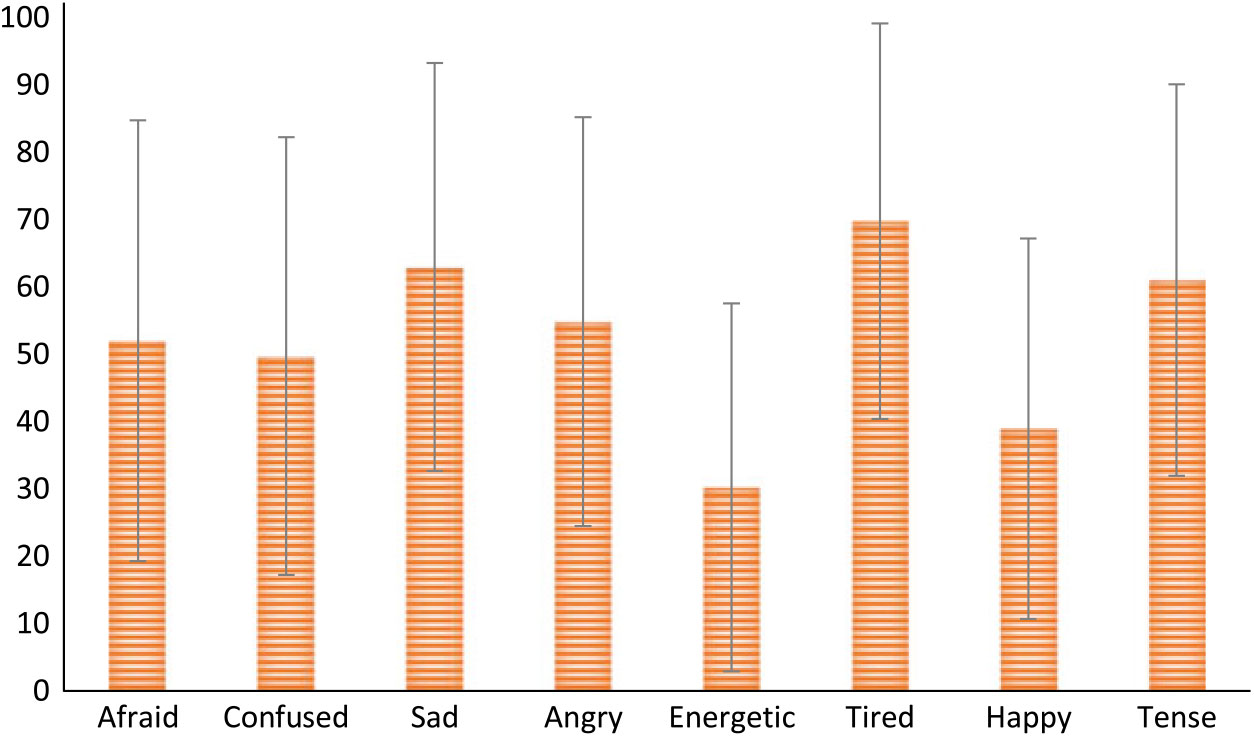
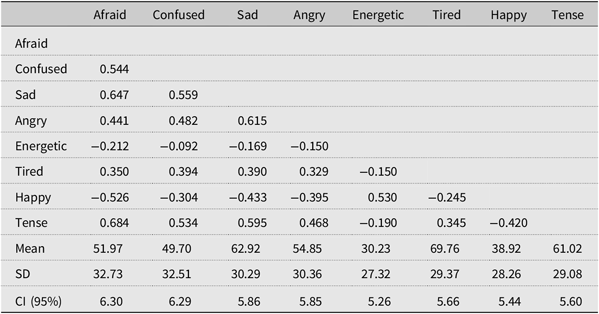
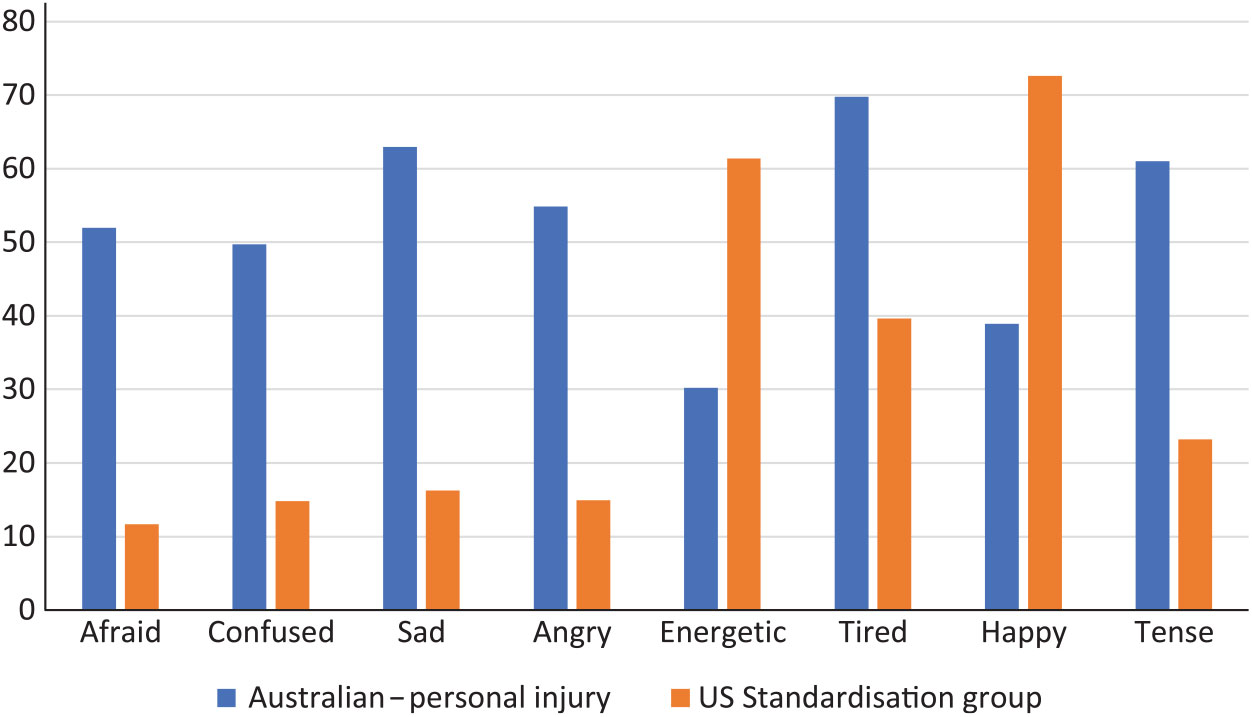
A snapshot of the overall mood state is provided by the average scores across the eight Visual Analog Mood Scales (Fig. 4). The averages listed in the second last row of Table 1 indicate a moderately elevated profile of mood states across all dimensions (remembering that the energetic and happiness scales are positive moods that are reversed in their scoring). Figure 5 takes this inference a step further and indicates a disparity in moods between the standardization sample (N = 402) of the Visual Analog Mood Scales and this personal injury sample. The standardization group comprised undergraduates and a convenience community sample. The personal injury group is higher on all the negative moods (afraid, confused, sad, angry, tired, tense) and lower on both positive (energetic, happy) moods. All the eight mean differences had an effect size >1.03.
Mean and standard deviation across all eight moods (N = 106).

Correlation matrix between the Visual Analog Mood Scales for injured clients (N = 106)

Comparison of the Australian personal injury group (N = 106) with the combined US standardization samples (N = 402).

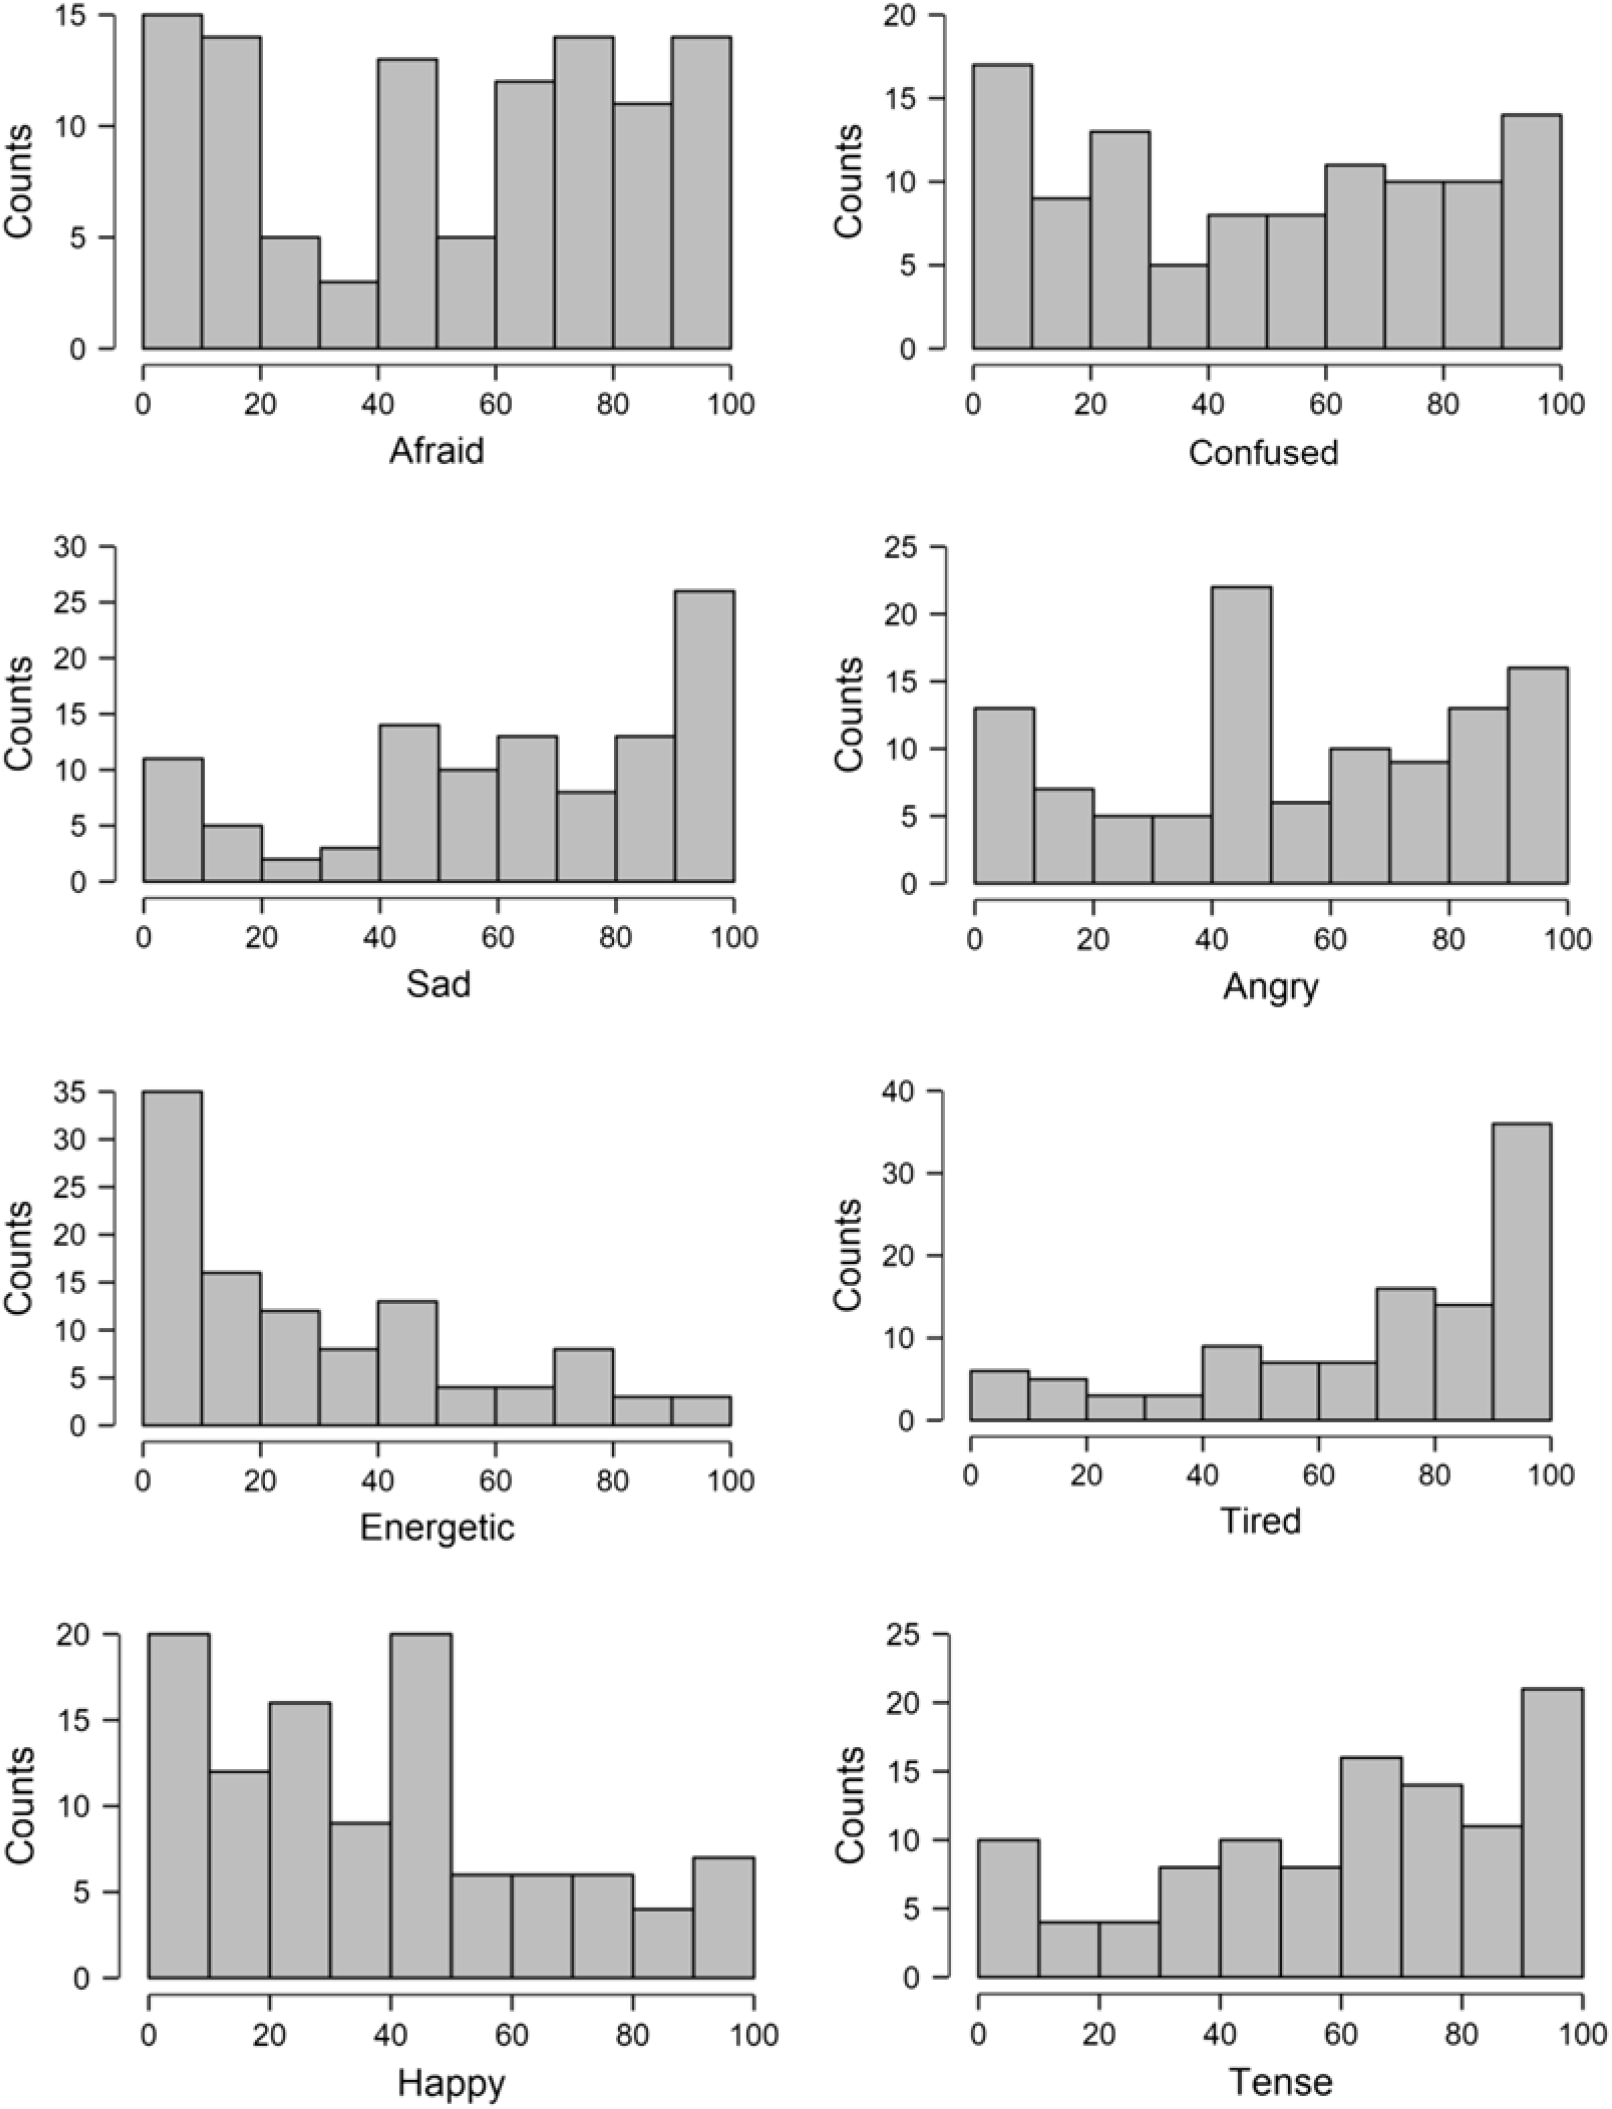
The broad comparison of means, however, masks within-group variation. Figure 6 can be viewed as a more detailed depiction of the mood profile of compensation patients with rectangular distribution of ratings on Afraid, Confused, and, to some extent, Angry, but with markedly negatively skewed distributions of ratings on Sad, Tired, and Tense but positively skewed distributions on Energetic (i.e., non-energetic) and Happy (i.e., non-happy). Descriptive statistics (mean, standard deviation, and confidence interval) for the eight moods are listed in the final three rows of Table 1.
Mood scale profiles of the sample (N = 106).

The type of accident (whether motor vehicle, work-related, or general accident) had no significant impact on seven out of the eight mood scales (afraid, F(2,103) = 0.411, ns; confused, F(2,102) = 0.538, ns; sad, F(2,102) = 0.959, ns; angry, F(2,103) = 1.161, ns; energetic, F(2,103) = 0.801, ns; tired, F(2,103) = 3.03, ns; happy, F(2,103) = 0.067, ns) except for the tense scale (F(2,103) = 4.417; p = 0.014; h 2 = 0.079), with those in the general accident group showing much higher levels of tension (M = 71.30, SD = 24.18) compared to the motor vehicle accident (M = 52.94, SD = 31.11) and work accident groups (M = 56.64, SD = 29.60). For all intents and purposes, it appeared reasonable at this stage to combine the data for all types of personal injury in the study of moods.
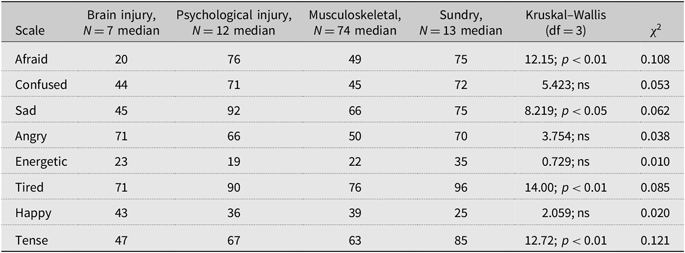
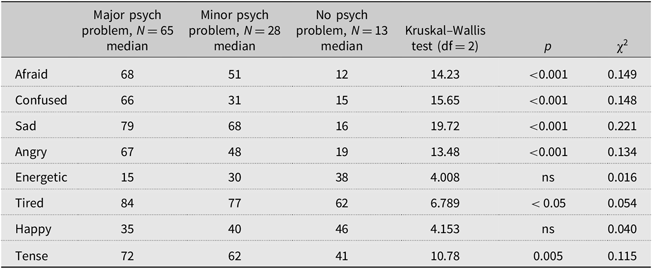
There were, however, some notable differences in mood conditions between different types of injuries. Table 2 lists the medians (rounded to the nearest integer) for the eight scales. Anger and tiredness featured in the small brain injury cohort. Sadness and tiredness characterized the psychological injury group (e.g., anxiety, PTSD, harassment, bullying), whereas the musculoskeletal group (i.e., upper and lower extremity fractures), which is the largest category in this study and of all disabilities in Australia, was relatively moderate across most moods with the possible exception of being energetic; whereas the sundry group was almost universally elevated on all negative moods and low on all the positive moods. Across the groups there were statistically significant differences for being afraid, sad, tired, or tense.
Mood differences between contracting disability groups

2.1. Mood patterns in compensable injury
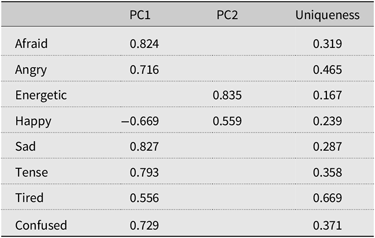
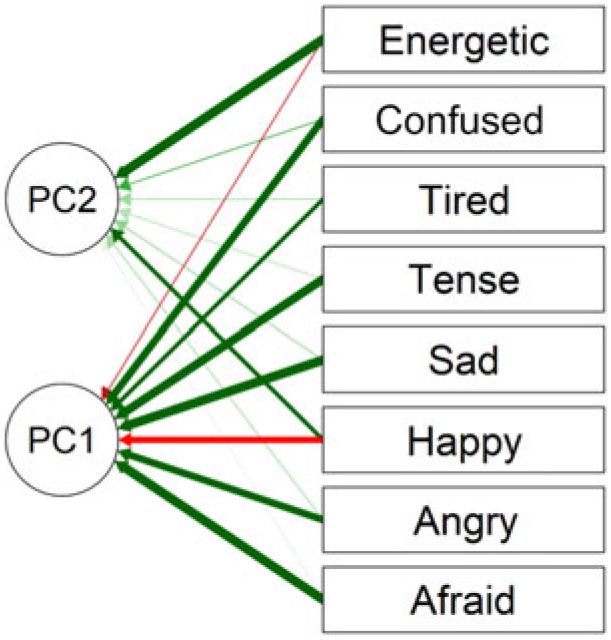
A contrasting pattern of positive and negative mood responses is evident in the intercorrelation between the eight scales in Table 1. Energetic and Happy (positive moods) had consistent negative correlations with Afraid, Confused, Sad, Angry, Tired, and Tense (negative moods). A principal components analysis with orthogonal rotation of the factors (Table 3) supported the existence of these two patterns of responding (eigen values > 1). It is illustrated in the path diagram in Fig. 7. The chi-square test of the model was significant (χ 2(13) = 54.1, p < 0.001).
Component loadings from the principal components analysis of the Visual Analog Mood Scales

Path diagram of responses on the Visual Analog Mood Scales for personal injury clients (N = 106).

2.2. Vocational Rehabilitation Index factors
2.2.1. Sociodemographic influences on mood (sex, age)
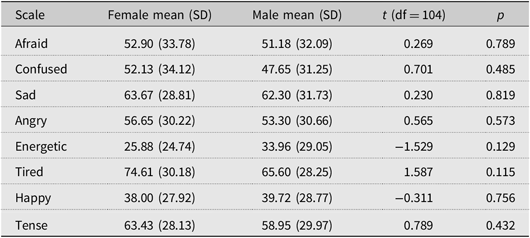
There were no statistically significant differences between sexes in mood scale scores. The results are summarized in Table 4. Nor was there a statistically significant correlation between age and mood scores (afraid, r = 0.073; confused, r = −0.121; sad, r = −0.084; angry, r = −0.033; energetic, r = 0.051; tired, r = −0.163; happy, r = 0.025; tense, r = 0.080).
Descriptive statistics on moods for females (N = 49) and males (N = 57)

2.2.2. Time since injury (length of treatment)
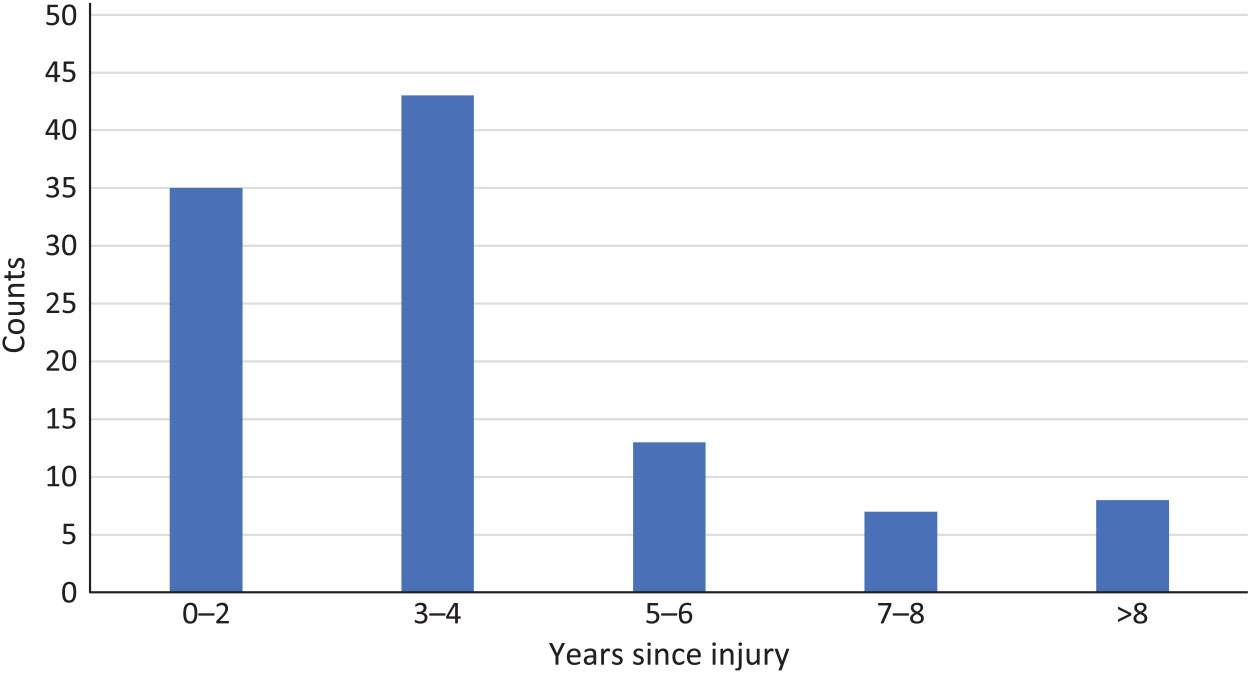
The mean length of time since injury was 4.45 years (SD = 5.04) and ranged from events in the same year up to 45 years. The longer periods shown in the tail end of the distribution in Fig. 7 are attributable to injury in childhood, which are not resolved until adulthood (e.g., child sexual abuse, motor vehicle accident in infancy). The time since injury showed no statistically significant relationship with any of the mood scores (afraid, r = 0.035; confused, r = 0.022; sad, r = 0.129; angry, r = −0.099; energetic, r = 0.043; tired, r = 0.033; happy, r = 0.081; tense, r = 0.056).
2.2.3. Spinal injury
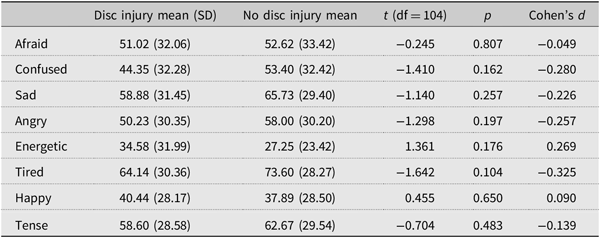
There was no statistically significant difference in any of the eight mood levels between those with spinal injury (back pain, fracture, whiplash, spinal cord injury) and those without a spinal injury. Despite the lack of statistical significance, some effect sizes were in the low to moderate range, but there was no pattern in the results as this data came from a mixed group of personal injuries. The results are summarized in Table 5.
Effect of a disc injury (N = 43) versus no disc injury (N = 63) on moods – t-test and effect size

2.2.4. Psychological problems
In this group there were 28 (26%) with minor psychological problems such as a post-traumatic neurosis or anxiety state, whereas 65 (61%) had major psychological problems that comprised personality change, cognitive deficit, functional overlay, or poor motivation; while 13 (12%) had no psychological problem. Mean differences between groups (columns 2, 3, and 4 of Table 6) showed monotonic decreases on negative moods from major through minor to no psychological problems and were in line with expectations. The reverse was true for the positive moods. Statistically significant effects were noted for the scales afraid, confused, sad, and angry and, to a lesser extent, for tired and tense. The effect of psychological problems was moderate for sad, afraid, confused, angry, and tense. In general, the mood effects of psychological problems were evident from this analysis, but at this stage it is not clear whether the moods cause, are a consequence, or co-exist with psychological problems.
Effect of major psychological problem (N = 65), minor psychological problem (N = 28), and no psychological problem (N = 13) on moods

2.2.5. Labor market factors – occupational level
The first labor market factor that was investigated in relation to mood was occupation. Four groups were formed combining all the non-manual occupations, the skilled and semi-skilled occupations, unskilled occupations, and introducing a group “not in the labour force” for those who were not working at the time of injury (e.g., student, home duties, unemployed, and not looking for work). There were no statistically significant differences between these occupational groups in mood scores for afraid (F(3,102) = 1.172, ns), confused (F(3,101) = 0.497, ns), sad (F(3,101) = 0.649, ns), angry (F(3,98) = 1.52, ns), energetic (F(3,102) = 2.56, p = 0.058), tired (F(3,94) = 1.62, ns), happy (F(3,102) = 1.09, ns), and tense (F(3, 102) = 0.788, ns).
2.2.6. Labor market factors – level of unemployment
The level of unemployment in a person’s local region took into account being 1 SD above (i.e., high) or below (i.e., low) the mean (i.e., medium) and did not bear any significant statistical relationship to the mood levels: afraid (F(2,102) = 1.00, ns); confused (F(2,101) = 0.234, ns); sad (F(2,101) = 2.48, ns); angry (F(2,102) = 0.452, ns); energetic (F(2,102) = 0.494, ns); tired (F(2,102) = 1.256, ns); happy (F(92,102) = 0.292, ns); and tense (F(2,102) = 0.412, ns).
2.2.7. Vocational rehabilitation outcomes – return to work
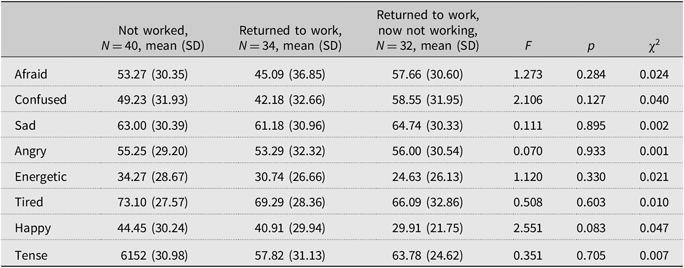
The relationship between return to work status and moods was not statistically significant in this group (Table 7). It was generally the case that the returned to work cohort had marginally higher mean mood ratings on the negative (afraid, confused, sad, angry, tired, tense) but not positive moods (energetic, happy) than those who had not worked. Participants who had attempted a return to work and who were now not working were highest on negative moods (such as afraid, confused, sad, angry, and tense) and lowest on positive moods (energetic, happy). The effect sizes were all very small.
Effect of return to work status on moods – ANOVA and effect size

2.2.8. Vocational Rehabilitation Index
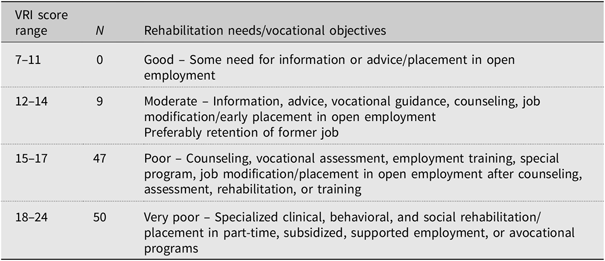
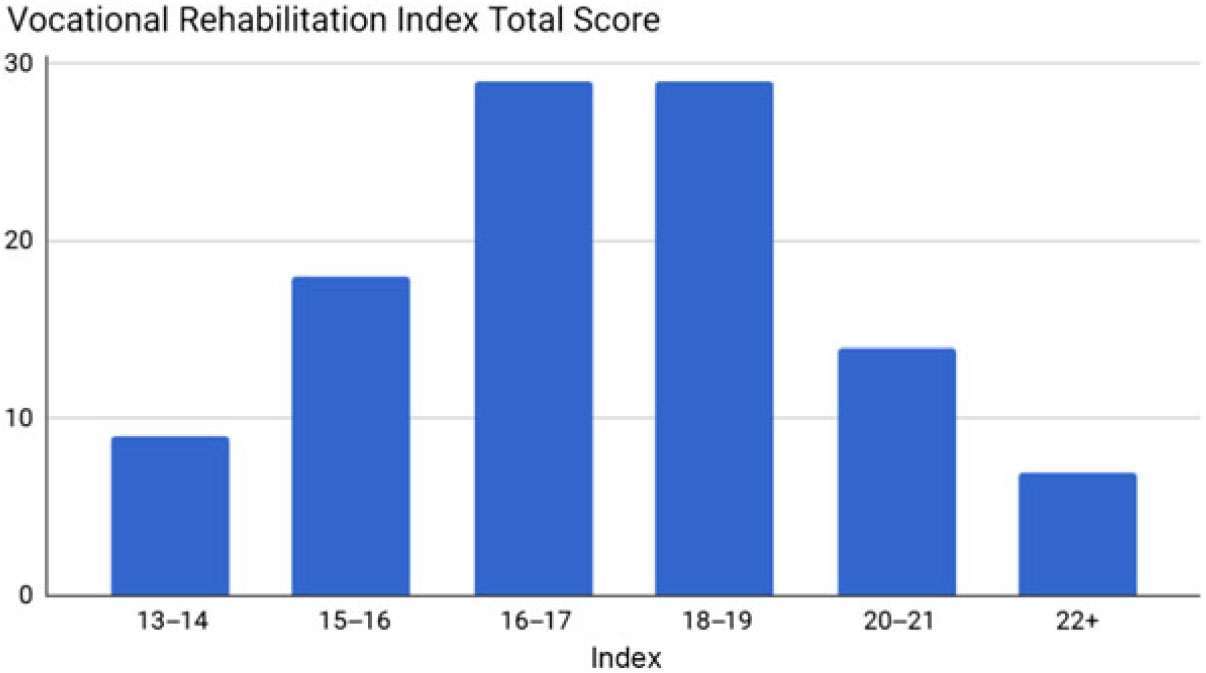
The Vocational Rehabilitation Index for this group was fairly normally distributed (Fig. 8). The group can be characterized (Table 8) as one which had poor to very poor vocational rehabilitation potential based on the Vocational Rehabilitation Index, and there was no statistically significant correlation between the total index and mood scores (afraid, r = 0.163; confused, r = 0.096; sad, r = 0.212; angry, r = 0.072; energetic, r = 0.127; tired, r = 0.044; happy, r = −0.00008; and tense, r = 0.074) (Fig. 9).
Distribution of time since injury (N = 106).

Vocational Rehabilitation Index (VRI) ratings

Distribution of Vocational Rehabilitation Index total score (N = 106).

3. Discussion and Conclusions
Injury and moods are related but in complex ways. The results indicated an overall heightened level of negative moods (being afraid, confused, sad, angry, tired, tense) and lowered positive moods (energetic, happy). This is consistent with the reports from Mayou et al. (Reference Mayou, Bryant and Duthie1993), Milders et al. (Reference Milders, Fuchs and Crawford2003), Craig et al. (Reference Craig, Wijesuriya and Tran2013), and Wiseman et al. (Reference Wiseman, Foster and Curtis2013). Secondly, there was a clear difference between this sample when contrasted with the standardization group. The difference is visible in Fig. 3 and through the mean scores in Table 1. Of practical relevance is that the test manual for the Visual Analog Mood Scales suggests a cut-off of 50 on the Sad scale as a basis for further clinical investigation of depression (Stern, Reference Stern1997, p. 18), and in this group, more than half met this criterion.
The results of this study also supported the existence of two general patterns of positive or negative responding in relation to moods. They are illustrated by the path diagram in Fig. 6. The mood factors in an injury group are consistent with the analyses of non-clinical samples (Stern, Reference Stern1997). It is a useful finding in the study of moods as it means there are consistent psychological processes operating across injured and non-injured samples.
In addition, this report of mood following injury has provided a range of negative results. While this may seem adverse at the outset, it is actually very helpful in our thinking and practice related to moods and injury. It was of practical significance that (a) there were no sociodemographic effects of age and sex and (b) that the time since injury did not compound mood effects. Mood effects appear to be long-lasting once they are set in place by an injury. Moreover, there were no occupational factors related to mood, and labor market conditions related to the level of unemployment played no role in one’s outlook. Return to work did not feature as a significant aspect of moods. Particular injuries such as spinal injury were not in and of themselves related significantly to moods. In other words, those with an injury – whether it was a spinal injury or not – had similar effects on mood. Furthermore, the type of injury (motor vehicle accident or work injury or general accident) did not play a significant role. Nevertheless, we are no closer to determining whether injury is the sole cause of the extent of mood effects, and this type of study is not able to resolve this question.
The Visual Analog Mood Scales have the great advantage of being useful with a cohort of patients who are not suited to questionnaires and who find them easy to complete, but a limitation of this study relates to a feature of the measure that was used, namely, the low test–retest reliability (i.e., 0.49–0.76 of the Visual Analog Mood Scales). The lower stability of the eight independent measures influences the accuracy of group comparisons as there may be greater unreliability in some specific cohorts (e.g., those with major psychological problems). Secondly, the comparison with the standardization group of the Visual Analog Mood Scales is limited as it used a convenience sample of students as well as persons from church and community groups (Leung, Reference Leung, Plake, Impara and Spies2003). Thirdly, it may be argued that reliance on a group of compensable injuries is not appropriate because they represent the more serious injuries that had met a threshold of at least 10% whole-person impairment and therefore the findings might not apply to all injuries. This is a valid point, and further studies are required to delineate this distinction, but for the most part, there was no statistically significant correlation between the available whole-person impairment ratings and mood scores. The correlations ranged from −0.197 to 0.157. A related fifth concern is whether the findings are limited only to compensable injuries, but here it must be stated that vocational rehabilitation counseling in Australia is for the most part based on injury management. A final concern is the issue of potential malingering in a compensation sample but on a clinical test of malingering (in the Lezak 15-item memory test, only four persons scored less than the cut-off of 9 out of 15 – even persons with severe brain injury could recall nine items; Lezak, Reference Lezak1995). The entire data was retained since from clinical experience a low score can arise equally from confusion, poor understanding of task requirements, limited English language skills, low level of education or cognitive ability as much as from dissimulation. Finally, two other limitations that should be mentioned are (a) representativeness of the sample and (b) the small numbers in some injury categories. Firstly, no claim is made that the sample is representative of injured persons or that generalizations can be made to individual cases. Secondly, there are small numbers in some categories, but the distribution of participants does reflect the spread of cases in general professional rehabilitation practice in Australia compared to official statistics (Athanasou, Reference Athanasou2016).
The stand-out result from this study was important but, with hindsight, not at all remarkable. The level of psychological problems (major, minor, none) was related to mood levels. A large proportion (87%) of this injury group had psychological problems, and it is a concern that such problems accompany the vast spectrum of human injury. In some instances, the injury might have been psychological as in the case of workplace bullying. In other instances, psychological problems were co-morbid with physical injuries. The results, however, were uniformly statistically significant for differences between those with no psychological problem compared to those with a minor or major psychological problem in being afraid, confused, sad, angry, tired, or tense. Knowing that psychological problems exist, however, is not sufficient for identifying the particular mood that may be affected, that is, being afraid, confused, sad, angry, tired, energetic, happy, or tense. At the end of the day, it seems likely that (a) moods are a consequence of injury experience but moderated by a host of factors and (b) although the effects of injury on mood are variable at the individual level, they are quite noticeable at a group level and, for this reason, (c) rehabilitation may benefit from averting such consequences.
Acknowledgements
None.
Funding
This research received no specific grant from any funding agency in the public, commercial, or not-for-profit sectors.
Conflict of interest
None.