
1. Introduction
Combustion instability is the amplification phenomenon of thermoacoustic resonance modes and is sustained by the feedback mechanisms coupling mutually among the fluctuations in pressure, heat release and hydrodynamics in wide-ranging combustors including power plants and aircraft and rocket engines. It is classified by acoustic pressure fluctuations inside a combustor into three combustion instabilities, on the basis of the range of the dominant frequencies in the combustor: low-frequency (<50 Hz), intermediate-frequency (50–1000 Hz), and high-frequency (>1000 Hz) combustion instabilities (Lieuwen & Yang Reference Lieuwen and Yang2005). The incidence of combustion instability generates mechanical vibrations of the combustor and the increase in the heat transfer rate to the combustor wall, shortening the lifetime and causing serious structural damage to combustors. Extensive and comprehensive reviews on the feedback mechanisms have been provided by Lieuwen & Yang (Reference Lieuwen and Yang2005), Huang & Yang (Reference Huang and Yang2009), Lieuwen (Reference Lieuwen2012) and O'Connor, Acharya & Lieuwen (Reference O'Connor, Acharya and Lieuwen2015). Many numerical and experimental investigations on high-frequency combustion instability in various model rocket engine combustors have focused on the following points related to the driving and feedback mechanisms: (i) the coupling of pressure and heat release rate fluctuations (Armbruster, Hardi & Oschwald Reference Armbruster, Hardi and Oschwald2021), (ii) the mutual interaction between the acoustic modes inside the combustor and the oxygen injector (Gröning et al. Reference Gröning, Hardi, Suslov and Oschwald2016; Urbano et al. Reference Urbano, Selle, Staffelbach, Cuenot, Schmitt, Ducruix and Candel2016; Martin et al. Reference Martin, Armbruster, Hardi, Suslov and Oschwald2021), (iii) the induction of fuel flow velocity fluctuations due to the propagation of pressure fluctuations into the fuel injector (Urbano et al. Reference Urbano, Douasbin, Selle, Staffelbach, Cuenot, Schmitt, Ducruix and Candel2017), (iv) the effects of the pressure and flow velocity fluctuations on the jet flame behaviour (Morgan, Shipley & Anderson Reference Morgan, Shipley and Anderson2015) and (v) the driving of high-frequency combustion instability due to a repetition of detachment and reignition of a jet flame at the shear layer region between fuel and oxidizer flows (Harvazinski et al. Reference Harvazinski, Huang, Sankaran, Feldman, Anderson, Merkle and Talley2015).
The complex-network approach (Newman Reference Newman2010; Barabási Reference Barabási2016) inspired by discrete mathematics has recently enabled us to clarify the nonlinear dynamics of intermediate-frequency combustion instability in several turbulent combustors (Murugesan & Sujith Reference Murugesan and Sujith2015; Okuno, Small & Gotoda Reference Okuno, Small and Gotoda2015; Godavarthi et al. Reference Godavarthi, Pawar, Unni, Sujith, Marwan and Kurths2018; Murayama et al. Reference Murayama, Kinugawa, Tokuda and Gotoda2018; Guan et al. Reference Guan, Li, Ahn and Kim2019; Kobayashi et al. Reference Kobayashi, Murayama, Hachijo and Gotoda2019; Krishnan et al. Reference Krishnan, Sujith, Marwan and Kurths2019b, Reference Krishnan, Sujith, Marwan and Kurths2021). The importance of the complex-network approach in the fields of combustion engineering and fluid physics has been shown in some recent review articles (Juniper & Sujith Reference Juniper and Sujith2018; Sujith & Unni Reference Sujith and Unni2020, Reference Sujith and Unni2021; Iacobello, Ridolfi & Scarsoglio Reference Iacobello, Ridolfi and Scarsoglio2021) and a book (Sujith & Pawar Reference Sujith and Pawar2021). These works have proactively adopted a wide variety of complex networks such as the visibility graph (Lacasa et al. Reference Lacasa, Luque, Ballesteros, Luque and Nuño2008; Lacasa & Toral Reference Lacasa and Toral2010), the turbulence network (Taira, Nair & Brunton Reference Taira, Nair and Brunton2016), the cycle network (Zhang & Small Reference Zhang and Small2006), the ordinal partition transition network (McCullough et al. Reference McCullough, Small, Stemler and Iu2015; Zhang et al. Reference Zhang, Zhou, Tang, Guo, Small and Zou2017), a recurrence network (Marwan et al. Reference Marwan, Romano, Thiel and Kurths2007) and a spatial network (Iacobello et al. Reference Iacobello, Ridolfi and Scarsoglio2021) for revealing the nonlinear dynamics during a transitional state from combustion noise to intermediate-frequency combustion instability. One of the most promising networks used to clarify the spatio-temporal dynamics of combustion instability is the spatial network (e.g. an acoustic power network) (Krishnan et al. Reference Krishnan, Sujith, Marwan and Kurths2019b). Krishnan et al. (Reference Krishnan, Sujith, Marwan and Kurths2019b) studied the spatio-temporal dynamics of combustion noise and combustion instability in a bluff-body-stabilized combustor using a weighted acoustic power network. They elucidated that the acoustic power sources emerge as fragmented clusters during combustion noise, whereas large clusters of acoustic power sources are formed during intermediate-frequency combustion instability.
Regarding high-frequency combustion instability in a model rocket combustor, we have recently conducted two studies (Hashimoto et al. Reference Hashimoto, Shibuya, Gotoda, Ohmichi and Matsuyama2019; Shima et al. Reference Shima, Nakamura, Gotoda, Ohmichi and Matsuyama2021) on the spatio-temporal dynamics of combustion instability in a cylindrical combustor with an off-centre-installed coaxial injector, including the feedback mechanism in the transitional state to combustion instability. Hashimoto et al. (Reference Hashimoto, Shibuya, Gotoda, Ohmichi and Matsuyama2019) showed that a scale-free structure in the turbulence network is largely maintained during combustion instability. They also showed that the transfer entropy (Schreiber Reference Schreiber2000) is valid for determining the directional dependence between the pressure and heat release rate fluctuations that is strongly associated with the feedback mechanisms in the onset of combustion instability. Shima et al. (Reference Shima, Nakamura, Gotoda, Ohmichi and Matsuyama2021) clarified that the flow velocity fluctuations in the fuel injector play an important role in the large fluctuations of the heat release rate by estimating the symbolic transfer entropy (Staniek & Lehnertz Reference Staniek and Lehnertz2008). They also elucidated that the emergence and collapse of the clusters in an unweighted acoustic power network occur periodically with the generation of combustion instability. Aoki et al. (Reference Aoki, Gotoda, Yoshida and Tachibana2020) experimentally examined the randomness of pressure fluctuations during intermittent high-frequency combustion instability in a cylindrical combustor by estimating the information entropy in an ordinal partition transition network. Koizumi et al. (Reference Koizumi, Tsutsumi, Omata and Shimizu2020) examined the directional coupling between the pressure and heat release rate fluctuations during high-frequency combustion instability in a continuously variable resonance combustor using the transfer entropy. Kasthuri et al. (Reference Kasthuri, Krishnan, Gejji, Anderson, Marwan, Kurths and Sujith2022) have experimentally studied the spatio-temporal dynamics during a transition from the intermittent state to high-frequency combustion instability in a model rocket combustor with multiple elements using a weighted spatial network.
A machine learning approach based on statistical learning theory (Bishop Reference Bishop2006) has recently attracted considerable attention in all scientific disciplines and is highly expected to lead to an in-depth understanding of complex nonlinear combustion dynamics and the development of sophisticated detectors of a precursor of combustion instability (Hachijo et al. Reference Hachijo, Masuda, Kurosaka and Gotoda2019; Kobayashi et al. Reference Kobayashi, Murayama, Hachijo and Gotoda2019; Shinchi et al. Reference Shinchi, Takeda, Gotoda, Shoji and Yoshida2021; Waxenegger-Wilfing et al. Reference Waxenegger-Wilfing, Sengupta, Martin, Armbruster, Hardi, Juniper and Oschwald2021; Guan et al. Reference Guan, Moon, Kim and Li2022). Gotoda and co-workers (Hachijo et al. Reference Hachijo, Masuda, Kurosaka and Gotoda2019; Kobayashi et al. Reference Kobayashi, Murayama, Hachijo and Gotoda2019) attempted to detect a precursor of intermediate-frequency combustion instability in a swirl-stabilized combustor using a combinational methodology of the ordinal partition transition network or Jensen–Shannon complexity–entropy causality plane (Rosso et al. Reference Rosso, Larrondo, Martin, Plastino and Fuentes2007),  $k$-means clustering (Lloyd Reference Lloyd1982) and a support vector machine (Vapnik Reference Vapnik1999). The early detection of combustion instability in a staged multisector combustor (Shinchi et al. Reference Shinchi, Takeda, Gotoda, Shoji and Yoshida2021) and a cryogenic rocket thrust chamber (Waxenegger-Wilfing et al. Reference Waxenegger-Wilfing, Sengupta, Martin, Armbruster, Hardi, Juniper and Oschwald2021) has more recently been examined, both of which consider recurrence-based analysis (Marwan et al. Reference Marwan, Romano, Thiel and Kurths2007) and the support vector machine. Guan et al. (Reference Guan, Moon, Kim and Li2022) elucidated the relationship between the two interactions: pressure–pressure and pressure–heat release rate interactions during intermediate-frequency combustion instability in coupled swirl-stabilized combustors using a combinational methodology of the joint recurrence network (Marwan et al. Reference Marwan, Romano, Thiel and Kurths2007) and Gaussian mixture model clustering (Reynolds Reference Reynolds2009).
As mentioned above, the formation and feedback mechanisms of high-frequency combustion instability have been examined in many experimental and numerical studies (Harvazinski et al. Reference Harvazinski, Huang, Sankaran, Feldman, Anderson, Merkle and Talley2015; Morgan et al. Reference Morgan, Shipley and Anderson2015; Gröning et al. Reference Gröning, Hardi, Suslov and Oschwald2016; Urbano et al. Reference Urbano, Selle, Staffelbach, Cuenot, Schmitt, Ducruix and Candel2016, Reference Urbano, Douasbin, Selle, Staffelbach, Cuenot, Schmitt, Ducruix and Candel2017; Armbruster et al. Reference Armbruster, Hardi and Oschwald2021; Martin et al. Reference Martin, Armbruster, Hardi, Suslov and Oschwald2021). However, in those studies, the relevance of the interesting switching phenomena between the attached and lifted flame edges from the injector to the sustainment mechanism of high-frequency combustion instability has not been investigated from the viewpoint of complex networks and machine learning. The main aim of this study is to extend our understanding of the sustainment mechanism of high-frequency combustion instability in a model single-element rocket combustor, focusing mainly on the community detection of complex networks and machine learning. Research groups conducting recent studies (Aoki et al. Reference Aoki, Shimura, Naka and Tanahashi2017; Urbano & Selle Reference Urbano and Selle2017) on the driving region of combustion instability evaluated the energy budget of acoustic power production during combustion instability by disturbance energy analysis (Brear et al. Reference Brear, Nicoud, Talei, Giauque and Hawkes2012) in terms of the Rayleigh index. In this study, we first propose a local Rayleigh index ratio consisting of the heat release rate and molecular production terms. As mentioned above, Shima et al. (Reference Shima, Nakamura, Gotoda, Ohmichi and Matsuyama2021) proposed an unweighted acoustic power network consisting of the product of the pressure and heat release rate fluctuations. They captured the emergence of a thermoacoustic cluster during a transitional state to high-frequency combustion instability by calculating only the sign of the products of the pressure and heat release rate fluctuations. Their network can successfully extract the periodic change in the cluster coefficient in response to the pressure fluctuations, but it remains difficult to sufficiently explain the fast switching phenomena between the attached and lifted flame edges from the injector during high-frequency combustion instability. Their network does not particularly fail to extract the thermoacoustic damping source in the acoustic power network. Therefore, a more advanced spatial network from the viewpoint of acoustic energy flux in the acoustic energy equation should be taken into account to appropriately deal with such switching phenomena during combustion instability. To this end, we newly propose a class of spatial network different from that developed in the previous studies (Shima et al. Reference Shima, Nakamura, Gotoda, Ohmichi and Matsuyama2021), namely, an acoustic energy flux-based spatial network. The division of network nodes into groups (community) with dense/sparse connections is an important approach for the reduction or coarse graining of networks (Newman Reference Newman2010). The  $P$–
 $Z$ map (Guimerà & Amaral Reference Guimerà and Amaral2005) is a useful tool for identifying the role of nodes in terms of community and has recently been adopted to examine the dynamic behaviour of turbulent flows (Meena & Taira Reference Meena and Taira2021). Nevertheless, the community detection has not been adopted in previous studies on high-frequency combustion instability in a model rocket engine combustor, except for intermediate-frequency combustion instability in a swirl-stabilized turbulent combustor (Murayama et al. Reference Murayama, Kinugawa, Tokuda and Gotoda2018). In this study, we adopt the
 $P$–
 $Z$ map for the acoustic energy flux-based spatial network. We finally introduce a clustering-based transition network using the spectral-clustering method (Von Luxburg Reference Von Luxburg2007) in terms of machine learning. Note that, similarly to the motivation of Guan et al. (Reference Guan, Moon, Kim and Li2022), we employ spectral clustering as unsupervised machine learning to reveal the hidden network dynamics of unlabelled physical quantities (pressure, flow velocity of the fuel jet and temperature) associated with the feedback mechanism of high-frequency combustion instability in our combustor, rather than to detect a precursor of combustion instability using a new data set.
This paper comprises four sections. Section 2 gives the framework of the analytical methods, including a brief description of the numerical computation. Results and discussion are presented in § 3. The findings obtained in this study are summarized in § 4.
2. Analytical method
Matsuyama et al. (Reference Matsuyama, Hori, Shimizu, Tachibana, Yoshida and Mizobuchi2016) computationally obtained the spatio-temporal combustion field during a transitional state and the subsequent high-frequency combustion instability by high-resolution large-eddy simulation. In this study, we adopt the following analytical methods for the spatio-temporal data (Matsuyama et al. Reference Matsuyama, Hori, Shimizu, Tachibana, Yoshida and Mizobuchi2016). Details of the computation, including the governing equations, the numerical scheme and the initial and boundary conditions, are described by Matsuyama et al. (Reference Matsuyama, Hori, Shimizu, Tachibana, Yoshida and Mizobuchi2016).
The model rocket engine combustor that we employed in this study comprises a cylindrical combustor with an off-centre-installed coaxial injector. The  $\mathrm {H}_2/\mathrm {O}_2$ injector is set at
 $y = 72$ mm from the centre of the combustor, where
 $y$ is the transverse direction of the combustor. Here,
 $\mathrm {H}_2$ and
 $\mathrm {O}_2$ are respectively released from the outer and inner injectors. The outer (inner) diameter of the
 $\mathrm {H}_2$ (
 $\mathrm {O}_2$) injector rim is 8.6 mm (4.9 mm). The first tangential (1 T)-mode oscillations with approximately 1 kHz, which exceed
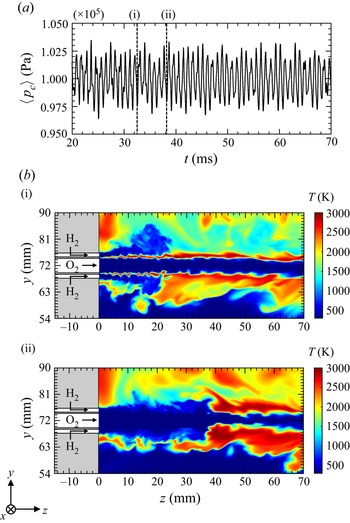
 ${\pm }3\,\%$ of the time-averaged pressure in the combustor, are clearly produced by their computation (figure 1a). The flame dynamics during combustion instability switches back and forth between the attached and lifted flame edges from the injector rim, with accompanying large-scale organized vortex rings (Matsuyama et al. Reference Matsuyama, Hori, Shimizu, Tachibana, Yoshida and Mizobuchi2016; Hashimoto et al. Reference Hashimoto, Shibuya, Gotoda, Ohmichi and Matsuyama2019) shedding from the injector rim (figure 1b). The location of the flame edge changes up to
 $z \approx 50$ mm when the flame edge is lifted from the injector rim, where
 $z$ is the longitudinal direction of the combustor. The ignition of the unburnt
 $\mathrm {H}_2/\mathrm {O}_2$ mixture periodically arises shortly after the unburnt
 $\mathrm {H}_2/\mathrm {O}_2$ mixture that moves upward and touches high-temperature combustion products (Matsuyama et al. Reference Matsuyama, Hori, Shimizu, Tachibana, Yoshida and Mizobuchi2016; Shima et al. Reference Shima, Nakamura, Gotoda, Ohmichi and Matsuyama2021). As a result of the periodic ignition, the attached flame forms near the injector rim. We focus on the region (
 $x = 0$ mm,
 $64\,{\rm mm}\le y \le 80\,{\rm mm}$ and
 $0\,{\rm mm} < z \le 70$ mm, where
 $x$ is the direction normal to the
 $y$ direction) covering the flame dynamics during high-frequency combustion instability (see figure 1b).
(a) Time variation in spatially averaged pressure fluctuations  $\langle p_{c} \rangle$ during combustion instability in the ranges of
 $x = 0\,{\rm mm}$,
 $54\,{\rm mm} \leq y \leq 90\,{\rm mm}$ and
 $0\,{\rm mm} < z \leq 70\,{\rm mm}$. (b) Instantaneous temperature field
 $T$ in the combustion chamber during high-frequency combustion instability; (a (i),b (i))
 $t = 32.55$ ms and (a (ii),b (ii))
 $t = 38.25$ ms.

2.1. Rayleigh index ratio
The Rayleigh index, which is derived from the acoustic energy equation, is widely used as an important indicator for extracting the driving region of combustion instability (Lieuwen Reference Lieuwen2012). Lieuwen (Reference Lieuwen2012) explained that the molecular source term considering the changes in the number of moles in the gas throughout chemical reactions works as one of the source terms in the acoustic energy equation under oxygen combustion. Aoki et al. (Reference Aoki, Shimura, Naka and Tanahashi2017) showed that the energy budget of the acoustic production should be considered for the estimation of the Rayleigh index. On these bases, we propose a local Rayleigh index ratio considering the effects of heat release rate and molecular production as the source term in the acoustic energy equation. In this index, we define the source term  ${\varPhi }$ as (2.1).
 \begin{equation} {\varPhi} = \frac{\gamma_0-1}{\gamma_0 p_0}p_1 q_1 + p_1 \left(\dfrac{\dot{n}}{n}\right)_1. \end{equation}
The first (second) term of the right-hand side of (2.1) corresponds to the heat release rate source term (molecular production source term)
 \begin{gather} R_{I,h}=\dfrac{1}{T_p}\int_{T_p}\left\{\dfrac{\gamma_0-1}{\gamma_0 p_0}p_1q_1\right\}\,{\rm d}t. \end{gather}
 \begin{gather} R_{I,m}=\dfrac{1}{T_p}\int_{T_p}\left\{p_1\left(\dfrac{\dot{n}}{n}\right)_1\right\}\,{\rm d}t. \end{gather}
 \begin{gather} \xi_R=\dfrac{R_{I,h}+R_{I,m}}{R_{I,h}}. \end{gather}
Here,  $R_{I,h} (R_{I,m})$ is a local Rayleigh index based on the heat release rate source (molecular production source),
 $\xi _R$ is a local Rayleigh index ratio,
 $\gamma$ is the specific heat ratio,
 $p$ is the pressure inside the combustor,
 $q$ is the heat release rate,
 $n$ is the mole concentration,
 $\dot {n} = \sum _{i=1}^{N_s} ({\dot {w}_i}/{M_{w,i}})$, where
 $N_s$ is the total number of chemical species,
 $M_{w,i}$ is the molecular weight of species
 $i$ and
 $\dot {w}_i$ is the mass-based production rate of species
 $i$ by chemical reactions, and subscript 0 (1) represents a time-averaged (fluctuation) quantity. The physical meaning of
 $\xi _R$ is that the mole production source does not affect the driving of combustion instability when
 $\xi _R$ equals unity (
 $R_{I,m}$ = 0). The mole production source acts as the amplification (attenuation) of combustion instability when
 $\xi _R$ is larger (smaller) than unity. Note that
 $T_p$ is set to 10 ms in this study so as to eliminate the dependence of
 $T_p$ on the spatial distributions of
 $R_{I,h}, R_{I,m}$ and
 $\xi _R$.
2.2. Acoustic energy flux-based spatial network
Krishnan et al. (Reference Krishnan, Sujith, Marwan and Kurths2019b) and Shima et al. (Reference Shima, Nakamura, Gotoda, Ohmichi and Matsuyama2021) studied the formation and collapse of the acoustic power source in the acoustic power network. In this study, we propose an acoustic energy flux-based spatial network as a new complex network. Let us assume that the total acoustic energy source produced at a local region  $\Delta y \Delta z$ can be expressed as
 ${\varPhi }\Delta y \Delta z$. Our network considers the energy flux
 $I_{ij}$ at location
 $\boldsymbol {y}_j$ induced by the acoustic energy source
 ${\varPhi }(\boldsymbol {y}_i)$ per unit time volume at another location
 $\boldsymbol {y}_i$ as follows:
 \begin{equation} I_{ij}=\dfrac{|{\varPhi}(\boldsymbol{y}_i)\Delta y \Delta z|}{2{\rm \pi}|\boldsymbol{y}_i-\boldsymbol{y}_j|}. \end{equation}
Here,  $\Delta y (\Delta z$) is the grid size in the
 $y (z$) direction over a Cartesian domain and a grid corresponds to a node in the network. Equation (2.5) physically means that the energy flux ( =
 ${{\varPhi }\Delta y \Delta z}/{r}$) propagates to a location
 $r$ away from
 $\Delta y \Delta z$ when the total acoustic energy spreads isotropically. On this basis, we define the weight of the link between nodes as (2.6), where
 $w_{ij}$ represents the mean energy flux between
 $I_{ij}$ and
 $I_{ji}$
 \begin{equation} w_{ij}=\dfrac{1}{2}\left(I_{ij}+I_{ji}\right). \end{equation}
We construct three networks consisting of weighted adjacent matrices:  $\boldsymbol{\mathsf{A}}_\pm, \boldsymbol{\mathsf{A}}_+$ and
 $\boldsymbol{\mathsf{A}}_-$. All the nodes except for
 $i=j$ are connected in the first network. The nodes in the second network (third network) are connected when
 ${\varPhi }(\boldsymbol {y}_i)>0$ (
 ${\varPhi }(\boldsymbol {y}_i)<0$), corresponding to the amplification (attenuation) of acoustic energy. We estimate the node strengths
 $s_{\pm,i}$,
 $s_{+,i}$, and
 $s_{-,i}$ as follows:
 \begin{gather} {\mathsf{A}}_{{\pm},ij} = \begin{cases} w_{ij}, & \mathrm{if}\ i \ne j, \\ 0, & \mathrm{otherwise}. \end{cases} \end{gather}
 \begin{gather}{\mathsf{A}}_{+,ij} = \begin{cases} w_{ij}, & \mathrm{if}\, {\varPhi}(\boldsymbol{y}_i)>0 \ \mathrm{and}\ {\varPhi}(\boldsymbol{y}_j)>0 \ (i \ne j), \\ 0, & \mathrm{otherwise}. \end{cases} \end{gather}
 \begin{gather}{\mathsf{A}}_{-,ij} = \begin{cases} w_{ij}, & \mathrm{if}\ {\varPhi}(\boldsymbol{y}_i)<0 \ \mathrm{and}\ {\varPhi}(\boldsymbol{y}_j)<0 \ (i \ne j),\\ 0, & \mathrm{otherwise}. \end{cases} \end{gather}
 \begin{gather}s_{i}=\sum_{j=1}^N {\mathsf{A}}_{ji}. \end{gather}
Here,  $N$ is the number of nodes and
 $N=19\,360$ in this study.
2.3. Community detection
Murayama et al. (Reference Murayama, Kinugawa, Tokuda and Gotoda2018) have recently extracted the community in the turbulent network during intermediate-frequency combustion instability in a swirl-stabilized combustor by the Louvain method based on modularity optimization (Blondel et al. Reference Blondel, Guillaume, Lambiotte and Lefebvre2008; Jeub et al. Reference Jeub, Bazzi, Jutla and Mucha2011–2019). In this study, we adopt the Louvain method for the acoustic energy flux-based spatial network. Newman (Reference Newman2004) proposed the modularity  $Q$ as an important index of the division accuracy of a community. We extract the community by computing the gain
 $\Delta Q$ obtained by moving an isolated node
 $i$ into community
 $C_{a,k}$ as
 \begin{gather} Q=\frac{1}{2m}\sum_{i=1}^N \sum_{j=1}^N \left({\mathsf{A}}_{ij}-\frac{s_is_j}{2m}\right) \delta(c_{a,i},c_{a,j}). \end{gather}
 \begin{gather} \Delta Q=\left[\frac{\varSigma_{in}+2s_{i,in}}{2m}-\left(\frac{\varSigma_{tot}+s_i}{2m}\right)^2 \right] -\left[\frac{\varSigma_{in}}{2m}-\left(\frac{\varSigma_{tot}}{2m}\right)^2-\left(\frac{s_i}{2m}\right)^2 \right]. \end{gather}
Here,  $m$ is the sum of the weights of all links in the network (
 $=\tfrac {1}{2}\sum _{i=1}^N s_{i}$),
 $\varSigma _{in}$ is the sum of the weights of the links inside
 $C_{a,k}$,
 $\varSigma _{tot}$ is the sum of the weights of the links incident to the nodes in
 $C_{a,k}$,
 $s_{i,in}$ is the sum of the weights of the links from node
 $i$ to other nodes in
 $C_{a,k}$ and
 $\delta (c_{a,i},c_{a,j})$ is the Kronecker delta. A suitable total number of communities is determined so as to maximize the modularity (
 $Q$ becomes maximum when the sign of
 $\Delta Q$ changes from positive to negative).
Guimerà & Amaral (Reference Guimerà and Amaral2005) proposed the  $P$–
 $Z$ map as a useful tool for understanding the structure of complex networks. Meena & Taira (Reference Meena and Taira2021) studied the spatio-temporal dynamics of the vortical structure by examining the
 $P$–
 $Z$ map of the turbulence network. In this study, we adopt the
 $P$–
 $Z$ map for the acoustic energy flux-based spatial network. We first define
 $s_{i,k}$ at node
 $i$ as the sum of the weights of the links adjacent to the nodes in community
 $C_{a,k}$
 \begin{equation} s_{i,k}=\sum_{j=1,c_j\in \hat{C}_{a,k}}^N \!{\mathsf{A}}_{ji}. \end{equation}
Here,  $c_{a,i}$ is the community to which node
 $i$ belongs and
 $\hat {C}_{a,k}$ is the set of communities
 $k$. The participation coefficient
 $P_{i}$ and the within-community degree z-score
 $Z_{i}$ are respectively given by (2.14) and (2.15), where
 $\langle {s}_{i,c_{a,i}} \rangle$ (
 $\sigma _{s_{i,c_{a,i}}}$) is the mean value (standard deviation) of
 $s_{i,c_{a,i}}$
 \begin{gather} P_{i}=1-\sum_{k=1}^{N_c}\left(\dfrac{s_{i,k}}{s_{i}}\right)^2. \end{gather}
 \begin{gather} Z_{i}=\dfrac{s_{i,c_{a,i}}-\langle {s}_{i,c_{a,i}} \rangle}{\sigma_{s_{i,c_{a,i}}}}. \end{gather}
Here,  $N_c$ is the total number of communities and
 $Z_{i}$ represents the degree of connection between node
 $i$ and other nodes in the same community. When
 $Z_{i}$ takes a high value, node
 $i$ is strongly connected with other nodes and becomes the hub in the community. As
 $P_{i}$ takes a high value, a node is homogeneously connected with all the nodes in the community. Note that
 $0\le P_{i}\le 1$.
2.4. Spectral clustering
Spectral clustering (Newman Reference Newman2006; Von Luxburg Reference Von Luxburg2007) is a useful unsupervised machine learning method and is performed by applying the  $k$-means method to the eigenvectors of the Laplacian matrix in complex networks. In this study, we first construct a three-dimensional plane consisting of the pressure and flow velocity of the hydrogen jet at the injector exit, and the temperature near the injector rim. The latent space with
 $K$ clusters is obtained by applying the spectral-clustering method and the Gaussian kernel transformation to the three-dimensional plane. We finally obtain a transition network of clusters from the latent space. The value of
 $K$ is set to 12 in this study (see Appendix A).
3. Results and discussion
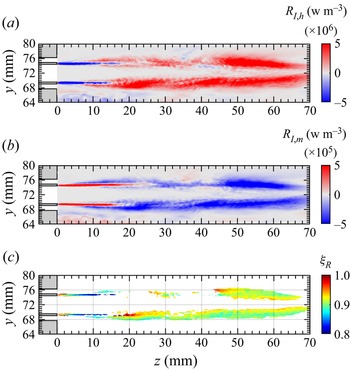
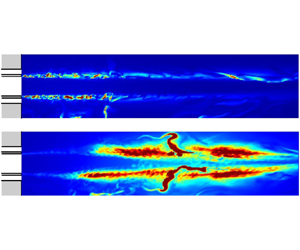
Figure 2 shows the spatial distributions of  $R_{I,h}$,
 $R_{I,m}$ and
 $\xi _R$ during high-frequency combustion instability at
 $30\, {\rm ms} \le t\le 40\,{\rm ms}$. The value of
 $R_{I,h}$ is larger than zero along the shear layer region between the hydrogen and oxygen jets, revealing the driving region of combustion instability as a result of the production of acoustic energy due to the strong mutual coupling between the pressure and heat release rate fluctuations. In contrast,
 $R_{I,m}$ is less than zero along the shear layer region, indicating that the mutual coupling between the molecular production and pressure fluctuations attenuates combustion instability. The value of
 $\xi _R$ is approximately 0.9, which shows that the molecular production term contributes to the decrease in acoustic energy that originates from the heat release rate term and
 $\xi _R$ also decreases in the radial direction. This means that the attenuation of the acoustic energy due to molecular production is greater in the hydrogen jet region than in the oxygen jet region. The damping effect on high-frequency combustion instability (approximately 10 % with respect to the heat release rate term) is non-negligible for inferring the driving region of high-frequency combustion instability, which supports the importance of the molecular production term explained by Lieuwen (Reference Lieuwen2012). These results demonstrate that the local Rayleigh index ratio consisting of the heat release rate and molecular production terms is significant for inferring the driving region of high-frequency combustion instability in a model rocket combustor with a hydrogen/oxygen injector.
Spatial distributions of local Rayleigh indices (a)  $R_{I,h}$ based on the heat release rate term, (b)
 $R_{I,m}$ based on the molecular production term and (c) local Rayleigh index ratio
 $\xi _R$ during high-frequency combustion instability at
 $30\, \mathrm {ms} \le t \le 40\,\mathrm {ms}$.

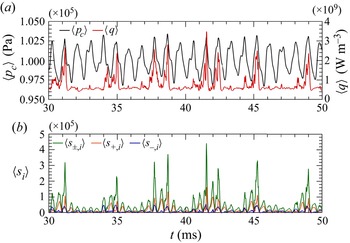
Figure 3 shows the time variation in the spatially averaged pressure fluctuations  $\langle p_c \rangle$, heat release rate fluctuations
 $\langle q \rangle$ and node strengths
 $\langle s_{\pm,i} \rangle$,
 $\langle s_{+,i} \rangle$ and
 $\langle s_{-,i} \rangle$ during high-frequency combustion instability in the ranges of
 $x = 0\,{\rm mm}$,
 $64\,{\rm mm} \leq y \leq 80\,{\rm mm}$ and
 $0\,{\rm mm} < z \leq 70\,{\rm mm}$. We observe that
 $\langle p_c \rangle$ fluctuates periodically, whereas
 $\langle q \rangle$ exhibits intermittent fluctuations responding to the attachment and detachment of the flame edge from the injector rim. Node strength
 $\langle s_{\pm,i} \rangle$ exhibits periodic fluctuations with half the period of
 $\langle p_c \rangle$ and increases when
 $\langle p_c \rangle$ takes the local value, and
 $\langle s_{\pm,i} \rangle$ markedly increases when
 $\langle q \rangle$ changes owing to the detachment of the flame edge. An important point to emphasize here is that
 $\langle s_{+,i} \rangle$ is considerably larger than
 $\langle s_{-,i} \rangle$ when
 $\langle p_c \rangle$ takes the local minimum owing to the detachment of the flame edge. These results show that the acoustic energy production is promoted when the flame edge is detached from the injector rim, resulting in the retention of combustion instability. The spatial distributions of
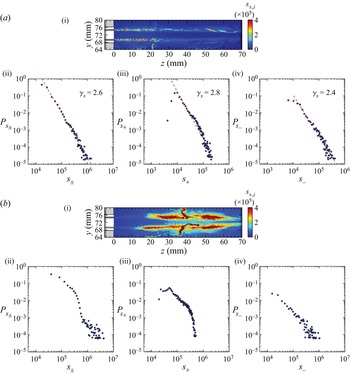
 $s_{\pm,i}$ are shown in figure 4, together with the probability distributions of the node strengths
 $P_{s_\pm }$,
 $P_{s_{+}}$ and
 $P_{s_{-}}$. The nodes with high strength are distributed along the shear layer region at
 $t = 32.55\, \mathrm {ms}$. The coefficients of determination
 $R^2$ for
 $P_{s_\pm }$,
 $P_{s_{+}}$ and
 $P_{s_{-}}$ exceed 0.9. The scale-free nature appears for all the probability distributions of the node strength. The scaling exponents
 $\gamma _s$ for
 $P_{s_\pm }$,
 $P_{s_{+}}$ and
 $P_{s_{-}}$ are 2.6, 2.8 and 2.4, respectively, which show that the existing probabilities of the hub are almost the same. This means that the acoustic production and damping sources are equally formed when the flame edge is attached to the injector rim. In contrast, the scale-free nature of
 $P_{s_\pm }$,
 $P_{s_{+}}$ and
 $P_{s_{-}}$ collapses at
 $t$ = 38.25
 $\mathrm {ms}$. An important observation is the expansion of the formation region of the nodes with high strength, including the emergence of a large-scale primary hub. This means that the formation of a large-scale acoustic energy source drives combustion instability when the flame edge is detached. The results shown in figures 3 and 4 indicate that the acoustic energy flux-based spatial network proposed in this study enables the production of the acoustic energy source with accompanying intermittent heat release rate fluctuations to be captured. In this paper, we have presented the spatial distributions of the local Rayleigh indices
 $R_{I,h}$,
 $R_{I,m}$ and
 $\xi _R$ during 10 cycles of high-frequency combustion instability to infer the driving region of high-frequency combustion instability. The acoustic energy flux-based spatial network, which enables us to instantaneously extract the acoustic energy source, is superior to the local Rayleigh indices, in the sense that the acoustic energy flux-based spatial network can capture the subtle changes in the acoustic energy source in response to the flame behaviour with fast switching between detachment and attachment on the injector rim. Note that the quantification of the network structure using three node strengths,
 $s_\pm$,
 $s_{+}$ and
 $s_{-}$, which identify both the amplification and attenuation regions of acoustic power, has not been conducted in previous studies on combustion instability.
(a) Time variation in the spatially averaged pressure fluctuations  $\langle {p_c} \rangle$ and heat release rate fluctuations
 $\langle q \rangle$, and (b) time variation in the average node strengths in the acoustic energy flux-based spatial network during high-frequency combustion instability.

(a (i),b (i)) Spatial distributions of the node strengths  $s_{\pm,i}$ and (a (ii–iv),b (ii–iv)) probability distributions of the node strengths
 $P_{s_\pm }$,
 $P_{s_{+}}$ and
 $P_{s_{-}}$ in the acoustic energy flux-based spatial network during high-frequency combustion instability; (a)
 $t = 32.55\,\mathrm {ms}$ and (b)
 $t = 38.25\, \mathrm {ms}$.

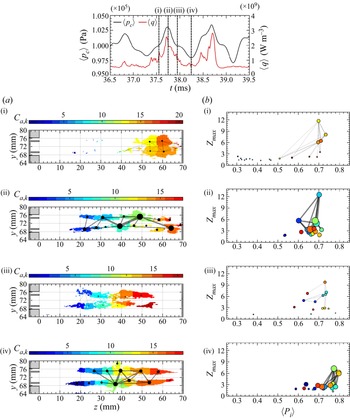
Figure 5 shows the community and the  $P$–
 $Z$ map at the time of attachment of the flame edge to the injector rim. Here,
 $\langle P_i \rangle$
 $(Z_{max})$ is the mean (maximum) of
 $P_i$
 $(Z_i)$ in community
 $C_{a,k}$. The black markers correspond to the centre of
 $C_{a,k}$ and the plot size represents the sum of the node strengths in the community. The width of the grey line represents the degree of connection between the communities. The small communities are formed along the shear layer. The connection between them is strong near the injector rim and weakens downstream. Some communities take high (low)
 $\langle P_i \rangle$ and
 $Z_{max}$ values near the injector rim (downstream). This means that the communities possess a hub near the injector rim, whereas it vanishes downstream with the formation of isolated communities. These results show that the acoustic energy source induced near the injector rim collapses downstream when the flame edge is attached to the injector rim. The community and the
 $P$–
 $Z$ map at the time of detachment of the flame edge from the injector rim is shown in figure 6. Communities appear downstream at
 $t = 37.55\, \mathrm {ms}$. Large communities with strong connection are formed along the shear layer when
 $\langle p_c \rangle$ and
 $\langle q \rangle$ take a local maximum at
 $t = 37.75\, \mathrm {ms}$. The formation of the large communities is attributed to the reignition upstream after the flame edge moves downstream. The connection between the communities weakens at
 $t = 37.95\, \mathrm {ms}$, whereas it strengthens again when
 $\langle p_c \rangle$ and
 $\langle q \rangle$ take a local minimum at
 $t = 38.25\, \mathrm {ms}$. Communities with high
 $Z_{max}$ are formed at
 $t = 37.75\, \mathrm {ms}$ compared with those at
 $t = 38.25\, \mathrm {ms}$, which indicates the appearance of a dominant hub in the communities due to the ignition of the
 ${\rm H}_{2}/{\rm O}_{2}$ flame when the pressure and heat release rate fluctuations take a local maximum. In contrast, communities with high
 $\langle P_i \rangle$ are formed at
 $t = 38.25\, \mathrm {ms}$ compared with those at
 $t = 37.75\, \mathrm {ms}$. This indicates that the movement of the flame edge downstream causes the connection of the communities to strengthen when the pressure and heat release rate fluctuations take a local minimum. High-frequency combustion instability in this study is maintained accompanying the changes in these community structures. The Indian Institute of Technology Madras group and other groups have conducted detailed experimental studies on the emergence and collapse of the clusters in the spatial network during combustion instability in a bluff-body-stabilized combustor (Krishnan et al. Reference Krishnan, Manikandan, Midhun, Reeja, Unni, Sujith, Marwan and Kurths2019a,Reference Krishnan, Sujith, Marwan and Kurthsb) and a model rocket combustor with multiple elements (Kasthuri et al. Reference Kasthuri, Krishnan, Gejji, Anderson, Marwan, Kurths and Sujith2022). One of the authors (Murayama et al. Reference Murayama, Kinugawa, Tokuda and Gotoda2018) has also conducted an experimental study on the formation of a primary hub in a turbulent network during intermediate-frequency combustion instability in a swirl-stabilized turbulent combustor. The community detection using the acoustic energy flux-based spatial network is expected to be helpful for understanding the spatio-temporal characteristics of the clusters and their connections during combustion instability in various combustors, although the flame dynamics depends on the chemical and flow characteristic time scales and configuration of combustors.
(a) Community and (b)  $P$–
 $Z$ map at the time of attachment of the flame edge to the injector rim during high-frequency combustion instability. Here,
 $t = 32.55\, \mathrm {ms}$.

Time variations in (a) community and (b)  $P$–
 $Z$ map at the time of detachment of the flame edge from the injector rim during high-frequency combustion instability; (a (i),b (i))
 $t = 37.55\, \mathrm {ms}$, (a (ii),b (ii))
 $t = 37.75\, \mathrm {ms}$, (a (iii),b (iii))
 $t = 37.95\, \mathrm {ms}$ and (a (iv),b (iv))
 $t = 38.25\,\mathrm {ms}$.

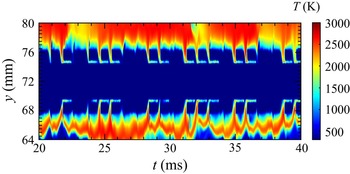
Figure 7 shows the time variation in the temperature  $T$ near the injector exit. Note that the temperature at
 $z = 0.46$ mm is extracted as a representative location. An abrupt increase in
 $T$ is intermittently observed in the range of
 $68 \,{\rm mm} \le y\le 76\, {\rm mm}$, showing the inflow of combustion products into the
 ${\rm H}_{2}$ jet near the injector rim. This is strongly associated with the reignition of the
 ${\rm H}_{2}/{\rm O}_{2}$ mixture. Matsuyama et al. (Reference Matsuyama, Hori, Shimizu, Tachibana, Yoshida and Mizobuchi2016) reported that the decrease in flow velocity at the exit of a
 ${\rm H}_{2}$ injector generates the inflow of combustion products into the injector. Shima et al. (Reference Shima, Nakamura, Gotoda, Ohmichi and Matsuyama2021) have recently clarified that the pressure fluctuations inside a combustor significantly affect the flow velocity fluctuations in the
 ${\rm H}_{2}$ injector. On the basis of these findings, we examine the structure of the spectral-clustering-based transition network constructed from the pressure
 $p_{e}$ at the exit of the
 ${\rm H}_{2}$ injector, the flow velocity
 $w_{e}$ of the
 ${\rm H}_{2}$ jet at the exit of the injector and the temperature
 $T_{r}$ near the injector rim.
Time variation in the temperature  $T$ near the injector exit during high-frequency combustion instability. Here,
 $z = 0.46\,\mathrm {mm}$.

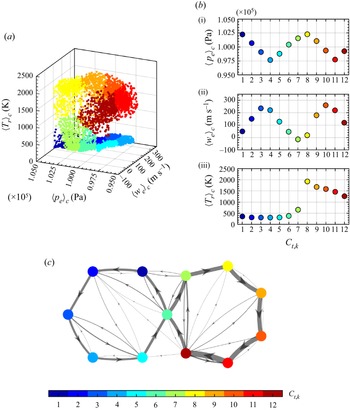
Figure 8 shows the latent space consisting of  $\langle w_{e} \rangle$,
 $\langle p_{e} \rangle$ and
 $\langle T_{r} \rangle$ and the centroid of cluster
 $C_{t,k}$ in the latent space during high-frequency combustion instability, together with the transition network between the clusters. Note that, in this study, we define
 $\langle w_{e} \rangle$,
 $\langle p_{e} \rangle$ and
 $\langle T_{r} \rangle$ as the spatially averaged values of
 $w_{e}$,
 $p_{e}$ and
 $T_{r}$ at (
 $y_1$,
 $z_1$) and (
 $y_2$,
 $z_2$), respectively, where
 $(y_1, z_1) = (68.4\, {\rm mm}, 0.46\,{\rm mm})$ and
 $(y_2, z_2) = (75.6\, {\rm mm}, 0.46\,{\rm mm})$ for
 $\langle w_{e} \rangle$ and
 $\langle p_{e} \rangle$, and
 $(y_1, z_1) = (69.3\, {\rm mm}, 0.46\, {\rm mm})$ and
 $(y_2, z_2) = (74.7\, {\rm mm}, 0.46\, {\rm mm})$ for
 $\langle T_{r} \rangle$. Here,
 $\langle w_{e} \rangle _c$,
 $\langle p_{e} \rangle _c$ and
 $\langle T_{r} \rangle _c$ correspond to the centroid of the cluster, and the width of the grey line in the network represents the transition probability between the clusters. The network exhibits two predominant orbits: (I) cluster
 $1\rightarrow 2\rightarrow 3\rightarrow 4\rightarrow 5\rightarrow 6$ and (II) cluster
 $6\rightarrow 7\rightarrow 8\rightarrow 9\rightarrow 10\rightarrow 11\rightarrow 12$. They are connected to each other at cluster 6. The centre node of the cluster of the temperature
 $\langle T_{r} \rangle _c$ remains unchanged in orbit I, whereas it changes in orbit II. This indicates that cluster 6 corresponds to the critical state of the detached flame edge from the injector rim. We observe that
 $\langle T_{r} \rangle _c$ takes a maximum value at cluster 8. On the basis of the finding shown in figure 7, cluster 8 corresponds to the inflow of combustion products into the
 ${\rm H}_{2}$ jet near the injector rim and the subsequent reignition of the
 ${\rm H}_2/{\rm O}_2$ mixture. An important point is that the trajectory of the cluster bifurcates at cluster 6 and
 $\langle w_{e} \rangle _c$ takes a positive (negative) value at cluster 1 (7). This means that the subtle change in the flow velocity of the
 ${\rm H}_{2}$ jet at the injector exit has a significant impact on the triggering of the bifurcation into the attachment and detachment of the flame edge, and the onset of the intermittent heat release rate fluctuations during high-frequency combustion instability. Note that cluster 6 is the bifurcation point for the sudden switching between the attached and lifted flame edges, but the dynamic behaviour of the pressure does not notably change before and after the bifurcation. These results demonstrate that the spectral-clustering-based transition network is useful for understanding the physical mechanism of high-frequency combustion instability in a model rocket combustor with a hydrogen/oxygen injector.
(a) Latent space consisting of the spatially averaged pressure  $\langle p_{e} \rangle$ at the
 ${\rm H}_{2}$ injector exit, the flow velocity
 $\langle w_{e} \rangle$ of the
 ${\rm H}_{2}$ jet at the injector exit and the temperature
 $\langle T_{r} \rangle$ near the injector rim during high-frequency combustion instability, (b) centroid of cluster
 $C_{t,k}$ in the latent space and (c) spectral-clustering-based transition network.

4. Summary
We have studied the spatio-temporal dynamics of high-frequency combustion instability in a cylindrical combustor with an off-centre-installed coaxial injector related to a  ${\rm H}_2/{\rm O}_2$ rocket combustor from the viewpoint of complex networks and machine learning, focusing mainly on the production of the acoustic energy source. The molecular production induced by combustion reaction affects the attenuation of combustion instability, which is shown by a local Rayleigh index ratio considering both the heat release rate and molecular production terms. The pressure inside the combustor oscillates periodically, whereas the heat release rate exhibits intermittent fluctuations responding to the attachment and detachment of the flame edge from the injector rim. The acoustic energy flux-based spatial network we proposed in this study enables the appearance of the acoustic energy source with accompanying intermittent heat release rate fluctuations to be captured. When the flame edge is attached to the injector rim, nodes with high strength are formed in the upstream region of the shear layer between the oxygen and hydrogen jets, exhibiting a scale-free nature in the strength distribution. The acoustic energy source collapses by the formation of small communities with weak connection. In contrast, when the flame edge is detached from the injector rim, nodes with high strength are widely formed in the downstream region of the shear layer, revealing the loss of the scale-free nature. The formation of large communities with strong connection has a significant impact on driving combustion instability. The switching between the attachment and detachment of the flame edge during combustion instability can be explained by the spectral-clustering-based transition network constructed from the pressure and flow velocity of the hydrogen jet at the injector exit, and the temperature near the injector rim. The two presented analyses: (i) community detection using the acoustic energy flux-based spatial network and (ii) spectral clustering as a form of unsupervised machine learning, are useful for understanding the complex spatio-temporal dynamics of combustion instability.
Declaration of interests
The authors report no conflict of interest.
Appendix A. Class number in the cluster-based transition network
We determine a suitable class number  $K$ in the cluster-based transition network by estimating two cluster coefficients. The weighted cluster coefficients
 $C_{H,i}$ (Holme et al. Reference Holme, Min Park, Kim and Edling2007) and
 $C_{D,i}$ (Fagiolo Reference Fagiolo2007) are defined as (A1) and (A2), respectively,
 \begin{gather} C_{H,i} = \dfrac{\displaystyle\sum_{j=1}^{N_t}\sum_{k=1}^{N_t}{\mathsf{A}}^{*}_{t,ij}{\mathsf{A}}^{*}_{t,jk}{\mathsf{A}}^{*}_{t,ki}}{\mathrm{max}({\boldsymbol{\mathsf{A}}^{\boldsymbol{*}}_{\boldsymbol{t}}}) \displaystyle\sum_{j=1}^{N_t}\sum_{k=1}^{N_t}{\mathsf{A}}^{*}_{t,ij}{\mathsf{A}}^{*}_{t,ki}}, \end{gather}
 \begin{gather} C_{D,i} =\dfrac{\displaystyle\sum_{j=1}^{N_t} \sum_{k=1}^{N_t}\left({\mathsf{A}}_{t,ij}+{\mathsf{A}}_{t,ji} \right) \left({\mathsf{A}}_{t,jk}+{\mathsf{A}}_{t,kj} \right) \left({\mathsf{A}}_{t,ki}+{\mathsf{A}}_{t,ik} \right)}{2 \left[\displaystyle\sum_{j=1}^{N_t}\left({\mathsf{A}}_{t,ij}+{\mathsf{A}}_{t,ji} \right) \left\{\sum_{j=1}^{N_t} \left({\mathsf{A}}_{t,ij}+{\mathsf{A}}_{t,ji} \right) -1 \right\} -2 \sum_{j=1}^{N_t} \left({\mathsf{A}}_{t,ij} {\mathsf{A}}_{t,ji} \right) \right]}. \end{gather}
Here,  ${\boldsymbol{\mathsf{A}}_{\boldsymbol{t}}}$ is the directed-adjacent matrix of the transition network, and
 ${\boldsymbol{\mathsf{A}}^{\boldsymbol{*}}_{\boldsymbol{t}}} (= \frac {1}{2}({\boldsymbol{\mathsf{A}}_{t}} + {\boldsymbol{\mathsf{A}}^{T}_t}))$ is the undirected-adjacent matrix. The value of
 $N_t$ is set to 5000 in this study.
Figure 9 shows the variations in the average cluster coefficients  $\langle C_{H,i} \rangle$ and
 $\langle C_{D,i} \rangle$ as a function of
 $K$ during high-frequency combustion instability. The value of
 $\langle C_{H,i} \rangle$ and
 $\langle C_{D,i} \rangle$ are nearly unchanged when
 $K$ exceeds approximately 12. The latent space obtained by the spectral-clustering method can be appropriately divided into clusters in the transition network at
 $K \ge 12$. On this basis, we set
 $K$ to 12 in this study.
Variations in the average cluster coefficients  $\langle C_{H,i} \rangle$ and
 $\langle C_{D,i} \rangle$ as a function of the class number
 $K$ during high-frequency combustion instability.