


Introduction
Decades of public opinion research have taught us that only a small fraction of the population exhibits levels of attitude consistency compatible with ideological accounts of opinion formation. Whereas members of political elites have highly structured political attitudes following left-right (liberal-conservative) lines, the mass population does not. Instead of stable and internally coherent attitudes, most citizens possess nonattitudes that ebb and flow with the mood of the time (Converse Reference Converse and Apter1964; Reference Converse and Tufte1970; Kinder and Kalmoe Reference Kinder and Kalmoe2017; Norpoth and Lodge Reference Norpoth and Lodge1985; Sturgis and Smith Reference Sturgis and Smith2010; Zaller Reference Zaller1992).
However, two lines of work have challenged or at least nuanced the nonattitudes claim. First, when measurement error of the survey instrument is addressed, attitudes appear substantially more structured (Achen Reference Achen1975; Ansolabehere, Rodden, and Snyder Reference Ansolabehere, Rodden and Snyder2008; Feldman Reference Feldman1989). So, although mass attitudes are not as ordered as democratic theory might prescribe, they are not completely random either. Second, political socialization studies have established that attitude consistency is not fixed but varies across the life span. As the adolescent is exposed to formative political events, attitudes crystallize until they reach a plateau in midlife (Jennings Reference Jennings, Jennings and van Deth1989; Sears and Funk Reference Sears and Funk1999; Visser and Krosnick Reference Visser and Krosnick1998). What these findings highlight is the key role that political events play in structuring political beliefs.
Drawing on this last strand of research on how political events socialize preadults, in this article I study how events promote ideological coherence among the public in general. I develop an event-based explanation of how attitude consistency responds to regular political events even among the well-socialized adult population. Integrating research on socialization gains of political events with theory on resistance to persuasion, I argue that when elections tip the balance of power in favor of ideological opponents, they increase the salience of left-right positions and mobilize a defense for ideological principles, inducing more structured attitudes.
I test the event-based theory by analyzing how crystallization of welfare state attitudes in Denmark depends on municipal elections. I focus specifically on attitude consistency within the highly salient issue domain of welfare politics, because not only is this domain core to the left-right divide and important to many citizens (Ellis and Stimson Reference Ellis and Stimson2012; Mair Reference Mair, Dalton and Klingemann2007); it is also fundamental to partisan conflict, not least in Denmark (Kosiara-Pedersen and Kurrild-Klitgaard Reference Kosiara-Pedersen, Kurrild-Klitgaard and Lisi2019; Slothuus and de Vreese Reference Slothuus and de Vreese2010). Thus, this attitude domain is critical to my theoretical account linking party politics and individual political reasoning. However, to probe the scope of the findings, I will examine other issues as well. Danish local politics offers a good test case because Danish municipalities are important political units with extensive fiscal and political responsibility and the local party system resembles the national one (Blom-Hansen and Heeager Reference Blom-Hansen, Heeager, Hendriks, Lidström and Loughlin2010; Elklit and Kjær Reference Elklit, Kjær, Elklit and Kjær2013a). At the same time, the level of ideological polarization is more moderate compared with that of national politics (Serritzlew, Skjæveland, and Blom-Hansen Reference Serritzlew, Skjæveland and Blom-Hansen2008), thereby making it a conservative test.
Empirically, I pool a large number of national surveys from the period 1991–2015, linking those to data on local elections in the same period. I adopt a regression discontinuity design (RDD) to provide a credible causal identification strategy. The RDD addresses selection issues of nonrandom settlement and electoral outcomes by comparing survey respondents living in municipalities in which right-wing parties barely won a majority in the last election with respondents living in municipalities in which they barely lost (and likewise for left-wing parties), making it possible to attribute differences in crystallization to differences in the political majority. This analytical strategy represents an advance in the study of event-based political socialization and considerably strengthens the potential for drawing causal inference.
Consistent with the event-based explanation, I find that exposure to a political majority with a divergent ideological position increases consistency in interrelated welfare attitudes among leftists as well as rightists. The study contributes to public opinion research by showing that the level of attitude constraint is malleable, depending on recurrent political events, and to political socialization research by demonstrating that crystallization of attitudes does not end when people come of age but continues throughout life.
Thinking Ideologically about the Welfare State
Welfare policies shape citizens’ lives in important ways and are in turn influenced by public opinion (Page and Shapiro Reference Page and Shapiro1983; Wright, Erikson, and McIver Reference Wright, Erikson and McIver1987). When evaluating the welfare state, citizens commonly rely on ideological predispositions. Defining the left-right divide as a matter of preference for social change and equality versus the status quo, Jost and colleagues (Jost Reference Jost2006; Jost, Federico, and Napier Reference Jost, Federico and Napier2009; Jost, Nosek, and Gosling Reference Jost, Nosek and Gosling2008) show that self-declared leftists systematically embrace equalitarian social policies, whereas people of right-wing orientation prefer policies that lead to or sustain economic and social inequalities. In a similar vein, Sears et al. (Reference Sears, Lau, Tyler and Allen1980) find that whereas measures of self-interest typically matter little, “symbolic attitudes,” including liberal-conservative ideology, are consequential in forming support for, among other things, guaranteed jobs and national health insurance as well as for presidential voting (see also Sears and Citrin Reference Sears and Citrin1982).
Despite these findings, evidence of consistent ideological reasoning across issues is more scant. Converse (Reference Converse and Apter1964, 207) distinguishes ideological from nonideological thinking by the fact that attitudes “are bound together by some form of constraint or functional interdependence” (emphasis added). In his seminal works, Converse (Reference Converse and Apter1964; Reference Converse and Tufte1970) concluded that most people do not have constrained and stable political attitudes following the left-right scale toward either domestic or foreign policy issues. Instead, they display what Converse termed nonattitudes—that is, attitudes that fluctuate almost randomly (see also Campbell et al. Reference Campbell, Converse, Miller and Stokes1960, 188–215). Although these conclusions have been disputed (Achen Reference Achen1975; Ansolabehere, Rodden, and Snyder Reference Ansolabehere, Rodden and Snyder2008; Azevedo et al. Reference Azevedo, Jost, Rothmund and Sterling2019; Jost Reference Jost2006), the impression remains that citizens in general lack consistent political attitudes (see Freeder, Lenz, and Turney Reference Freeder, Lenz and Turney2018; Kalmoe Reference Kalmoe2020; Kinder and Kalmoe Reference Kinder and Kalmoe2017; Sturgis and Smith Reference Sturgis and Smith2010).
Political Events and Attitude Crystallization
Public opinion research’s preoccupation with the level of constraint in the mass population at a given point should not lead us to conclude that attitude consistency is static. As Nie and Andersen (Reference Nie and Andersen1974) show using US data, aggregate consistency levels have varied quite a lot over time. What is more, there is evidence that individual consistency changes over the life course. We know from research on political socialization that how rooted attitudes are in terms of stability and resistance to change—what is known as attitude crystallization (Sears Reference Sears, Greenstein and Polsby1975, 121–123)—is a matter of life experiences. As social interactions contribute to shaping world views, and involvement in politics accumulates, attitudes gradually crystallize and become more resilient to change—that is, they approach “real” attitudes (Henry and Sears Reference Henry and Sears2009; Jennings Reference Jennings, Jennings and van Deth1989; Sears and Funk Reference Sears and Funk1999; Visser and Krosnick Reference Visser and Krosnick1998).
Central to these findings is an experiential or event-driven explanation of attitude structure: The fact that attitudes crystallize when the adolescent enters adulthood is not merely a result of maturation or cognitive development fostering logical thinking. Rather, it reflects that the person is especially impressionable in this early life stage (Sears Reference Sears, Greenstein and Polsby1975) when exposed to formative events in, for instance, the educational, political, or military system (Erikson and Stoker Reference Erikson and Stoker2011; Jennings Reference Jennings, Jennings and van Deth1989; Sears and Valentino Reference Sears and Valentino1997; Valentino and Sears Reference Valentino and Sears1998).
However, how political events have socialization effects throughout life beyond the formative years is still not very well understood. We know that extraordinary events with high political significance, for instance, terrorist attacks (Kam and Kinder Reference Kam and Kinder2007; Legewie Reference Legewie2013) and economic crises (Kam and Nam Reference Kam and Nam2008; Margalit Reference Margalit2013), can shift public opinion rather dramatically. But how episodic instances of politics influence the structuring of political thoughts has not been studied as intensively. Why is this interesting? Albeit not necessarily being as potent as formative events or wide-ranging political shocks, the regularity and inclusiveness of these events may make them empirically very important.
The question of how regularly occurring political events shape attitudes has, however, not been totally ignored. Sears and Valentino (Reference Sears and Valentino1997) and Valentino and Sears (Reference Valentino and Sears1998) find that presidential campaigns increase political knowledge and the stability of partisanship among preadults but matter only marginally for the organization of adults’ political attitudes. Whereas Sears and Valentino are interested in the crystallization effect of campaigns, my focus is on what follows after in terms of electoral outcomes. In the following section, I argue why and how this facet of elections might in fact foster increased attitude consistency among the adult population in terms of stronger ideological constraint.
A Theory of Event-Based Ideological Crystallization
The fact that events contribute to the development of attitudes of preadults suggests that they may also be of relevance to the attitude structure of adults. Whereas preadults are more open to political influence due to low levels of experience, adults have a larger reservoir of political inclinations that might be triggered by salient political events. From political and social psychology, we know that situational factors and focusing events can activate deep-seated individual predispositions, such as ethnocentrism (Kam and Kinder Reference Kam and Kinder2007), authoritarianism (Feldman and Stenner Reference Feldman and Stenner1997), and anxiety (Brader, Valentino, and Suhay Reference Brader, Valentino and Suhay2008), by making certain considerations more cognitively accessible.
Based on this, it is my claim that we can learn something important about the dynamics of mass ideology if we study the regular events to which most people are exposed. The quintessential event in a democracy, which mobilizes large sections of society, is elections. How might elections increase ideological coherence? Informed by theoretical work on the psychology of resistance to persuasion (Brehm and Brehm Reference Brehm and Brehm1981; Knowles and Linn Reference Knowles and Linn2004; Petty and Cacioppo Reference Petty and Cacioppo1977; Reference Cacioppo and Petty1979; Taber and Lodge Reference Taber and Lodge2006), my argument is that elections transform merely latent predispositions into active ideological thinking (Jost Reference Jost2006, 653; Kalmoe Reference Kalmoe2020, 6) by producing winners and losers. Particularly, I theorize that electoral outcomes that give ideological opponents a majority serve as focal points that lead to attitude crystallization in accordance with ideological predispositions. Two mechanisms may account for this.
First, an election that produces a majority detrimental to what the individual believes in places the individual in a political minority situation. This situation is likely to generate a contrast effect (Dawes, Singer, and Lemons Reference Dawes, Singer and Lemons1972; Hovland, Harvey, and Sherif Reference Hovland, Harvey and Sherif1957; Schwarz and Bless Reference Schwarz, Bless, Martin and Tesser1992) by which the individual’s ideological position stands out more clearly because it deviates from the dominating views in the political environment. Clarifying such individuals’ political values through confrontation with divergent views on a mass scale should increase the salience of politics and ideological differences. This, in turn, should push these individuals toward clinging more strongly to their attitudes and being more consistent (Nie and Andersen Reference Nie and Andersen1974).
Second, belonging to the political minority puts—at least cognitive but potentially also social—pressure on these individuals to justify their stance. Following cognitive response models (Cacioppo and Petty Reference Cacioppo and Petty1979; Greenwald Reference Greenwald, Greenwald, Brock and Ostrom1968; Petty and Cacioppo Reference Petty and Cacioppo1979) as well as research on motivated reasoning (Redlawsk Reference Redlawsk2002; Taber, Cann, and Kucsova Reference Taber, Cann and Kucsova2009; Taber and Lodge Reference Taber and Lodge2006), the feeling that ideological principles are threatened will likely trigger a cognitive defense and a firmer commitment to the principles, causing the individual to think more deeply about the reasons why they make sense, ultimately to be able to counter the arguments of others (see also Brehm and Brehm Reference Brehm and Brehm1981). To persuade others effectively, one should be familiar with the basic rationales for the principles and understand how they relate to each other. By implication, a motivation to process issue-relevant information and to cultivate an ability to consistently explicate why one is right and others are wrong should be stronger when the individual is part of the political minority. I will term this the mobilization effect.
Given that elite transmission is often what binds the attitudes of the public together (Converse Reference Converse and Apter1964, 209–213), elite cues are likely to facilitate these two processes. In particular, in a competitive electoral environment where divergent positions are clarified through intensive communication, elite actors can help individuals connect their ideological position with specific stances on issues, thus strengthening consistency (Druckman, Peterson, and Slothuus Reference Druckman, Peterson and Slothuus2013; Levendusky Reference Levendusky2010; Petersen, Slothuus, and Togeby Reference Petersen, Slothuus and Togeby2010). Building on the argument outlined above, individuals might be especially receptive to these cues and find them extra useful when being on the losing side because of enhanced political awareness.
Regardless of the precise mechanism at play, exposure to an ideologically divergent majority should lead to greater consistency of interrelated attitudes—that is, be a catalyst of attitude crystallization.
Danish Local Elections
To test the theoretical propositions, I study how municipal elections influence welfare attitude consistency in Denmark during the period 1991–2015. Before a major reform in 2007, Denmark was divided into 271 municipalities. The reform led to an amalgamation of most but not all municipalities, resulting in a total of 98 local governments, which are still in place today. The average population size of the municipalities over the entire period is 25,584 (19,325 in 1991–2006, and 56,688 in 2007–2015).Footnote 1 The Danish municipalities are politically and fiscally highly significant in the sense that they account for around 50% of public expenditures, enjoy extensive autonomy, and have the responsibility for several major policy domains, such as elementary schools and elderly care. Decisions, including adoption of the yearly budget, are made by a majority in the municipal council, which consists of 9–55 members that are elected by fixed-term elections every fourth year. The electoral system is proportional, and the party system resembles the national one in terms of party representation and conflict lines (Blom-Hansen and Heeager Reference Blom-Hansen, Heeager, Hendriks, Lidström and Loughlin2010; Elklit and Kjær Reference Elklit, Kjær, Elklit and Kjær2013a).
Zooming in on Danish local politics to assess the crystallization effect of elections is desirable in terms of both external and internal validity. Regarding external validity, compared with a national political context, this is arguably a “least likely case,” thus facilitating a broader generalization if the argument is supported by the data. First, although not being genuine second-order elections (Kjær and Steyvers Reference Kjær, Steyvers, Elklit, Elmelund–Præstekær and Kjær2017), Danish local elections are less salient than national ones: Political interest and turnout are lower (Frandsen Reference Frandsen, Elklit and Jensen1997; Levinsen Reference Levinsen, Kjær and Mouritzen2003; Mouritzen Reference Mouritzen, Elklit and Jensen1997), voters decide later what to vote (Frandsen Reference Frandsen, Elklit and Jensen1997), and media coverage is less intense (Jensen and Frandsen Reference Frandsen, Elklit and Jensen1997). Despite this, Danes are comparatively very well informed about municipal politics (Elmelund-Præstekær and Skovsgaard Reference Elmelund-Præstekær, Skovsgaard, Elklit, Elmelund-Præstekær and Kjær2017; Pedersen Reference Pedersen, Kjær and Mouritzen2003), making it plausible that they will after all pay attention to shifts in the political majority. Second, although parties do compete along the same lines as their national counterparts, party politics is ideologically polarized to a lesser extent mainly because of norms of consensus and pragmatism (Serritzlew, Skjæveland, and Blom-Hansen Reference Serritzlew, Skjæveland and Blom-Hansen2008). For these reasons, if Danish municipal elections can mobilize ideological predispositions, it is highly plausible that the theory has broader relevance.
Regarding internal validity, cross-municipal variation in election results is well suited to gauge the causal effect of divergent political majorities on attitude consistency. Cross-country comparisons are less attractive due to sparse variation in the majority situation and risk of country-specific confounding. Turning to the local level and using only within-country variation, all country-specific factors are held constant. More importantly, this setup allows me to focus on elections in which one or the other side won the majority by a small margin. For this purpose, I will use an RDD that enables me to compare attitude consistency of people under different majorities while addressing potential sources of bias. After describing the data, I will explain in detail how the research design allows a causal interpretation of the results.
Data and Measures
I link 11 Danish surveys (1991–2015), amounting to approximately 24,000 respondents aged 15 or older, with official records on every municipal election during the period 1989–2013 from Statistics Denmark.Footnote 2 Three surveys do not contain a municipality identifier. Here, I use zip code of residence to assign respondents to the municipality in which the largest proportion of the zip code’s inhabitants lives, requiring that more than 80% of zip code inhabitants are inhabitants in the municipality (for a similar approach, see Hjorth Reference Hjorth2020). Substantively similar results are obtained if a perfect match is required instead (see Figure I.1 in the online supplementary material). This rich dataset provides the statistical power and variation in electoral results necessary to make the RDD a viable causal identification strategy.
Left-right self-placement is used to divide respondents into leftists, rightists, and centrists.Footnote 3 As a percentage of all providing a substantive answer in the final data, these groups make up 34, 46, and 20% of the sample, respectively. It should be kept in mind that left-right self-placement is a measure of symbolic ideology, not per se a measure of specific policy preferences (Conover and Feldman Reference Conover and Feldman1981; Ellis and Stimson Reference Ellis and Stimson2012). However, it is my expectation that this broad left-right distinction does tap into systematic differences in political predispositions that structure political attitudes and reactions to local political majorities. The analysis will shed light on these questions.
As the operational part of ideology (Ellis and Stimson Reference Ellis and Stimson2012), attitude consistency is estimated as the correlation between attitudes toward the two main functional components of welfare politics: redistribution and social insurance (Alesina and Giuliano Reference Alesina, Giuliano, Benhabib, Bisin and Jackson2011, 96; Margalit Reference Margalit2013, 82). Unfortunately, as question wording varies somewhat from survey to survey, it is not feasible to measure these concepts in the exact same way over the 25-year period.Footnote 4 Although this may make the estimates slightly noisier, for this measurement problem to cause bias in the causal estimates, differential measurement error needs to be systematically related to the majority status, which is unlikely due to the research design described below.
In most surveys, support for redistribution is measured using the following statement, “In politics, one should strive to provide all people with the same economic conditions, regardless of education and employment” (from “totally agree” to “totally disagree”). I operationalize attitudes toward social insurance in terms of the trade-off between welfare spending and tax cuts. The most frequently used question is, “If, in the long term, it becomes possible to cut taxes, what would you prefer: A: Lower taxes or B: Improved public service?” The two variables are normalized to a 0–1 range with 1 indicating the most left-wing standpoint (wanting more redistribution and more welfare spending). Thus, a stronger positive correlation between the variables is taken as evidence of more consistent welfare attitudes. To investigate the scope of the findings, I also rely on two more specific welfare issues—namely, spending on unemployment benefits and the generosity of social transfers—and include items of cultural issues.Footnote 5
Local majorities are obtained by dividing the local parties into a left- and right-wing bloc and then summating their seat shares. The left-wing bloc—or red bloc, as it is known in Denmark—includes the Social Democrats, the Social Liberal Party, Socialist People’s Party, the Red-Green Alliance, and the Alternative. The right-wing bloc (or blue bloc) consists of the Liberal Party, the Conservatives, Progress Party, Danish People’s Party, Liberal Alliance, and the New Right.Footnote 6 This classification reflects the bipartisan nature of the Danish multiparty system in terms of both coalition patterns and issue positions and follows the conventional ordering of the parties (Damgaard Reference Damgaard, Müller and Strøm2000; Kosiara-Pedersen and Kurrild-Klitgaard Reference Kosiara-Pedersen, Kurrild-Klitgaard and Lisi2019; Kurrild-Klitgaard, Klemmensen, and Pedersen Reference Kurrild-Klitgaard, Klemmensen, Pedersen, Kosiara-Pedersen and Kurrild-Klitgaard2008). At the local level, this ideological divide manifests itself in how coalitions are formed and mayors are appointed (Elklit, Hansen, and Klemmensen Reference Elklit, Hansen, Klemmensen, Elklit, Elmelund–Præstekær and Kjær2017; Elklit and Kjær Reference Elklit, Kjær, Elklit and Kjær2013b) and in how the local politicians themselves place the parties on the left-right scale and economic issues (Blom-Hansen, Serritzlew, and Skjæveland Reference Blom-Hansen, Serritzlew and Skjæveland2004). In fact, evidence suggests that the minimal connected winning coalition model is an accurate description of coalition formation in Danish local politics (Elklit, Hansen, and Klemmensen Reference Elklit, Hansen, Klemmensen, Elklit, Elmelund–Præstekær and Kjær2017). This is not to say that only proximate parties cooperate. As mentioned above, consensus norms are strong in Danish local politics. What it does imply, though, is that as parties in the same bloc generally share policy priorities and values, when voters give these parties a majority, this is a signal about what the local community stands for. It is also a signal about what the municipality should target, and research indicates that municipal policy choices do to some extent depend on mass opinions and the ideological leaning of the city council and the mayor (de Benedictis-Kessner and Warshaw Reference de Benedictis-Kessner and Warshaw2016; Mouritzen Reference Mouritzen1990; Pettersson-Lidbom Reference Pettersson-Lidbom2008; Tausanovitch and Warshaw Reference Tausanovitch and Warshaw2014). The point is that a local majority might mobilize an ideological reaction among citizens holding other political beliefs, even if the parties do to varying degrees cooperate across ideological lines.
The variable for right-wing majority takes the value “1” when right-wing parties control more than 50% of the seats. Otherwise, it is “0.” Similarly, left-wing majority equals “1” when the left-wing bloc controls more than 50% of the seats, and otherwise it is “0.” I use separate variables for right-wing and left-wing majority because not all parties are defined as either left- or right-wing. Not included in the blocs as defined here are two small centrist partiesFootnote 7 as well as local lists, which are issue-oriented, typically nonideological local parties running in only one or a few municipalities (Jensen Reference Jensen, Elklit and Jensen1997a).
Research Design
To study how the consistency in leftists’ and rightists’ welfare attitudes depends on local majorities, I draw on the logic of the RDD. Where people live and how they vote is not determined randomly and may be systematically related to consistency levels. For instance, some Danish municipalities, such as Gentofte and Brøndby, are partisan strongholds in the sense that they nearly always elect a right- or left-wing majority. Besides people having a distinct demographic profile in such municipalities, party competition is lower, and we know that party competition is related to attitude consistency (Petersen, Slothuus, and Togeby Reference Petersen, Slothuus and Togeby2010). Thus, simply comparing people in municipalities with a left- or right-wing majority is the naïve approach, which is unlikely to yield sound causal estimates. However, because the selection process is known—majority only depends on seat share and is deterministically assigned at the 50% seat share threshold—we can get causal leverage by statistically modeling the selection and narrowing down the analysis to close elections. This is the premise of the RDD and will be my analytical strategy.
I estimate the following interaction models separately for left-wing, right-wing, and centrist respondents, using OLS:
 $$ \begin{align} Redis\,{=}\,&\alpha +{\beta}_1 Taxwel+{\beta}_2 Ma{j}_{right}+{\beta}_3 Taxwel\;x\; Ma{j}_{right}+{\beta}_4 Ru{n}_{right}\\&+{\beta}_5{Run}_{right}^2+{\beta}_6{Run}_{right}x\;Ma{j}_{right}+{\beta}_7{Run}_{right}^2\;x\; Ma{j}_{right}\\&+\boldsymbol{\beta} \boldsymbol{Cov}+\varepsilon \end{align} $$
 $$\begin{align} Redis\,{=}\,&\alpha +{\beta}_1 Taxwel+{\beta}_2Ma{j}_{left}+{\beta}_3 Taxwel\;x\;Ma{j}_{left}+{\beta}_4{Run}_{left}\\&+{\beta}_5{Run}_{left}^2+{\beta}_6{Run}_{left}\;x\;Ma{j}_{left}+{\beta}_7{Run}_{left}^2\;x\;Ma{j}_{left}+\boldsymbol{\beta} \boldsymbol{Cov}\\&+\varepsilon \end{align}$$
The key parameters here are the coefficients of the two interaction terms
 $ Taxwel\;x\; Ma{j}_{right} $
and
 $ Taxwel\;x\; Ma{j}_{left} $
. These coefficients indicate how a right-wing and left-wing majority change the correlation between redistributive preferences (
 $ Redis $
)—which enter the model as the dependent variable—and tax/welfare attitudes (
 $ Taxwel $
)—which enter the model as an independent variable—relative to a non-right-wing and non-left-wing majority context. Thus, these parameters capture the local average treatment effect (LATE) on attitude consistency at the cutoff.Footnote
8
The running variables
 $ Ru{n}_{right} $
and
 $ {Run}_{left} $
are right- and left-bloc seat share, centered at the 50% majority cutoff. These variables determine whether treatment is assigned or not and thus take account of selection. I have opted for a second-degree polynomial specified separately on each side of the cutoff to avoid the unattractive properties of higher-order polynomials (such as inflated rejection rates; see Gelman and Imbens Reference Gelman and Imbens2019). However, as an additional test, I will estimate a fourth-degree polynomial model as well. The relatively coarse nature of the running variables, resulting from the finite number of seats, could be a problem when estimating the models (Lee and Card Reference Lee and Card2008).Footnote
9
However, as pointed out by Kolesár and Rothe (Reference Kolesár and Rothe2018, 2302–2303), “[d]iscreteness of the running variable only causes problems if the number of support points close to the cutoff is so small that using a smaller bandwidth to make the bias of the estimator negligible relative to its standard deviation is not feasible.” In my case, I am able to use a bandwidth smaller than 2 percentage points by which bias should be very modest indeed. Hence, to supplement the parametric estimation strategy, I will test the robustness of the results when varying the bandwidth size. I cluster the standard errors at the municipality level to take account of the clustered nature of treatment.
I add several covariates (indicated with the vector
 $ Cov $
) for which relevant questions are included in all surveys. These are sex, age (and age squared), secondary education, higher education, household income, and occupation.Footnote
10
I also add year fixed effects. Although covariates are not strictly necessary in the RDD, these variables correct any imbalances between treatment and control groups. Because treatment is at the municipality level and the data are pooled over several years, chances are that the treatment and control groups differ in a nonsystematic way on variables (including survey year) that might be related to welfare attitudes or consistency levels. In so far as the RDD is valid, imbalances should not cause bias. However, by reestablishing balance, covariate adjustment helps improve efficiency and thus increases the likelihood of detecting an effect if there is one (Lee and Lemieux Reference Lee and Lemieux2010, 297).
The key identifying assumption of the RDD is the continuity assumption, which says “that the only change, which occurs at the point of discontinuity, is the shift in the treatment status” (de la Cuesta and Imai Reference de la Cuesta and Imai2016, 377). Because estimation relies less on extrapolation from observations far from the cutoff, this assumption is generally more plausible if the analysis is restricted to close elections—that is, when a small bandwidth is used (de la Cuesta and Imai Reference de la Cuesta and Imai2016). Thus, that the results are robust when narrowing the bandwidth is a first crucial test. However, a violation of the continuity assumption, not accounted for by local estimation, is sorting (McCrary Reference McCrary2008), which may materialize at both the political and the individual level. Sorting at the political level is equivalent to the political bloc strategically placing itself just to the right of the cutoff to secure a narrow victory. For sorting to invalidate the RDD, complete control over electoral outcomes is needed. Not only is this very implausible when talking about democratic elections in general (de la Cuesta and Imai Reference de la Cuesta and Imai2016; Eggers et al. Reference Eggers, Fowler, Hainmueller, Hall and Snyder2015), limited campaign resources (Jensen Reference Jensen, Elklit and Jensen1997b), the electoral formula for distributing seats (Elklit and Kjær Reference Elklit, Kjær, Elklit and Kjær2013b), and the need to coordinate campaigning within the bloc make precise manipulation of the running variable even more unlikely in the case of Danish municipal elections. Sorting at the individual level takes place when individuals self-select based on election results. The relatively low salience of municipal politics makes this scenario quite implausible, but it cannot be ruled out a priori. I will test for both types of sorting as part of the analysis.
Analysis
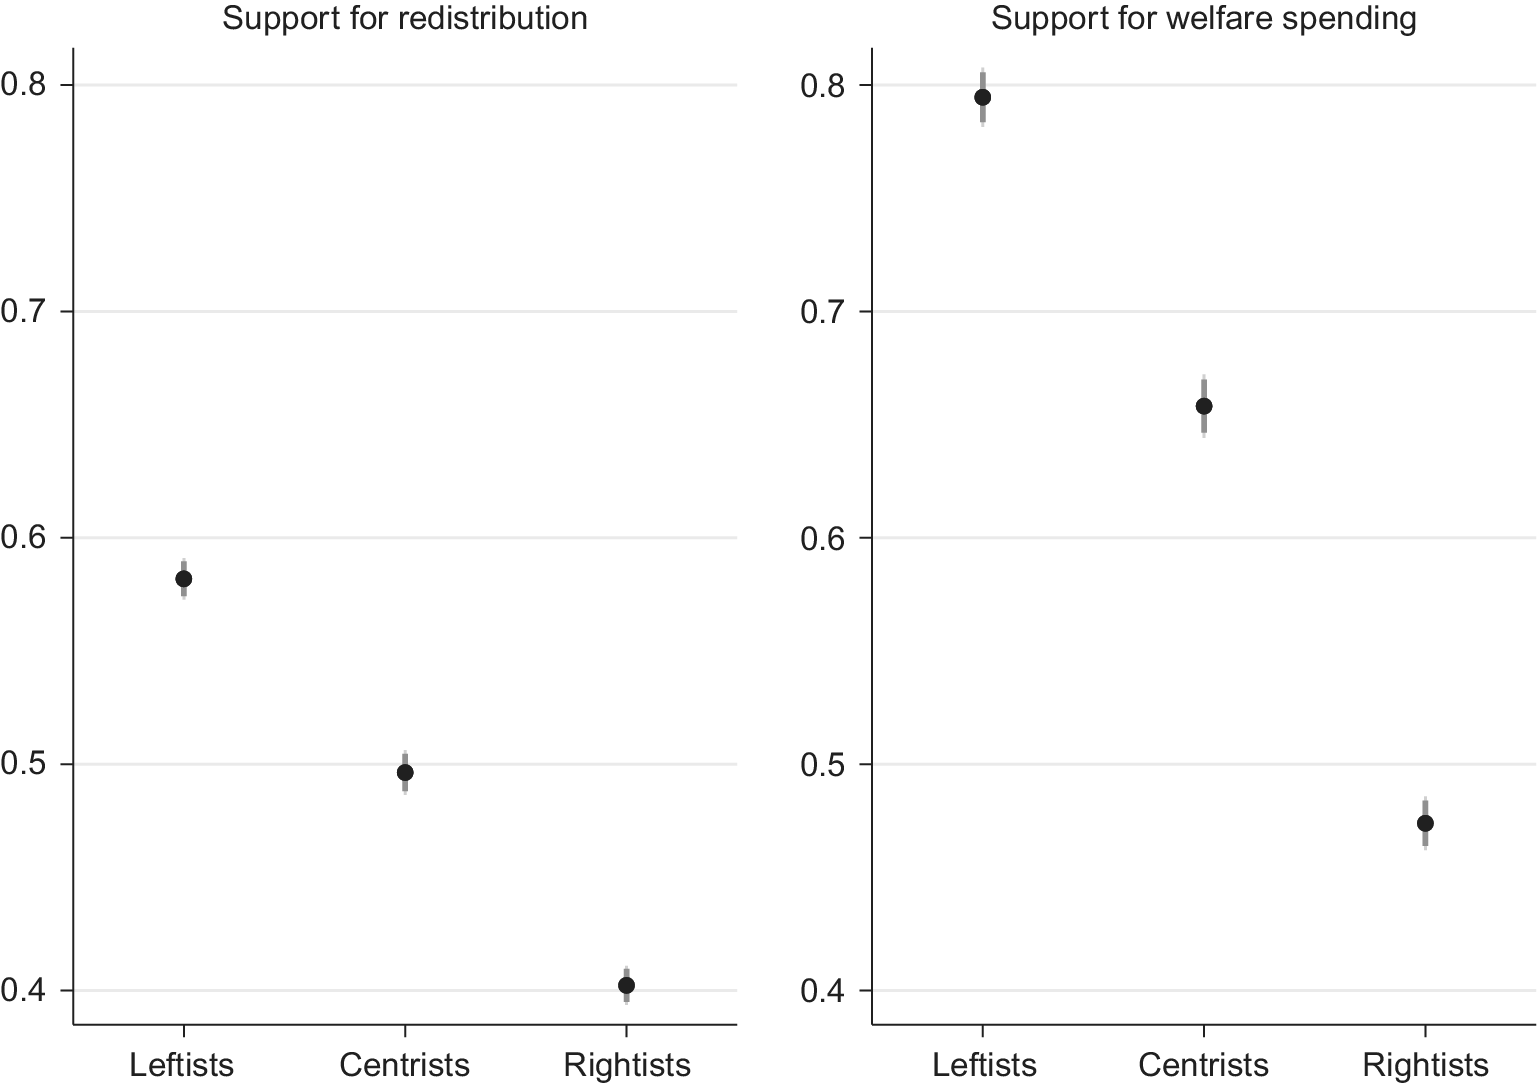
Before analyzing the crystallization effect of elections, I conduct a validation check to ensure that left-right self-placement captures real differences in policy preferences. Figure 1 shows predicted mean support for redistribution and welfare spending among respondents self-identifying as leftists, centrists, and rightists based on a model that uses the full sample and includes all covariates, including year fixed effects, as described earlier. Welfare attitudes vary quite a lot across the three groups and follow a familiar pattern. On both attitude dimensions, leftists are most pro-welfare and rightists are most anti-welfare, with centrists somewhere in between. The largest differences are found for welfare spending preferences, indicating that there is more common ground when it comes to how much to redistribute than when it comes to the size of the government. All differences between group means are statistically significant (p < 0.000).
Welfare Attitudes by Ideological Groups
Note: Predicted mean support for redistribution and welfare spending (0–1) based on full-sample OLS models including all covariates. Higher values indicate stronger support. Thick and thin error bars represent 90% and 95% confidence intervals, respectively.

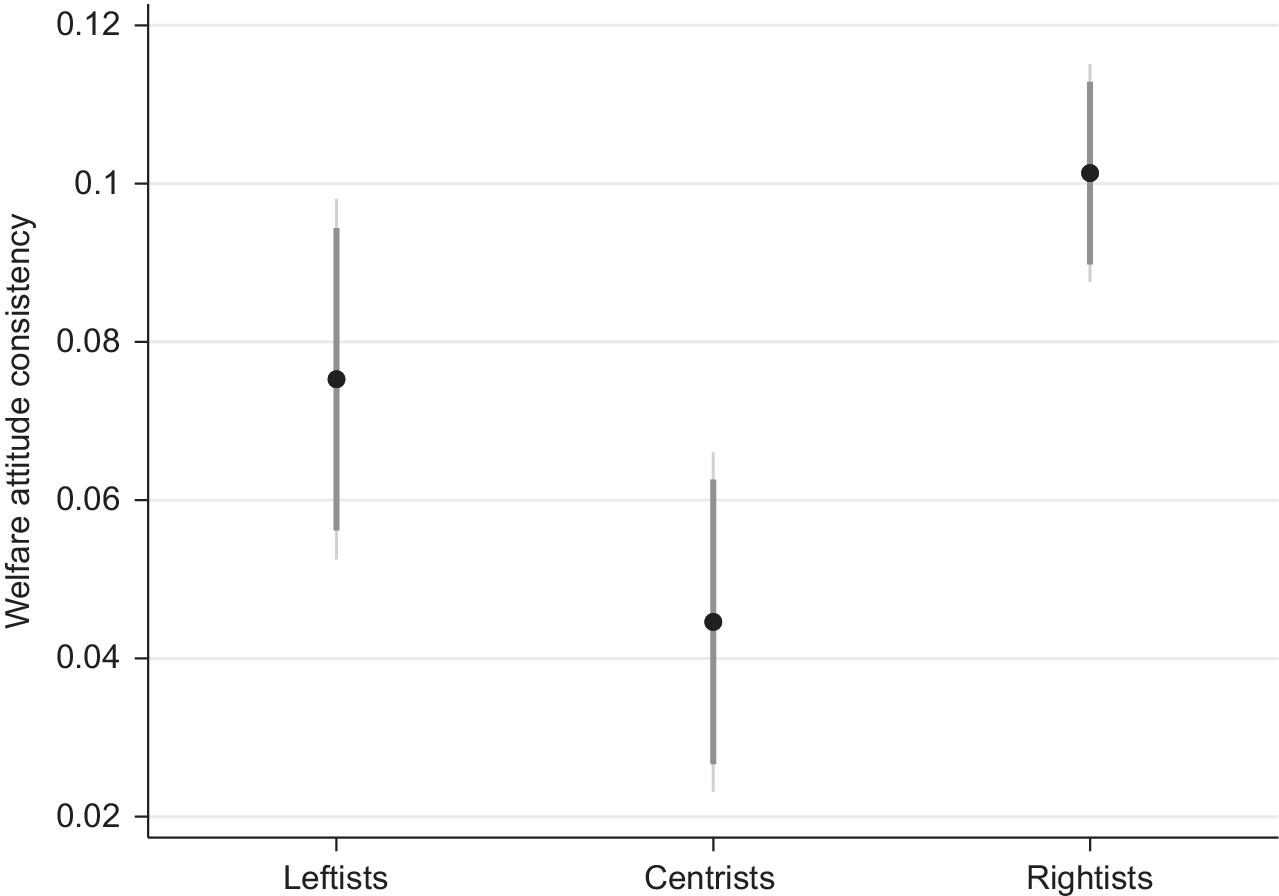
In Figure 2, welfare attitude consistency in terms of the correlation between the two attitudes is plotted for the three groups. We see that consistency is substantially larger among leftists and rightists, confirming that these groups are indeed more ideologically opinionated. Rightists are significantly more consistent than are centrists (β = 0.06; p < 0.000) and somewhat more consistent than leftists (β = 0.03; p = 0.053), which in turn exhibit higher consistency than do centrists (β = 0.03; p = 0.051). These analyses strongly suggest that left-right self-identification is not only of symbolic nature (Conover and Feldman Reference Conover and Feldman1981; Ellis and Stimson Reference Ellis and Stimson2012, 90–114); it is also associated with conflicting policy positions.
Welfare Attitude Consistency by Ideological Groups
Note: Regression coefficients of the relationship between support for redistribution and support for welfare spending (0–1) from group-specific OLS models with all covariates included. Thick and thin error bars represent 90% and 95% confidence intervals, respectively.

Crystallization Effect of Local Political Majorities
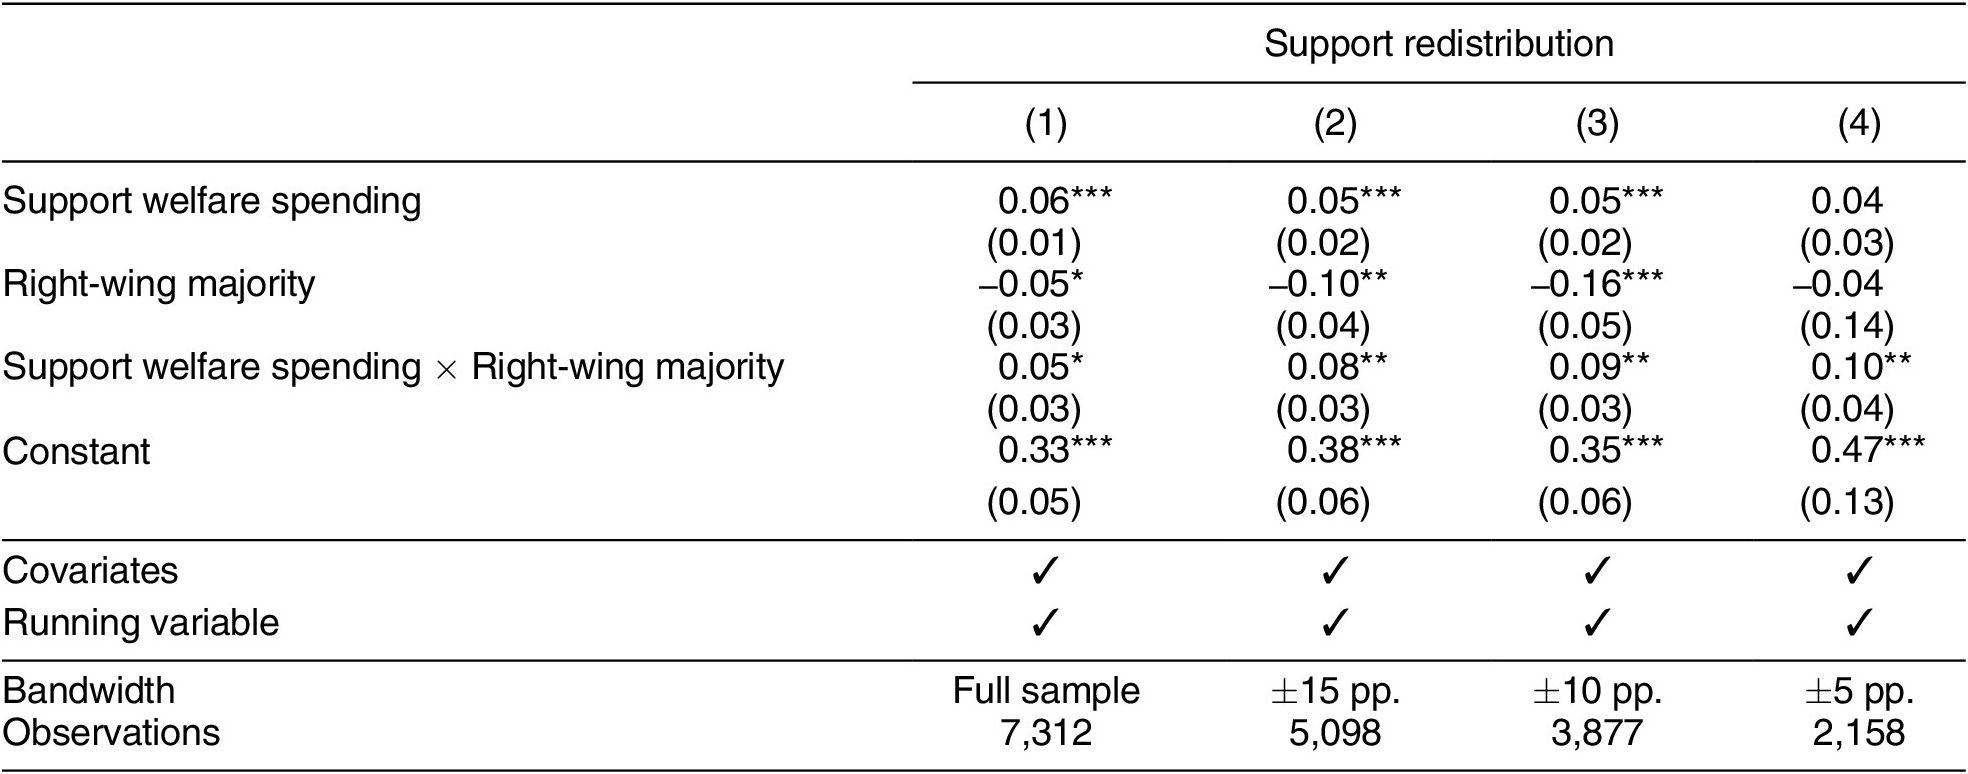
Having established that left-right self-placements map onto meaningful differences in public opinion, I now turn to the question of how local political majorities influence the structuring of welfare attitudes. Table 1 depicts the main results for people with a left-wing orientation. The columns represent estimations using different bandwidths from the full sample to only respondents residing in municipalities in which the election was decided by a seat share margin of 5 percentage points or less. For reasons of space, coefficients of covariates and the running variable are not reported.Footnote 11 First, support for welfare spending and support for redistribution are significantly related among those living in a municipality in which there is no right-wing majority. The correlation is not large, though: A full range change in welfare spending support (0 to 1) corresponds to an approximately 0.05 scale point change in support for redistribution, also measured on a 0–1 scale. A standard deviation change is associated with a change of 0.02 units (in the model with a 10-percentage-point bandwidth). This very weak relationship corroborates that consistency is generally low. However, this is likely a lower bound because measurement error in general and that from using different survey questions over the period are not directly addressed here.
Welfare Attitude Crystallization among Leftists

Note: Clustered standard errors at the municipality level in parentheses. Covariates are sex, age, age2, secondary education, higher education, occupation, income, and year dummies. Running variable is second-degree polynomial specified separately on each side of cutoff. *p ≤ 0.10, **p ≤ 0.05, ***p ≤ 0.01 (two-tailed t-test).
More importantly, the significant interaction confirms that the presence of a right-wing majority increases consistency in leftists’ welfare attitudes. Focusing on the full-sample model, leftists who are exposed to a right-wing majority are twice as consistent as are leftists who are living in municipalities where right-wing parties do not control a majority. This interaction effect is only significant at the 10% level. However, narrowing the bandwidth suggests that the full sample estimate is biased downward. The effect is double the size and significant at the 5% level when looking only at tight elections—defined as a seat share margin of 5 percentage points or less. From this model, we conclude that a local right-wing majority causes consistency to increase from 0.04 to 0.14—that is, consistency levels more than triple.
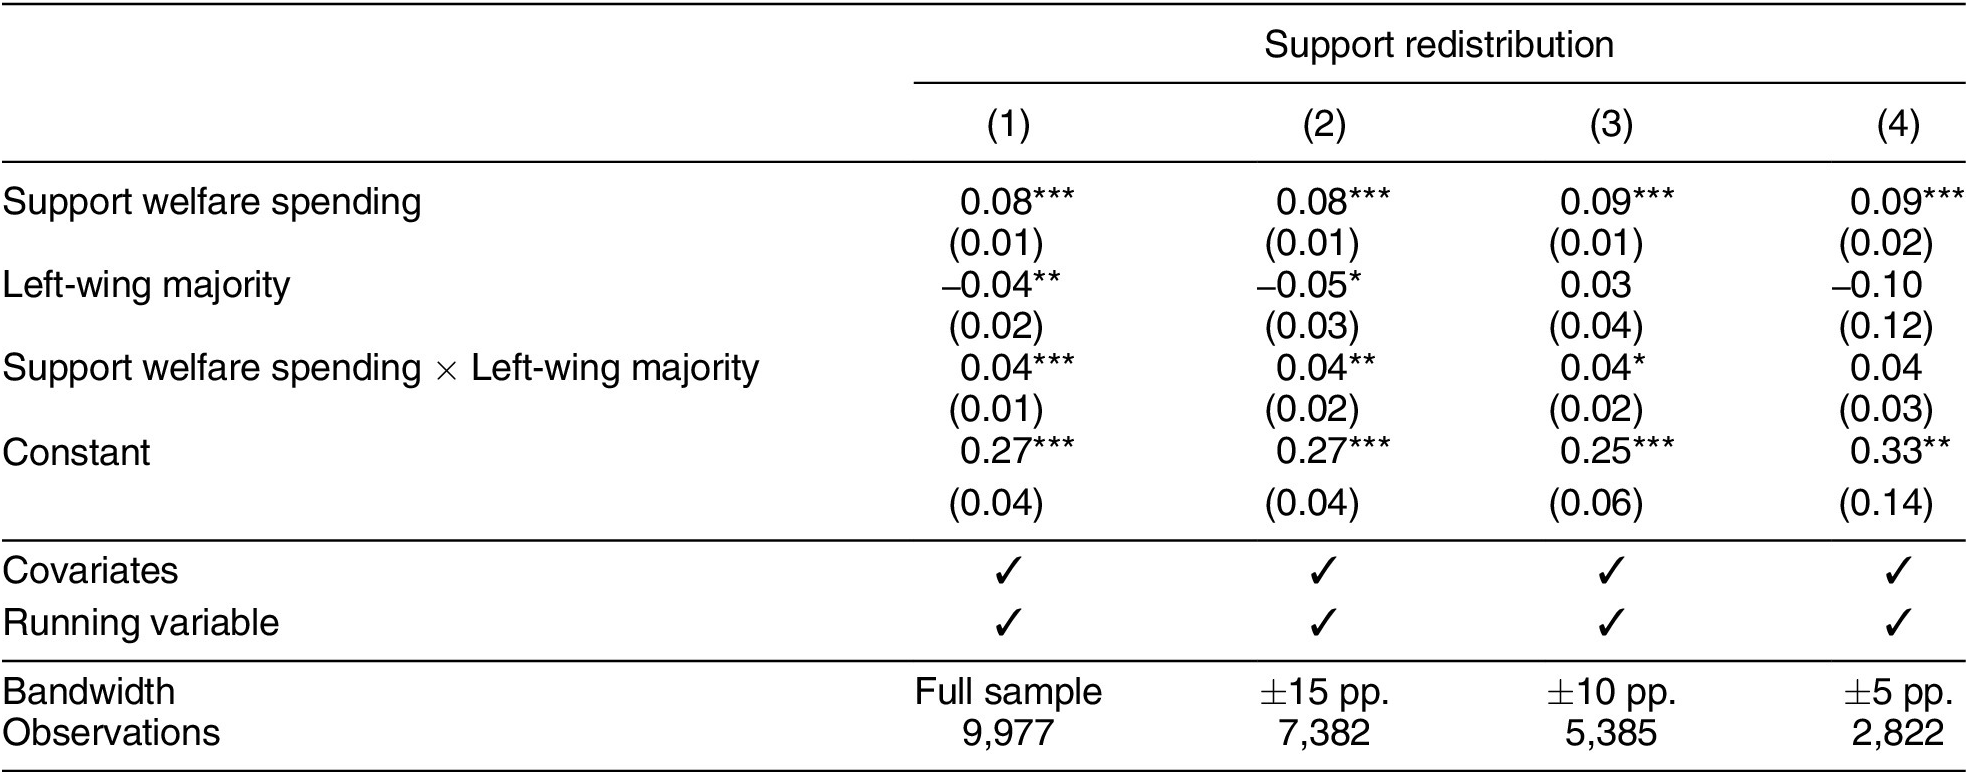
The results for right-wing respondents are displayed in Table 2. Again, I find clear evidence that a divergent political majority—here a left-wing majority—helps crystallize welfare attitudes. Rightists are generally more consistent than are leftists when they are not exposed to a divergent majority (a standard deviation increase in welfare spending preferences corresponds to an increase in redistributive preferences of 0.04 units, relying on a bandwidth of 10 percentage points). On the other hand, the crystallization effect of local elections is somewhat smaller than that found for leftists. The election of a left-wing majority raises consistency significantly, by 0.04 points, resulting in approximately the same overall level of consistency as leftists being exposed to a right-wing majority. Note that this effect stays rather consistent when narrowing the bandwidth, indicating that the full sample estimate is less biased for rightists. However, the standard error grows larger as more and more data are disregarded, eventually making the estimate insignificant.
Welfare Attitude Crystallization among Rightists

Note: See note to Table 1. *p ≤ 0.10, **p ≤ 0.05, ***p ≤ 0.01 (two-tailed t-test).
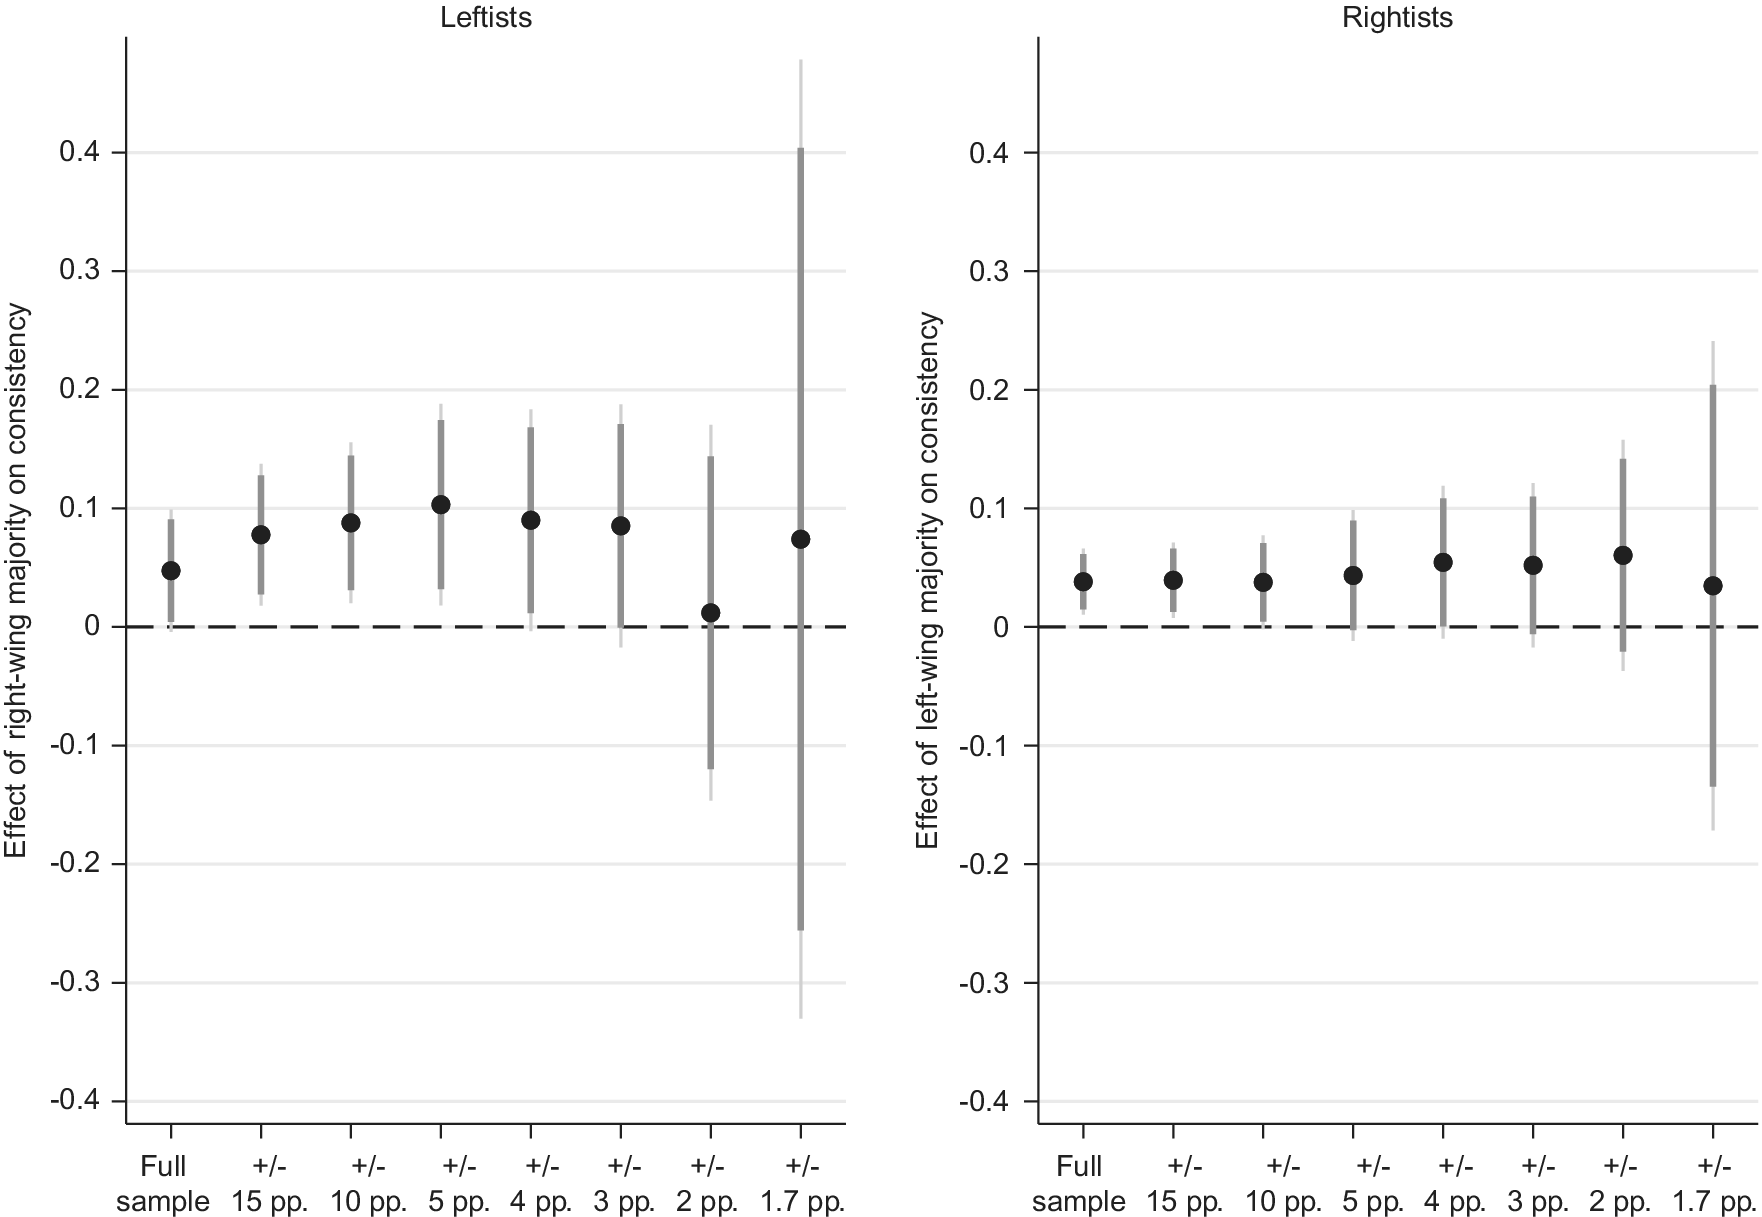
Figure 3 shows the range of estimates for leftists and rightists when narrowing the bandwidth even further, going all the way down to ± 1.7 percentage points, which is the smallest possible window. Although confidence intervals get wider as the number of respondents falls, the point estimates stay very much the same across specifications. Only in one of the models does the estimate drop considerably (leftists using a bandwidth of 2 percentage points). However, it should be noted that the most-local estimation produces results that are almost identical to those presented above.
Welfare Attitude Crystallization
Note: Thick and thin error bars represent 90% and 95% confidence intervals, respectively.

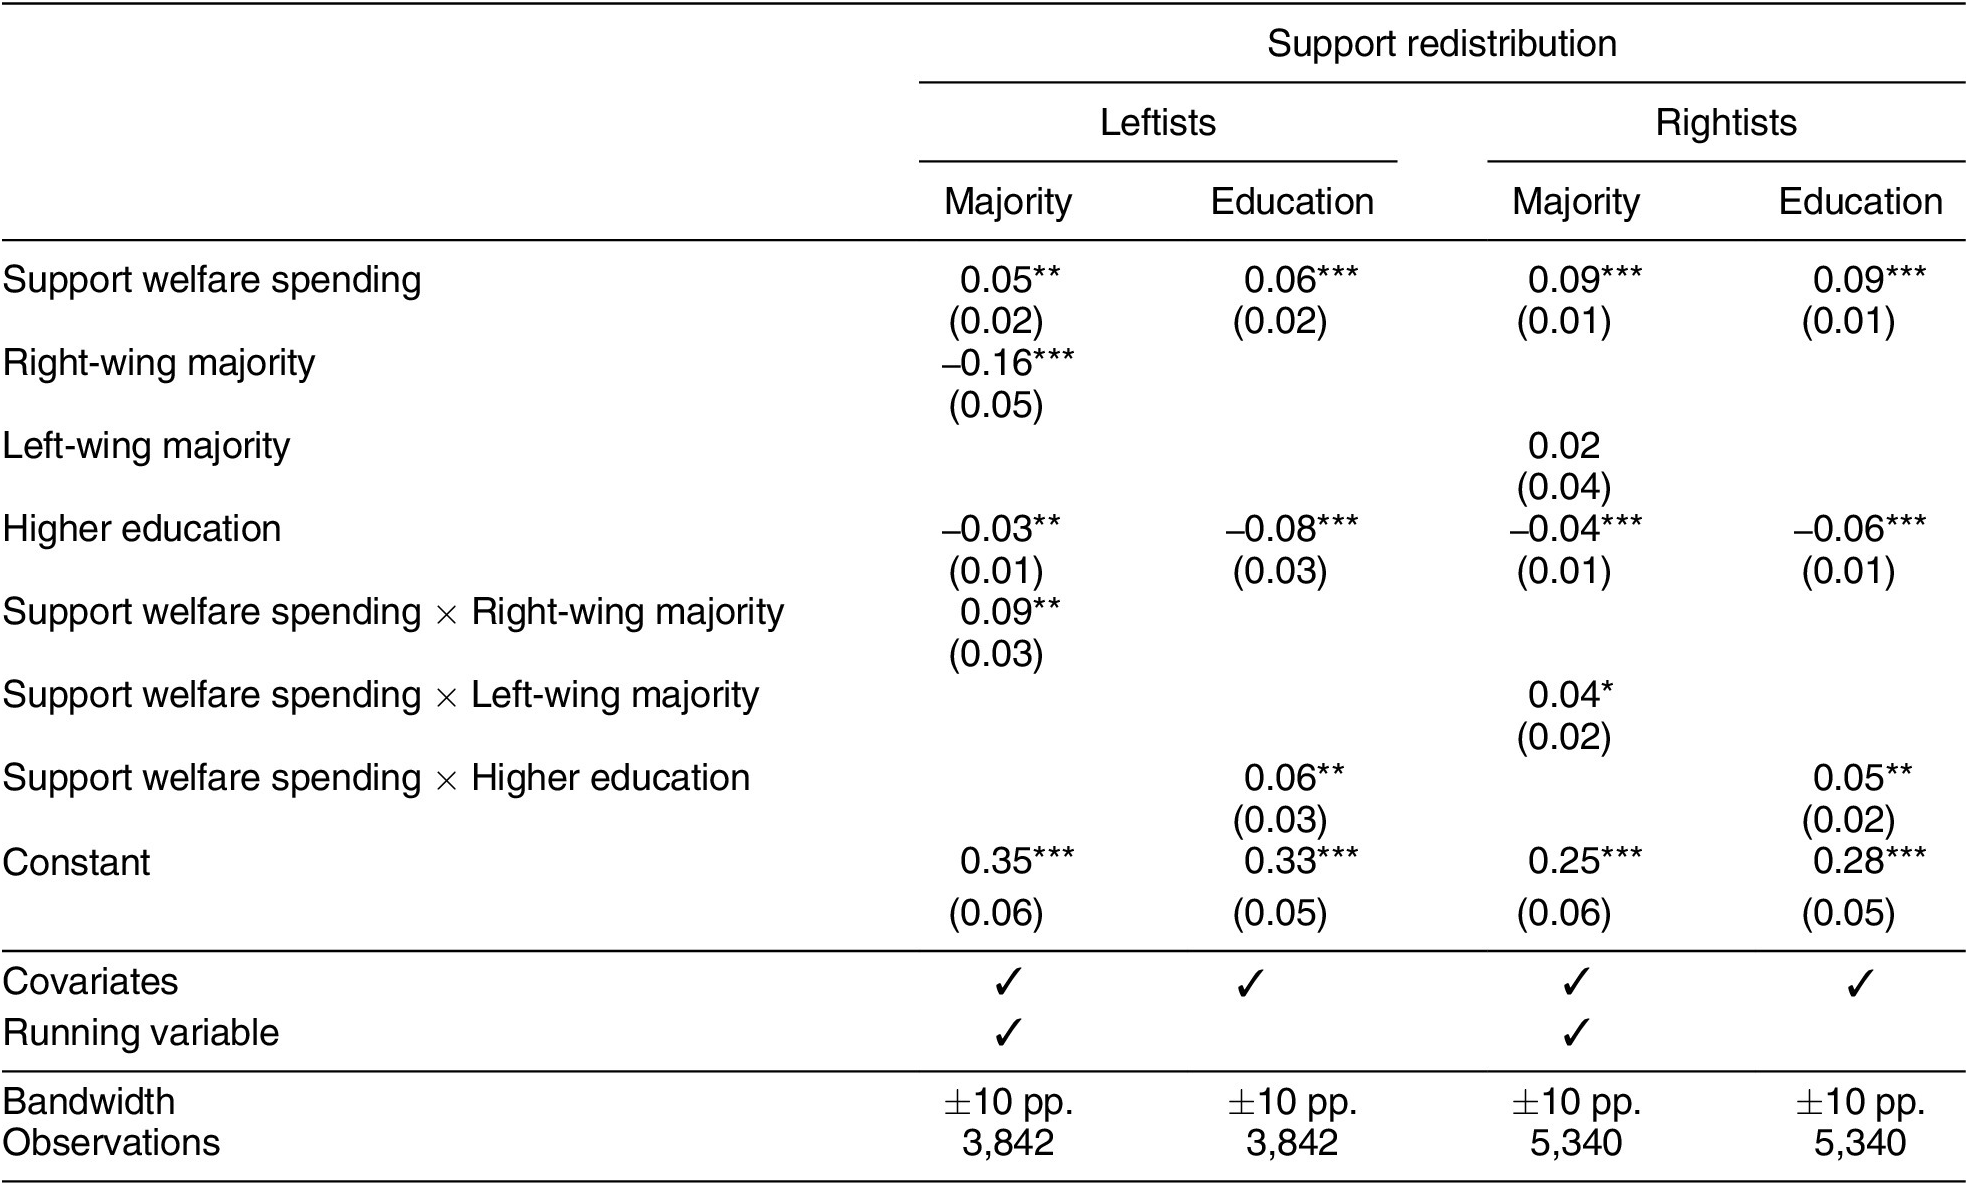
How large are these effects? To put the findings into perspective, I compare the effect sizes with one of the primary sources of attitude constraint: education (e.g., Bishop Reference Bishop1976; Sniderman, Brody, and Tetlock Reference Sniderman, Brody and Tetlock1991). To facilitate the comparison, I focus on the models with a bandwidth of 10 percentage points to get sufficient statistical power, excluding people not providing information about their educational level. Then, I estimate how consistency varies depending on whether or not the respondent has completed a higher education, using the same model specifications except leaving out the running and treatment variables. In line with previous research, I find that people who are better educated are more consistent (see Table 3), a plausible reason being that education enhances political sophistication and awareness. For leftists, those with a higher education are 100% more consistent than are those without; for rightists, the number is 53%. In contrast, a right-wing majority increases consistency of left-wing respondents by 189%, and a left-wing majority increases the consistency of rightists by 42%. Thus, the crystallization effect of political majorities is about the same as or even greater than the influence of education—a comparison that probably would have been even more favorable to the “political majorities” explanation had confounders of the educational effect been addressed properly (Highton Reference Highton2009). This exercise confirms that the effects of local majorities are not only statistically significant but also substantively meaningful and large.
Comparing with Educational Effect

Note: Respondents not providing information about completion of higher education were excluded. See also note to Table 1. *p ≤ 0.10, **p ≤ 0.05, ***p ≤ 0.01 (two-tailed t-test).
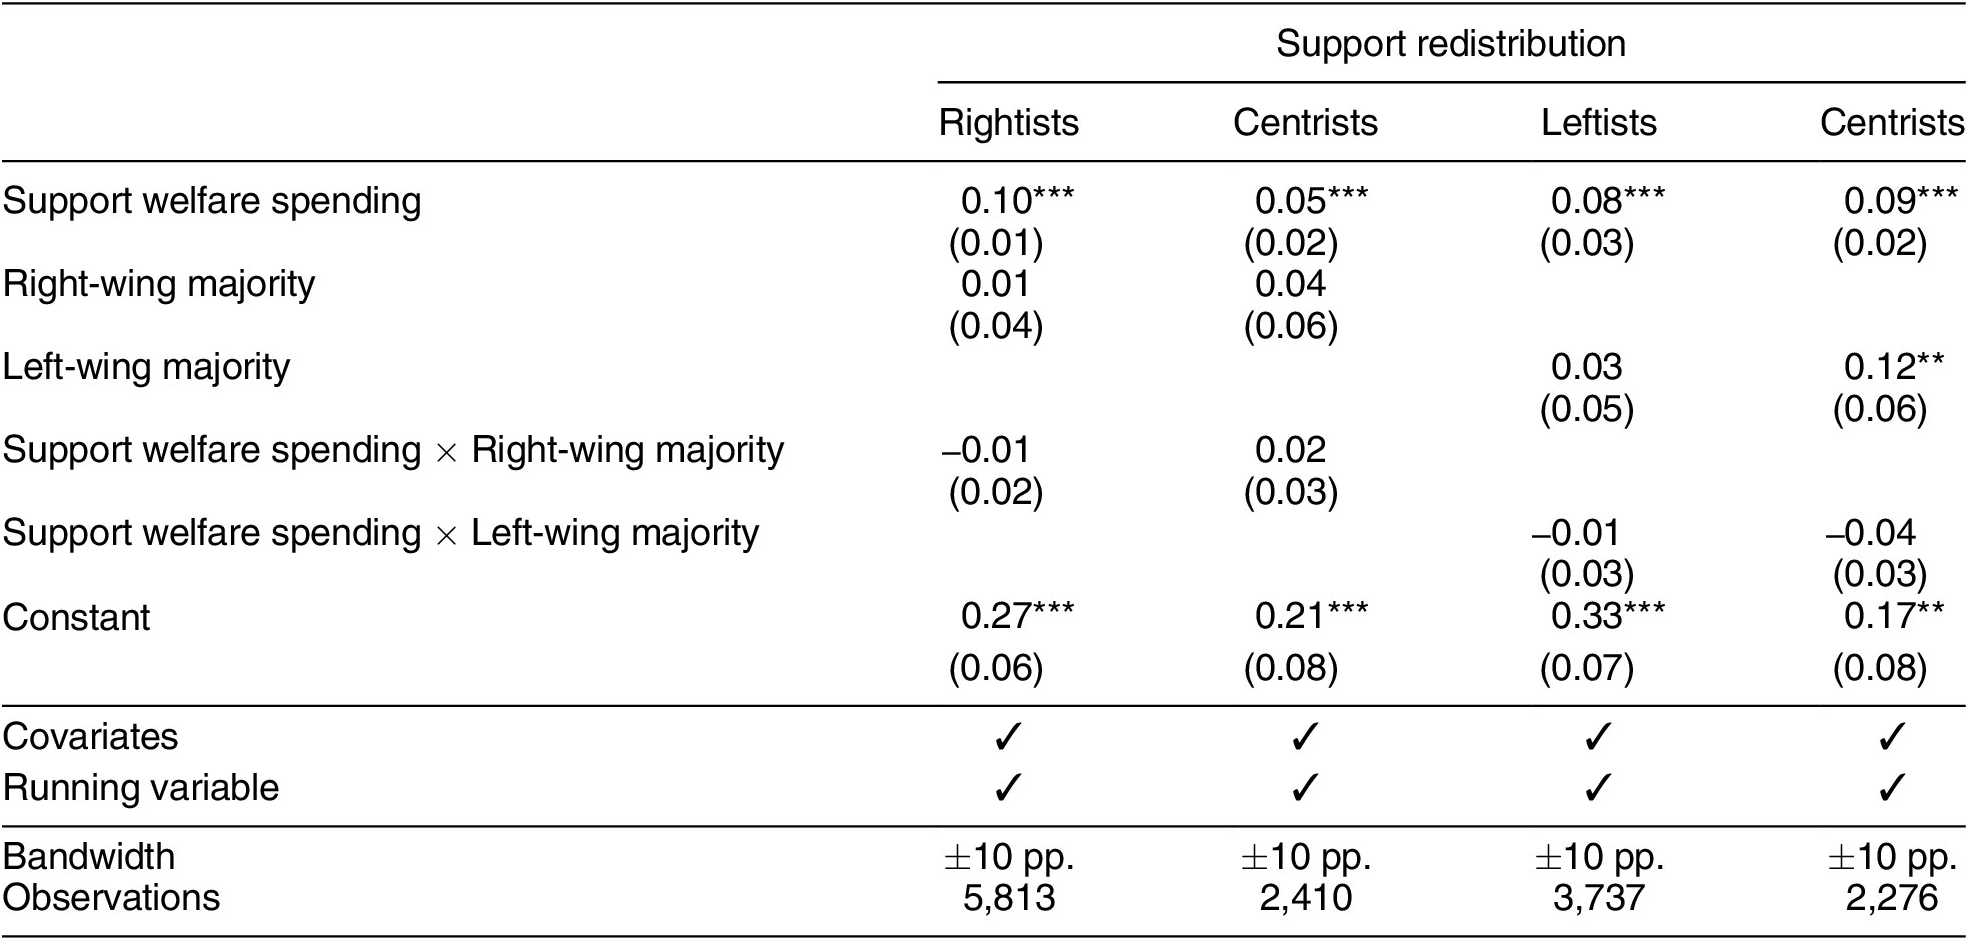
Having found that an ideologically dissonant majority promotes attitude consistency, I now examine the influence of an ideologically consonant majority (i.e., a majority congruent with the respondent’s ideological position) and whether local majorities affect consistency among centrists. If I am right that it is the contrast between the ideological orientation of the individual and the political majority that produces higher levels of consistency, there should be no effect in these situations. As shown in Table 4, that is exactly what I find. Neither leftists being exposed to a left-wing majority, nor right-wing respondents being exposed to a right-wing majority, nor centrists being exposed to either a left- or right-wing majority are associated with increased consistency. These conclusions are robust to different bandwidth choices.Footnote 12
Welfare Attitude Crystallization: Consonant Majorities and Centrists

Note: See note to Table 1. *p ≤ 0.10, **p ≤ 0.05, ***p ≤ 0.01 (two-tailed t-test).
Overall, the results support the notion that elections can bolster attitude consistency by exposing individuals to a political majority with a divergent ideological stance. This holds for both left-wingers and right-wingers and also when focusing exclusively on close elections. The effects are not an artifact of right- and left-wing majorities generally increasing attitude consistency since no effect is detected among centrists or among leftists and rightists when exposed to a consonant majority. In the next sections, I will assess the RDD assumptions, conduct auxiliary and robustness analyses, and discuss potential alternative explanations of the findings. All of these analyses are reported in the online appendix.
Assessing the Validity of the Design
Above, I showed that results are robust to a range of different bandwidth choices, which vindicates the validity of the design. As a further check on the continuity assumption underlying the RDD, I do the following: (a) adding higher-order polynomials, (b) using placebo cutoffs, and (c) looking for sorting at the political and the individual level. First, I have rerun the models in Table 1 and Table 2 adding a third- and fourth-degree polynomial of the running variable. This does not change the results in any substantive way (Figure C.1). Second, if the difference in consistency below and above the 50%-seat-share cutoff is in fact an effect of the majority, we should not see a similar effect at arbitrarily chosen cutoffs not related to changes in majority. Therefore, I have estimated models using instead 45% and 55% seat share as placebo cutoffs. I find no effect whatsoever (Table C.1), confirming that the results are indeed driven by majority changes happening at the 50% cutoff.
Third, and finally, I have tried to detect any pattern of strategic manipulation of the running variables, which might jeopardize the design. I test for sorting at the municipality level by conducting density estimation as well as looking for systematic differences in predetermined covariates at the cutoff. If the political blocs can determine electoral outcomes with high precision, thus securing a narrow victory, these analyses should reveal imbalances in density and municipality characteristics. Apart from a difference in density around the right-wing seat share cutoff that is significant at the 10% level (p = 0.07), there is no systematic evidence of sorting (Table C.2–3 and Figure C.2–3). This aligns with prior expectations that precise control over electoral outcomes is a rare phenomenon. To further verify this, I have estimated “donut RDDs” (Eggers et al. Reference Eggers, Fowler, Hainmueller, Hall and Snyder2015) where I drop the very tight elections (±3 percentage points), whose outcomes might to varying degrees be a result of sorting. However, results are robust when excluding these cases (Table C.6).
At the individual level, I analyze imbalances in predetermined individual characteristics using the available covariates. I find no significant differences between treated and untreated individuals at the cutoff (Table C.4–5). Also, I compare the crystallization effect among respondents interviewed within and more than one year after the last election.Footnote 13 If the results were caused by strategic self-selection, they should disappear or at least weaken when focusing on respondents interviewed less than a year after the election because few people should have been able to move within this time horizon. For rightists, I find no difference in the effect, thus indicating that self-selection does not affect the results (Table C.7). For leftists, I find a stronger effect within the first year. In fact, no significant effect is seen for respondents interviewed more than a year after the election (Table C.8 and Figure C.4). This suggests that, if anything, self-selection biases the results downward. An explanation could be that strong ideologues with the most consistent attitudes react to an unfavorable electoral result by moving to another municipality, with the implication that we underestimate the causal effect. However, the salience of municipal politics considered, an alternative and perhaps more plausible explanation is myopia (Healy and Malhotra Reference Healy and Malhotra2009). That is, as new political events take center stage, the local election quickly sinks into oblivion, and as a result, the effect dies out.
The Persistence of the Effects
To explore this further, I examine the longevity of the effects using a more fine-grained coding in terms of the number of years elapsed between election and interview year. Keeping in mind that interview dates are not randomly assigned, and that people may not have lived in the same municipality over the entire period, these analyses confirm that for leftists, no effect is found in any other year than the first. For rightists, on the other hand, no meaningful effect is discernible after two years, with the largest effect found 1–2 years after the election (Figure D.1). Hence, the effects are relatively short-lived.
Does Age Moderate the Effects?
I have looked at whether the crystallization effect varies with age. Based on political socialization research, we might suspect that the effect is driven by preadults and/or the elderly, who are known to be more susceptible to political influence than are people at midlife (Henry and Sears Reference Henry and Sears2009; Sears and Funk Reference Sears and Funk1999). However, I find no evidence that age moderates the effects (Table D.1–2). This supports the idea that political majorities can mobilize ideological reasoning broadly in the population, not only among people with less crystallized attitudes to begin with.
Are the Results Driven by Strong Ideologues?
Although life cycle factors do not seem to have any bearing on how strongly the local majority influences the structuring of welfare attitudes, it is still possible that people are affected differently. In particular, people with strong ideological attitudes—that is, with polar placements along the left-right scale—might react strongly to a divergent majority, whereas the moderate left- or right-wingers, who constitute the large majority, might be indifferent. Thus, I analyze whether extremity on the left-right scale makes people more receptive to the political makeup of their municipality. I do not find that this is the case (Table D.3–4).
Political Sophistication
Next, and somewhat related, I scrutinize the moderating role of political sophistication. Here, I use a tailored measure of sophistication. Following Aldrich et al. (Reference Aldrich, Schober, Ley and Fernandez2018), I measure the average absolute deviation of individuals’ placement of Danish political parties on the left-right scale from the sample mean. Analyses suggest that those having a poorer understanding of party positions are less affected by the majority situation, but for neither leftists nor rightists is the interaction statistically significant (Table D.5). Thus, high-sophisticates might be affected to a larger degree, but given the data at hand, this cannot be established with sufficient certainty.
Specific Policy Issues
I have rerun the original analyses but instead used two more specific welfare issue positions: attitudes toward unemployment spending and attitudes toward social benefits. Interestingly, the same pattern of increased consistency when being exposed to a divergent political majority is found. However, the effect is only robust for rightists (Figure D.2). This suggests that elections are better able to mobilize ideological feelings with regard to the abstract core functions of the welfare state (i.e., redistribution and public services) and that this only imperfectly trickles down to increase consistency of attitudes toward more specific topics. The result is perhaps not surprising because political fundamentals such as the questions of how to organize society and regulate economic relations at a general level are the fabric ideological conflicts are made of (Feldman Reference Feldman1988; Smith et al. Reference Smith, Oxley, Hibbing, Alford and Hibbing2011). In contrast, to the extent that concrete policy priorities involve tangible costs and benefits, as in the case of unemployment and social benefits, they usually have a strong affinity to people’s personal and vicarious economic experiences and interests (Alt et al. Reference Alt, Jensen, Larreguy, Lassen and Marshall2019; Chong, Citrin, and Conley Reference Chong, Citrin and Conley2001; Martén Reference Martén2019).
To get an impression of whether a more general welfare attitude structure crystallizes in response to a divergent majority, I have computed Cronbach’s alpha for the four welfare items on each side of the cutoff using the smallest possible bandwidth (±1.7 pp.), by which the groups should be fairly similar in expectation. For leftists, but especially rightists, I find that alpha is larger among the treated individuals (leftists: 0.41 vs. 0.32; rightists: 0.48 vs. 0.06) (Figure D.3). This suggests greater overall constraint within the domain following exposure to a divergent majority.
Cultural Issues
Conflict over economic (re)distribution is at the core of the left-right divide of citizens and parties. However, in recent years, cultural/social issues have gained increased prominence (Smith and Tatalovich Reference Smith and Tatalovich2003). On the one hand, one could expect to see the same pattern of crystallization in this domain, as issues such as religion, abortion, and immigration have become weighty topics on the political agenda. On the other hand, these issues are still in many circumstances secondary to the classic dispute over inequality and the size of the government and do to some extent cut across this divide (Ellis and Stimson Reference Ellis and Stimson2012; Hansen and Stubager Reference Hansen, Stubager, Hansen and Stubager2017, 23–26; Mair Reference Mair, Dalton and Klingemann2007; Treier and Hillygus Reference Treier and Hillygus2009). Furthermore, at least in Denmark, these topics are nearly always national topics, thus missing the link to local politics that the economic issues have. Thus, we should not be overly surprised if the results do not smoothly generalize to this more recent cleavage. Here, I analyze how consistency between immigration and crime attitudes depends on local majorities. The results deliver suggestive evidence that exposure to a divergent majority does lead to a small to medium increase in consistency, especially when analyses for leftists and rightists are pooled. However, the effects are smaller and statistically more uncertain than the ones reported as part of the main analysis (Figure D.4–5).
Additional Robustness Checks
I have conducted several additional tests to strengthen our confidence in the main results. First, I have interacted the polynomial running variable with the welfare-spending variable to reduce assumptions about how consistency depends directly on the seat share of the opposing bloc. Because this is a very demanding model specification involving a four-way interaction, and due to the coarseness of the running variables, I rely on the full sample. The resulting estimates mirror the main findings reported above almost one-to-one, although they—as expected—are noisily estimated and thus do not reach statistical significance at conventional levels (Table E.1). Second, I have rerun the models dropping all covariates. Whereas the estimates become noisier, the results generally remain the same, indicating that variation is indeed exogenous (Figure E.1). Third, I have added municipality fixed effects. If the design is valid, this should not change the results. Indeed, it does not (Figure E.2). Fourth, and finally, I have imputed missing values using multiple imputations. This has no practical implications for the results (Figure E.3).
Overall, the empirical findings are quite robust to different model specifications. Next, I examine alternative explanations of the results.
Alternative Explanations: Party Identification and Persuasion
I consider two alternative explanations. First, perhaps it is not people’s ideological position but rather their party identification that explains why consistency increases when confronted with a divergent political majority (Bowler, Lanoue, and Savoie Reference Bowler, Lanoue and Savoie1994; Freeder, Lenz, and Turney Reference Freeder, Lenz and Turney2018; Kalmoe Reference Kalmoe2020; Singh and Thornton Reference Singh and Thornton2019). As left-right position and preferred party are correlated,Footnote 14 my analysis could detect an effect caused by party identification. To test this, I have replaced ideological self-placement with left- and right-wing party identification. If the effect is driven by party identification, the results should be stronger when using this alternative specification. However, they are not. In fact, I do not find a consistent pattern of increased consistency (Figure F.1). This lends support to the claim that it is people’s ideological position—not their party affiliation—that is triggered by local elections.
Second, it could be that exposure to opposing views has a persuasion effect (Huber and Arceneaux Reference Huber and Arceneaux2007; Putnam Reference Putnam1966) in terms of affecting placements on the left-right scale. If that is the case, higher consistency in the treatment group might be a result of the least extreme left- and right-wingers (those closest to the center) switching to the other side and thus falling out of the ideological category. Those remaining are the most extreme and presumably most consistent ideologues, leading to the false impression that a divergent political majority increases consistency. I test this alternative explanation by examining whether divergent local majorities affect people’s placement along the left-right scale. If the results are an artifact of persuasion, we should expect to see that leftists are more moderate (in terms of average score on the left-right scale) if exposed to a right-wing majority, and likewise that rightists are more moderate when exposed to a left-wing majority. However, no evidence of a persuasion effect is found (Figure F.2).
Conclusion and Discussion
In this article, I have provided and tested an event-based theory of attitude consistency, focusing on a core issue domain: attitudes toward welfare state policies. Since Converse (Reference Converse and Apter1964; Reference Converse and Tufte1970), public opinion research has converged toward one central insight: that ordinary citizens lack coherent attitudes grounded in abstract ideological principles. Drawing on political socialization research and research on resistance to persuasion, I argued that by exposing the individual to opposing views that trigger ideological predispositions, elections that produce an ideologically dissonant majority can increase consistency levels and thus foster real attitudes. Based on Danish surveys, local election data, and an RDD, I found strong evidence supporting this claim. A local right-wing majority enhanced consistency between support for redistribution and support for welfare spending among left-wing respondents but not among right-wing respondents and centrists. Similarly, a local left-wing majority increased welfare attitude consistency among rightists but not among leftists and centrists. These effects were as large as or even larger than the effect of education on consistency. Furthermore, the analysis suggested that consistency between preferences for unemployment spending and the generosity of social benefits—two more specific welfare topics—were also strengthened and that cultural issues might as well be mobilized in response to ideological opposition, but the evidence was less compelling here.
Taken together, these pieces of evidence suggest that political events—and more specifically, elections—play a pivotal role in promoting coherent and meaningful political attitudes among the public. Thus, the findings add important new insights to our knowledge about public opinion formation. However, the limitations of the study should also be acknowledged. First, although divergent majorities were able to increase the extent to which attitudes covaried in an ideologically consistent manner, overall consistency levels were still modest. Hence, ideological opposition should not be regarded as a panacea for producing a more sophisticated public. Second, by using an RDD, I was able to address potential threats to causality. However, this came with a cost, as the results—strictly speaking—only apply to close elections. This localness of the results should be kept in mind. Third, I tested my argument with respect to the salient issue domain of welfare politics, which is central to the left-right divide and party competition, at least in most of the Western world. This represents a natural and important first step toward getting a better understanding of how attitude constraint depends on the political context. However, although somewhat similar findings were obtained looking across other topics, I acknowledge that the analysis cannot establish that a full-ranging belief system is mobilized in response to exposure to political disagreement. Thus, the logical next step would be to explore further the opportunities and limits of political events in bringing about a coherent public and whether the findings generalize to party systems with different cleavage structures.
Three broader implications flow from the findings. First, although people may in general suffer from low levels of consistency, under the right circumstances, attitudes will approach real attitudes. That is to say, the nonattitudes claim is at best only partially true, and broad statements about the degree of ideological constraint in the population should be interpreted with caution due to the flexibility and contextual dependency of attitude structure. Second, I find that regular and less salient political events are able to socialize even the politically mature adult population. This finding is at odds with what Sears and Valentino conclude regarding election campaigns (Sears and Valentino Reference Sears and Valentino1997; Valentino and Sears Reference Valentino and Sears1998) and demonstrates that socialization effects of events are not limited to children and adolescents in their formative years but indeed include larger sections of the population. In fact, decades of experiences of election losses might be part of the explanation for why older persons generally have more crystallized attitudes. Hence, the article offers a novel interpretation of the consistent finding that attitudes crystallize over the life course. Third, although political conflict may contribute to rising levels of polarization with harmful consequences for dialogue across ideological lines (however, the evidence is mixed; see e.g., Baldassarri and Bearman Reference Baldassarri and Bearman2007; Fiorina and Abrams Reference Fiorina and Abrams2008; Sides and Hopkins Reference Sides and Hopkins2015), the results indicate that exposure to political differences may at the same time provoke political thinking at a deeper and more abstract level than normally characterizes the reasoning of citizens (see also Levendusky Reference Levendusky2010). This might enrich and enhance a substantive democratic discussion and prevent political alienation. However, the flip side to this is that deliberation and the good argument may become less powerful.
Supplementary Materials
To view supplementary material for this article, please visit http://dx.doi.org/10.1017/S0003055421000010.
Data Availability Statement
Replication and supplementary materials can be found on Dataverse at: https://doi.org/10.7910/DVN/XMKPSQ.
Acknowledgements
I would like to thank Peter Thisted Dinesen, Rune Slothuus, Frederik Hjorth, Jeppe Vierø, Frederik Kjøller Larsen, and Lykke Sterll Christensen, as well as the three anonymous reviewers at the APSR for their valuable comments and clever suggestions for an earlier version of the article.
Funding Statement
No external funding was received.
Conflict of Interest
The author declares no ethical issues or conflicts of interest in this research.
Ethical Standards
The author affirms that he did not himself engage human research participants.




Comments
No Comments have been published for this article.