INTRODUCTION
Losses of reactive nitrogen (N) from livestock systems pose a significant threat to the environment through nitrate-N (NO3 −-N) leaching to aquatic ecosystems and gaseous emissions of nitrous oxide (N2O). Agricultural soils contribute c. 0·35 of the annual N2O emissions worldwide and NO3 −-N leaching losses from grazed pastures can range from 30 to 200 kg N/ha (Kroeze et al. Reference Kroeze, Mosier and Bouwman1999; Ledgard Reference Ledgard2001). The predominant source of N loss from grazed pastures has been attributed to urine deposition by ruminant animals at rates equivalent to c. 500–1000 kg N/ha in localized patches (Haynes & Williams Reference Haynes and Williams1993).
The nitrification inhibitor dicyandiamide (DCD) is a chemical compound that has shown promise as an effective mitigation technology that inhibits the first stage of nitrification (i.e. the microbial oxidation of ammonium to nitrite), thereby reducing the formation of NO3 −-N in soil (Amberger Reference Amberger1989). Broadcast application of DCD to simulated urine patches during late-autumn and winter in lysimeter studies has been shown to reduce NO3 −-N leaching by 60% and decrease N2O emissions by 70% (reviewed by Clough et al. Reference Clough, Di, Cameron, Sherlock, Metherell, Clark and Rys2007). However, surface broadcast application over the entire grazed area (covering both urine and inter-urine areas) does not specifically target individual urine patches, which can cover c. 0·05 of the area in a single grazing (or c. 0·20 annually; Moir et al. Reference Moir, Cameron, Di and Fertsak2011). Oral administration of DCD to ruminant animals for subsequent excretion in the urine (Ledgard et al. Reference Ledgard, Menneer, Dexter, Kear, Lindsey, Peters and Pacheco2008a ) represents an alternative technique to surface broadcast application of DCD as a strategy to specifically target individual urine patches. This targeted approach requires less DCD in total and is therefore potentially much more cost-effective. Ledgard et al. (Reference Ledgard, Menneer, Dexter, Kear, Lindsey, Peters and Pacheco2008a ) showed that DCD was predominantly excreted in urine in an unaltered form for effective inhibition of nitrification of urinary-N in the soil.
Detailed studies (Menneer et al. Reference Menneer, Ledgard and Sprosen2008a ; Welten et al. Reference Welten, Ledgard, Schipper and Judge2013a ) using soil monolith lysimeters have shown that amending cattle urine with DCD was effective in reducing NO3 −-N leaching from urine patches by 45–72% in a volcanic soil over a range of DCD application rates (10–60 kg DCD/ha). However, there is a requirement to investigate the efficacy of animal delivery of DCD to reduce N losses under grazing systems during the main period of N loss (e.g. winter drainage for NO3 −-N leaching). One potentially practical animal delivery method could be the administration of DCD through a farm water trough system.
The objective of the current farmlet study was to quantify NO3 −-N leaching losses and gaseous emissions of N2O after grazing when dairy cows were administered DCD via water troughs relative to an untreated control group during the winter grazing period.
MATERIALS AND METHODS
Site description
The study was undertaken at the AgResearch dairy research farm located in the Waikato region, New Zealand (37o46′S; 175o19′E). The flat experimental site contained a permanent mixed stand (>15 years age) of predominantly perennial ryegrass (Lolium perenne L.) and white clover (Trifolium repens L.), established on moderately well-drained Bruntwood silt loam (NZ classification: Typic Impeded Allophanic Soil; USDA: Aquic Hapludand). The pasture had been rotationally grazed by dairy cows (2·7 cows/ha) until 4 months prior to commencing the study, when it had a silage harvest (late March) that excluded animal excreta inputs.
Soil analyses prior to commencing the trial showed concentrations of organic carbon and total N in the soil (0–75 mm depth) at 49·0 and 5·50 mg/g, respectively. Soil pH (1 : 2 air-dried soil:water ratio) was 6·0. No fertilizer-N, slurry or irrigation was applied to the experimental site during the study or within 4 months before commencing the study.
A meteorological station located c. 1·5 km from the trial site was used to monitor rainfall and soil temperature (100 mm soil depth) continuously.
Grazing management and treatment application
The trial area was fenced into 24 paired replicate plots (each 627 m2) with each allocated independent portable water troughs. The paired plots were then randomly allocated to the following two treatments (12 replicates):
-
(1) Control – standard farm management, and
-
(2) DCD – DCD administered in water troughs during the June and August (2007) winter grazing rotation periods.
The plots were rotationally grazed by pregnant Friesian dairy cows (due to calve in late October) over two 12-day periods in June (13–24 June) and late August (27 August–7 September), coinciding with typical grazing management. At the commencement of each grazing period the dairy cows were weighed, blocked by live-weight and randomly allocated to two groups with 20 and 12 cows per treatment group for the June and August grazing rotations, respectively (equivalent grazing intensity of 319 and 191 cows/ha/day according to total available feed supply). Treatment groups were preconditioned for 3 days with either normal trough water (control treatment) or DCD-treated trough water (DCD treatment), since Ledgard et al. (Reference Ledgard, Menneer, Dexter, Kear, Lindsey, Peters and Pacheco2008a ) indicated that this was sufficient time for urine DCD concentrations to reach equilibrium levels. The treatment groups then consecutively grazed each plot for 24 h from 08·00 h and were allocated a targeted total daily feed intake of 11 kg dry matter (DM)/cow/day. The daily feed intakes of the treatment groups comprised of c. 7 kg DM/cow/day of pasture and were supplemented in the plots with 3–5 kg DM/cow/day of cereal-based concentrate (Seales Premium Quality Dairy Pellets; 23·0 g N/kg) to maintain total feed requirements.
Prior to grazing each plot, portable water troughs (650 l capacity) were manually filled from the farm water supply. Crystalline DCD powder (>0·995 purity) was dissolved into the assigned DCD-treated water troughs, thoroughly mixed and sub-sampled (60 ml) for DCD analysis at c. 08·00 h. On a couple of occasions when water intake by cows was relatively high, the DCD-treated water troughs were manually refilled during the 24-h grazing period to ensure adequate daily water supply. The concentration of DCD in the trough-water ranged from 1·5 to 6·0 g/l over the two grazing periods. The DCD concentration in the trough water was adjusted daily, based on the previous 24 h water intake. Daily water intakes for both treatments were recorded manually by measuring the difference in water level over the 24-h period. The average daily water intake was calculated by the total volume of water consumed by each treatment group over the 24-h period divided by the number of cows in each group and expressed on a per cow basis (l/cow/day). On completion of each grazing period the cows returned to standard grazing within the common herd.
Approval for conduct of the trial was obtained from the Ruakura Crown Research Institute Animal Ethics Committee and from the Agricultural Compounds and Veterinary Medicines group (ACVM) of the former New Zealand Food Safety Authority. The latter set minimum default withholding periods of 35 days for milk (i.e. at least 35 days elapsed after final DCD treatment before cows were milked, which was achieved by using late-calving cows in the current study) and 91 days for meat (i.e. cows were retained on the farm for at least 91 days after final DCD treatment, which was achieved since the cows eventually returned to the main milking herd).
Herbage mass and feed intake measurements
Herbage mass (pre- and post-grazing) was assessed using a rising plate meter (RPM; Thomson et al. Reference Thomson, Upsdell, Hooper, Henderson, Blackwell, McCallum, Hainsworth, Macdonald, Wildermoth, Bishop-Hurley and Penno2001) for the June and August grazing rotations. Forty RPM measurements were taken within each plot and the average compressed pasture height converted into a DM figure using the established winter calibration equation for New Zealand perennial ryegrass-clover pastures (Herbage mass=plate meter reading×140+500). The estimated herbage intake (kg DM/cow/day) for each 24-h period was the difference between the pre- and post-grazing herbage mass, divided by the number of cows in each treatment group. Total daily feed intake (kg DM/cow/day) was calculated as the sum of herbage and supplementary feed consumed.
Ceramic cup installation and leachate sampling
Porous ceramic cup samplers were used to sample soil solution at 600 mm below the soil surface (e.g. Weihermüller et al. Reference Weihermüller, Siemens, Deurer, Knoblauch, Rupp, Göttlein and Pütz2007). Samplers (ten per plot, 120 per treatment) were installed diagonally from the soil surface to ensure soil solution samples were taken below undisturbed soil (Weihermüller et al. Reference Weihermüller, Siemens, Deurer, Knoblauch, Rupp, Göttlein and Pütz2007) and located at least 6 m from the plot boundary and water troughs to obtain soil solution samples from a representative area. Samples of soil solution were collected at intervals of c. 40 mm drainage by manually applying a vacuum (c. 20 kPa) for 24 h to the ceramic cup samplers. Soil solution samples were immediately frozen prior to analysis for inorganic-N (ammonium-N (NH4 +-N) and NO3 −-N) and DCD.
Nitrous oxide emission measurements
A static chamber technique was used to measure N2O emissions based on the methodology described by Luo et al. (Reference Luo, Ledgard and Lindsey2007). In brief, the sampling chambers were modified PVC ‘Sewer-hatches’ (250 mm diameter and 300 mm high) attached to 250 mm diameter sections of PVC pipe that were 200 mm high. The ‘Sewer-hatch’ rim had an internal half-turn locking system and a greased rubber ‘O’-ring, which formed a gas-tight seal. Chambers were inserted 50–100 mm into the soil before measurements commenced. Chamber heights were measured and each chamber volume calculated.
A total of 24 replicate chambers (12 per treatment) were randomly installed in one pair of the replicate plots before the August grazing and then the chambers were immediately reinstalled following grazing and remained throughout the duration of the sampling period. Sampling was undertaken 6 and 4 days prior to the replicate plots being grazed to measure background N2O emissions. Thereafter, gas sampling was undertaken on 13 occasions over a 58 day sampling period (days 1, 3, 6, 9, 13, 16, 20, 23 30, 37, 44, 51 and 58 after grazing). On each sampling day, gas samples were collected between 11·00 and 13·00 h (representing the daily average rate). Headspace gas samples were taken from each chamber during a cover period of 60 min, at times t 0 and t 60. These were collected using 50 ml polypropylene syringes, with 25 ml of the gas sample transferred into a 12 ml septum-sealed screw-capped glass vial and retained for N2O analyses.
Soil moisture content and mineral nitrogen sampling
Four composite soil samples (25 mm diameter, 0–75 mm depth; six soil cores bulked per sample) were also collected from each treatment on the N2O gas sampling days for gravimetric soil water content and mineral-N (NH4 +-N and NO3 −-N) determination. The volumetric water contents were calculated by multiplying gravimetric soil water contents by bulk density. Soil water filled pore space (WFPS) was calculated by dividing volumetric water content by total soil porosity (Luo et al. Reference Luo, Ledgard and Lindsey2007).
Analyses of soil, leachate and gas samples
The field-moist composite soil samples collected on each gas sampling day were immediately sieved (4 mm) and mixed thoroughly before being extracted with 2 m KCl for analysis of ammonium-N and nitrate-N (Blakemore et al. Reference Blakemore, Searle and Daley1987). The concentrations of NH4 +-N and NO3 −-N (including nitrite-N) in the leachate and soil extracts were determined colourmetrically using a Skalar SAN++ segmented auto flow analyser (Skalar Analytical B.V., Breda, Netherlands). To calculate the amount of N leached, the sample N concentration was multiplied by the volume of water that drained below 600 mm. These drainage volumes were determined using a water balance model (Woodward et al. Reference Woodward, Barker and Zyskowski2001) in conjunction with soil monolith lysimeters (400 mm diameter×600 mm depth) located on-site. A subsample (2 ml) of leachate from each collector in the DCD treatment was bulked on a plot basis for each sampling and analysed for DCD concentration by high performance liquid chromatography (Shimadzu Corporation, Kyoto, Japan), using a Bio-Rad Aminex® organic acid column HPX-87H (300×7·80 mm I.D.), following a method based on that of Schwarzer & Haselwandter (Reference Schwarzer and Haselwandter1996).
Gas samples were analysed for N2O concentration using a Shimadzu GC-17A gas chromatograph equipped with a 63Ni-electron capture detector (oven, valve and detector temperatures operated at 65, 100 and 280 °C, respectively) with oxygen-free N as a carrier gas. A preliminary study indicated that the increases in N2O concentrations within the chamber headspace were linear over a sampling period of up to 60 min. Therefore, N2O fluxes were calculated (Mosier & Mack Reference Mosier and Mack1980) using linear regression and the ideal gas law from Eqn (1):
 $$F = \rho \times V / A \times {\it\Delta} c / {\it\Delta} t \times 273 / (T \plus 273)$$
where F=flux (mg/m2/h); ρ=density of gas (mg/m3); V=volume of chamber (m3); A=base area of chamber (m2); Δc/Δt=average rate of change of concentration with time (ppmv/h); T=temperature in the chamber (°C).
The hourly emissions were integrated over time, for each chamber, to estimate the total emission over the measurement period for each treatment.
Statistical analyses
Analysis of variance (ANOVA) was performed on the data using the statistical software package GENSTAT (Ninth edition, version 9.1.0.150; VSN International Limited, Hemel Hempstead, UK). Standard errors of difference (SED) values were used to compare means where main effects were found to be significant.
The NO3 −-N leaching data was log transformed for analysis and the geometric means presented. Least significant ratios (LSR<0·05) were used to compare treatments (for comparisons multiply the lower value by the LSR). The DCD leaching data was not transformed, with the arithmetic means and standard error of mean (SEM) presented. The control treatment contained no DCD and was therefore excluded from DCD analyses. The integrated N2O emissions data was log transformed and ANOVA was performed to identify differences between treatments.
RESULTS
Climate
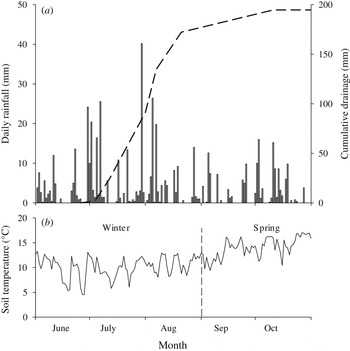
Total rainfall over the 153-day period of study (1 June–1 November 2007) was 528 mm, which was similar to the 30-year long-term average (1977–2006) of 525 mm. The total drainage over the study period was 195 mm, with c. 0·9 of this occurring prior to the August grazing (Fig. 1 a). The mean daily soil temperature (100 mm soil depth) over the trial period was 11·7 °C and ranged from 4·5 to 17·0 °C (Fig. 1 b). Air temperature ranged from –3·7 to 21 °C during the study period.
(a) Daily rainfall (columns) and cumulative drainage (dashed line), and (b) average daily soil temperature (100 mm soil depth) over the 153-day study period (1 June–1 November 2007). Vertical dashed line indicates change in season.

Daily cow water consumption and DCD intake
There was no effect of treatment on daily water intake, which averaged 15 and 18 l/cow/day for the June and August grazing rotations, respectively. However, large variability existed in daily water intake, which ranged from 1 to 32 l/cow/day across grazing periods. Mean daily intake of DCD was 46 and 110 g/cow/day for the June and August grazing rotations, respectively.
Daily cow feed intake
Mean daily pasture intakes were not significantly different between treatments for the June and August grazing rotations (which averaged 7·2 and 7·1 kg DM/cow/day across grazing rotations for the control and DCD treatments, respectively: SED 0·13). This resulted in no treatment effect on the total amount of DM consumed (pasture+supplementary feed), which averaged 10·7 kg DM/cow/day across treatments and the two grazing rotations.
Leaching losses
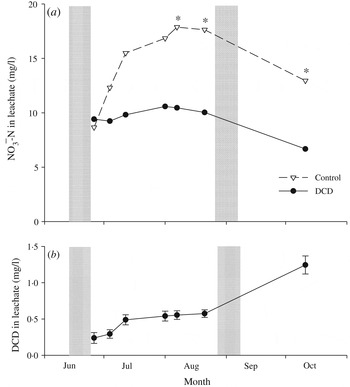
The majority of inorganic-N measured in leachate was in the form of NO3 −-N (accounting for up to 0·98 of the total N leached), with the remainder in the form of NH4 +-N, which was not significantly affected by DCD treatment (data not presented). Concentrations of NO3 −-N in the control treatment increased rapidly to 17·9 mg/l in August following c. 130 mm of drainage (Fig. 2 a). Thereafter, NO3 −-N concentrations in the control treatment subsequently declined to 13·0 mg/l by October. In contrast, the DCD treatment was effective (P<0·05) in restricting NO3 −-N concentrations in leachate to <11·0 mg/l over the entire drainage period (Fig. 2 a). This resulted in a 40% reduction (P<0·05) in total NO3 −-N leaching losses, from 32 kg N/ha in the control treatment to 19 kg N/ha in the DCD treatment (SED=5·8).
Concentrations of (a) nitrate-N (NO3 −-N) and (b) dicyandiamide (DCD) in leachate (mg/l; 600 mm soil depth) over the study period. Grey solid bars indicate June and August grazing rotations. (a) Least significant ratios (LSR; <0·05) at each sampling; 2·14, 1·59, 1·60, 1·64, 1·71, 1·67, 1·71 (not significant unless designated * P<0·05), and (b) vertical bars indicate standard error of the mean.

Concentrations of DCD in leachate from the DCD treatment steadily increased over the drainage period and peaked at 1·25 mg/l (Fig. 2 b). The total amount of DCD leached during the drainage period averaged 1·1 kg DCD/ha and represented an N loss of 0·73 kg N/ha (DCD=670 g N/kg).
Nitrous oxide emissions and soil nitrogen dynamics
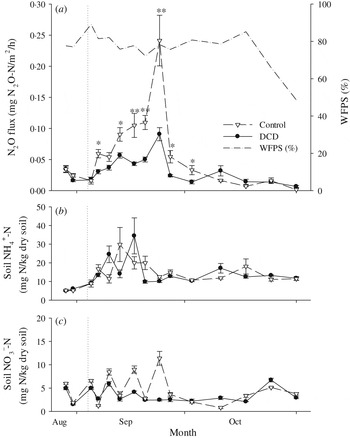
Soil WFPS remained relatively high at c. 80% through to mid-October, and then declined rapidly to <50% by November (Fig. 3 a). In both treatments, soil NH4 +-N concentrations increased following grazing to a maximum concentration of c. 35 mg N/kg dry soil at 13 days after grazing (Fig. 3 b). This was paralleled with a trend of elevated soil NO3 −-N concentrations in the control treatment over the first 20 days after grazing (up to 12 mg N/kg dry soil; Fig. 3 c). In contrast, NO3 −-N concentrations in the DCD treatment remained relatively low (<4 mg N/kg dry soil) throughout the 58-day sampling period (Fig. 3 c).
(a) Hourly nitrous oxide fluxes (mg N2O-N/m2/h) and soil water filled pore space (WFPS; %), and concentrations (mg N/kg dry soil) of (b) ammonium-N (NH4 +-N) and (c) nitrate-N (NO3 −-N) in soil (0–75 mm depth) at sampling times following the August grazing (vertical dotted line). Vertical bars indicate standard error of the mean. Not significant unless designated *P<0·05, ** P<0·01.

Fluxes of N2O prior to the August grazing were relatively low and similar between treatments (<0·05 mg N2O-N/m2/h; Fig. 3 a). Following grazing, N2O fluxes increased rapidly in the control treatment, reaching a peak flux of 0·24 mg N2O-N/m2/h at 20 days after grazing (Fig. 3 a). The DCD treatment showed a significantly lower (P<0·05) pattern of N2O loss compared with the control treatment (Fig. 3 a). In both treatments, N2O fluxes were similar to background (i.e. pre-grazing) levels by 37 days after grazing. The total N2O loss over the entire 58 days of measurement was significantly reduced (P<0·05) from 0·49 kg N2O-N/ha in the control treatment to 0·27 kg N2O-N/ha in the DCD treatment (SED=0·083).
DISCUSSION
The current preliminary study has demonstrated that administering DCD in trough water to non-lactating dairy cows for excretion in urine was effective in reducing NO3 −-N leaching and N2O emissions by c. 40% under grazing. This represents a novel mitigation technique to specifically target urine patches to reduce N losses from agricultural systems, although details of practical application and implications for DCD residues in animal tissues (e.g. milk and meat) are still to be investigated and this is currently underway.
Water intake by dairy cows varies depending on fluctuations in climatic conditions (e.g. air temperature, humidity and rainfall), feed intake levels and composition (e.g. DM and sodium content), and animal physiology factors (Murphy Reference Murphy1992; Lukas et al. Reference Lukas, Reneau and Linn2008). The current study showed that average daily water intake by dairy cows was relatively constant over the two grazing periods, but was associated with large daily variation (ranging from 1 to 32 l/cow/day). This meant that variations in daily water intake resulted in fluctuations in the intake of DCD and subsequently the level of DCD excreted in the urine and deposited onto soil. Fluctuations in daily water intake were compensated for, to a degree, by adjusting the concentration of DCD in the trough water based on the previous 24 h water intake to reduce variability in daily intake of DCD. Potentially, the administration of DCD in animal drinking water could be achieved through a variety of established water trough dispenser systems but there would be a requirement to maintain sufficient levels in trough water for intake of DCD by cattle to achieve effective levels excreted in the urine. Further research is ongoing to ascertain the optimum DCD concentration in water troughs in relation to climatic conditions and soil type to maximize environmental benefits.
Broadcast application of DCD onto soil monolith lysimeters treated with urine has been shown to decrease NO3 −-N leaching losses by c. 60% (reviewed by Clough et al. Reference Clough, Di, Cameron, Sherlock, Metherell, Clark and Rys2007) and under grazed pasture systems by c. 20–50% annually (Ledgard et al. Reference Ledgard, Ghani, Redding, Sprosen, Balvert, Smeaton, Currie and Yates2008b ; Monaghan et al. Reference Monaghan, Smith and Ledgard2009). The current study showed that administration of DCD in water troughs to dairy cows was also effective in reducing NO3 −-N leaching losses by 40% from a grazed pasture. Approximately 90% of the drainage had occurred prior to the August grazing and coincided with the emergence of peak NO3 −-N concentration. This suggested that the predominant source of NO3 −-N leaching during the trial period was primarily attributed to the June grazing and administration of DCD in trough water during this grazing provided the most benefit. Application of DCD will have increased retention of NH4 +-N in the surface soil thereby increasing the likelihood of subsequent plant N uptake and removal via other N processes (e.g. microbial immobilization) over the spring-autumn period. However, some leaching of residual N cannot be discounted.
A relatively high daily intake of DCD by dairy cows was used in the current study because concentrations of DCD in the urine have been shown to vary by an order of magnitude between individual ruminants (Ledgard et al. Reference Ledgard, Menneer, Dexter, Kear, Lindsey, Peters and Pacheco2008a ; Welten et al. Reference Welten, Ledgard, Schipper, Waller, Kear and Dexter2013b ). Based on the average daily DCD intake of 46 g DCD/cow/day during the June grazing, and c. 0·8 of the consumed DCD being excreted in urine (Ledgard et al. Reference Ledgard, Menneer, Dexter, Kear, Lindsey, Peters and Pacheco2008a ; O'Connor et al. Reference O'connor, Hennessy, Lynch, Slattery and Lewis2013), with cows urinating 12 times per day on a surface area of 0·4 m2 per urination (Haynes & Williams Reference Haynes and Williams1993), the average rate of DCD applied in urine patches could have been c. 80 kg/ha. In the majority of field studies, lower application rates of 10–30 kg/ha have been shown to be effective in reducing NO3 −-N leaching losses from urine patches (Di & Cameron Reference Di and Cameron2005; Menneer et al. Reference Menneer, Sprosen and Ledgard2008b ). This means a much lower total daily amount of DCD could potentially be administered to dairy cows to achieve an effective reduction in N losses, but this requires further research.
Leaching of DCD from pastoral soils can be an important loss pathway (Shepherd et al. Reference Shepherd, Wyatt and Welten2012). The total amount of DCD leached in the current study (1·1 kg/ha) is at the lower range of values (0·5–27 kg/ha) measured below 450–900 mm in some studies (Corré & Zwart Reference Corré and Zwart1995; Menneer et al. Reference Menneer, Ledgard and Sprosen2008a ; Monaghan et al. Reference Monaghan, Smith and Ledgard2009; Shepherd et al. Reference Shepherd, Wyatt and Welten2012; Welten et al. Reference Welten, Ledgard, Schipper and Judge2013a ). However, concentrations of DCD in leachate increased over the drainage period and the potential for additional leaching in the subsequent drainage period cannot be discounted.
Application of DCD to urine-affected areas of pasture has been shown to decrease N2O emissions by c. 70% (reviewed by Clough et al. Reference Clough, Di, Cameron, Sherlock, Metherell, Clark and Rys2007). Within a grazed pasture system, Luo et al. (Reference Luo, Ledgard and Lindsey2013) showed that broadcast application of DCD reduced N2O emissions by 41–53% from grazed pasture over three consecutive years. In the current paper, a reduction of 45% in N2O emissions was measured, supporting the viability of DCD administration in water troughs to dairy cows as an effective mitigation approach for reducing N2O emissions from grazed pastures. The decrease in N2O emissions was primarily attributed to DCD effectively retarding nitrification in soil, which resulted in less production of nitrate substrate for the denitrification process (Fig. 3).
In summary, administration of DCD in water troughs to non-lactating dairy cows managed under an intensive grazing system was effective in reducing NO3 −-N leaching and N2O emissions by c. 40%. Further research is required on the practical implementation of this N mitigation technique.
The research was supported by the New Zealand Ministry of Business, Innovation and Employment. The authors thank John Waller for support with statistical analysis; Amanda Judge, Mike Sprosen and Alec McGowan for assistance in setting up and running the study; and Martin Kear, Stuart Lindsey, Moira Dexter, Sheree Balvert and Bridget Wise for analytical support. We also gratefully acknowledge Phil Martin and Ruakura dairy farm staff for assistance with stock handling. Two anonymous reviewers and the editor are thanked for constructive comments on the manuscript.