

Introduction
Soybean (Glycine max (L.) Merr.), an important cash crop, was domesticated in China approximately 3000 to 5000 years ago and is currently cultivated mainly in China, the USA, Brazil and Argentina. Soybean can provide 69 and 30% of dietary protein and oil, respectively (Lam et al., Reference Lam, Xu, Liu, Chen, Yang, Wong, Li, He, Qin, Wang, Li, Jian, Wang, Shao, Wang, Sun and Zhang2010). Many studies on soybean genetic diversity (GD) have been carried out using different molecular markers and different germplasms, all of which showed wild soybeans to be more genetically diverse than cultivated soybeans (Gai et al., Reference Gai, Xu, Gao, Shimamoto, Abe, Fukushi and Kitajima2000; Xu and Gai, Reference Xu and Gai2003; Kuroda et al., Reference Kuroda, Kaga, Tomooka and Vaughan2006).
The assessment of GD in cultivated soybeans and their wild relatives will provide useful information for soybean improvement, especially regarding the use of wild soybeans in future soybean breeding programmes. Molecular marker techniques have been widely used to characterize GD in wild and cultivated germplasms (Xu and Gai, Reference Xu and Gai2003; Vigouroux et al., Reference Vigouroux, Mitchell, Matsuoka, Hamblin, Kresovich, Smith, Jaqueth, Smith and Doebley2005; Li et al., Reference Li, Li, Zhang, Yang, Chang, Gaut and Qiu2010). Simple sequence repeat (SSR) markers possess a number of advantages over other types of molecular markers, such as high polymorphism, co-dominance, locus specificity, good reproducibility, and distribution throughout the genome, and have been widely used for assessing GD, constructing linkage maps and mapping quantitative trait locus (QTL) in several crops, such as soybean, rice, maize and winter wheat (Vigouroux et al., Reference Vigouroux, Mitchell, Matsuoka, Hamblin, Kresovich, Smith, Jaqueth, Smith and Doebley2005; Wen et al., Reference Wen, Ding, Zhao and Gai2009; Zhang et al., Reference Zhang, Zhang, Wang, Sun, Qi, Wang, Wei, Han, Wang and Li2009, Reference Zhang, Bai, Zhu, Yu and Carver2010). Many SSR markers have been developed for soybean and extensively utilized in genetic map construction, QTL mapping and GD assessment (Song et al., Reference Song, Marek, Shoemaker, Lark, Concibido, Delannay, Specht and Cregan2004; Hwang et al., Reference Hwang, Sayama, Takahashi, Takada, Nakamoto, Funatsuki, Hisano, Sasamoto, Sato, Tabata, Kono, Hoshi, Hanawa, Yano, Xia, Harada, Kitamura and Ishimoto2009; Li et al., Reference Li, Li, Zhang, Yang, Chang, Gaut and Qiu2010; Xu et al., Reference Xu, Li, Li, Wang, Cheng and Zhang2010).
In this study, 74 SSR markers were used to evaluate the GD of wild and cultivated soybeans and to determine the genetic relationships between them.
Materials and methods
Plant materials
A total of 346 soybean accessions, including 219 cultivated accessions and 127 wild accessions, were used in this study. The 219 cultivated accessions have been described by Chao et al. (Reference Chao, Yin, Hao, Zhang, Song, Ning, Xu and Yu2014); 113 of the 127 wild accessions have been described by Hu et al. (Reference Hu, Zhang, Zhang, Kan, Hong and Yu2014) with another 14 lines from Heilongjiang province in China. All the plant materials were provided by the National Center for Soybean Improvement of China.
Seventy-four SSR markers, selected from published genetic maps (Song et al., Reference Song, Marek, Shoemaker, Lark, Concibido, Delannay, Specht and Cregan2004; Hwang et al., Reference Hwang, Sayama, Takahashi, Takada, Nakamoto, Funatsuki, Hisano, Sasamoto, Sato, Tabata, Kono, Hoshi, Hanawa, Yano, Xia, Harada, Kitamura and Ishimoto2009), were used to genotype the 346 accessions. Genotyping was performed using the method described previously by Wen et al. (Reference Wen, Ding, Zhao and Gai2009).
The total number of alleles, GD and polymorphism information content (PIC) were calculated using the PowerMarker version 3.25 software (Liu and Muse, Reference Liu and Muse2005). To evaluate the reduction in GD, the ΔGD parameter was used as described by Vigouroux et al. (Reference Vigouroux, Mitchell, Matsuoka, Hamblin, Kresovich, Smith, Jaqueth, Smith and Doebley2005), where ΔGD = 1 − G C/G W and G C and G W are the GD of the cultivated and wild soybeans, respectively. The Kruskal–Wallis (KW) test was carried out using R language to determine the statistical significance of the differences in GD between the cultivated and wild soybean accessions (R Development Core Team, 2010).
Principal coordinate analysis (PCoA) based on Nei's (1972) genetic distance was conducted using the DARwin version 5.0 software to estimate the genetic relationship among the accessions (Perrier and Jacquemoud-Collet, Reference Perrier and Jacquemoud-Collet2006). The first two principal components were plotted for visual examination of the grouping pattern of the accessions.
A neighbour-joining tree was constructed using a neighbour-joining algorithm based on the natural log transformation of the proportion of shared alleles, and it is available in the DARwin version 5.0 software package (Perrier and Jacquemoud-Collet, Reference Perrier and Jacquemoud-Collet2006).
Results and discussion
Genetic diversity
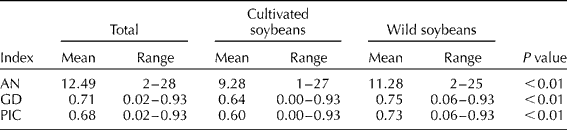
In all the 346 accessions, 924 alleles were detected using the 74 SSRs, with an average of 12.49 alleles per locus. The number of alleles per locus ranged from two (GMES3693) to 28 (satt210). In the 219 cultivated soybean accessions, 687 alleles were detected, with an average of 9.28 alleles per locus. In the 127 wild soybean accessions, 835 alleles were detected, with an average of 11.28 alleles per locus (Table 1). There were 237 wild-soybean-specific alleles and 89 cultivated-soybean-specific alleles, which indicated that many alleles had been lost during domestication and a few had been acquired or produced. These changes may have occurred as only a limited number of accessions were used during domestication (Doebley et al., Reference Doebley, Gaut and Smith2006; Caicedo et al., Reference Caicedo, Williamson, Hernandez, Boyko, Fledel-Alon, York, Polato, Olsen, Nielsen, McCouch, Bustamante and Purugganan2007). These altered alleles accounted for 35.28% of all the alleles in the sample. It is relatively common for domesticated specimens to exhibit less GD than their wild relatives. In general, they exhibit approximately two-thirds of the GD of their wild relatives (Buckler et al., Reference Buckler, Thornsberry and Kresovich2001).
Summary of the statistical analysis of genetic diversity (GD) and of differences between the wild and cultivated soybeans

AN, total allele number; PIC, polymorphism information content.
In the whole sample, GD ranged from 0.02 (GMES3693) to 0.93 (satt614), with an average of 0.71, and the PIC ranged from 0.02 (GMES3693) to 0.93 (satt614), with an average of 0.68. In the cultivated accessions, GD ranged from 0.00 to 0.93, with an average of 0.64, and the PIC ranged from 0.00 to 0.93, with an average of 0.60. In the wild accessions, GD ranged from 0.06 to 0.93, with an average of 0.75, and the PIC ranged from 0.06 to 0.93, with an average of 0.73 (Table 1).
Comparison of GD between the cultivated and wild soybean populations
The wild soybean accessions had more alleles, more GD and higher PIC values than the cultivated soybean accessions (P< 0.01) (Table 1), despite the smaller sample size of the wild soybean accessions than the cultivated soybean accessions (127 compared with 219). The cultivated soybean accessions were found to be considerably less diverse than the wild soybean accessions with a 23.05% deficit in the cultivated soybean accessions relative to the wild soybean accessions, which is less than the deficit detected in an analysis carried out by Hyten et al. (Reference Hyten, Song, Zhu, Choi, Nelson, Costa, Specht, Shoemaker and Cregan2006). Kuroda et al. (Reference Kuroda, Kaga, Tomooka and Vaughan2006) analysed the microsatellite variation of 616 Japanese wild soybean lines and 53 cultivated soybean lines using 20 SSR markers and found that Nei's diversity value of the cultivated soybean lines was only 57% of that of the wild soybean lines. The KW test carried out in the present study indicated that the wild soybean accessions had more GD, higher PIC values and more alleles per locus than the cultivated soybean accessions.
Genetic structure of the wild and cultivated soybean populations
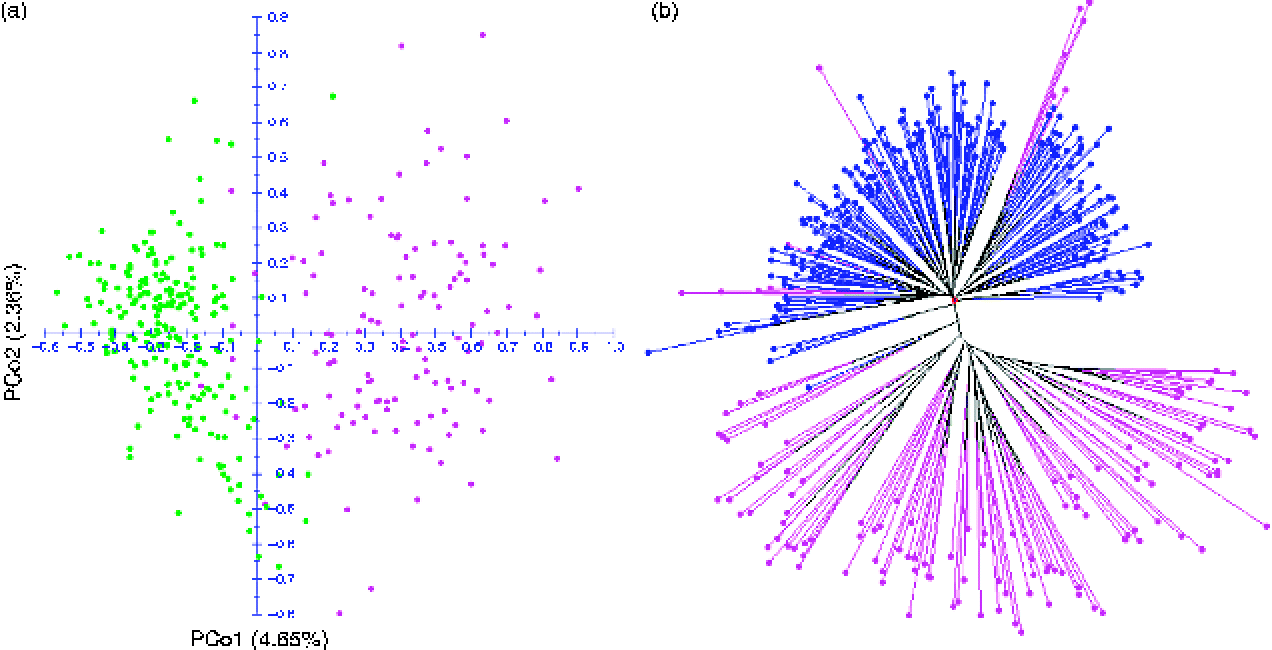
To further assess the relationships among the accessions, PCoA was conducted using DARwin version 5.0. Two groups of accessions were identified, with axis 1 discriminating between the cultivated and wild soybean accessions. The apparent sharing between groups must be carefully considered because the first two axes represented 7.01% of the global diversity. We were able to determine genetic proximity. The first coordinate explained 4.65% of the variation and the second coordinate explained 2.36% (Fig. 1(a)).
Principal coordinate analysis (PCoA) and neighbour-joining tree of the 346 accessions. (a) PCoA of the cultivated and wild soybeans. PCo1 and PCo2 are the first and second principal coordinates, which account for 4.65 and 2.36% of the total variation, respectively. Green spots represent cultivated soybeans and red spots represent wild soybeans. (b) Neighbour-joining tree constructed for the 346 accessions using the log-transformed proportion of the shared allele distance. Blue lines represent cultivated soybeans and red lines represent wild soybeans.

Phylogenetic analysis
The neighbour-joining tree, constructed based on genetic distances, showed two major clusters: G. max and G. soja (Fig. 1(b)). We found some mix lines, which is consistent with the results of the PCoA. We also found the genetic distances among the wild soybean accessions to be greater than those among the cultivated soybean accessions (Fig. 1(b)).
The results of this study indicated that wild soybeans possess higher GD than cultivated soybeans and we were able to classify all the accessions into two major clusters, corresponding to the wild and cultivated soybeans. These results increase our understanding of the genetic differences and relationships between wild and cultivated soybeans and provide information that can be used for the development of future breeding strategies to improve soybean yields.
Acknowledgements
This study was supported by the National Basic Research Program of China (973 Program) (2010CB125906) and the National Natural Science Foundation of China (31171573, 31271749, and 31301341).