Introduction
Malnutrition among children continues to be one of the world’s most serious child health and child development issues (Deaton & Dreze, Reference Deaton and Dreze2009). It is a major concern for researchers, academics and policymakers owing to its far reaching consequences, which go beyond the level of individual health and well-being and extends across generations (Martorell & Zongrone, Reference Martorell and Zongrone2012). Evidence suggests that a lack of proper nutrition can increase the risk of childhood morbidity, lead to poor physical and cognitive development resulting in poor school performance, reduced adult size, a reduced capacity to work, loss of productivity and wages, increased health care costs and even initiate the poverty trap (Caulfield et al., Reference Caulfield, Richard, Rivera, Musgrove and Black2006; Grantham et al., Reference Grantham-McGregor, Cheung, Cueto, Glewwe, Richter and Strupp2007; Walker et al., Reference Walker, Wachs, Gardner, Lozoff, Wasserman and Pollitt2007; Tarozzi & Mahajan, Reference Tarozzi and Mahajan2007; Lim et al., 2012; Dewey & Begum, Reference Dewey and Begum2011; UNICEF, 2011; Martorell & Zongrone, Reference Martorell and Zongrone2012). It is also known to be associated with poor survival outcomes (Black et al., Reference Black, Allen, Bhutta, Caulfield, de Onis and Ezzati2008; Hoddinott et al., Reference Hoddinott, Maluccio, Behrman, Flores and Martorell2008).
Undernutrition, which is responsible for nearly half (45%) of child deaths among under-five children worldwide, results in 3.1 million child deaths annually (Black et al., Reference Black, Victora, Walker, Bhutta and Christian2013). India has one of the world’s highest percentages of malnourished children under the age of five (43%), surpassed only by Bangladesh, Yemen and Timor-Leste (UNICEF, 2008), and this contributes to a high child mortality rate (Bharati et al., Reference Bharati, Pal and Bharati2008; Krishnan et al., Reference Krishnan, Nawi, Kapoor, Pandav and Byass2012). Therefore, an acceleration of policies and programmes to improve the nutritional status of children in the country is required.
The clustering of underweight children, defined as the concentration of underweight children among a subgroup of the population, has received little attention in India. The problem of clustering of underweight children at the sibling and family level has a conceptual similarity to death clustering. For example, studies worldwide indicate that the incidence of childhood deaths is not randomly distributed across families, but, rather, that there is a clustering of death among siblings (Curtis et al., Reference Curtis, Diamond and McDonald1993; Guo, Reference Guo1993; Zenger, Reference Zenger1993; Arulampalam & Bhalotra, Reference Arulampalam and Bhalotra2006; Øyen et al., Reference Øyen, Boyd, Poulsen, Wohlfahrt and Melbye2009; Saha & Soest, Reference Saha and Soest2011). In a broad sense, clustering of underweight children, parallel to death clustering, may be expressed as heterogeneity in the risk of underweight children between subgroups of the population. Individual clustering can be understood as the underweight sibling related to another underweight sibling within the same family, while family-level clustering is the concentration of multiple underweight children among a small fraction of underweight mothers in family/families (Sastry, Reference Sastry1997; Pradhan & Arokiasamy, unpublished data; Omariba et al., Reference Omariba, Rajulton and Beaujot2008).
Studies have shown that clustering of underweight children occurs heavily among the families of poor socioeconomic status (Pande, Reference Pande2003; Pande & Yazbeck, Reference Pande and Yazbeck2003; Mishra et al., Reference Mishra, Roy and Retherford2004; Pal & Ghosh, Reference Pal and Ghosh2007; Kumar & Mohanty, Reference Kumar and Mohanty2011a, Reference Kumar and Mohantyb); still, the question arises as to why some families experience disproportionately higher levels of clustering of underweight children and not all families. Is genetic frailty an important cause of clustering of underweight children? Previous research on child nutrition in India has mainly dealt with the role of various socioeconomic, maternal and environmental factors in determining the levels and pace of child nutrition transition (Arokiasamy, Reference Arokiasamy2004; Bharati et al., Reference Bharati, Pal and Bharati2008; Subramanyam et al., Reference Subramanyam, Kawachi, Berkman and Subramanian2011; Fenske et al., Reference Fenske, Burns, Hothorn and Rehfuess2013; Kumar & Ram, Reference Kumar and Ram2013; Meshram et al., Reference Meshram, Balakrishna, Arlappa, Rao, Laxmaiah and Brahmam2014). These studies have identified a number of factors associated with the nutritional status of children in India. However, there has been very little research on clustering of underweight children at the sibling (individual) and family level in the country. Heterogeneity in the prevalence of underweight children also has considerable implications for child nutrition programmes. Developing an understanding of clustering of underweight children can help in formulating intervention policies on heterogeneity in the prevalence of underweight children. Therefore, the objective of this study was to assess the level and pattern of clustering of underweight children at the sibling (individual) and family level in the northern Indian state of Uttar Pradesh.
Methods
Data
Data were from the third (2005–06) National Family Health Survey (NFHS-3). The study focused on Uttar Pradesh, which is the most populous state of northern India with a population of 199 million (Office of the Registrar General and Census Commissioner, India, 2011), i.e. 16% of the total Indian population. The state lags behind in demographic, health and child nutrition indicators compared with all the major states of India. The NFHS-3 collected detailed information on fertility, mortality, family planning and important aspects of nutrition, health and health care from a nationally and state-representative sample. It also collected information on household condition, economic status, household amenities and women’s background characteristics, and the complete birth histories of women, including each child’s date of birth, sex and survival status. It included health questions for children up to age five years: breast-feeding status, immunization, measurement of height and weight, occurrence of diarrhoea, fever and acute respiratory infection. Also, nutritional information was gathered for all children under age five in the household. Data on childhood health care are available for children born in the last 5 years preceding the survey. The NFHS-3 survey covered a representative sample of 10,026 households for Uttar Pradesh, and 12,183 women in the age group 15–49 years and 11,458 men in the age group 15–54 years were interviewed. The analytical sample size for this study consisted of 7533 children under the age of five.
Outcome variable
Child underweight (low weight-for-age) was the outcome indicator for poor child nutritional status. Underweight, a measure of protein–energy undernutrition, is defined as those children aged 0–59 months with a weight-for-age measurement less than −2SD below the median value of the reference population. Underweight children are estimated based on an international reference population recommended by the World Health Organization (WHO Multicenter Growth Reference Study Group, 2006) and accepted by the Government of India. The WHO standard adopted a prospective approach describing how healthy children should grow. The use of underweight has been supported by previous studies, which have suggested that underweight is a comprehensive indicator of child nutritional status (Deaton & Dreze, Reference Deaton and Dreze2009).
Explanatory variables
The nutritional status of any previous sibling and that of the mother within the household are the key explanatory variables for the sibling-level clustering of underweight children. The nutritional status of any previous sibling was classified as underweight (no, yes). Body mass index (BMI, kg/m2) was the indicator of mother’s nutrition status. Mother’s BMI was calculated from the heights and weights of women aged 15–49 years collected by the NFHS-3 and classified according to the WHO cut-offs, i.e. underweight, BMI<18.5; normal weight, BMI 18.50–4.99; and overweight/obese; BMI≥25. Women who were pregnant at the time of the survey and women who gave birth during the two months preceding the survey were excluded.
The following bio-demographic, socioeconomic and health care variables were used as predictors: sex (male and female); age of mother at birth of the child, categorized as: <18 years, 18–24 years, 25–34 years and 35–49 years. An important departure is the use of a newly constructed combination variable of birth order and birth interval. Earlier analyses have dealt with the effects of birth order and birth interval separately. However, a recent study by Arokiasamy and Gautam (Reference Arokiasamy and Gautam2008) used a variable combining birth order and birth interval to examine their combined effect on the nutritional status of children (first order; order 2–3 and <24 months; order 2–3 and ≥24 months; order 3+ and <24 months; and order 3+ and ≥24 months). Birth order and birth interval are two closely related bio-demographic variables that often have compounding effects if they are treated separately. The reason is that higher birth order children are generally associated with shorter birth intervals in view of the larger number of births, and vice versa. Therefore, the composite index of birth order with birth interval classification is helpful to determine the relative effects of birth order and birth interval.
The study also included size of child at birth (small, medium, large), duration of breast-feeding (<12 months, 12–18 months, 18+ months), place of residence (urban, rural), religion (Hindu, other), caste (scheduled castes and scheduled tribes (SC/STs), other backward castes (OBCs) and other) and wealth index (low, middle, and high). A household wealth quintile was estimated for each household on the basis of ownership of various assets and housing conditions. Other explanatory variables were: mother’s education (no education, up to primary-level completed, up to secondary-level completed, and high school and above), mother’s media exposure (no, partial and full), mother’s working status (not working, working) and place of delivery (home, government institution and private institution). Delivery assistance (yes or no) is often cited as the most important dimension of health care for infant and child undernutrition because it is highly correlated with antenatal care as well as immunization and care during the first years of life (Bhat et al., unpublished data). Finally, Caesarean birth (yes, no) is also considered as a predictor as it is believed that those children delivered by Caesarean tend to be at higher nutritional risk.
Ethics
The NFHS survey was conducted under the scientific and administrative supervision of the International Institute for Population Sciences, Mumbai, India, an autonomous institute under the Ministry of Health and Family Welfare, Government of India. The institute conducted an independent ethics review of the NFHS protocol. Data collection procedures were also approved by the ORC Macro (Calverton, MD, USA) institutional review board. Oral informed consent for the interview/survey and measurements was obtained by interviewers from the participating mothers (IIPS, 2007). The analysis was carried out anonymously, using publicly available secondary data and with no identifiable information on the survey participants, for which ethical approval is not required.
Statistical analysis
The sibling-level clustering of underweight children was examined using binary logistic modelling (Koening et al., Reference Koening, Philips, Campbell and D’Souza1990; Lantz et al., Reference Lantz, Parting and Palloni1992; Miller et al., Reference Miller, Trussell, Pebley and Vaughan1992; Gribble, Reference Gribble1993; Omariba et al., Reference Omariba, Rajulton and Beaujot2008); that is, to determine whether an underweight child in a family is related to any previous underweight sibling in the same family after controlling for bio-demographic, socioeconomic and health care variables. In the regression model, the nutritional status of any previous sibling within the family was incorporated as a variable to assess sibling-related clustering of underweight children in the form of the index child. It is also important to recognize that the incidence of clustering of underweight children can occur in the reverse way; that is, in all cases of multiple underweight siblings, an underweight child can either be preceded by an older sibling or followed by another underweight younger sibling in the family. In essence, this suggests that multiple underweight siblings are more likely to be clustered in the same family.
The logistic regression model is commonly used when the independent variables include both numerical and nominal measures and the outcome variables (dependent variables) are binary or dichotomous. The advantage of logistic regression analysis is that it requires no assumption about the distribution of the independent variables. Another advantage is that the regression coefficient can be interpreted in terms of odds ratios. The logistic regression model is commonly estimated by a maximum likelihood function. For the dependent variables, the logistic model takes the following form:
 $${\rm Logit}\,p\,{\equals}\,b_{0} {\plus}b_{1} x_{1} {\plus}b_{2} x_{2} {\plus}b_{3} x_{3} {\plus}\,\ldots\,{\plus}b_{k} x_{k} {\plus}e_{k} $$
 $${\rm Logit}\,p/1{\minus}p\,{\equals}\,b_{0} {\plus}b_{1} x_{1} {\plus}b_{2} x_{2} {\plus}b_{3} x_{3} {\plus}\,\ldots\,{\plus}b_{k} x_{k} {\plus}e_{k} $$
where, b 0 is the intercept and b 1 , b 2, b 3, …, b k represent the coefficients of each of the predictor variables in the model, while e k is an error term. The natural logarithms of the odds of the outcomes are represented by e k .
The family-level clustering of underweight children was assessed using the binomial distribution model (E. Ronsmans, unpublished data; Zaba & David, Reference Zaba and David1994; Gupta, Reference Gupta1997; Pradhan & Arokiasamy, unpublished data). Family-level clustering refers to the concentration of underweight children among a small fraction of underweight mothers. It is an extended form of individual-level clustering among siblings. The binomial model is considered suitable to see whether the distribution of the number of underweight children for women follows a certain form. It assesses the extent of heterogeneity or clustering of underweight children, which is measured as the difference between observed and expected number of underweight children by bio-demographic and socioeconomic risk factor classification. This approach estimates the distribution of failure (underweight children) to be expected in a given number of trials with a constant probability of failure. It generates the expected distribution of underweight children in a group of live-born children who are subject to a given nutritional risk. An excess of women with a different number of underweight children over the expected number is taken to indicate clustering.
Under the null hypothesis of no clustering, the distribution of women by the number of underweight children is binomial and the probability of observing k underweight children for women with family size n is given by:
 $$P\left( {X\,{\equals}\,k} \right)\,{\equals}\,(n\,!/k\,!\,(n{\minus}k)\,!\,)p^{k} (1{\minus}p)^{{n{\minus}k}} 0\leq k\leq n.$$
Accordingly, the probability of observing k underweight children for parity 1 women is given by:
 $$P\left( {X\,{\equals}\,k} \right){\equals}(1\,!/k\,!\,(1{\minus}k)\,!\,)p^{k} (1{\minus}p)^{{1{\minus}k}} k\,{\equals}\,0,\,1.$$
The probability of observing 0 (no) underweight children for parity 1 women is given by:
 $$P\left( {X\,{\equals}\,0} \right)\,{\equals}\,p^{0} (1{\minus}p)^{1} \,{\equals}\,q,$$
and the probability of observing 1 underweight child for women of parity 1 is:
 $$P\left( {X\,{\equals}\,1} \right)\,{\equals}\,p^{1} (1{\minus}p)^{0} \,{\equals}\,p.$$
Similarly, the probability of observing k underweight children for women of parity j can be estimated. Further, the expected number of women experiencing j underweight children is:
 $$E\left( j \right)\,{\equals}\,\Sigma w_{i} P\left( {X\,{\equals}\,j/i} \right)\,/\,\Sigma w_{i} .$$
The average number of underweight children among women with n children is np and the variance is np(1−p). The parameter p is estimated from the observed proportion of underweight children among all live births of women of a given age. If the null hypothesis (H 0) is violated, the departure from the chance distribution can be assessed by a χ 2 test, in which the observed distribution of underweight children is compared with the expected distribution under H 0. Rejection of H 0 implies the presence of clustering, but it does not distinguish between different causes. The binomial distribution was fitted to the data using the observed proportion of children who were underweight for all the women within each group of equal family size n and the expected number of women by number of underweight children was later combined for all women. Statistical analysis was performed with the help of statistical software STATA 10 SE (Stata Corporation, 2007).
Results
Background characteristics of study sample
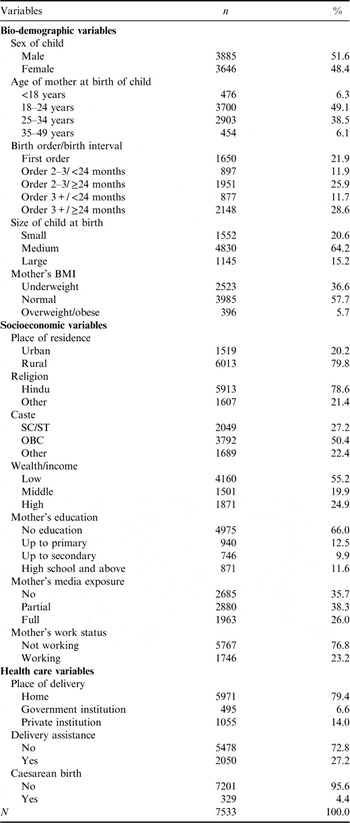
Table 1 presents the descriptive statistics of the study sample of 7533 children. About half of the children (49%) were born to mothers aged 18–24 years, while only 12% children were born to mothers aged less than 18 years and 35–49 years. About a quarter of the children were of birth order 2–3/≥24 months birth interval, and another quarter were birth order 3+/≥24 months birth interval. Only 11% of children were of birth order 3+/<24 months birth interval. About two-thirds (64%) were of normal size at birth, while one in five was of small size at birth. Only 30% were breast-fed for 18+ months. About 36% of the mothers were underweight and 6% were overweight/obese. The majority of the children were from Hindu communities (80%). Similarly, rural children constituted the majority (80%) of the sample. Half belonged to Other Backward Castes (OBCs). More than a quarter (27%) were from Scheduled Castes and Scheduled Tribes (SC/STs), while 22% children belonged to the ‘other’ category. More than half of the children (55%) were from low socioeconomic status households, while only a quarter (24%) were from high socioeconomic status households. Two-thirds (66%) were born to illiterate mothers. More than a third of the mothers (35%) did not have any media exposure. A quarter of children (23%) were born to working mothers. Most of the children (80%) were born at home, and around three-quarters (72%) were born without assistance at the time of delivery.
Percentage distribution of sample childrenFootnote a by bio-demographic, socioeconomic status and health care variables, Indian NFHS, 2005–06

a Children born five years preceding the survey.
Sibling-level clustering of underweight children: logistic model estimates
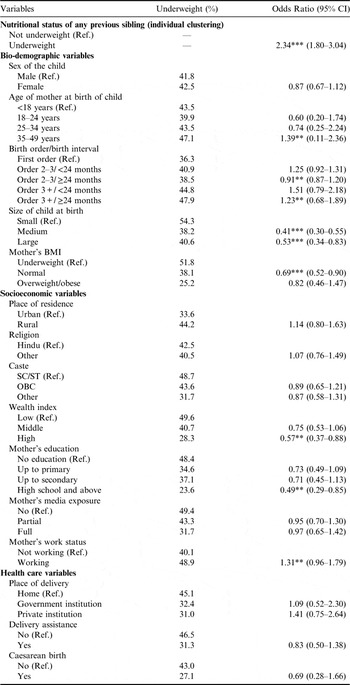
Table 2 presents the results of logistic regression model analysis, which shows the effect of any previous sibling’s nutritional status on the nutritional status of the index child after controlling for bio-demographic, socioeconomic and health care variables. The results reveal that the odds of being underweight for the index child were about two times higher if any of the previous siblings within the household were underweight. After controlling for birth order, if birth interval was longer the odds of child underweight was lower. Children who were of medium and large size at birth had significantly lower odds of being underweight (59% and 47%, respectively) compared with children who were of small size at birth. Similarly, the odds of being underweight were significantly lower (by 31%) for children who were born to normal-weight mothers compared with the children of underweight mothers. Children of ‘other’ caste group were significantly less likely (by 11%) to be underweight than children of scheduled castes and scheduled tribes. The odds of being underweight were significantly lower (by 43%) for children who were born in high socioeconomic status households compared with children born in low socioeconomic status households. The odds of being underweight were significantly lower (by 51%) for children who were born to educated mothers (high school and above) compared with children born to illiterate mothers. On the other hand, the odds of being underweight were significantly higher (by 31%) for the children of working mothers compared with the children of non-working mothers.
Binary logistic model analysis for clustering of underweight children by bio-demographic, socioeconomic and health care variables
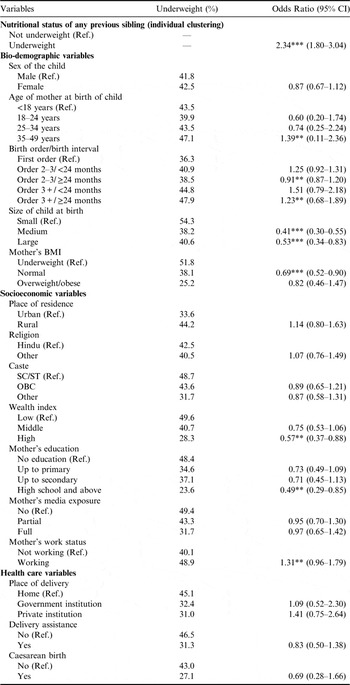
***p≤0.01; **p<0.05.
Family-level clustering of underweight children: binomial model estimates
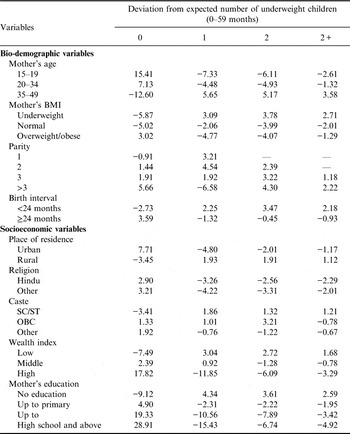
Table 3 shows the observed and expected numbers of underweight children by bio-demographic (maternal) and socioeconomic variables. Significance was taken at p<0.05. A positive deviation from the expected was seen if the mother’s age at the birth of her child was 35+, but the opposite was found if it was either 15–19 or 20–34 years. A positive deviation from the expected was found for 1, 2 and 2+ underweight children for malnourished/underweight women, which was reversed for normal and overweight/obese women. An increasing positive deviation for women with 2 and 2+ underweight children points to the fact that heterogeneity in underweight increases with parity. A higher than expected proportion of women with a pregnancy interval of <24 months was observed with 1, 2 and 2+ underweight children (deviations of 2.25, 3.47, 2.18).
Difference in the observed and expected number of women with different levels of underweight children under the binomial model

A positive deviation (1.93, 1.91 and 1.12) was observed for 1, 2 and 2+ underweight children residing in rural areas as well as for the children of SC/ST mothers. A positive deviation (3.04, 2.72 and 1.68) was found for 1, 2 and 2+ underweight children of low socioeconomic status households, which was reversed for the children of medium and high socioeconomic status households. A positive deviation (4.34, 3.61 and 2.59) was observed for 1, 2, and 2+ underweight children of illiterate mothers.
Discussion
This study examined the extent and pattern of clustering of underweight children at the sibling and family level using NFHS-3 (2005–06) data. The results of the binary logistic regression and binomial distribution models showed that underweight children were clustered among households with underweight siblings, higher parity mothers, mothers aged 35–49 years, children born with shorter birth intervals, those of small size of child at birth, breast-feeding for less than 12 months, underweight mothers, children of SC/ST mothers, low socioeconomic status households, as well as among the illiterate mothers. The prevalence of underweight was much higher for the index child if their siblings were underweight – a clear demonstration of the likelihood of an underweight child being clustered with one or more underweight younger or older sibling; these findings are similar to those of previous studies (Lalou & Mbacke, Reference Lalou and Mbacke1992; Sereebutra et al., Reference Sereebutra, Solomon, Aliyu and Jolly2006). The possible mechanism for such a relationship may be understood through the ‘dilution effect’: as the number of children increases, family resources available to an individual child decrease (Beenstock & Sturdy, Reference Beenstock and Sturdy1990; Bronte-Tinkew & DeJong, Reference Bronte-Tinkew and DeJong2004). The family resources may be either financial, which determine the purchase of health goods, services and food (Doan & Bisharat, Reference Doan and Bisharat1990; Berman et al., Reference Berman, Kendall and Bhattacharya1994; Behrman, Reference Behrman1995, Reference Behrman1998) or the availability of time to care for a child (Blake, Reference Blake1981; Horton, Reference Horton1988; UNICEF, 2013).
Parity is a core determinant of underweight in children, and the clustering of underweight children. This study found a significant association between mother’s parity and the clustering of underweight children. Thus, a heavy concentration of underweight children in general, and multiple underweight children in particular, was demonstrated for mothers who were underweight, illiterate, from low socioeconomic status households, SC/ST, aged 35–49 years and high parity, and for children with shorter birth intervals. On the other hand, educated mothers and those of high socioeconomic status had a lower than expected risk of having underweight children, as well as multiple underweight children. A higher household socioeconomic status explains a major part of the positive deviations for no risk of underweight children and low risks of multiple underweight children. The deviation varied from −9.12 to 28.91 by education of women and from −7.49 to 17.82 by wealth/income for women with no underweight child.
The results further revealed that for the same order of birth, if the birth interval is longer the odds of being underweight are lower. This finding concurs with that of a previous study, which indicated that the impact of birth interval on the nutritional status of children is stronger than that of birth order (Zottarelli et al., Reference Zottarelli, Sunil and Rajaram2007). Underweight children were found to be concentrated among underweight mothers. This supports the hypothesis that there is greater likelihood of multiple underweight children among underweight mothers. One of the possible reasons may be that women of low BMI status give birth to the maximum number of low-birth-weight babies, which ultimately leads to more underweight children. This finding has been supported by previous studies (Pojda & Kelley, Reference Pojda and Kelley2000; Varela-Silva et al., Reference Varela-Silva, Azcorra, Dickinson, Bogin and Frisancho2009; Dekker et al., Reference Dekker, Mora-Plazas, Marín, Baylin and Villamor2010; Subramanian et al., Reference Subramanian, Ackerson and Smith2010). Underweight children were found to be clustered among low socioeconomic status households, as found by previous studies (Mazumdar, Reference Mazumdar2010; Subramanyam et al., Reference Subramanyam, Kawachi, Berkman and Subramanian2010; Pathak & Singh, Reference Pathak and Singh2011). Mother’s education was found to be a robust determinant of the nutritional status of children. Underweight children were found to be extremely clustered among illiterate mothers, and this is in line with the findings of previous studies (Norhayati et al., Reference Norhayati, Noorhayati and Mohammad1997; Delpeuch et al., Reference Delpeuch, Traissac, Martin-Prével, Massamba and Maire2000; Semba et al., Reference Semba, de Pee, Sun, Sari and Akhter2008; Van de Poel et al., Reference Van de Poel, Hosseinpoor, Speybroeck, Van Ourti and Vega2008; Subramanyam et al., Reference Subramanyam, Kawachi, Berkman and Subramanian2010). This may be because illiterate mothers are not only less aware of the necessities and ways and means of providing nutritionally balanced food to children, but are also economically incapable of providing such nutrition-rich food (Bharati et al., Reference Bharati, Pal, Bhattacharya and Bharati2007).
However, the findings of this study should be interpreted with caution in light of certain limitations. The factors responsible for the clustering of underweight children could be bio-demographic, socioeconomic or health related. However, regardless of socioeconomic background, the extent of heterogeneity that certain mothers have with regard to children – for example, certain mothers have no underweight children while others do, and certain mothers have more than one underweight child – cannot be explained by these factors alone. It might have been due to the genetic frailty of mothers passed on to their children, which needs to be investigated in future research.
In conclusion, this study found that underweight children were clustered among mothers with multiple underweight siblings, and this was more pronounced among underweight mothers. Overall, it is mother’s underweight status, in conjunction with their poor socioeconomic status, that drives the nutritional deprivation of children and multiple siblings. Policy intervention needs to focus on the children of households with multiple underweight children. The clustering of underweight children is mediated by a variety of interconnected factors that include, amongst others, size of the child at birth, birth interval, sex composition of siblings, mother’s parity and their poor nutritional status. Understanding such interconnected mechanisms is a subject for further investigation. The children of underweight and uneducated mothers from poor socioeconomic status households need specially focused intervention to improve their nutritional status and well-being. This study strongly recommends further research and advocacy to ensure that appropriate child health and nutrition programmes are included in the national child health and development policy agenda of India.