1. Introduction
High-K calc-alkaline to shoshonitic dykes are widespread in various tectonic settings such as continental arcs, post-collisional arcs and within-plate setting (Müller, Rock & Groves, Reference Müller, Rock and Groves1992; Scarrow et al. Reference Scarrow, Leat, Wareham and Millar1998). The orientation of individual dykes can reflect the stress field at the time of intrusion (Vaughan, Reference Vaughan1996; Hou et al. Reference Hou, Wang, Li and Qian2006), and the dyke swarms may provide important information about the tectonic evolution of orogenic belts (Yang et al. Reference Yang, Chung, Zhai and Zhou2004; Luo et al. Reference Luo, Wei, Xin, Zhan, Ke and Li2006). Moreover, they can be used to identify magma source compositions (Adams et al. Reference Adams, Lentz, Shaw, Williams, Archibald and Cousens2005; Xu et al. Reference Xu, Zhang, Qin and Cai2007) and evolutionary history (Chistyakova & Latypov, Reference Chistyakova and Latypov2008; Mayborn, Lesher & Connelly, Reference Mayborn, Lesher and Connelly2008). Nevertheless, the petrogenesis of these dykes is complex and diverse. They were generally thought to be formed by (1) continental crust contamination of mafic magmas (Currie & Williams, Reference Currie and Williams1993), (2) partial melting of enriched lithospheric mantle either in a subduction-related environment (Tan et al. Reference Tan, Wei, Li, Tan, Guo and Yang2007; Liu et al. Reference Liu, Hu, Gao, Feng, Qi, Zhong, Xiao, Qi, Wang and Coulson2008a) or in the sub-continental lithospheric mantle (SCLM) (Canning et al. Reference Canning, Henney, Morrison and Gaskarth1996; Chen & Zhai, Reference Chen and Zhai2003), (3) mixing of upwelling basaltic magma with the ultrapotassic lithospheric-mantle melt caused by heating and/or thinning of SCLM (Thompson et al. Reference Thompson, Leat, Dickin, Morrison, Hendry and Gibson1990; Xu et al. Reference Xu, Zhang, Qin and Cai2007), or mixing of mantle-derived basaltic or lamproitic melts and crust-derived silicic melts (Prelevic et al. Reference Prelevic, Foley, Cvetkovi and Romer2004; Tan et al. Reference Tan, Wei, Guo, Zhang, Yao, Lu and Li2008).
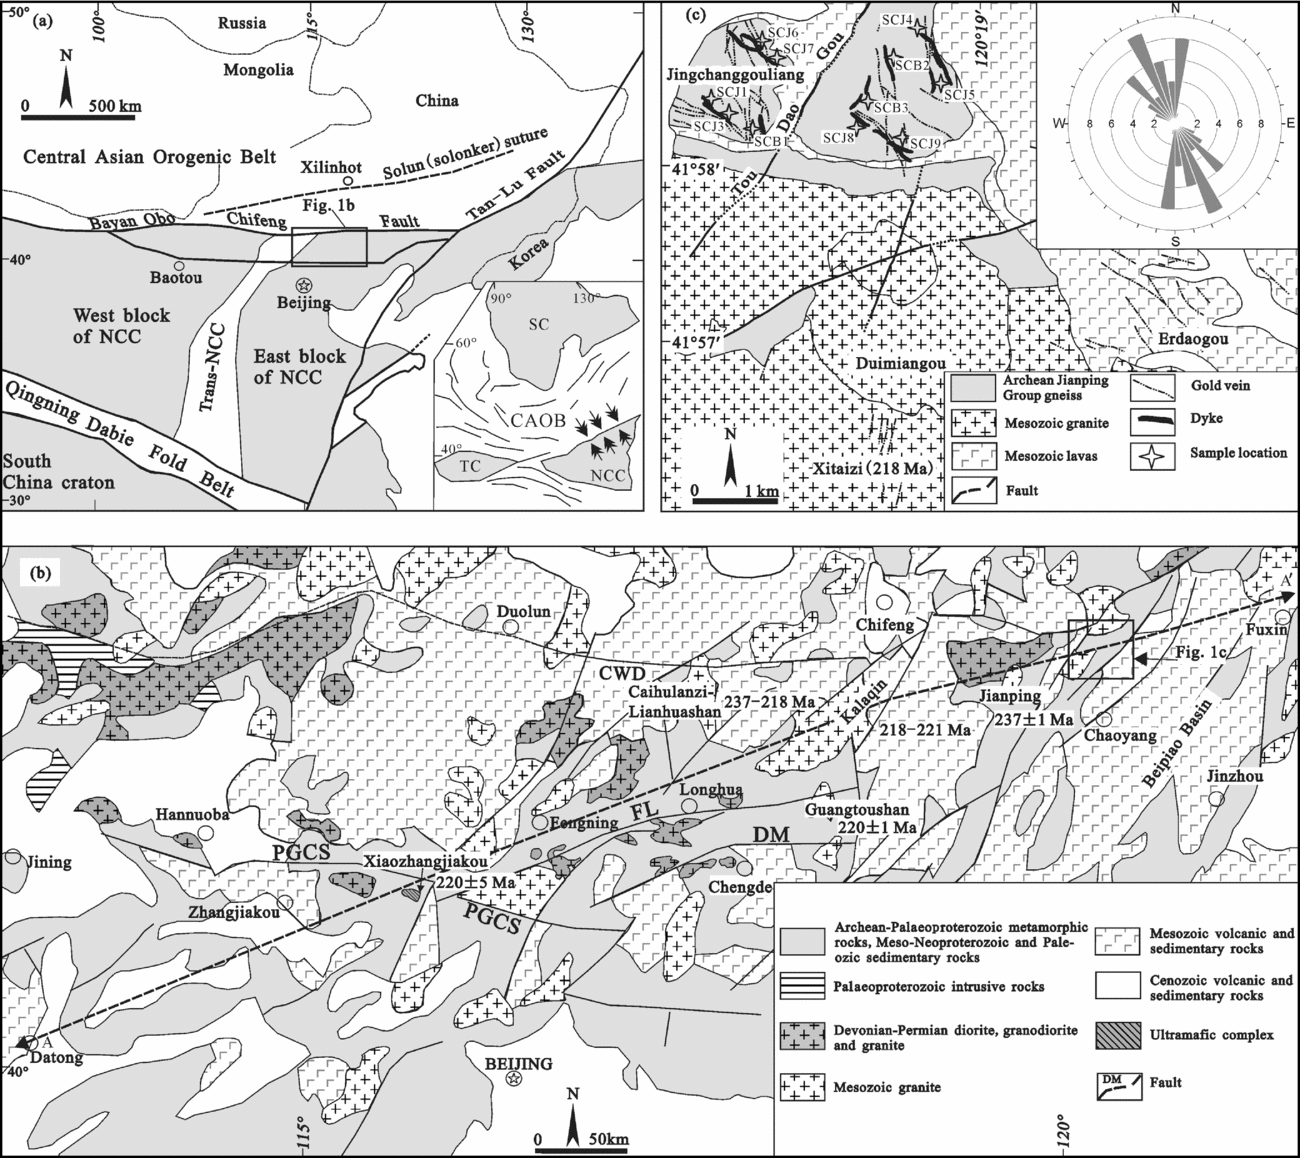
Owing to their important geodynamic and petrogenetic significance, we studied the Jinchanggouliang (JCGL) diorite and diorite porphyry dykes. The JCGL occupies a transitional tectonic position that links the Phanerozoic Central Asian Orogenic Belt (CAOB) in the north, with the Precambrian North China craton (NCC) in the south (Fig. 1a). The CAOB is one of the world's largest sites of juvenile crustal formation in the Phanerozoic (Xiao et al. Reference Xiao, Windley, Hao and Zhai2003; Windley et al. Reference Windley, Alexeiev, Xiao, Kröner and Badarch2007), and it formed with the final closure of Palaeo-Asian Ocean and amalgamation of the NCC and the Mongolian arc terranes, which both took place along the Solonker suture zone (Fig. 1a; Davis et al. Reference Davis, Zheng, Wang, Darby, Zhang, Gehrels, Hendrix and Davis2001; Xiao et al. Reference Xiao, Windley, Hao and Zhai2003). However, there is still much controversy concerning the timing of suturing. Some authors propose that the suturing took place during Late Permian to Early Triassic time (Chen et al. Reference Chen, Jahn, Wilde and Xu2000; Davis et al. Reference Davis, Zheng, Wang, Darby, Zhang, Gehrels, Hendrix and Davis2001; Xiao et al. Reference Xiao, Windley, Hao and Zhai2003); whereas others prefer suturing during either Middle Devonian time (Tang, Reference Tang1990; Xu & Chen, Reference Xu and Chen1997) or Late Devonian–Early Carboniferous time (Shao, Reference Shao1991; Hong et al. Reference Hong, Huang, Xiao, Xu and Jin1995). Additionally, the NCC is regarded as a Precambrian craton that experienced widespread tectonothermal reactivation (lithosphere destruction and thinning) (e.g. Gao et al. Reference Gao, Rudnick, Carlson, McDonough and Liu2002; Rudnick et al. Reference Rudnick, Gao, Ling, Liu and McDonough2004; Kusky, Windley & Zhai, Reference Kusky, Li and Santosh2007a, Reference Kusky, Windley, Zhai, Zhai, Windley, Kusky and Mengb), but the initiation timing for reactivation is still controversial (Wu et al. Reference Wu, Xu, Gao and Zheng2008; Xu et al. Reference Xu, Li, Pang and He2009). Although most researchers believe that the destruction of the NCC occurred during late Mesozoic time (e.g. Zhang et al. Reference Zhang, Sun, Zhou, Fan, Zhai and Yin2002; Menzies et al. Reference Menzies, Xu, Zhang and Fan2007), other researchers proposed that the destruction probably began in early Mesozoic time (e.g. Han, Kagami & Li, Reference Han, Kagami and Li2004). In a recent paper by Zhang et al. (Reference Zhang, Zhao, Liu, Liu, Chen, Xie and Chen2009b), it is proposed that the lithospheric destruction and thinning of the northern NCC began in Middle–Late Triassic time.
(a) Tectonic setting of the northern margin of the NCC and location of Figure 1b (modified after Zhao et al. Reference Zhao, Wilde, Cawood and Sun2001; Hart et al. Reference Hart, Goldfrab, Qiu, Snee, Miller and Miller2002; Zhang et al. Reference Zhang, Zhang, Tang, Wilde and Hu2008b). The inset shows the major tectonic units of north Asia and arrows denote the principal stress direction of the NCC during latest Permian to earliest Triassic time (Wan, Reference Wan2004; Hou, Wang & Hari, Reference Hou, Wang and Hari2010). TC – Tarim craton; NCC – North China craton; SC – Siberia craton; CAOB – Central Asian Orogenic Belt. (b) Geological sketch of the central-eastern segment of the northern margin of the NCC (modified after Zhang et al. Reference Zhang, Zhao, Song, Yang, Hu and Wu2007) showing the location of A–A′ cross-section illustrated in Figure 11. Geochronology data for the Jianping syenogranite dyke and monzogranite (Zhang et al. Reference Zhang, Zhao, Song, Hu, Liu, Yang, Chen and Liu2009c), Kalaqin (also called Harqin) diorite (Shao et al. Reference Shao, Zhang, Han, Zhang, Qiao and Shang2000), Caihulanzi–Lianhuashan diorite (She et al. Reference She, Xu, Zhou, Wang, Yan, Yang and Yang2000; Han, Shao & Zhou, Reference Han, Shao and Zhou2000), Guangtoushan alkaline granite (Han, Kagami & Li, Reference Han, Kagami and Li2004) and Xiaozhangjiakou ultramafic complex (Tian et al. Reference Tian, Chen, Liu and Zhang2007) are also presented. Fault names: CWD – Chifeng–Weichang–Duolun fault; PGCS – Pingquan–Gubeikou–Chicheng–Shangyi fault; FL – Fengning–Longhua fault; DM – Damiao fault. (c) Detailed geological map of the Jinchanggouliang–Erdaogou area. The inset illustrates strike rose diagram of dykes (n = 42).

In this paper, we present zircon U–Pb ages, major and trace element geochemistry, and Sr–Nd–Pb isotope compositions for the Triassic dykes from JCGL to (1) document the geochronology and geochemical characteristics of these rocks, (2) investigate their magma sources and petrogenesis and (3) evaluate the evolution of the CAOB and its influence on the early Mesozoic lithospheric mantle beneath the NCC.
2. Geological setting
The CAOB is located between the North China and Siberian cratons (Fig. 1a). It is a complex orogenic belt formed through successive accretion of arc complexes, accompanied by emplacement of voluminous subduction-related granitic magmas mainly during Palaeozoic times (e.g. Davis et al. Reference Davis, Zheng, Wang, Darby, Zhang, Gehrels, Hendrix and Davis2001; Xiao et al. Reference Xiao, Windley, Hao and Zhai2003; Windley et al. Reference Windley, Alexeiev, Xiao, Kröner and Badarch2007; Chen, Jahn & Tian, Reference Chen, Jahn and Tian2009) and closure of the Palaeo-Asian Ocean. In this period, multiple Mongolian arc terranes were amalgamated to the active margins of the NCC (Davis et al. Reference Davis, Zheng, Wang, Darby, Zhang, Gehrels, Hendrix and Davis2001; Zhang et al. Reference Zhang, Zhao, Song, Hu, Liu, Yang, Chen and Liu2009c). The Solonker suture marks the location of the final closure of the Palaeo-Asian Ocean and the collision between the NCC and Mongolian composite terranes (e.g. Davis et al. Reference Davis, Zheng, Wang, Darby, Zhang, Gehrels, Hendrix and Davis2001; Xiao et al. Reference Xiao, Windley, Hao and Zhai2003; Windley et al. Reference Windley, Alexeiev, Xiao, Kröner and Badarch2007; Miao et al. Reference Miao, Fan, Liu, Zhang, Shi and Guo2008). With the exhaustion of the Palaeo-Asian Ocean, the NCC and the southern Mongolian terranes were amalgamated and behaved as a combined North China–Mongolian plate (Davis et al. Reference Davis, Zheng, Wang, Darby, Zhang, Gehrels, Hendrix and Davis2001).
The basement of the NCC is composed of highly metamorphosed Archaean and Palaeoproterozoic rocks that have been covered by Mesoproterozoic–Triassic marine and fluvial sediments, Jurassic–Cretaceous and younger sediments and volcanic rocks. According to the chronology, lithological assemblage, tectonic evolution and P–T–t paths, the NCC can be divided into the Eastern Block, the Western Block and the Trans-North China Orogen (Fig. 1a; Zhao et al. Reference Zhao, Wilde, Cawood and Sun2001). The presence of ≥3.6 Ga crustal remnants exposed on the surface and in lower crustal xenoliths in the NCC suggests that it has remained partially stable since the Early Archaean (Liu et al. Reference Liu, Nutman, Compston, Wu and Shen1992; Zheng et al. Reference Zheng, Griffin, O'reilly, Lu, Wang, Zhang, Wang and Li2004a). The NCC experienced widespread lithospheric destruction and thinning after Palaeozoic times as indicated by the emplacement of voluminous late Mesozoic to Tertiary granites and alkali basalts (e.g. Gao et al. Reference Gao, Rudnick, Carlson, McDonough and Liu2002; Zhang et al. Reference Zhang, Sun, Zhou, Fan, Zhai and Yin2002; Rudnick et al. Reference Rudnick, Gao, Ling, Liu and McDonough2004; Kusky, Windley & Zhai, Reference Kusky, Windley, Zhai, Zhai, Windley, Kusky and Meng2007b).
The JCGL gold ore field lies on the northern margin of the NCC (Fig. 1b), southeast of the CAOB. It consists of three gold deposits, including the JCGL, Erdaogou and Changgaogou. The Mesozoic Xitaizi S-type granite (218 ± 4 Ma; Miao et al. Reference Miao, Fan, Qiu, Mcnaughton and Groves2003) and Duimiangou I-type granite (131–125 Ma; Wang, Xu & Yang, Reference Wang, Xu and Yang1989; Lin et al. Reference Lin, Shang, Shen, Zhang, Taylor, Robert, Mortersen, Poulsen and Maurice1993) intruded the Archaean Jianping Group gneiss, which is also the country rock for the Au orebodies and dykes. Jurassic volcanic rocks crop out in the northeast corner of this gold district (Fig. 1c).
3. Petrography
All dyke samples were collected from underground between the +620 m and +460 m levels beneath the JCGL deposit and adjacent areas to avoid the effects of weathering on the surface. Sample locations were projected to the surface and are illustrated in Figure 1c. Sample GSJ2 used for zircon U–Pb dating was collected from the drift adjacent to the no. 15 lode at the +580 m level. There are tens of dykes cropping out in the JCGL ore field. Individual dykes mostly strike 320°NW to 10°NE (Fig. 1c) with dip angles of about 75°E–80°E. The prevailing orientations of dyke strikes, as illustrated in the rose diagram in Figure 1c, are nearly the same as those of the maximum principal compressive stress in the NCC during latest Permian to earliest Triassic time (160°–178°; Wan, Reference Wan2004; Hou, Wang & Hari, Reference Hou, Wang and Hari2010), which is also orthogonal to the collisional belt between the NCC and Mongolian arc terranes (Fig. 1a). Dykes exhibit narrow chilled margins and range from 1 to 5 m in width and are tens of metres to about 1 kilometre in length. All dykes are cut by gold-bearing quartz veins and can be generally classified into diorite and diorite porphyry.
The diorites are medium- to fine-grained rocks with hypidiomorphic granular texture, showing clear intrusive relationships with the host gneiss. They mainly consist of plagioclase (40–60%), amphibole (30–40%), pyroxene (1–3%) and biotite (0–5%), with minor amounts of quartz, magnetite, zircon and apatite. The plagioclase generally forms subhedral laths, with occasional albite and carlsbad–albite combined twinning. They are partly altered to sericite, calcite and epidote. Amphibole, the most abundant mafic mineral, is subhedral to euhedral and locally slightly altered to calcite and chlorite.
Diorite porphyry is grey-black, and has a porphyritic texture containing 15–20% phenocrysts by volume. The phenocrysts consist dominantly of long-pillared hornblende (3–8%) and platy plagioclase (10–15%) with minor biotite and clinopyroxene. Minerals in the groundmass are mainly composed of plagioclase (50–65%) and hornblende (15–20%). Accessory minerals include acicular apatite, magnetite and zircon. The hornblende and plagioclase are both partly altered to sericite and chlorite.
4. Analytical methods
4.a. Zircon U–Pb isotopic dating
Zircons were extracted from whole-rock samples using the standard technique of density and magnetic separation at the Laboratory of Langfang Regional Geological Survey Institute, Hebei Province. Following this, the selected grains were mounted in epoxy blocks and carefully polished until their cores were exposed. The cathodoluminescence (CL) images, combined with reflected light and transmitted light, were obtained at the electron microprobe laboratory in the State Key Laboratory of Geological Processes and Mineral Resources (GPMR), China University of Geosciences, Wuhan, in order to observe the interior texture of the zircons. U–Pb isotopic analyses were made on a laser ablation inductively coupled plasma mass spectrometer (LA-ICP-MS, Agilent 7500a) with a spot size of 24 μm at GPMR following standard operating techniques as described by Liu et al. (Reference Liu, Gao, Hu, Gao, Zong and Wang2010). Common Pb was corrected using the method proposed by Anderson (Reference Anderson2002). Concordia ages were determined using Isoplot 2.32 (Ludwig, Reference Ludwig2003).
4.b. Major and trace element determination
Whole-rock samples were crushed in a corundum jaw crusher (to 60 mesh) and about 60 g was powdered in an agate ring mill to less than 200 mesh. Major element analyses were carried out at the Yichang Institute of Geology and Mineral Resources (YCIGM) in China by wet chemical methods with analytical errors less than 1.4%. Trace elements were measured by an Agilent 7500a ICP-MS at GPMR. The samples were digested in Teflon bombs with a mixture of HF+HNO3, as described by Liu et al. (Reference Liu, Zong, Kelemen and Gao2008b). Analyses of the international rock standards BHVO-1 and BCR-2 indicate that the analytical accuracy is mostly better than 10% as indicated by the relative deviation.
4.c. Sr–Nd–Pb isotope analyses
Sr, Nd and Pb isotope compositions were measured on a Finnigan Mat 262 thermal ionization mass spectrometer at the YCIGM. Procedural blanks were 2.13 × 10⁻¹⁰ g for Sr, 2.13 × 10⁻¹⁰ g for Nd and 2 × 10⁻⁹ g for Pb. The working conditions of the instrument were controlled by international NBS-987 (Sr) and NBS-981 (Pb) standards and the laboratory ZK-bzNd (Nd) standard. The measured values for the NBS-987, NBS-981 and ZK-bzNd (Nd) standards were 87Sr/86Sr = 0.710246, 207Pb/206Pb = 0.9142 and 143Nd/144Nd = 0.511564, respectively, during the period of data acquisition. 143Nd/144Nd values were corrected for mass fractionation by normalization to 146Nd/144Nd = 0.7219, and 88Sr/86Sr ratios were normalized to 88Sr/86Sr = 8.3752. The precision for 87Rb/86Sr, 147Sm/144Nd and Pb are better than 1%, 0.5% and 0.033%, respectively.
5. Analytical results
5.a. Zircon U–Pb geochronology
Zircons from sample GSJ2 are colourless to light yellow, transparent and dominated by short-, long-prismatic and equigranular shapes with a general length of 60–120 μm (Fig. 2). Sixteen spots on 13 zircon grains were measured and the analytical results are presented in Table 1. GSJ2–8 and GSJ2–14 yielded Archaean to Palaeoproterozoic inherited ages (206Pb/207Pb age, 2524 ± 12 Ma and 2458 ± 11 Ma, respectively, Fig. 3b), which are consistent with an important continent growth period of the NCC (e.g. Zheng et al. Reference Zheng, Griffin, O'reilly, Lu, Yu and Li2004b; Kusky, Li & Santosh, Reference Kusky, Windley, Zhai, Zhai, Windley, Kusky and Meng2007). The other 14 analyses are all concordant or almost concordant and fall into two distinct populations with a Late Permian to Early Triassic (GSJ2–2, GSJ2–5, GSJ2–11, GSJ2–13 and GSJ2–16) weighted mean of 253 ± 7 Ma (MSWD = 3.1, n = 5) and a Middle to Late Triassic weighted 206Pb/238U age mean of 227 ± 1 Ma (MSWD = 0.35, n = 9) (Fig. 3a). Irregularly oscillatory and fir leaf zoning from the former group (Fig. 2) indicate that they are inherited or captured. The latter group of zircons display obvious oscillatory zoning, higher Th/U ratios (0.50–0.98) and fall within a centralized area in the concordant diagram, so we interpret 227 ± 1 Ma as the emplacement time of the JCGL dykes.
Cathodoluminescence images of zircons from sample GSJ2 showing sites of LA-ICP-MS U–Pb analyses.

LA-ICP-MS zircon U–Pb dating data for dykes (GSJ2) from the JCGL

U–Pb concordia diagrams for zircons of GSJ2 from Jinchanggouliang (JCGL). Conf. – confidence; MSWD – mean square of the weighted deviates.

5.b. Major and trace elements
Major and trace element data are listed in Table 2 and plotted in Figures 4–7. The JCGL dykes have a wide range of SiO2 (51.22–68.48 wt%) and MgO (1.35–8.13 wt%) contents, with Mg numbers of 39–69. In addition, they are all characterized by high concentrations of Na2O+K2O (5.16–8.28 wt%) and Al2O3 (13.67–17.50 wt%) and low abundances of P2O5 (0.13–0.37 wt%) and TiO2 (0.51–1.16 wt%). In the total alkali versus silica plot (not shown), samples mainly plot in the intersection field of basaltic-trachyandesite, trachyandesite, basaltic-andesite and andesite, which coincides with the classification results in terms of trace elements (Fig. 4). The linear arrays in the major element variation diagrams (Fig. 5a–d) indicate that the JCGL dykes may have resulted from magma mixing.
Major (wt%) and trace element (ppm) compositions of dykes from the JCGL

* Data from Chen et al. (Reference Chen, Sun, Piao, Zhao and Zhai2005); nd – not detected; Mg no. = 100 × Mg/(Mg +∑Fe) in atomic ratio; LOI – loss on ignition.
Nb/Y–Zr/TiO2*0.001 diagram for dykes from Jinchanggouliang (JCGL) (modified from Winchester & Floyd, Reference Winchester and Floyd1977). Data for the diorite and diorite porphyry from JCGL illustrated by hollow circles and triangles are from this study. Data shown by solid circles and triangles are from Chen et al. (Reference Chen, Sun, Piao, Zhao and Zhai2005). Kalaqin diorites (hollow squares) are from Han, Shao & Zhou (Reference Han, Shao and Zhou2000).

Variation of (a) MgO versus SiO2, (b) TFeO versus SiO2, (c) Na2O/CaO versus Al2O3/CaO, (d) Na2O/CaO versus SiO2/CaO, (e) Cr versus SiO2 and (f) Ni versus SiO2. The grey lines in (c) and (d) indicate regression analysis of rocks with associated R2 value. Data source is the same as Figure 4.

(a) Primitive mantle-normalized trace element distributions and (b) chondrite-normalized REE patterns. The primitive mantle and chondrite values are from Sun & McDonough (Reference Sun, McDonough, Saunders and Norry1989). Data for dykes from Jinchanggouliang (JCGL) from other study are from Chen et al. (Reference Chen, Sun, Piao, Zhao and Zhai2005) (average value of six samples); data for granulite xenoliths in Caihulanzi are from She et al. (Reference She, Wang, Li, Zhang, Feng and Li2006); cumulate in Kalaqin from Shao et al. (Reference Shao, Han, Zhang and Mu1999) (average value of 22 samples); and for diorite in Kalaqin from Han, Shao & Zhou (Reference Han, Shao and Zhou2000).

(a) Ta/Yb–Ce/Yb and (b) Ta/Yb–Th/Yb diagrams for dykes from JCGL (modified from Pearce, Reference Pearce and Thorpe1982). Data source is the same as Figure 4.

These dykes are enriched in large-ion lithophile elements (LILE, such as K, Rb, Sr and Ba), depleted in high-field-strength elements (HFSE, such as Nb, Ta and Ti) and have a range of concentrations of Cr and Ni (Fig. 5e, f). In the primitive mantle-normalized spider diagram, they display strong negative anomalies of Ta and Nb and positive Pb anomalies (Fig. 6a). All samples belong to the shoshonitic rock series according to the Ce/Yb–Ta/Yb and Th/Yb–Ta/Yb diagrams (Fig. 7). Samples exhibit sub-parallel right-dipping chondrite-normalized rare earth element (REE) patterns with ∑REE of 67.42–203.41 ppm (Fig. 6b). They may have experienced moderate fractionation characterized by (La/Yb)N values of 3.15–4.74. There is no clearly defined Eu anomaly (Eu/Eu* 0.72–1.13).
The major and trace element characteristics of the JCGL dykes are the same as those of the early Mesozoic Kalaqin diorite (Figs 1b, 6; Shao, Han & Li, Reference Shao, Han and Li2000), which is also the host rock of the Caihulanzi (CHLZ) granulite xenoliths (Shao, Han & Li, Reference Shao, Han and Li2000; She et al. Reference She, Wang, Li, Zhang, Feng and Li2006) and cumulate (Shao et al. Reference Shao, Han, Zhang and Mu1999, Reference Shao, Han and Li2000).
5.c. Sr–Nd–Pb isotopes
Sr, Nd and Pb isotope compositions are listed in Table 3. The JCGL dykes possess a narrow range of Sr isotope compositions with initial 87Sr/86Sr ratios of from 0.70394 to 0.70592, and variable ε Nd(t) values (1.1 to −12.0) and TDM2 ages (913–1972 Ma) (Fig. 8). Their Sr–Nd isotope compositions are nearly the same as those of the Mesozoic volcanic rocks from the transitional part of the CAOB and NCC (Zhou et al. Reference Zhou, Zhang, Yang, Chen and Sun2001), and are different from the Palaeozoic lithospheric mantle and igneous rocks of the interior of the NCC or CAOB (Fig. 8a).
Sr–Nd–Pb isotope compositions of dykes from the JCGL

* Data from Chen et al. (Reference Chen, Sun, Liang, Feng, Chang, Chen, Men, Chen, Xue and Zhang2008); nd – not detected; (87Sr/86Sr)i and ε Nd(t) values are calculated at t = 227 Ma based on present-day (147Sm/144Nd)CHUR = 0.1967 and (143Nd/144Nd)CHUR = 0.512638. TDM2 values are calculated based on present-day (147Sm/144Nd)DM = 0.2137 and (143Nd/144Nd)DM = 0.51315. λRb = 1.42 × 10⁻¹¹ year−1 (Steiger & Jäger, Reference Steiger and Jäger1977), λSm = 6.54 × 10⁻¹² year−1 (Lugmair & Harti, 1978).
(a) ε Nd(t) versus (87Sr/86Sr)i showing mixing proportions between two end members. The end-member data used for the binary mixing calculation are listed in Table 4. Curves A, B, C and D refer to the mixing between EM1-like sub-continental lithospheric mantle (SCLM) and the Xilinhot basalt from central Inner Mongolia, which represents basaltic melts from the asthenosphere of the Central Asian Orogenic Belt (CAOB); EM1-type SCLM and the lower crust; Xilinhot basalt and the lower crust; and Xilinhot basalt and the upper crust, respectively. The tick marks and numbers denote the proportions of lower continental crust (LCC) or enriched mantle 1 (EM1) in 10% increments. (b) ε Nd(t) versus crystallization age plots for rocks from Jinchanggouliang (JCGL). The ancient crust evolution line is constructed on the basis of an average 147Sm/144Nd value of 0.118 (Jahn & Condie, Reference Jahn and Condie1995). The lithospheric mantle evolution line is from Han, Kagami & Li (Reference Han, Kagami and Li2004). Ordovician kimberlites and mantle xenoliths in the eastern North China craton (NCC) are from Zheng & Lu (Reference Zheng and Lu1999), Wu et al. (Reference Wu, Walker, Yang, Yuan and Yang2006) and Zhang & Yang (Reference Zhang and Yang2007). Phanerozoic granites in the CAOB are from Wu et al. (Reference Wu, Jahn, Wilde and Sun2000), Hong et al. (Reference Hong, Wang, Xie and Zhang2000), Zhou et al. (Reference Zhou, Zhang, Yang, Chen and Sun2001, Reference Zhou, Yin, Zhang and Zhang2009) and Zhang et al. (Reference Zhang, Zhang, Tang, Wilde and Hu2008b). Isotope compositions of Mesozoic volcanic rocks from the transitional part of the CAOB and NCC are from Zhou et al. (Reference Zhou, Zhang, Yang, Chen and Sun2001). Mesozoic rocks from the NCC include Triassic alkaline intrusives in the Yanliao–Yinshan area (Yan et al. Reference Yan, Mu, Xu, He, Tan, Zhao, He, Zhang and Qiao1999), the Fanshan potassic alkaline ultramafite–syenite complex (Mu et al. Reference Mu, Shao, Chu, Yan and Qiao2001), Datong lamprophyre (Shao et al. Reference Shao, Zhang, Zhang, Wang and Guo2003), Guangtoushan alkaline granite (Han, Kagami & Li, Reference Han, Kagami and Li2004) and late Mesozoic basalt from the northern margin of the NCC (Zhang et al. Reference Zhang, Sun, Zhou, Fan, Zhou and Zhai2004). Data for diorite and diorite porphyry from JCGL (solid circles and triangles) are from Chen et al. (Reference Chen, Sun, Liang, Feng, Chang, Chen, Men, Chen, Xue and Zhang2008). All data is calculated at 230 Ma.

Isotope data used for the mixing calculation

EM1 – enriched mantle 1; DM – depleted mantle; LCC – lower continental crust; UCC – upper continental crust.
Pb isotope ratios of the JCGL dykes form continuous variation trends and plot between the fields of the enriched mantle 1 (EM1) and lower continental crust (LCC) in the Pb isotopic ratio plots ((206Pb/204Pb)i = 16.43–17.64, (207Pb/204Pb)i = 15.21–15.56, (208Pb/204Pb)i = 36.38–37.87) (Fig. 9). Pb isotopic data for the Mesozoic Fangcheng basalts, which were thought to represent the late Mesozoic Pb isotopic signature of the enriched mantle beneath the NCC (Zhang et al. Reference Zhang, Sun, Zhou, Fan, Zhai and Yin2002), are shown in Figure 9 for reference.
(a) Plot of (207Pb/204Pb)i versus (206Pb/204Pb)i and (b) Plot of (208Pb/204Pb)i versus (206Pb/204Pb)i for dykes from JCGL. NHRL – Northern Hemisphere reference line. Locations of EM1, EM2 and DMM (depleted MORB mantle) are from Zindler & Hart (Reference Zindler and Hart1986). Late Mesozoic Fangcheng basalts (Zhang et al. Reference Zhang, Sun, Zhou, Fan, Zhai and Yin2002) were plotted for reference. Data source is the same as Figure 8.

6. Discussion
6.a. Petrogenesis of the JCGL dykes
6.a.1. Crustal contamination
Previous investigations generally agree that the magmas emplaced in the interior of a continent experience some degree of crustal contamination during ascent and/or residence within crustal magma chambers (e.g. Currie & Williams, Reference Currie and Williams1993). Models invoking crustal assimilation may account for some trace element and isotopic variations observed in Figures 6–9. However, crustal assimilation cannot explain the high concentrations of Ba (399.88–2126.81 ppm) and Sr (313.31–1198.54 ppm) in the JCGL dykes (Table 2), which are much higher than continental crust values (Ba = 259–550 ppm, Sr = 281–350 ppm; Rudnick & Fountain, Reference Rudnick and Fountain1995). Moreover, random or no correlations have been observed in the diagram of (87Sr/86Sr)i versus MgO and SiO2 (Fig. 10), which precludes the possibility of extensive crustal contamination. Hence, the magmatic evolution of the JCGL dykes is not significantly affected by crustal contamination, and the geochemical and isotopic signatures of these dykes were mainly inherited from their magma sources.
(a) (87Sr/86Sr)i versus MgO (wt%) and (b) (87Sr/86Sr)i versus SiO2 (wt%) diagrams for dykes from JCGL showing there is no obvious correlation. Data source is the same as Figure 8.

6.a.2. Magma source
The inherited or captured Archaean zircons and whole-rock geochemistry characteristics (such as positive Pb anomaly) all indicate that a crustal component was involved in the magma source of these dykes. Han, Shao & Zhou (Reference Han, Shao and Zhou2000) contended that the Kalaqin diorite, which has a similar emplacement time and geochemical characteristics to the JCGL dykes (Figs 1, 4, 6, 7), was derived from partial melting of the lower crust of the NCC. However, experimental data have shown that regardless of the degree of partial melting, melts from metabasalts of the lower crust are generally characterized by low Mg numbers (<45; Rapp & Watson, Reference Rapp and Watson1995), which is not the case for the JCGL dykes (39–69, mostly >50). Therefore, these dykes cannot be generated by remelting of the basic lower crustal rocks only, but a mantle source is required. This conclusion is supported by the relatively high contents of Cr (320.96 ppm) and Ni (263.68 ppm) of some samples and occurrences of contemporary cumulate xenoliths in the Kalaqin region (Shao et al. Reference Shao, Han, Zhang and Mu1999).
The question remains whether these mantle-derived magmas originated from the lithospheric mantle or the asthenosphere. The Sr, Nd and Pb isotope data of the JCGL dykes provide further information on the nature of their source region. As mentioned above, the NCC is an Archaean craton. However, the lithospheric mantle beneath it was formed in the Archaean and replaced in the Proterozoic beneath the central portion of the craton, based on the Re depletion ages of 2.6–3.2 Ga for peridotite xenoliths in the Palaeozoic diamondiferous kimberlites from Mengyin and Fuxian (Gao et al. Reference Gao, Rudnick, Carlson, McDonough and Liu2002; Wu et al. Reference Wu, Walker, Yang, Yuan and Yang2006; Zhang et al. Reference Zhang, Goldstein, Zhou, Sun, Zheng and Cai2008a), and that of 1.9 Ga for peridotite xenoliths in the Neogene alkali basalts from Hannuoba (Gao et al. Reference Gao, Rudnick, Carlson, McDonough and Liu2002). Assuming that the Palaeozoic lithospheric mantle of the NCC originated from evolutional Proterozoic lithospheric mantle, Han, Kagami & Li (Reference Han, Kagami and Li2004) calculated that the lowest ε Nd (220 Ma) was about −8.8, which was nearly the same as the ε Nd (135 Ma) value of −8.2 from EM1-affinity lithospheric mantle beneath the Taihangshan region (Chen, Jahn & Zhai, Reference Chen, Jahn and Zhai2003; Chen & Zhai, Reference Chen and Zhai2003). These isotope values are also consistent with the Fanshan potassic alkaline ultramafite–syenite complex (ε Nd (240 Ma) = −5.8; Mu et al. Reference Mu, Shao, Chu, Yan and Qiao2001) and Datong lamprophyre (Fig. 8; ε Nd (220 Ma) = −5.4; Shao et al. Reference Shao, Zhang, Zhang, Wang and Guo2003) from the northern margin of the NCC, which are all regarded to have resulted from partial melting of the lithospheric mantle (Figs 1b, 11c). The participation of enriched lithospheric mantle can reasonably account for the source properties of some JCGL dykes with high Ba and Sr contents, ε Nd(t) values of −8.9 to −12, TDM2 ages of 1721–1972 Ma (Table 3; Fig. 8b) and the wide range of Pb isotope compositions (Fig. 9). A simple mass balance calculation based on the Sr and Nd isotopes shows that the mixing of less than 13% lower crustal melts with the magma derived from EM1-like lithospheric mantle can produce the observed Sr/Nd isotopic ratios of these dykes (curve B in Fig. 8a).
Tectonomagmatic model for the Jinchanggouliang (JCGL) shoshonitic dykes and mafic–ultramafic rocks from adjacent areas. (a) Pre-250 Ma: the North China craton (NCC) and the southern Mongolian terranes were amalgamated and behaved as a combined North China–Mongolian plate (modified from Zhang et al. Reference Zhang, Zhao, Song, Hu, Liu, Yang, Chen and Liu2009c). (b) 230 Ma: combined North China–Mongolian plate entered into the post-collisional/post-orogenic extensional environment (modified from Zhang et al. Reference Zhang, Zhao, Song, Hu, Liu, Yang, Chen and Liu2009c; Pe-Piper et al. Reference Pe-Piper, Piper, Koukouvelas, Dolansky and Kokkalas2009). Location of A–A′ cross-section plane shown. (c) Magma source of the JCGL dykes and mafic–ultramafic rocks from adjacent areas of the A–A′ cross-section plane (for discussion and data source, see text). Schematic location of the A–A′ section plane is shown in Figure 1. Illustrations are not to scale.
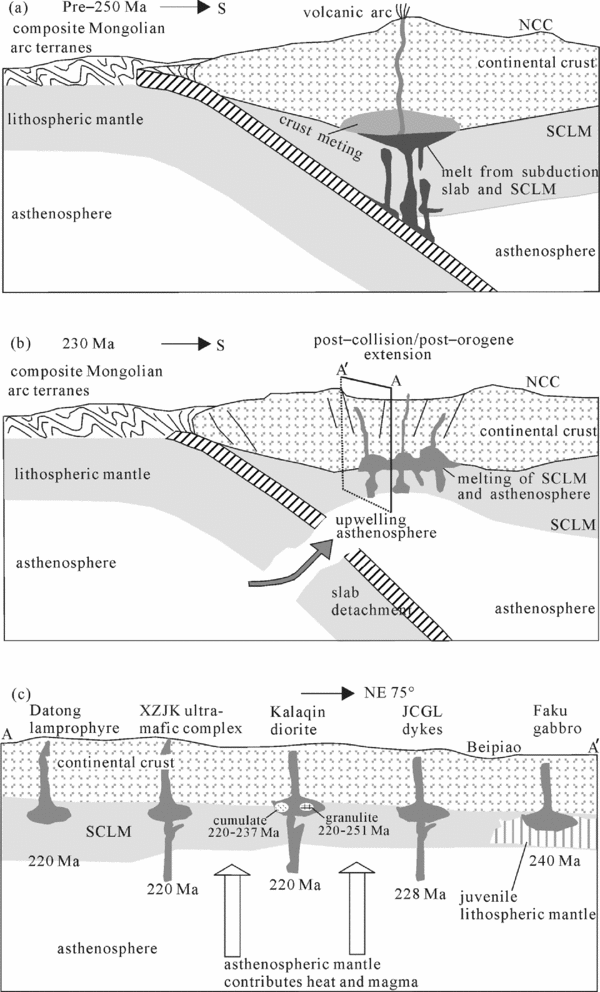
However, mixing of the lower crust and enriched lithospheric mantle cannot perfectly explain the higher ε Nd(t) (1.1 to −3.7) and younger TDM2 ages (913–1300 Ma) of other samples (Table 3; Fig. 8), because the NCC sub-continental lithospheric mantle was enriched and had not undergone significant crustal growth after the Proterozoic. In contrast, these Sr–Nd isotopic characteristics are similar to the Phanerozoic igneous rocks from the CAOB (Fig. 8; Wu et al. Reference Wu, Jahn, Wilde and Sun2000; Hong et al. Reference Hong, Wang, Xie and Zhang2000; Zhou et al. Reference Zhou, Zhang, Yang, Chen and Sun2001, Reference Zhou, Yin, Zhang and Zhang2009; Zhang et al. Reference Zhang, Zhang, Tang, Wilde and Hu2008b). Their geochemical features could be related to the injection of ascending asthenospheric mantle melt following detachment of the subducting slab from the Palaeo-Asian Ocean and magma underplating, or the injection of melt and fluid from the subducted slab itself. However, no early Mesozoic adakite or high magnesium andesite, products of melting hot and young oceanic crust, have been found in the adjacent areas. Hence, we speculate that the magma source of these dykes with higher ε Nd(t) and younger TDM2 ages may be related to the ascending asthenospheric mantle melt. Furthermore, exposure of the contemporaneous cumulate (220–237 Ma; Shao et al. Reference Shao, Han, Zhang and Mu1999, Reference Shao, Han and Li2000) and granulite xenoliths (220–251 Ma; Shao, Han & Li, Reference Shao, Han and Li2000; She et al. Reference She, Wang, Li, Zhang, Feng and Li2006) in Kalaqin and Caihulanzi (Figs 1b, 11c) imply that a process of asthenospheric magma underplating and the formation of juvenile lithospheric mantle played a role in the magma genesis. The most recent investigations for the Faku gabbro also demonstrate the presence of juvenile lithospheric mantle with an affinity of the CAOB beneath the NCC in northern Liaoning Province during early Mesozoic time (Fig. 11c; Zhang et al. Reference Zhang, Zhang, Zhai, Wilde and Xie2009a). High ε Hf(t) values (−2.9 to 1.7) and young Hf isotopic model ages (TDM = 0.81−0.98 Ga) of the Xiaozhangjiakou mafic–ultramafic (XZJK) complex also provide direct evidence for the existence of asthenospheric melt in the magma source region (Figs 1b, 11c; Tian et al. Reference Tian, Chen, Liu and Zhang2007). Consequently, this melt may have been generated from the underplated asthenospheric melt following the detachment of a subducting slab (Zhang et al. Reference Zhang, Zhao, Liu, Liu, Chen, Xie and Chen2009b).
Overall, the JCGL dykes originated from mixing of the lower crust, lithospheric mantle of the NCC and ascending asthenospheric mantle melt following detachment of a subducting slab and magma underplating (Fig. 11).
6.b. Geodynamic significance
6.b.1. Implications for evolution of the CAOB
As described in the introduction, the timing of the final closure of the Palaeo-Asian Ocean has long been controversial. Some authors propose that the suturing took place during Late Permian to Early Triassic time (Chen et al. Reference Chen, Jahn, Wilde and Xu2000; Davis et al. Reference Davis, Zheng, Wang, Darby, Zhang, Gehrels, Hendrix and Davis2001; Xiao et al. Reference Xiao, Windley, Hao and Zhai2003); whereas others prefer suturing during either Middle Devonian time (Tang, Reference Tang1990; Xu & Chen, Reference Xu and Chen1997) or Late Devonian–Early Carboniferous time (Shao, Reference Shao1991; Hong et al. Reference Hong, Huang, Xiao, Xu and Jin1995). In combination with investigations of palaeontology and palaeoclimate, the new geochronology data from retrograded eclogites, ophiolites and multiple mafic to acid igneous rocks from the northern margin of the NCC and CAOB provide important constraints on this issue.
The retrograded eclogites, which have tholeiitic protoliths (mid-ocean ridge basalt or island arc tholeiite) and eclogite facies metamorphism, exist in the Zhangjiakou region (Fig. 1b). Zircon SHRIMP isotopic dating of these rocks defines a weighted mean age of ~325 Ma, which was interpreted as the peak metamorphic age and reflects the subduction of Palaeo-Asian oceanic lithosphere beneath the NCC (Ni et al. Reference Ni, Zhai, Wang and Tong2006). Recently, a late Palaeozoic continental arc magmatic belt (calc-alkaline or high-K calc-alkaline gabbroic to granitic rocks) was identified on the northern margin of the NCC, which was thought to have been related to S-dipping subduction of the Palaeo-Asian oceanic slab beneath the NCC, and it existed for about 50 Ma (320–270 Ma; Zhang et al. Reference Zhang, Zhao, Song, Yang, Hu and Wu2007, Reference Zhang, Zhang, Zhai, Wilde and Xie2009c; Chen, Jahn & Tian, Reference Chen, Jahn and Tian2009; Jian et al. Reference Jian, Liu, Kröner, Windley, Shi, Zhang, Zhang, Miao, Zhang and Tomurhuu2010). Radiolarians found in the argillite beds of the Zhesi Formation from the Zhesi and Xilinhot areas (Fig. 1a) also indicate that a deep marine sedimentary facies persisted during Middle Permian time and the Palaeo-Asian Ocean was not closed until this time (Shang, Reference Shang2004). Moreover, the youngest ENE-trending ophiolite belts found in the CAOB are Late Permian in age, such as the Solon Obo (279 Ma), Ondor Sum (260 Ma) and Banlashan (256 Ma) (Miao et al. Reference Miao, Zhang, Fan, Liu, Zhai, Windley, Kusky and Meng2007), and the undeformed granodioritic dykes intruded the Hegenshan ophiolite (with a zircon U–Pb age of 298 ± 9 Ma) at 244 ± 4 Ma (Miao et al. Reference Miao, Fan, Liu, Zhang, Shi and Guo2008). Based on these observations, we speculate that the final closure of the Palaeo-Asian Ocean and collision between the southern Mongolian terranes and NCC probably took place in latest Permian to earliest Triassic time (c. 250 Ma; Fig. 11a). This conclusion is also supported by the palaeoclimatic evidence. Cope et al. (Reference Cope, Ritts, Darby, Fildani and Graham2005) noted that a widespread climate change took place in North China, which is recorded by a change from the Carboniferous–Early Permian humid climate with coal-bearing sedimentary facies to a Late Permian–Early Triassic arid climate with redbeds.
Liégeois (Reference Liégeois1998) divided an orogenic cycle into four stages: a pre-collisional period characterized by subduction, an arc-continent or continent–continent collision period accommodated by crustal thickening, a post-collisional period and a post-orogenic period. Following this context and the regional magmatism mentioned above, the northern margin of the newly amalgamated North China–Mongolian plate was dominated by post-orogenic regimes during Triassic time (250–200 Ma; Fig. 11b). The prevailing orientations of dyke strikes, as illustrated in the rose diagram in Figure 1c, are nearly the same as those of the maximum principal compressive stress in the NCC during latest Permian to earliest Triassic time (160°–178°; Wan, Reference Wan2004; Hou, Wang & Hari, Reference Hou, Wang and Hari2010), which is also orthogonal to the collisional belt between the NCC and Mongolian arc terranes (Fig. 1a). This phenomenon indicates that dykes were intruded into tensional faults or fractures that formed synchronously with compression during the period of collision between the southern Mongolian terranes and the NCC. Though the faults hosting the shoshonitic dykes formed in a compressional environment, the asthenospheric mantle source of the dykes may also reflect a tensional environment, parallel to the orogene, when the dykes intruded. Away from mid-ocean ridges and hot spots, magma from the asthenosphere is unable to reach the surface because the asthenosphere is deeper, heat flow is lower and the material is confined under higher pressure by a greater thickness of the overlying lithosphere. No evidence for mid-ocean ridges or hot spots exists on the northern margin of the NCC during Triassic time. Therefore, the asthenospheric mantle-derived melt generation in the JCGL must reflect some additional process that resulted in the upwelling of asthenospheric mantle in the Triassic. This may be associated with the lithosphere extension resulting from post-orogenic subduction slab detachment or lithospheric delamination (Fig. 11b). Although these shoshonitic dykes may also have formed in strike-slip or transtensional tectonic regimes (Vaughan, Reference Vaughan1996), the ENE-trending Datong lamprophyre belt (Fig. 1b; 220 Ma; Shao et al. Reference Shao, Zhang, Zhang, Wang and Guo2003), the Triassic A-type granite belt (Fig. 1b; 220–240 Ma, including alkali granite in Guangtoushan and a syenogranite dyke and monzogranite in Jianping; Han, Kagami & Li, Reference Han, Kagami and Li2004; Zhang et al. Reference Zhang, Zhao, Song, Hu, Liu, Yang, Chen and Liu2009c) and the alkaline intrusions belt (Yan et al. Reference Yan, Mu, Xu, He, Tan, Zhao, He, Zhang and Qiao1999; Mu et al. Reference Mu, Shao, Chu, Yan and Qiao2001) from the continental interior of the NCC, are all orthogonal to the extension direction implied by the subduction zone (Figs 1, 11) and preclude these possibilities. The exposure of a Late Triassic metamorphic core complex in the Solonker suture belt also indicates the dominance of extensional tectonics (Davis et al. Reference Davis, Xu, Zheng and Zhang2004).
Combined with the observations mentioned above, we argue that a post-orogenic extensional regime, resulting from the post-collisional subduction slab detachment or lithospheric delamination and magma upwelling, explains the geodynamic setting of these dykes. There are several other lines of evidence supporting magma upwelling and continental crustal growth during Triassic time. The exposure of contemporaneous cumulate (220–237 Ma; Shao et al. Reference Shao, Han, Zhang and Mu1999, Reference Shao, Han and Li2000) and granulite xenoliths (220–251 Ma; Shao, Han & Li, Reference Shao, Han and Li2000; She et al. Reference She, Wang, Li, Zhang, Feng and Li2006) in Kalaqin and Caihulanzi (Figs 1b, 11c) imply that the process of asthenospheric magma underplating and the formation of juvenile lithospheric mantle played a key role in the dykes genesis. The geochemical features of the Middle Triassic mafic–ultramafic complex from Xiaozhangjiakou (XZJK), high ε Hf(t) values (−2.9 to 1.7) and young Hf isotopic model ages (TDM = 0.81−0.98 Ga), also provide direct evidence for the asthenospheric magma underplating (Figs 1b, 11c; Tian et al. Reference Tian, Chen, Liu and Zhang2007).
Consequently, the regional magmatism reflects an integrated orogenic cycle from the collision between the southern Mongolian arc terranes and the NCC to post-orogenic periods. The final collision of these two blocks occurred in Late Permian to Early Triassic time and was immediately followed by the post-collisional/post-orogenic extension geodynamic regimes during Triassic time, in which the JCGL shoshonitic dykes intruded.
6.b.2. Implications for modification of the mantle beneath the NCC in the early Mesozoic
Studies of the late Mesozoic basalts and lamprophyres suggest the existence of an EM1-like SCLM beneath the NCC (e.g. Zhang et al. Reference Zhang, Sun, Zhou, Fan, Zhai and Yin2002; Chen, Jahn & Zhai, Reference Chen, Jahn and Zhai2003; Chen & Zhai, Reference Chen and Zhai2003). However, owing to the intensive thinning and replacement of lithospheric mantle in late Mesozoic time (e.g. Zhang et al. Reference Zhang, Sun, Zhou, Fan, Zhai and Yin2002; Rudnick et al. Reference Rudnick, Gao, Ling, Liu and McDonough2004), little is known about the composition and process of the SCLM beneath the NCC in late Palaeozoic to early Mesozoic time. Additionally, the initiation time for lithospheric thinning is still controversial (Wu et al. Reference Wu, Xu, Gao and Zheng2008; Xu et al. Reference Xu, Li, Pang and He2009). Although most researchers believe that the destruction of the NCC occurred during late Mesozoic time (e.g. Zhang et al. Reference Zhang, Sun, Zhou, Fan, Zhai and Yin2002; Menzies et al. Reference Menzies, Xu, Zhang and Fan2007), other researchers proposed that the destruction probably began in early Mesozoic time (e.g. Han, Kagami & Li, Reference Han, Kagami and Li2004). In a recent paper by Zhang et al. (Reference Zhang, Zhao, Liu, Liu, Chen, Xie and Chen2009b), it is proposed that the lithospheric destruction and thinning of the northern NCC began in Middle–Late Triassic time.
The newly recognized intermediate-mafic shoshonitic dykes provide new constraints on the isotopic compositions and evolution of the mantle reservoirs beneath the northern NCC. Low initial (87Sr/86Sr)i ratios, significantly negative ε Nd(t) values and enrichment in LILE (e.g. Sr and Ba) of the JCGL dykes imply that slightly enriched lithospheric mantle still existed in Late Triassic time. Nevertheless, this enriched SCLM had been modified, weakened and had become thermally and mechanically unstable as indicated by the involvement of underplated asthenospheric melt in the source of the JCGL dykes. Involvement of the underplating asthenospheric melt in magmatism has been considered as an important signal for lithospheric destruction, reactivation or craton thinning (e.g. Zhang et al. Reference Zhang, Zhao, Liu, Liu, Chen, Xie and Chen2009b; Xu et al. Reference Xu, Li, Pang and He2009). The mixed sources of the JCGL dykes (lower crust, SCLM and asthenospheric melt) suggests that the onset of lithospheric destruction and thinning in the northern NCC occurred in Middle–Late Triassic time as a result of post-collisional/post-orogenic subduction slab detachment or lithospheric delamination as suggested by Zhang et al. (Reference Zhang, Zhao, Liu, Liu, Chen, Xie and Chen2009b; Fig. 11).
7. Conclusions
(1) The JCGL dykes intruded at 227 Ma. They are enriched in LILE and LREE without significant Eu anomalies, depleted in HFSE and show some features of shoshonitic rocks.
(2) Low initial 87Sr/86Sr ratios (0.70394 to 0.70592), and a wide range of ε Nd(t) (1.1 to −12.0) and Pb isotope compositions suggest that these dykes might have originated from mixing of the lower crust, lithospheric mantle of the NCC and asthenospheric melt.
(3) These post-orogenic shoshonitic dykes indicate that closure of Palaeo-Asian Ocean had completed before Middle Triassic time, and the CAOB was subsequently tectonically dominated by post-orogenic regimes. Correspondingly, thinning and replacement of the lithospheric mantle beneath the NCC started from Middle Triassic time at least on the northern margin.
Acknowledgements
We thank Y. S. Liu, H. F. Tang, Y. F. Ge and F. X. Cao for their thoughtful comments. S. Zheng and H. H. Chen are acknowledged for their help during LA-ICP-MS U–Pb dating. We are also grateful to two anonymous reviewers for their constructive suggestions, and Dr M. Allen, Taylor Bowen and Kat Piper for their editorial handling. This research was financially supported by the Chang Jiang Scholars and Innovation Group Programme, the Crisis Mines Substitute Resources Prospecting Project, China (Grant No. 2006020035), the Natural National Science Foundation, China (91014002), the academic exploration fund for graduates from China University of Geosciences (CUGYJS0812), and the State Key Laboratory of Geological Processes and Mineral Resources, China University of Geosciences.