1. Introduction
Similar to surfactant molecules, colloidal particles are able to adsorb on fluid–fluid interfaces (Binks Reference Binks2002). In fact, the particle adsorption is even thought of as an effectively irreversible process, since the attachment energy for nanometre- to micrometre-sized particles ranges from hundreds to millions of times the thermal energy. Interfacially trapped particles may generate a strong stereo-hindrance effect to prevent droplet coalescence, and thereby are widely used to stabilize emulsions (Aveyard, Binks & Clint Reference Aveyard, Binks and Clint2003). Owing to the outstanding stability, the interfacial assembly of colloidal particles has also been used to create novel materials, e.g. non-spherical droplets (Cui, Emrick & Russell Reference Cui, Emrick and Russell2013), and bicontinuous emulsions (Herzig et al. Reference Herzig, White, Schofield, Poon and Clegg2007). In addition, colloidal particles are also proposed as a potential alteration of conventional molecular surfactants for applications in harsh environments. For example, nanoparticles may serve as a useful surfactant to promote the mobilization of crude oil droplets in extreme salinity and high-temperature reservoirs (Ranka, Brown & Hatton Reference Ranka, Brown and Hatton2015). In these applications, colloidal droplets (i.e. droplets laden with colloidal particles) are often exposed to flows, the linear shear of which may lead to large deformation or even breakup of droplets, and then affect their specific functions. As such, to understand shear-induced deformation of colloidal droplets is essential for controlling the complex rheology of particle-stabilized emulsions or designing their functions in various applications.
Since the pioneering work by Taylor (Reference Taylor1934), the deformation and breakup of individual droplets in well-characterized flow fields at low Reynolds numbers have gained considerable attention for decades, and have even been thoroughly discussed in a series of reviews (Rallison Reference Rallison1984; Stone Reference Stone1994; Fischer & Erni Reference Fischer and Erni2007; Guido Reference Guido2011; Perazzo et al. Reference Perazzo, Tomaiuolo, Preziosi and Guido2018). From the mechanical viewpoint, as inertial forces are negligible, the droplet is forced to deform by the viscous stress of the external fluid, while its deformation is resisted by the interfacial stress and the viscous stress of the internal fluid. Accordingly, the droplet deformation is primarily governed by two dimensionless parameters, i.e. the capillary number and the viscosity ratio, which actually measure the relative importance of the above-mentioned three stresses. Generally, the droplet deformation increases with the capillary number but decreases with the viscosity ratio. In the last two decades, more efforts have been dedicated to new features of the droplet dynamics resulting from additional complexities of either bulk fluids or the interface. Particularly, thorough understandings have been achieved on the effects of non-Newtonian stresses of the bulk fluids, e.g. extra viscoelastic stress (Yue et al. Reference Yue, Feng, Liu and Shen2005; Aggarwal & Sarkar Reference Aggarwal and Sarkar2007) or elasto-viscoplastic stress (Izbassarov & Tammisola Reference Izbassarov and Tammisola2020) and rich insights have also been gained into the effects of surfactants, which can adsorb onto the droplet surface and alter the interfacial stress significantly. More particularly, surfactant-induced alterations in the droplet dynamics can be originally attributed to the complex rheology of surfactant-laden interfaces, such as surface tension reduction, Marangoni stress, interfacial viscosities and interfacial viscoelasticities (Vlahovska, Blawzdziewicz & Loewenberg Reference Vlahovska, Blawzdziewicz and Loewenberg2009; Yu & Zhou Reference Yu and Zhou2011; Gounley et al. Reference Gounley, Boedec, Jaeger and Leonetti2016; Mandal, Das & Chakraborty Reference Mandal, Das and Chakraborty2017; Luo, Shang & Bai Reference Luo, Shang and Bai2019b). Notably, recent reviews have pointed out that, similar to molecular surfactants, the adsorption of colloidal particles may also give fluid–fluid interfaces a complex rheology (Mendoza et al. Reference Mendoza, Guzman, Martinez-Pedrero, Ritacco, Rubio, Ortega, Starov and Miller2014; Ji et al. Reference Ji, Wang, Zhang and Zang2020). Therefore, in terms of fundamental aspects, it is also of great interest to reveal the effects of particle-laden interfaces on the droplet dynamics under flow.
A limited number of previous studies have explored the dynamics of colloidal droplets in shear flow. In experiments, by using a microfluidic hyperbolic contraction, Mulligan & Rothstein (Reference Mulligan and Rothstein2011) found that the deformation of droplets with micro- or nano-particles suspended inside increased precipitously, and they attributed this effect to the particle adsorption onto the droplet surface. In contrast, Ammel, Moldenaers & Cardinaels (Reference Ammel, Moldenaers and Cardinaels2020) found the droplet deformation was suppressed by concentrated micro-particles inside the droplet, which was attributed to the particle-enlarged droplet viscosity. Note that, both of these two studies reported no direct detail of the particle adsorption. Other experimental studies were directly focused on the effects of particle-laden interfaces through removing extra particles in the bulk phase. By comparing with clean droplets, Mei et al. (Reference Mei, Li, Moldenaers and Cardinaels2016) found that adsorbed particles enlarged the droplet deformation at low particle surface coverage but they induced opposite effects at high coverage, which were attributed to particle-induced surface tension reduction and surface elasticity, respectively. More recently, Kaganyuk & Mohraz (Reference Kaganyuk and Mohraz2020) found that, with the capillary number increasing, particle-stabilized droplets exhibited smaller-then-larger deformation than clean droplets. In summary, previous studies have demonstrated strong evidence that colloidal particles do generate non-negligible, complicated effects on the droplet deformation in shear flow. However, the underlying mechanisms have not been revealed systematically owing to difficulties in measuring the real-time distribution and interaction of adsorbed particles, although several different hypotheses were given to explain previously unforeseen phenomena.
There is a continuous need to unveil the underlying physics of the colloidal droplet dynamics under flow, for example, to investigate detailed roles of interparticle interactions and particle surface coverage or to explain the surprising phenomena observed in previous experiments. By using a well-established lattice Boltzmann method, Frijters, Gunther & Harting (Reference Frijters, Gunther and Harting2012) numerically investigated the effects of nanoparticles as additives at the fluid–fluid interface on the droplet deformation in shear flow with moderate Reynolds numbers, i.e. Re = 1–20. They demonstrated that interfacially trapped nanoparticles significantly increased the droplet deformation, for which the particle inertia was pointed out as an important mechanism. However, in many applications involved with colloidal droplets, e.g. droplet microfluidics, the range of the Reynolds number is much smaller than unity, and hence the inertial effect is usually negligible. More recently, based on a standard phase-field method, Gu & Botto (Reference Gu and Botto2016, Reference Gu and Botto2018, Reference Gu and Botto2020) developed a fast numerical method for simulating particle-laden fluid interfaces, in which the particle–interface and particle–particle interactions were considered efficiently via a linear attachment force model and a hard-sphere contact force model, respectively. However, their studies were limited to particle-covered droplets in a quiescent fluid and shear flow conditions were not discussed.
In the present study, we develop a numerical methodology, based on a three-dimensional finite-difference level-set method, for the simulation of colloidal droplets in shear flow. The motion of colloidal particles is tracked via the point-particle approach with a random-walk model for Brownian diffusion. The particle–fluid interaction is modelled in a fully two-way coupled manner, in which the interaction between particles and the fluid interface is considered efficiently using the attachment force model proposed by Gu & Botto (Reference Gu and Botto2016, Reference Gu and Botto2018, Reference Gu and Botto2020). The particle–particle interactions, including excluded volume interaction, particle collision and hydrodynamic lubrication, are all taken into account. Using this methodology, we perform a systematic investigation of shear-induced deformation of colloidal droplets at low Reynolds numbers, with a particular focus on the role of particle-laden interfaces. The paper is structured as follows. In § 2, the details of the problem statement, mathematical formulations, numerical implementation and governing dimensionless parameters are given. In § 3, we present systematic simulations on the deformation of colloidal droplets in a simple shear flow. More particularly, in § 3.1, the validation of our numerical methodology via simulating the deformation of clean droplets is presented. In § 3.2, we consider the deformation of particle-covered droplets, while the dynamical process of particle adsorption and desorption is omitted. The detailed roles of interparticle interactions and particle surface coverage in the droplet deformation and their underlying mechanisms are systematically investigated. In § 3.3, the deformation of colloidal droplets containing particles suspended inside is studied with consideration of the particle adsorption and desorption. The effects of the particle Brownian diffusion and the particle surface wettability on the droplet deformation are examined. In § 4, we present the summary and discussion.
2. Methodology
2.1. Problem description
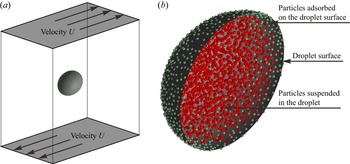
As depicted in figure 1, we consider an isolated colloid-laden droplet suspended in a simple shear flow with a constant shear rate γ. The initially spherical droplet with radius R is located at the centre of a cuboid computational domain. The surrounding fluid and the droplet itself are both incompressible and Newtonian with the same density ρ, and their viscosities are  $\mu$out and
 $\mu$in, respectively. The flow profile in the cuboid domain is kept as a steady, linear shear flow by the upper and bottom moving plates, while the droplet is suddenly released at the time frame t = 0. Notably, the droplet is laden with a set of colloidal particles of total number N and radius a, which are randomly but uniformly suspended inside the droplet or spread over the droplet surface at t = 0. Owing to Brownian diffusion, freely suspended particles may move close to and then absorb onto the droplet surface. The adsorbed particles may also be forced to detach by interparticle repulsive interactions (Gu & Botto Reference Gu and Botto2018). In this study, of special interest is to unravel the role of particle-laden interfaces in the shear-induced deformation of colloidal droplets.
Problem statement. (a) A single colloidal droplet is suspended in simple shear flow bounded by two plane plates moving at the same speed but in opposite directions. (b) The droplet is laden with colloidal particles, which may adsorb onto or desorb from the droplet surface. Red and green dots represent freely suspended particles inside the droplet and those adsorbed on the droplet surface, respectively.

2.2. Level-set method for two-phase flow
The level-set method (Sethian & Smereka Reference Sethian and Smereka2003) is employed to capture the droplet surface and track the droplet deformation. Generally, a single set of continuity and Navier–Stokes equations is employed to solve the flow field both inside and outside the droplet
 \begin{gather}\boldsymbol{\nabla }\boldsymbol{\cdot }\boldsymbol{u} = 0,\end{gather}
 \begin{gather}\frac{{\partial \boldsymbol{u}}}{{\partial t}} + \boldsymbol{\nabla }\boldsymbol{\cdot }(\boldsymbol{uu}) ={-} \boldsymbol{\nabla }p + \frac{1}{{Re}}\boldsymbol{\nabla }\boldsymbol{\cdot }\mu (\boldsymbol{x})(\boldsymbol{\nabla }\boldsymbol{u} + \boldsymbol{\nabla }{\boldsymbol{u}^{\rm T}}) + \boldsymbol{f}.\end{gather}
Here, u is velocity vector; t is time; and p is pressure. Unless other specified, all equations are non-dimensionalized via scaling length by R, velocity by γR, time by 1/γ, pressure by ργ 2R 2 and body force term by ργ 2R. In (2.2), μ(x) is 1 and  $\lambda_{\mu}$ =
 $\mu$in/
 $\mu$out outside and inside the droplet, respectively; Re is the Reynolds number defined as
 $\rho \gamma {R^2}/{\mu _{out}}$; the body force f results from the droplet surface tension fσ and the forces exerted by the suspended particles fp. The droplet surface is represented as the zero contour of the level-set function ϕ, which is a signed distance function to the droplet surface. Accordingly, the droplet surface moves according to the level-set equation (Gibou, Fedkiw & Osher Reference Gibou, Fedkiw and Osher2018)
 \begin{equation}\frac{{\partial \phi }}{{\partial t}} + \boldsymbol{u} \cdot \boldsymbol{n}|\boldsymbol{\nabla }\phi |= 0.\end{equation}
Here, n is the outward unit normal of the droplet surface. Since ϕ does not retain the signed-distance-function property after solving (2.3), the reinitialization equation is employed to transform a level-set function ϕ 0 into a signed distance function ϕ
 \begin{equation}\frac{{\partial \phi }}{{\partial \tau }} + \textrm{sign}({\phi _0})(|\boldsymbol{\nabla }\phi |- 1) = 0.\end{equation}
Here, τ is a fictitious time and sign is a smoothed-out signum function.
To avoid numerical instabilities, the sharp variation of the fluid viscosity across the droplet surface, i.e. μ(x) in (2.2), is smoothed via the following Heaviside function:
 \begin{equation}{H_\varepsilon }(\phi ) = \left\{ {\begin{array}{@{}ll} 0&{\textrm{if}\;\phi < - \varepsilon ,}\\ {\dfrac{1}{2}\left[ {1 + \dfrac{\phi }{\varepsilon } + \dfrac{1}{\rm \pi}\sin \left( {\dfrac{{{\rm \pi}\phi }}{\varepsilon }} \right)} \right]}&{\textrm{if}\;|\phi |\le \varepsilon ,}\\ 1&{\textrm{if}\;\phi > \varepsilon.} \end{array}} \right.\end{equation}
Here, the half smoothing width ε is usually set to 1.5 times of the grid size for solving the flow field, which is usually considered as the half-thickness of the fluid surface. The outward unit normal n and the mean curvature κ of the droplet surface are computed by
 \begin{equation}\boldsymbol{n} = \frac{{\boldsymbol{\nabla }\phi }}{{|\boldsymbol{\nabla }\phi |}}\quad \textrm{and}\quad \kappa ={-} \boldsymbol{\nabla }\boldsymbol{\cdot }\boldsymbol{n}.\end{equation}
The body force fσ due to the droplet surface tension can then be calculated as follows:
 \begin{equation}{\boldsymbol{f}_\sigma } ={-} \frac{1}{{Re}}\frac{1}{{Ca}}\kappa \boldsymbol{\cdot }{\delta _\varepsilon }(\phi )\boldsymbol{\cdot }\boldsymbol{\nabla }\phi .\end{equation}
Here, Ca is the clean capillary number defined as  $\mu$outγR/σc, where σc is the clean surface tension; and
 ${\delta _\varepsilon }(\phi ) = \partial {H_\varepsilon }(\phi )/\partial \phi$ is the smoothed Dirac delta function.
2.3. Governing equations for particle motion
The Lagrangian point-particle approach is employed to track the particle motion, which has been widely used for efficient simulation of dispersed multiphase flows (Balachandar & Eaton Reference Balachandar and Eaton2010). According to Newton's second law, the governing equation for the particle motion is
 \begin{equation}\frac{{4{\rm \pi}}}{3}{a^3}{\rho _p}\frac{{\textrm{d}{\boldsymbol{u}_p}}}{{\textrm{d}t}} ={-} {\boldsymbol{F}_{drag}}+ {\boldsymbol{F}_{ip}}+{\boldsymbol{F}_{pp}} + \frac{{4{\rm \pi}}}{3}{a^3}({\rho _p} - \rho )\boldsymbol{g}.\end{equation}
For the convenience of understanding, all variables in this equation are dimensional. Here, ρp is particle density; up is particle velocity vector; g is gravitational acceleration; Fdrag is the hydrodynamic drag force due to the particle–fluid interaction; Fpp represents the forces due to interparticle interactions; and Fip is the attachment force due to the particle–interface interaction.
For simplicity, the self-rotation of particles is omitted in this study, thus the particle–fluid interaction is considered via the Stokes drag force model as follows:
 \begin{equation}{\boldsymbol{F}_{drag}} = 6{\rm \pi}{f_d}{\mu _{out}}a({\boldsymbol{u}_p} - {\boldsymbol{u}_f}).\end{equation}
Here, uf is the fluid velocity at the particle centre; fd is the drag coefficient, which is usually 1 for particles freely suspended in the bulk fluid. For particles immersed in the fluid interface, the drag coefficient fd shows significant changes when the droplet has a different viscosity from the surrounding fluid. According to previous analytical studies (Pozrikidis Reference Pozrikidis2007; Dörr et al. Reference Dörr, Hardt, Masoud and Stone2016), we modify the drag coefficient fd as follows:
 \begin{equation}{f_d} = \left\{ {\begin{array}{@{}ll} 1&{\textrm{if}\;d > a,}\\ {\dfrac{1}{2}\left( {1 + \dfrac{9}{{16}}\dfrac{d}{a}} \right) + \dfrac{1}{2}\left( {1 + \dfrac{9}{{16}}\dfrac{{ - d}}{a}} \right){\lambda_\mu }}&{\textrm{if}\; - a \le d \le a,}\\ {{\lambda_\mu }}&{\textrm{if}\;d < - a.} \end{array}} \right.\end{equation}
Here, d is the distance between the particle centre and the fluid interface, which is negative for particles suspended inside the droplet.
Next, the inertial force term and the gravitational and buoyancy force term are briefly discussed. Equation (2.8) can be transformed to dimensionless form by dividing both sides by  ${\mu _{out}}\gamma {R^2}$
 \begin{equation}\frac{{4{\rm \pi}}}{3}{\lambda _{\rho p}}{\omega ^3}Re\frac{{\textrm{d}{\boldsymbol{u}_p}}}{{\textrm{d}t}} = ({\boldsymbol{F}_{ip}}+ {\boldsymbol{F}_{pp}}) - 6{\rm \pi}{f_d}\omega ({\boldsymbol{u}_p} - {\boldsymbol{u}_f}) + \frac{{4{\rm \pi}}}{3}{\omega ^3}({\lambda _{\rho p}} - 1)\frac{{Re}}{{Fr}}\frac{\boldsymbol{g}}{{|\boldsymbol{g}|}}.\end{equation}
All variables are dimensionless, but the symbols are kept the same for simplicity. Here, λρp = ρp/ρ is the particle-to-fluid density ratio; ω = a/R is the particle-to-droplet size ratio; and Fr is the Froude number defined as γ 2R/|g|. In our present study, λρp, ω, Re and Fr are set to approximately <10, 10−2, 10−1 and 100, respectively. As a consequence, the inertial force term and the gravitational and buoyancy force term in (2.11) are negligible compared with the hydrodynamic drag force term, i.e. the ratios are smaller than 10−4. Then, the governing equation for the particle motion can be further simplified into the following form:
 \begin{equation}\frac{{\textrm{d}{\boldsymbol{r}_p}}}{{\textrm{d}t}}= {\boldsymbol{u}_p} = {\boldsymbol{u}_f} + \frac{{{\boldsymbol{F}_{ip}}+ {\boldsymbol{F}_{pp}}}}{{6{\rm \pi}{f_d}\omega }},\end{equation}
where rp is particle position vector.
The particle Brownian motion is taken into account via the random-walk model, which can be modelled as a Wiener process (Ma et al. Reference Ma, Bhattacharya, Kuksenok, Perchak and Balazs2012). Thus, the following stochastic differential equation is derived as the final form of the governing equation for the particle motion:
 \begin{equation}\textrm{d}{\boldsymbol{r}_p} = \sqrt {\frac{{\textrm{d}t}}{{P{e_p}}}} \boldsymbol{Ran} + \textrm{d}t\left( {{\boldsymbol{u}_f} + \frac{{{\boldsymbol{F}_{ip}} + {\boldsymbol{F}_{pp}}}}{{6{\rm \pi}{f_d}\omega }}} \right).\end{equation}
Here, Ran is a Gaussian-distributed random variable with mean 0 and variance 3; Pep is the particle Péclet number defined as  $\gamma {R^2}/{D_p}$, where Dp is the particle diffusion coefficient.
Following the technique proposed by Gu & Botto (Reference Gu and Botto2016, Reference Gu and Botto2018, Reference Gu and Botto2020), the particle–interface interaction is considered efficiently by applying an attachment force Fip on particles immersed in the fluid interface, which is computed by
 \begin{equation}{\boldsymbol{F}_{ip}} = \left\{ {\begin{array}{@{}ll} {\dfrac{{{f_{ip}}{\rm \pi}\boldsymbol{d}}}{{Ca}}}&{\textrm{if}\;|\boldsymbol{d}|\le \omega ,}\\ 0&{\textrm{if}\;|\boldsymbol{d}|> \omega .} \end{array}} \right.\end{equation}
Here, d is the vector pointing from the particle centre to the droplet surface with the minimum distance. In this model, the effects of physical and chemical properties of the particle surface on the particle–interface interaction are included into the dimensionless parameter fip
 \begin{equation}{f_{ip}} = 2{(1 - |\cos {\theta _p}|)^2}.\end{equation}
Here, θp is the contact angle that the particles make with the fluid interface.
Regarding the particle–particle interactions, the excluded volume interaction, particle collision and hydrodynamic lubrication are considered in this study, thus the force Fpp in (2.8) actually consists of three parts as follows:
 \begin{equation}{\boldsymbol{F}_{pp}}= {\boldsymbol{F}_{pp,m}} + {\boldsymbol{F}_{pp,h}} + {\boldsymbol{F}_{pp,l}}.\end{equation}
Following the technique widely used in previous studies (Ma et al. Reference Ma, Bhattacharya, Kuksenok, Perchak and Balazs2012; Liu et al. Reference Liu, Bhattacharya, Kuksenok, He, Aizenberg, Aizenberg and Balazs2016; Zhao & Yong Reference Zhao and Yong2017, Reference Zhao and Yong2018), the repulsive part of the Morse potential is employed for the excluded volume interaction between two particles, and the attractive part is used for the weak attractive interaction, if any. The Morse potential in the dimensional form is given by
 \begin{equation}{\psi _m}(r) = \left\{ {\begin{array}{@{}ll} {{\varepsilon_{rep}}{{(1 - {\textrm{e}^{ - (r - {r_m})/{\lambda_m}}})}^2}}&{\textrm{if}\;r < {r_m},}\\ {{\varepsilon_{att}}{{(1 - {\textrm{e}^{ - (r - {r_m})/{\lambda_m}}})}^2}}&{\textrm{if}\;{r_m} \le r < {r_m} + (\ln 2){\lambda_m},}\\ 0&{\textrm{if}\;r \ge {r_m} + (\ln 2){\lambda_m}.} \end{array}} \right.\end{equation}
Here, r is the distance between two particles; εrep and εatt are the repulsive and attractive Morse interaction strengths, respectively; λm measures a length scale over which significant changes show in the interaction potential; and rm is the specific distance over which the Morse interaction force becomes zero. To avoid particle overlap, the Hertz potential is employed to account for the contact force between two particles (Frijters et al. Reference Frijters, Gunther and Harting2012; Xie & Harting Reference Xie and Harting2018; Vowinckel et al. Reference Vowinckel, Withers, Luzzatto-Fegiz and Meiburg2019), which is given in the dimensional form by
 \begin{equation}{\psi _h}(r) = \left\{ {\begin{array}{@{}ll} {{\varepsilon_h}{{({r_h} - r)}^{5/2}}}&{\textrm{if}\;r < {r_h},}\\ 0&{\textrm{if}\;r \ge {r_h}.} \end{array}} \right.\end{equation}
Here, εh is the Hertz interaction strength and rh characterizes the specific distance over which the contact force becomes zero. Accordingly, the interparticle interaction force Fpp ,m owing to the Morse potential can be given in the dimensionless form as follows:
 \begin{align}{\boldsymbol{F}_{pp,m}} = \left\{ {\begin{array}{@{}ll} {\sum\limits_{j = 1}^N {\dfrac{{2\omega \varepsilon_{rep}^ \ast }}{{Ca\lambda_m^ \ast }}[1 - {\textrm{e}^{ - (r - \omega r_m^ \ast )/\omega \lambda_m^ \ast }}]\,{\textrm{e}^{ - (r - \omega r_m^ \ast )/\omega \lambda_m^ \ast }}\dfrac{{{\boldsymbol{r}_j} - {\boldsymbol{r}_i}}}{{r + 2\omega }}} }&{\textrm{if}\;r < \omega r_m^ \ast ,}\\ {\sum\limits_{j = 1}^N {\dfrac{{2\omega \varepsilon_{att}^ \ast }}{{Ca\lambda_m^ \ast }}[1 - {\textrm{e}^{ - (r - \omega r_m^ \ast )/\omega \lambda_m^ \ast }}]\,{\textrm{e}^{ - (r - \omega r_m^ \ast )/\omega \lambda_m^ \ast }}\dfrac{{{\boldsymbol{r}_j} - {\boldsymbol{r}_i}}}{{r + 2\omega }}} }&{\textrm{if}\;\omega r_m^ \ast \le r < \omega r_m^ \ast{+} (\ln 2)\omega \lambda_m^ \ast ,}\\ 0&{\textrm{if}\;r \ge \omega r_m^ \ast{+} (\ln 2)\omega \lambda_m^ \ast .} \end{array}} \right.\end{align}
In this equation, the dimensionless parameters are defined as follows:  $\varepsilon _{rep}^\ast = {\varepsilon _{rep}}/({\sigma _c}{a^2})$,
 $\varepsilon _{att}^\ast = {\varepsilon _{att}}/({\sigma _c}{a^2})$,
 $\lambda _m^\ast = {\lambda _m}/a$ and
 $r_m^\ast = {r_m}/a$. For considering particle collisions, the contact force Fpp ,h owing to the Hertz potential can be given by
 \begin{equation}{\boldsymbol{F}_{pp,h}} = \left\{ {\begin{array}{@{}ll} {\sum\limits_{j = 1}^N { - \dfrac{5}{2}\dfrac{{\omega \varepsilon_h^ \ast }}{{Ca}}{{(r_h^ \ast{-} r/\omega )}^{3/2}}\dfrac{{{\boldsymbol{r}_j} - {\boldsymbol{r}_i}}}{{r + 2\omega }}} }&{\textrm{if}\;r < \omega r_h^ \ast ,}\\ 0&{\textrm{if}\;r \ge \omega r_h^ \ast .} \end{array}} \right.\end{equation}
Here,  $\varepsilon _h^\ast = {\varepsilon _h}{a^{1/2}}/{\sigma _c}$ and
 $r_h^\ast = {r_h}/a$. In the following discussion, the superscript ‘*’ representing dimensionless parameters is removed for convenience. Notably, when the distance between two approaching particles is smaller than the fluid grid size, a lubrication model is needed to appropriately consider the hydrodynamic interaction between them. The normal lubrication force Fpp ,l directing opposite to the relative velocity ui − uj of two particles is calculated by (Frijters et al. Reference Frijters, Gunther and Harting2012; Xie & Harting Reference Xie and Harting2018; Vowinckel et al. Reference Vowinckel, Withers, Luzzatto-Fegiz and Meiburg2019)
 \begin{equation}{\boldsymbol{F}_{pp,lu}} = \left\{ {\begin{array}{@{}ll} {\sum\limits_{j = 1}^N { - \dfrac{{6{\rm \pi}{f_{lu}}{\omega^2}}}{{\max (r - 2a,\varepsilon )}}\dfrac{{{\boldsymbol{r}_i} - {\boldsymbol{r}_j}}}{{r + 2\omega }}\boldsymbol{\cdot }({\boldsymbol{u}_i} - {\boldsymbol{u}_j})\dfrac{{{\boldsymbol{r}_i} - {\boldsymbol{r}_j}}}{{r + 2\omega }}} }&{\textrm{if }r < {h_e},}\\ 0&{\textrm{if }r \ge {h_e}.} \end{array}} \right.\end{equation}
Here, ε is a critical length that is much smaller than the fluid grid size he. When the interparticle gap r − 2a becomes smaller than ε, the lubrication force is held constant to avoid numerical instability (Vowinckel et al. Reference Vowinckel, Withers, Luzzatto-Fegiz and Meiburg2019). The hydrodynamic lubrication force strongly depends on the viscosity of the fluid in the interparticle gap, thus the coefficient flu has the same form as fd as shown in (2.10). Notably, the tangential lubrication force is omitted in our present methodology, because it is usually much smaller than the normal one, as pointed out in previous numerical studies of particle suspensions (Lambert et al. Reference Lambert, Picano, Breugem and Brandt2013; Suzuki & Hayakawa Reference Suzuki and Hayakawa2019).
2.4. Modelling particle-induced effects on droplet surface tension
Notably, adsorbed particles do not affect the intrinsic tension of the fluid interface at all, but the repulsive interparticle interaction generates a positive surface pressure and hence reduces the effective surface tension (Manikantan & Squires Reference Manikantan and Squires2020). In our present methodology, the particle–fluid interaction is considered in a two-way coupled manner, thus the back influence of the particles on the flow field is taken into account. To this end, the counteracting forces of the hydrodynamic drag force Fdrag and the attachment force Fip acting on the particles are added into the momentum conservation equation. Therefore, the body force term fp in (2.2) exerted by the particles can be given in a dimensionless form by
 \begin{equation}{\boldsymbol{f}_p} ={-} Re[{\boldsymbol{F}_{ip}} - 6{\rm \pi}{f_d}\omega ({\boldsymbol{u}_p} - {\boldsymbol{u}_f})]\delta ({\boldsymbol{r}_f} - {\boldsymbol{r}_p}).\end{equation}
Here, δ(rf − rp) is the smoothed Dirac delta function (Luo, Shang & Bai Reference Luo, Shang and Bai2019a) with rf and rp representing the positions of fluid grid points and the particles, respectively. It has been verified by Gu & Botto (Reference Gu and Botto2020) that the effect of interparticle interactions on the effective surface tension of particle-laden interfaces can be correctly reproduced via adding the body force term fp, i.e. (2.22), into (2.2).
2.5. Numerical implementation
The governing equations are solved via our own three-dimensional finite-difference code on a regular collocated uniform Cartesian grid. The solution of the fluid velocity and pressure is decoupled via a four-step projection method. All spatial derivatives in (2.1) and (2.2) are discretized by using the second-order central difference scheme. For the temporal discretization, the Crank–Nicolson semi-implicit technique is used for the diffusion term, and the three-stage Runge–Kutta technique is used for the convection and body force terms. The pressure Poisson equation is solved only in the last Runge–Kutta stage to reduce computational cost, and the four-level multigrid technique and the alternating-direction implicit scheme are employed to further improve the computing efficiency. The flow solver is discussed in detail in our previous work (Luo & Bai Reference Luo and Bai2018). Regarding the level-set advection and reinitialization equations, i.e. (2.3) and (2.4), the fifth-order weighted essentially non-oscillatory scheme and the third-order total variation diminishing Runge–Kutta scheme are used for the spatial and temporal discretization, respectively. To advance the displacement of colloidal particles, a two-stage Runge–Kutta method is employed to solve the governing equation for the particle motion, i.e. (2.13). More details of numerical implementation have been included in Appendix A.
2.6. Summary of dimensionless parameters
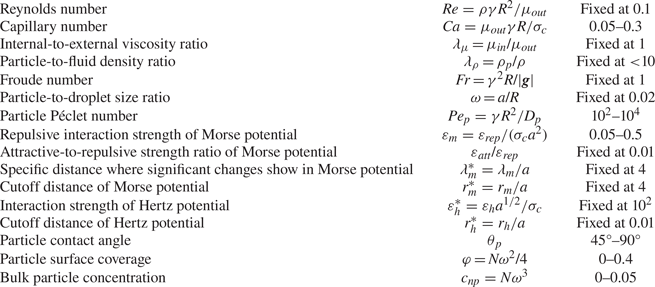
By summarizing all the governing equations, we find 15 dimensionless parameters in total that may affect the dynamics of colloidal droplets in shear flow. The governing dimensionless parameters and their values used in this study are summarized in table 1. Notably, the total particle number N is usually replaced by the particle surface coverage on the droplet surface φ = Nω 2/4 or the bulk particle concentration inside the droplet  ${c_{np}} = N{\omega ^3}$.

Consulting previous experimental studies (Mulligan & Rothstein Reference Mulligan and Rothstein2011; Mei et al. Reference Mei, Li, Moldenaers and Cardinaels2016; Kaganyuk & Mohraz Reference Kaganyuk and Mohraz2020), the Reynolds number is usually far less than 1, thus the inertial effect is negligible. According to our previous numerical studies (Luo, He & Bai Reference Luo, He and Bai2015; Luo et al. Reference Luo, Shang and Bai2019b), Re = 0.1 is sufficiently low to eliminate the inertial effect, while further reduction of Re significantly increases the computing time. As discussed in § 2.3, since both Re and ω are quite small, the effects of λρ and Fr are negligible. The value of several important parameters used in our simulations, i.e. Ca = 0.05–0.3, ω = 0.01–0.04, θp = 45°–90°, Pep = 102–104, φ = 0–0.4 and cnp = 0–0.05, covers the typical ranges presented in previous experiments. The parameters related to interparticle interactions are not available from previous experiments, but the Morse and Hertz potentials have been adopted in several numerical studies of particle suspensions (Liu et al. Reference Liu, Bhattacharya, Kuksenok, He, Aizenberg, Aizenberg and Balazs2016; Gu & Botto Reference Gu and Botto2018, Reference Gu and Botto2020; Xie & Harting Reference Xie and Harting2018; Zhao & Yong Reference Zhao and Yong2018). In our present study, we find that εh = 100 and rh = 0.01 are sufficiently high to prevent particle overlap. In addition, λm and rm are set to 4 referring to previous numerical studies, while εrep = 0.05–0.5 is used to reveal the effects of the repulsive interparticle interaction on the droplet dynamics. Note that, in the following discussion, εrep is replaced by εm for the convenience of understanding.
3. Results
3.1. Validation: deformation of clean droplets
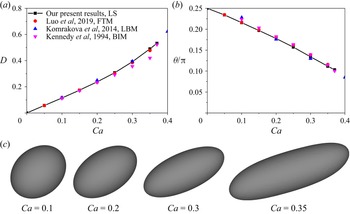
The flow solver has been thoroughly validated in our previous studies on capsule or droplet dynamics in shear flow, in which the front tracking method is used for interface tracking (Luo et al. Reference Luo, He and Bai2015; Luo & Bai Reference Luo and Bai2018; Luo et al. Reference Luo, Shang and Bai2019b). Here, we further validate the solver for the level-set function by modelling the deformation of clean droplets in simple shear flow. According to the verification presented in our previous work, the time step of 2.5 × 10⁻⁴, the computational domain size of 10R×6R×10R and the Eulerian resolution of 120 × 72 × 120 are sufficient to eliminate their effects on droplet dynamics, which are therefore used in our present study. Actually, as the Eulerian resolution is increased from 120 × 72 × 120 to 200 × 120 × 200, the variation in the deformation of particle-covered droplets is limited to below 1 %. Similar to previous studies, the droplet dynamics is mainly characterized by Taylor parameters: (i) the deformation index, D = (L − B)/(L + B), where L and B are the semimajor and semiminor axes of the deformed, ellipsoidal droplet, respectively; and (ii) the inclination angle θ between the major axis of the deformed droplet and the flow direction.
Quantitative comparisons between our level-set method and others’, including the boundary integral method by Kennedy, Pozrikidis & Skalak (Reference Kennedy, Pozrikidis and Skalak1994), the lattice Boltzmann method by Komrakova et al. (Reference Komrakova, Shardt, Eskin and Derksen2014) and the front tracking method by ourselves (Luo et al. Reference Luo, Shang and Bai2019b), are conducted via predicting the deformation of clean droplets in simple shear flow. As shown in figure 2, the steady-state deformation index D and inclination angle θ are plotted as functions of the capillary number Ca. In qualitative terms, three-dimensional shape profiles of deformed droplets resemble ellipsoids, which is the same as the observation in previous studies. In quantitative terms, the droplet deformation predicted by our methods and Komrakova et al.'s are slightly higher than that by Kennedy et al., which may be attributed to the difference in the Reynolds number, i.e. Re = 0.1 in our methods but Re = 0 in Kennedy et al.. Notably, the largest relative error between our method and Komrakova et al.'s is limited to below 4.5 %. The relative error is smaller than 2.5 % between our own level-set and front tracking methodologies, in which the same flow solver is employed. Besides, the critical capillary number Cacr leading to droplet breakup is roughly equal to the 0.375 predicted by our level-set method, which is very close to that by Kennedy et al.'s, i.e. Cacr = 0.37.
Validation of our level-set methodology via modelling of the deformation of clean droplets in simple shear flow. The steady-state deformation index D (a) and inclination angle θ (b) are compared between our present results and those from previous reports, including our own work using the front tracking method (Luo et al. Reference Luo, Shang and Bai2019b), Komrakova et al. (Reference Komrakova, Shardt, Eskin and Derksen2014) using the lattice Boltzmann method and Kennedy et al. (Reference Kennedy, Pozrikidis and Skalak1994) using the boundary integral method. The steady-state shape profiles for four examples are plotted in panel (c).

3.2. Deformation of particle-covered droplets
The particle-induced change in the effective tension of the droplet surface is expected to be the primary reason for potential effects of colloidal particles on the whole droplet deformation. As such, in this subsection, we focus on the deformation of particle-covered droplets in simple shear flow. All particles are initially set on the droplet surface in a random but uniform pattern, and there is no particle freely suspended in the droplet bulk phase. Besides, the dynamics of detachment and reattachment of the particles is omitted via setting a quite large strength, i.e. fip = 10 in (2.14), for the attachment force from the particle–interface interaction.
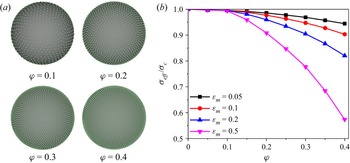
We first examine how adsorbed particles affect the effective surface tension by computing the pressure jump across the surface of particle-covered droplets in a quiescent fluid. As indicated in figure 3(a), adsorbed particles on the droplet surface are arranged into ordered hexagonal microstructures when they reach the steady state, which is primarily due to the repulsive interparticle interaction. Generally, adsorbed particles induce a reduction in the effective surface tension σeff at the whole droplet scale, as indicated in figure 3(b). This effective reduction is mainly attributed to the interparticle repulsion, which generates a two-dimensional surface pressure counteracting the fluid interface tension. Our results are qualitatively similar to those reported in a previous study by Gu & Botto (Reference Gu and Botto2016). There is a minimum particle coverage φmin necessary to generate a non-zero effect on the effective surface tension because of the finite range of the interparticle repulsive force. However, σeff decreases in a nearly exponential form at φ > φmin, because the effect of the interparticle repulsion becomes significant. Besides, the reduction in σeff is significantly pronounced at larger εm, since the interparticle repulsion is enhanced.
The effect of adsorbed particles on the effective surface tension is studied by computing the pressure difference across the surface of particle-covered droplets suspended in a quiescent fluid. Adsorbed particles are initially distributed over the whole droplet surface in a random, uniform pattern. (a) The microstructure of the particle monolayer at the steady state is plotted for different particle coverages φ. The green filled dots represent adsorbed particles. (b) The effective surface tension σeff of particle-laden interfaces is plotted as a function of φ at different interparticle interaction strengths εm.

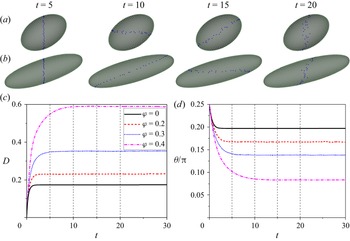
In figure 4, we then present several typical examples of particle-covered droplets in shear flow, in which the time evolution of the deformation index D and the inclination angle θ is plotted for different particle surface coverages, i.e. φ = 0, 0.2, 0.3 and 0.4. Similar to clean droplets, particle-covered droplets are also deformed to an ellipsoidal shape, and eventually they always remain in this steady shape with their surfaces rotating continuously. However, particle-covered droplets generally show larger deformation than clean ones over the whole transient time period, and this enhancement of droplet deformability is more obvious at higher particle surface coverage. As a consequence, particle-covered droplets exhibit smaller inclination angles along the flow direction. Besides, the total time for particle-covered droplets to reach the steady state is also much longer than that for clean droplets, and it is further lengthened by increasing particle surface coverage, which is consistent with the expectation that droplets with higher deformability align more with the flow.
Typical examples of particle-covered droplets in shear flow. Initially, all particles are uniformly overspread over the droplet surface and they are not allowed to detach. Three-dimensional shape profiles of deformed droplets at different time frames, with green filled dots representing adsorbed particles, are presented for different particle surface coverages, i.e. φ = 0.2 and 0.4 in panels (a) and (b), respectively. The blue marked dots are used to indicate the rotation motion of adsorbed particles along with the droplet surface. Time evolution of (c) the deformation index D and (d) the inclination angle θ are plotted for different φ. Here, the capillary number Ca and the interparticle interaction strength εm are fixed at 0.15 and 1, respectively.

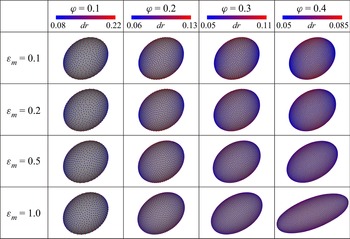
The above-mentioned few examples indicate that adsorbed particles promote droplet deformation in general. We next perform systematic simulations to reveal the role of particle-laden interfaces in the shear-induced deformation of particle-covered droplets. To give a direct illustration, three-dimensional shape profiles of deformed droplets at the steady state are presented in figure 5 for different combinations of the interparticle interaction strength εm and the particle surface coverage φ. Generally, particle-covered droplets assume a nearly ellipsoidal shape. Notably, the distribution of adsorbed particles on the droplet surface is also presented. In principle, adsorbed particles cannot aggregate together owing to the interparticle repulsion and hence have freedom to move over the whole droplet surface. For this reason, the distribution of adsorbed particles may appear non-uniform. For all cases shown, the particles show a denser packing near the droplet tips than other surface areas. Actually, this specific distribution no longer changes with time (data not shown), although adsorbed particles rotate continuously along the droplet surface. This specific distribution should be mainly induced by the surface convection, which has also been indicated as the reason for a similar distribution of surfactant molecules (Luo et al. Reference Luo, Shang and Bai2019b). Certainly, this non-uniformity of particle distribution decreases obviously with φ, since adsorbed particles have less freedom to move freely due to the stronger interparticle repulsion.
The steady-state shape of particle-covered droplets in shear flow is plotted for different combinations of the interparticle interaction strength εm and the particle surface coverage φ with Ca = 0.1. The colour contour represents the interparticle distance dr to indicate the non-uniform distribution of adsorbed particles over the droplet surface, which is calculated for each particle (e.g. marked as i) as the average dr of the six closest particles to the particle i.

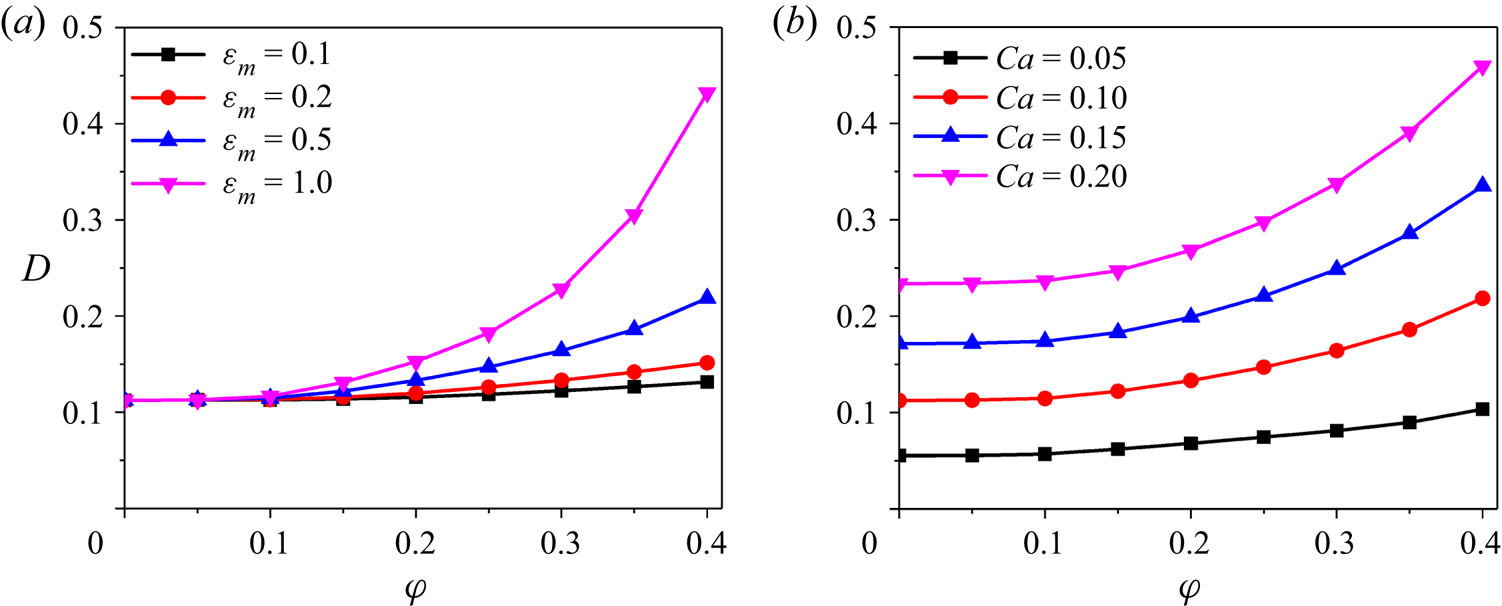
Next, we study the effects of adsorbed particles on the droplet deformation in quantitative terms. For this purpose, the steady-state deformation index D is plotted in figure 6 as a function of the particle surface coverage φ for different interparticle repulsive strengths εm or different capillary numbers Ca. Adsorbed particles do cause substantial changes in both D and θ that can be obviously observed at fixed Ca. Generally, the droplet deformability is remarkably increased, which can be originally attributed to the particle-induced reduction of the effective surface tension (as indicated in figure 3). More particularly, D increases significantly with φ and it increases more rapidly at larger εm. For instance, with φ increasing from 0 to 0.4, D increases from 0.12 to 0.13 and 0.43 for εm = 0.1 and 1, respectively. Actually, the effect of the particle-to-droplet size ratio ω is also examined by increasing it from 0.01 to 0.04, which is found to be negligible as long as φ and εm are fixed (data not shown). Notably, this result does not mean that the particle size a has no impact on the droplet deformation, which has actually been included in the effects of the particle surface coverage  $\varphi = N{a^2}/4{R^2}$ and the dimensionless interparticle interaction strength
 ${\varepsilon _m} = {\varepsilon _{rep}}/({\sigma _c}{a^2})$. In summary, adsorbed particles increase the droplet deformability in general, and this effect is significantly enhanced by increasing interparticle repulsive interactions.
Steady-state deformation of particle-covered droplets in shear flow. (a) Steady deformation index D is plotted as a function of the particle surface coverage φ for different interparticle interaction strengths εm, while Ca is fixed at 0.1. (b) Presents D vs φ for different capillary number Ca with εm = 0.5.

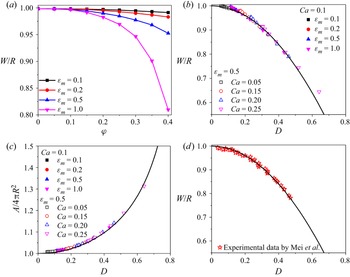
The droplet deformation in the vorticity direction of the simple shear flow is also important for grasping the full three-dimensional shape of deformed droplets, thus we analyse the steady width W/R in figure 7. Apparently, the droplet deformation in the vorticity direction is also significantly increased by adsorbed particles, as indicated by the obvious decrease of W/R. This reduction of W/R is also strengthened by increasing either φ or εm. In our previous study on clean and surfactant-laden droplets in shear flow (Luo et al. Reference Luo, Shang and Bai2019b), an unexpected relation between W/R and D was found, which is given as a phenomenological fitting curve, i.e. W/R = 1 − D 2. As shown in figure 7(b), all data points for particle-covered droplets also collapse onto this single curve. In addition, as shown in figure 7(c), the droplet surface area A also agrees quite well with that of the ellipsoid with three principal axes of L/R = 1/(1 − D), W/R = 1 − D 2 and B/R = 1/(1 + D). Further, we compare the curve W/R = 1 − D 2 with reported experimental data for particle-covered droplets (Mei et al. Reference Mei, Li, Moldenaers and Cardinaels2016) in figure 7(d), in which excellent agreement is also observed. These results indicate that particle-covered droplets in simple shear flow also retain their three-dimensional shape as a perfect ellipsoid with three principal axes of L/R = 1/(1 − D), W/R = 1 − D 2 and B/R = 1/(1 + D).
Steady-state three-dimensional shape of particle-covered droplets in shear flow. (a) The droplet width W/R in the vorticity direction is plotted as a function of the particle surface coverage φ for different interparticle interaction strengths εm with Ca = 0.1; (b) W/R is plotted versus the deformation index D. Here, the same parameter values are used as in figure 6. The solid line represents the curve of W/R = 1 − D 2 found in our previous study of surfactant-laden droplets (Luo et al. Reference Luo, Shang and Bai2019b). (c) The droplet surface area A is plotted versus D. The solid curve represents the ellipsoid with three principal axes of L/R = 1/(1 − D), W/R = 1 − D 2, B/R = 1/(1 + D). (d) The curve of W/R = 1 − D 2 also agrees well with previous experimental data (Mei et al. Reference Mei, Li, Moldenaers and Cardinaels2016).

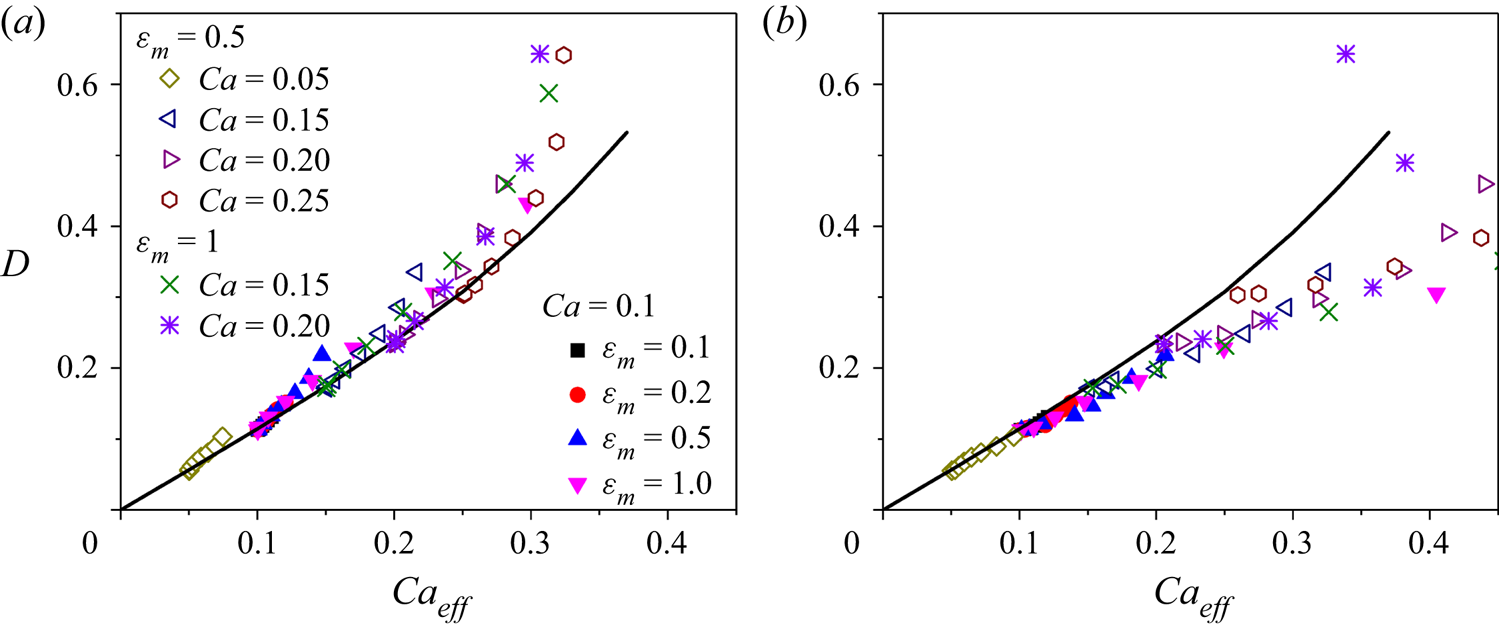
The particle-induced reduction of the effective surface tension is an obvious and important mechanism to explain the enlarged deformation of particle-covered droplets in shear flow, but it may not be the only mechanism involved. To test this hypothesis, we plot the steady deformation D of particle-covered droplets in figure 8(a) as a function of the effective capillary number  $C{a_{eff}} = {\mu _{out}}\gamma R/{\sigma _{eff}}$, where σeff is evaluated by using data in figure 3 with given values of φ and εm. Apparently, most data points show positive deviations from the curve for clean droplets, especially at high particle coverage. Note that Caeff in figure 8(a) characterizes the mean value of σeff over the whole droplet surface, which is computed using the averaged particle coverage, i.e.
 ${\varphi _{eff}} = N{\rm \pi}{a^2}/A$ (A is the surface area of deformed droplets). Considering the obvious non-uniformity of the particle distribution, we plot, in figure 8(b), D versus Caeff-max calculated basing on the minimum value of σeff on the droplet surface, which usually appears at the droplet tips owing to the densest particle packing. Most data points then fall below the curve for clean droplets, but a few (i.e. Ca = 0.2 and φ = 0.4) remain above. It can then be concluded that, besides the overall reduction of the effective surface tension over the whole droplet surface, the non-uniform distribution of adsorbed particles is another important reason responsible for the particle-increased droplet deformability. More particularly, compared with the droplet with a uniform, constant effective surface tension, a non-uniform particle distribution makes the surface tension lower at the droplet ends but higher at the droplet equator. Consequently, the droplet ends and equator require a more sharp and more flat shape, respectively, to satisfy the normal viscous stress balance, which eventually leads to larger deformation of the whole droplet. Actually, a similar phenomenon was also observed in previous studies (Stone & Leal Reference Stone and Leal1990; Li & Pozrikidis Reference Li and Pozrikidis1997) for surfactant-laden droplets with extremely high Péclet numbers, i.e. O(1000), which is, however, not obvious and even disappeared at low Péclet numbers, i.e. O(0.1)−O(10).
Steady deformation D is plotted as a function of the effective capillary number  $C{a_{eff}} = {\mu _{out}}\gamma R/{\sigma _{eff}}$, where σeff is the effective surface tension of particle-laden interfaces, as discussed in figure 3. In panel (a), σeff is evaluated by using
 ${\varphi _{eff}} = N{\rm \pi}{a^2}/A$, where A is the surface area of deformed droplets. In panel (b),
 $C{a_{eff - max}} = {\mu _{out}}\gamma R/{\sigma _{eff - min}}$, where σeff-min is the minimum σeff appearing near the droplet tips with the densest particle packing. The solid line represents the deformation of clean droplets, for comparison purposes. Notably, as D increases for the same symbol, the particle surface coverage increases from 0.05 to 0.4, i.e. φ = 0.05, 0.1, 0.15, 0.2, 0.25, 0.3, 0.35 and 0.4.

Notably, in figure 8, several surprising phenomena are observed for the deformation of particle-covered droplets at relatively high particle coverage. Firstly, the critical threshold of the effective capillary number leading to droplet breakup is generally lower than that for clean droplets. Secondly, particle-covered droplets may exhibit extremely large deformation, i.e. D > 0.65, which is not observed for clean droplets, i.e. D < 0.6. Thirdly, the effective capillary number Caeff no longer increases with the particle surface coverage increasing at high levels (e.g. φ > 0.35), while D still increases significantly at high levels. The control parameter φ = Nω 2/4 is computed using the surface area of initially spherical droplets, which actually only depends on the particle number N with ω fixed. However, Caeff is computed using the effective particle coverage φeff, which depends on the surface area A of deformed droplets besides the particle number N. Accordingly, for highly deformed droplets at high φ, φeff may no longer increase with N increasing, because the surface area A is also increased.
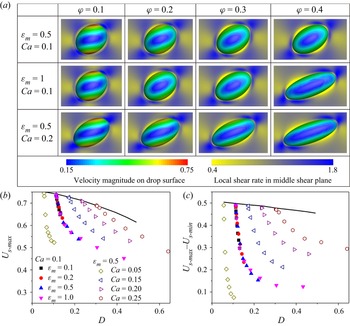
We also analyse the effect of adsorbed particles on the magnitude Us of the droplet surface velocity in figure 9. Apparently, Us shows large variations along the phase angle direction, especially in the middle shear plane. Generally, Us reaches its maximum near the droplet equator and its minimum near the droplet tips. This non-constant velocity over the droplet surface induces the surface convection effect, which is the most fundamental reason for the denser particle packing at the droplet tips. Basically, Us depends on the droplet shape, as indicated in figures 9(b) and 9(c) by the decrease of the maximum surface velocity Us‐max and the difference between the maximum and minimum surface velocities Us‐max − Us‐min. More importantly, adsorbed particles significantly decrease the droplet surface mobility; that is, both Us‐max and Us‐max − Us‐min are reduced, even if the effect of the droplet shape is excluded via plotting them versus D. This reduced surface mobility is similar to that observed for surfactant-laden droplets, which is induced by the tangential Marangoni stress (Li & Pozrikidis Reference Li and Pozrikidis1997). The particle-induced reduction of Us results primarily from the particle jamming effect (Luo & Bai Reference Luo and Bai2020). Accordingly, the variation extent of Us characterized by Us‐max − Us‐min, decreases with increasing interparticle repulsion, since the particle jamming is strengthened with increasing εm or φ. In turn, decreased surface mobility leads to a reduction in the non-uniformity of the particle distribution (figure 6), since the surface convection effect is weakened. Notably, the local shear rate adjacent to the droplet surface increases with decreasing surface mobility, as shown in figure 9(a). As a consequence, the shear force acting on the droplet surface by the surrounding fluid is likely to be enlarged. The increased shear force on the droplet tips may be an important factor in dragging the droplet to a more prolate shape. Therefore, the particle-reduced surface mobility may be another potential mechanism for that particle-covered droplets show higher deformability than clean droplets even at same capillary numbers (figure 8).
The effect of adsorbed particles on the flow field near the droplet surface and that on the droplet surface. (a) Three-dimensional contour for the velocity magnitude Us on the droplet surface and the two-dimensional contour for the local shear rate  $\partial u/\partial z + \partial w/\partial x$ in the middle shear plane are both presented. (b) The maximum surface velocity Us‐max and (c) the difference between the maximum and minimum surface velocities Us‐max − Us‐min are plotted as functions of the droplet deformation index D. Same parameter values are used as in figure 8.

3.3. Deformation of colloidal droplets
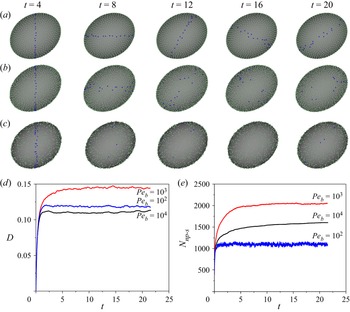
In real applications, colloidal particles are often suspended in the bulk phase and particle exchange between the bulk phase and the droplet surface may happen in the form of detachment and reattachment. In this section, we further consider the deformation of colloidal droplets in shear flow, which consists of a particle-laden surface enclosing a particle suspension. In figure 10, we present typical examples of time evolution of the droplet deformation D and the total number of particles immersed in the droplet surface Nnp‐s for different particle Péclet numbers, i.e. Pep = 104, 103 and 102. Generally, these colloidal droplets also deform into an ellipsoidal shape. For Pep = 104, the particle Brownian diffusion is quite weak, thus the particles rarely detach once they adsorb onto the droplet surface. Besides, the adsorbed particles obviously exhibit a continuous rotation owing to the surface convection, as indicated by the marked particles in figure 10(a). At Pep = 103, the adsorbed particles still show rare detachment, but they no longer rotate continuously along with the droplet surface. In contrast, the adsorbed particles may move over the droplet surface in a random pattern due to an increased diffusion effect. As Pep further decreases to 102, Brownian motion causes adsorbed particles to fluctuate at the interface, and the particles even show frequent detachment and reattachment. For this reason, Nnp‐s exhibits obvious oscillations for Pep = 102, but it increases slowly and continuously without oscillation for Pep = 103 and 104. Accordingly, at large Péclet numbers, i.e. Pep = 104, colloidal droplets exhibit similar deformation behaviours as particle-covered droplets. However, at Pep = 102, the colloidal droplet shows larger deformation than the particle-covered droplet with the same number of adsorbed particles.
Examples of colloidal droplets in shear flow. At the initial time, all particles are randomly, uniformly suspended inside the droplet and none are set on the droplet surface. In panels (a–c), droplet shape profiles at different time frames, with green filled dots representing the particles adsorbed on the droplet surface, are presented for different particle Péclet numbers, i.e. Pep = 104, 103 and 102. Blue marked dots indicate the rotating motion of several particles adsorbed on the droplet surface. Time evolution of (d) the droplet deformation D and (e) the total number of adsorbed particles Nnp‐s is plotted for the three examples in (a). Here, Ca = 0.1, εm = 0.5, ω = 0.02, θp = 90° and cnp = 0.05.

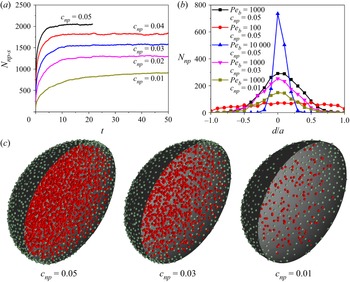
Apparently, the surface concentration of particles adsorbed on the droplet surface depends on the bulk particle concentration inside the droplet. In figure 11, the time evolution of Nnp‐s is presented for different bulk particle concentrations, i.e. cnp = 0.01–0.05, with the particle Péclet number Pep fixed at 103. For all given values of cnp, the freely suspended particles diffuse close to and adsorb onto the droplet surface, thus Nnp‐s shows a continuous increase with time and reaches a plateau eventually. As a consequence, the droplet deformation D continuously increases as the number of adsorbed particles increases (data not shown). Notably, at all time frames, Nnp‐s significantly increases with cnp increasing. Furthermore, the number density profile of adsorbed particles along the interface thickness is presented in figure 11(b) for different cnp or different Peb. Owing to the attachment force from the droplet surface, the number density of adsorbed particles decreases gradually along the normal direction departing from the interface to both sides. As cnp decreases, the number density profile of adsorbed particles shows little change, but it shows an overall decrease. More interestingly, as Peb decreases, the number density profile becomes much more flattened, which indicates more frequent detachment of adsorbed particles due to the pronounced diffusion effect. Notably, the particles freely suspended in the bulk fluid adjacent to the interface need to overcome the repulsive interaction forces from adsorbed particles to finally adsorb onto the droplet surface, when the particle diffusion also plays an important role. Consequently, as Peb increases from 103 to 104, the total number of adsorbed particles, on the contrary, decreases (figure 10e), although the particle detachment is weakened.
Deformation of colloidal droplets with different particle concentrations inside the droplet. (a) Time evolution of the total number of adsorbed particles Nnp‐s is plotted for different particle concentrations cnp with Pep = 103 and θp = 90°. (b) The number density profile of adsorbed particles along the interface thickness, where Nnp is the number of adsorbed particles immersed in the thin fluid layer with a thickness of 0.1a with an average distance of d to the droplet surface. Note that negative d represents positions inside the droplet. (c) Droplet shape profiles at the steady state are presented with green and red filled dots representing the particles adsorbed on the droplet surface and those freely suspended in the bulk fluid, respectively.

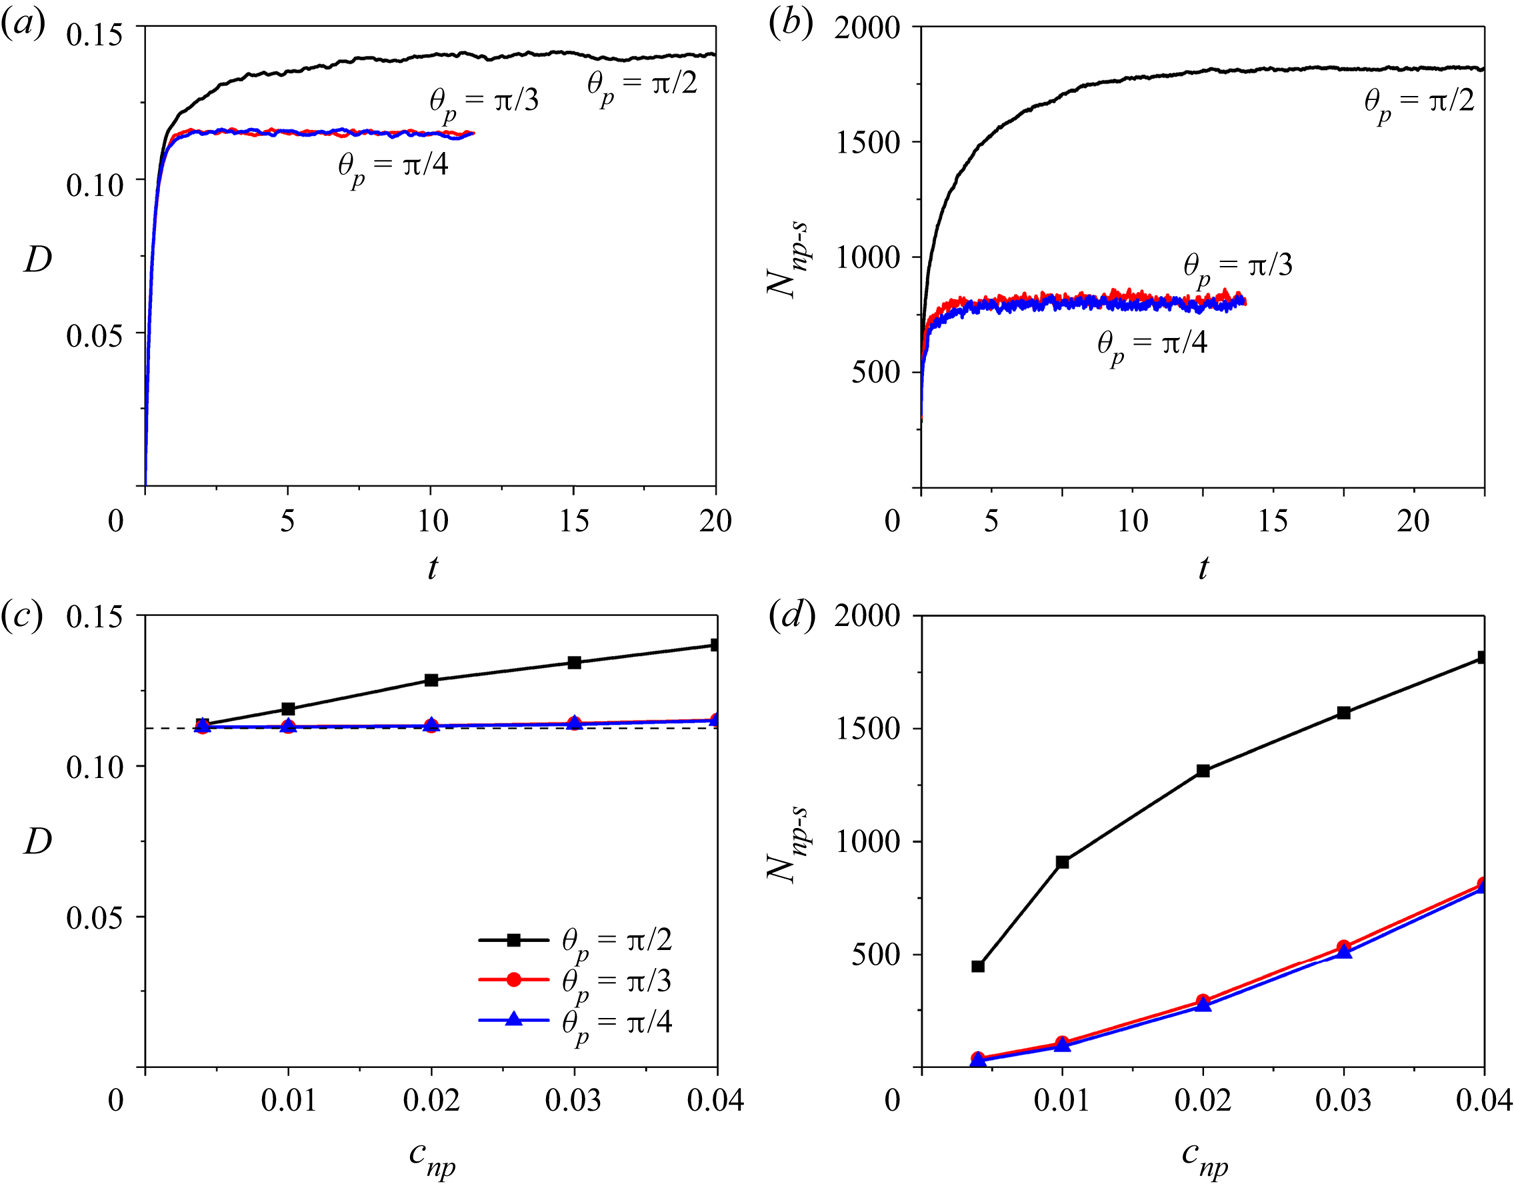
Besides the particle-laden interface, freely suspended particles may also affect the droplet deformation, since they may increase the effective viscosity of the bulk phase. In figure 12, we examine the effects of particle surface wettability characterized by the particle contact angle θp on the droplet deformation. With θp decreasing, the total number of particles immersed in the droplet surface Nnp‐s shows a remarkable decrease, since the attachment force to prevent particle detachment is weakened, as indicated by (2.14). As a consequence, the droplet deformation D, either in the transient or the steady state, significantly decreases with θp. Notably, at small particle contact angle, i.e. θp = 45°, the particle coverage on the droplet surface becomes lower than 0.05, and hence the effect of particle-laden interfaces on the droplet deformation is negligible. Under this circumstance, the particle concentration in the bulk phase is found to produce little effect on the droplet deformation. This is because the bulk concentration of freely suspended particles used in this study, i.e. cnp = 0–0.05, is too low to generate an obvious impact on the effective viscosity of the bulk phase. More particularly, as pointed out by Guazzelli & Pouliquen (Reference Guazzelli and Pouliquen2018), the effective viscosity of a dilute particle suspension can be predicted well by using Einstein's linear dependence law, i.e.  $\mu$eff = 1 + 2.5cnp, when cnp is below the value of approximately 0.05. Therefore, in our simulations with cnp = 0–0.05, the particle-induced effective increase of the internal-to-external viscosity ratio is limited to below 0.125, which can be only induce a quite small change of the droplet deformation (i.e. <1 %) according to the prediction of D = (19
 $\lambda_{\mu}$ + 16)/(16
 $\lambda_{\mu}$ + 16)Ca (Rallison Reference Rallison1984). Therefore, for the parameter values used in this study, the particle-laden interface makes the predominant contribution to the particle-induced change of the droplet deformation in shear flow. However, in future work, it should be of great interest to explore the effects of coupling interactions between a particle-laden interface and bulk concentrated particles on the deformation of colloidal droplets, because dense suspensions may induce a significant increase of the effective fluid viscosity and even other complex non-Newtonian rheologies (Guazzelli & Pouliquen Reference Guazzelli and Pouliquen2018; Morris Reference Morris2020).
The effect of particle surface wettability on the deformation of colloidal droplets in shear flow. Time evolution of (a) the droplet deformation D and (b) the total number of adsorbed particles Nnp‐s are plotted for different particle contact angles, i.e. θp = 90°, 60° and 45°, with Pep = 103 and cnp = 0.04. In panels (c) and (d), D and Nnp‐s at the steady state are plotted as functions of cnp for different particle contact angles, i.e. θp = 90°, 60° and 45°. The dashed line in panel (c) represents the deformation of the clean droplet with Ca = 0.1.

4. Summary and discussion
In this work, we have developed a numerical methodology for simulating the flow dynamics of colloidal droplets, i.e. droplets laden with colloidal particles. With a particular focus on the collective effects of many particles on the droplet dynamics, the point-particle approach is employed to track the particle motion, which has proven an excellent choice to gain balance between the achievable numerical accuracy and affordable computational resources (Balachandar & Eaton Reference Balachandar and Eaton2010). Several methodologies based on the lattice Boltzmann method (Usta et al. Reference Usta, Perchak, Clarke, Yeomans and Balazs2009; Zhao & Yong Reference Zhao and Yong2017, Reference Zhao and Yong2018; Xie & Harting Reference Xie and Harting2018) have been developed for droplets containing colloidal particles inside, while the particles adsorbed onto the droplet surface and their effects on the surface tension have not been discussed in detail. Gu & Botto (Reference Gu and Botto2016, Reference Gu and Botto2018, Reference Gu and Botto2020) developed a fast numerical method for particle-laden fluid interfaces, in which the particle–interface interactions and their effects on the effective interfacial tension are treated efficiently. However, existed point-particle approaches do not consider the physical volume and Brownian motion of suspended particles. Our present methodology has further accounted for these special effects, therefore, it may serve as a useful tool for studying the dynamics of colloidal droplets under flow conditions. Notably, instead of the lattice Boltzmann method and phase-field method used in previous studies, we employed the level-set method to capture the fluid interface because of its advantage in computing local interfacial properties, e.g. mean curvature and the point-to-interface distance vector, which are crucial for calculating the body force term fpe in (2.28).
Via systematic simulations, we have demonstrated that colloidal particles freely suspended in the bulk phase at low volume fractions, i.e. cnp < 0.05 used in this study, produce quite a limited effect on the droplet deformation, which is consistent with previous experimental and numerical data (Usta et al. Reference Usta, Perchak, Clarke, Yeomans and Balazs2009; Ammel et al. Reference Ammel, Moldenaers and Cardinaels2020). This observation can be explained by the fact that the particle-induced additional viscous stress is rather small at low particle concentration. Nevertheless, the same number of particles may show a significant impact on the droplet deformation, once they adsorb onto and remain immersed in the droplet surface. This effect is indicated by our results for particles with a neutral surface wettability, i.e. with the particle contact angle θp fixed at 90°. Further, at typically high particle Péclet numbers, i.e. Pep = 104, the particles show rare detachment once they adsorb onto the droplet surface. In particular, the number of adsorbed particles increases slowly owing to the weak Brownian diffusion, which explains the slowly increased droplet deformation observed in previous experiments (Mei et al. Reference Mei, Li, Moldenaers and Cardinaels2016). These results indicate that the particle-laden interface plays an essential role in the deformation of the whole droplet, as long as the particles prefer to stay on the droplet surface. Actually, it would be of great interest to investigate the effect of the particle Brownian motion on the droplet deformation, especially at small Péclet numbers (e.g. Pep ~ O(1)). Strong diffusion along the droplet surface and frequent detachment and reattachment are likely to make the particle distribution much more uniform, and hence the deviation of the D–Caeff curve from that of clean droplets would be probably suppressed. However, the time step size to discretize the random-walk model decreases with Pep in a proportional manner, and hence huge computing time is needed for solving (2.13). Apparently, a high-speed parallel scheme is still urgently needed to improve the efficiency of our numerical implementation in order to further investigate the deformation of colloidal droplets with Pep as low as O(1).
To focus our attention on the role of the particle-laden interface, we have performed a systematic investigation on the deformation of particle-covered droplets in a simple shear flow. Of particular interest is the determination of the detailed roles of interparticle interactions and particle surface coverage on the droplet deformation. In general, adsorbed particles promote the droplet deformation, which is consistent with previous experimental data for droplets with low particle coverage (Mei et al. Reference Mei, Li, Moldenaers and Cardinaels2016; Kaganyuk & Mohraz Reference Kaganyuk and Mohraz2020). In these experiments, the droplet deformation was also found to be suppressed by adsorbed particles at a near-complete coverage, which was not studied in our present study. Numerical simulations by Frijters et al. (Reference Frijters, Gunther and Harting2012) also predicted increased droplet deformation by adsorbed particles with a particle coverage range of 0–0.55. This increasing effect was attributed to the additional inertial forces from adsorbed particles that accumulated near the droplet tips. By setting a low Reynolds number, our present study demonstrates a completely different mechanism for the particle-enhanced droplet deformability, which is the particle-induced reduction of the effective surface tension. In fact, in both experiments by Mei et al. (Reference Mei, Li, Moldenaers and Cardinaels2016) and Kaganyuk & Mohraz (Reference Kaganyuk and Mohraz2020), the droplet Reynolds number was limited to below 10−1. Therefore, we believe that the particle-reduced macroscopic surface tension should probably be the real mechanism for the increased deformation of droplets with relatively low particle coverage observed in previous experiments.
It should be noted that, whether or not particles can reduce the interfacial tension in a manner analogous to surfactants remains a long ongoing debate in the colloidal science community, especially considering that previously reported experimental data can be contradictory (Fan & Striolo Reference Fan and Striolo2012; Manga et al. Reference Manga, Hunter, Cayre, York, Reichert, Anna, Walker, Williams and Biggs2016; Zhang et al. Reference Zhang, Wang, Zhou, Zhao, Benz, Tcheimou, Meredith and Behrens2017). Nevertheless, most studies agree that particles adsorbed at a fluid interface do not induce a microscopic-level change to the interfacial tension as surfactants do, but they may alter the apparent interfacial tension from a macroscopic perspective, especially at sufficiently high particle coverage, e.g. lower Young–Laplace pressure for particle-covered droplets (Ji et al. Reference Ji, Wang, Zhang and Zang2020; Guzmán et al. Reference Guzmán, Abelenda-Núñez, Maestro, Ortega, Santamaria and Rubio2021). However, no consensus has been reached on the interpretation of the particle-induced reduction of the apparent interfacial tension (Mears, Muntz & Thijssen Reference Mears, Muntz and Thijssen2020). In general, there are three hypotheses, i.e. (i) the interfacial energy per unit area is reduced by the favourable wetting of particles (Du et al. Reference Du, Glogowski, Emrick, Russell and Dinsmore2010; Zhang et al. Reference Zhang, Wang, Zhou, Zhao, Benz, Tcheimou, Meredith and Behrens2017); (ii) the interparticle repulsive interaction generates an in-plane surface pressure against the base interfacial tension (Basavaraj et al. Reference Basavaraj, Fuller, Fransaer and Vermant2006; Mears et al. Reference Mears, Muntz and Thijssen2020); (iii) an insightful thermodynamic description of particle-laden interfaces should consider both the wetting effect and the interparticle interactions (Hua, Bevan & Frechette Reference Hua, Bevan and Frechette2018; Guzmán et al. Reference Guzmán, Abelenda-Núñez, Maestro, Ortega, Santamaria and Rubio2021). In the present study, the second hypothesis is discussed in detail, since it is well known in the fluid mechanics community. In fact, all these three hypotheses of particle-reduced surface tension can be easily implemented in our numerical methodology, in case of any need to test them in future work. Notably, it is worth pointing out that the droplet deformation is always found to be significantly affected by the absorbed particles, as long as they induce obvious changes in the effective surface tension (figure 8).
Furthermore, by plotting the droplet deformation versus the effective capillary number, we have found that particle-covered droplets still exhibit larger deformations than clean droplets, even at the same capillary number. Therefore, the particle-induced reduction of the overall surface tension cannot completely explain the promoting role of particle-laden interfaces in the deformation of particle-covered droplets. We have discussed two other potential mechanisms, i.e. the non-uniform particle distribution on the droplet surface and the particle-induced reduction of the droplet surface mobility. Firstly, the effective capillary number is actually evaluated based on the mean value of the particle coverage over the whole droplet surface. However, adsorbed particles generally exhibit an obviously non-uniform distribution due to the surface convection. In particular, the particles usually show a much denser packing at the droplet tips, which was also observed in experiments by Kaganyuk & Mohraz (Reference Kaganyuk and Mohraz2020) for partially coated droplets. Apparently, the effects of this non-uniform particle distribution on the droplet deformation cannot be properly described by using the effective capillary number. Secondly, the droplet surface velocity is reduced by adsorbed particles, especially in the denser packing area near the droplet tips. The reduced surface mobility has also been demonstrated in our previous study of particle-covered droplets in microchannels (Luo & Bai Reference Luo and Bai2020). Owing to the reduced surface mobility, the surrounding shear force acting on the droplet surface becomes larger, which may drag the two droplet tips in opposite directions and hence make a potential contribution to increasing the droplet deformation.
Several open issues remain in our numerical methodology. Firstly, owing to the presence of a triple contact line, Brownian diffusion of colloidal particles at fluid interfaces is quite different from that in the bulk fluid, and hence adsorbed particles may have different diffusion coefficients along or perpendicular to the interface (Boniello et al. Reference Boniello, Blanc, Fedorenko, Medfai, Mbarek, In, Gross, Stocco and Nobili2015; Dörr et al. Reference Dörr, Hardt, Masoud and Stone2016). Therefore, the interfacial diffusion of adsorbed particles needs to be considered for some real applications. Secondly, the interparticle interaction model is another issue that should be paid more attention to. Our present methodology includes the hydrodynamic lubrication and contact forces, which are usually required for the point-particle approach to particle suspensions (Frijters et al. Reference Frijters, Gunther and Harting2012; Xie & Harting Reference Xie and Harting2018; Vowinckel et al. Reference Vowinckel, Withers, Luzzatto-Fegiz and Meiburg2019). We also consider additional steric or overlap repulsion owing to a polymer coating on the particle surface, which is often used to stabilize colloidal particles in practical systems (Garbin et al. Reference Garbin, Jenkins, Sinno, Crocker and Stebe2015; Israelachvili Reference Israelachvili2015). However, many other kinds of interaction forces (especially short-range ones) need to be further accounted for carefully, e.g. electrostatic, Van der Waals and capillary interactions (Deshmukh et al. Reference Deshmukh, van den Ende, Stuart, Mugele and Duits2015; Sharifi-Mood, Liu & Stebe Reference Sharifi-Mood, Liu and Stebe2015), which are particularly important for densely packed particle monolayers. It should also be noted that the quantitative description of these interparticle forces by modifying classical theories for colloidal interactions may fail at the nanoscale (Batista, Larson & Kotov Reference Batista, Larson and Kotov2015). Besides, the parameters used for interparticle interactions may have quite different values for different types of particles, but they are very difficult to measure in experiments (Kim et al. Reference Kim, Gao, Chai, Ashby, Ribbe, Hoagland and Russell2019b). Thirdly, previous experimental studies (Mei et al. Reference Mei, Li, Moldenaers and Cardinaels2016; Kaganyuk & Mohraz Reference Kaganyuk and Mohraz2020) proposed the hypothesis that weak attractive interactions between particles could explain the suppressed droplet deformation via surface elasticity. In addition, modifying the relative magnitude of attractive-to-repulsive interactions is found to induce a complex viscoelasticity at fluid interfaces with densely packed particles (Rahman et al. Reference Rahman, Laal-Dehghani, Barman and Christopher2019). More importantly, attractive interparticle interactions confer the possibility of the formation of interfacial cracks, i.e. fractures of the particle monolayer (Kim et al. Reference Kim, Rendos, Ganesh and Brown2019a; Chai et al. Reference Chai, Hasnain, Bahl, Wong, Li, Geissler, Kim, Jiang, Gu and Li2020), after which new interfacial areas are exposed and hence the fluid interface present a more heterogeneous surface tension. Apparently, these complex interfacial properties may induce a much more rich dynamics of particle-laden droplets, especially under extreme deformation (Garbin Reference Garbin2019), which can be revealed by using our methodology via modifying attractive interparticle interactions in (2.19).
Funding
This work was supported by the National Natural Science Foundation of China (No. 51976160 and No. 51888103).
Declaration of interests
The authors report no conflict of interest.
Appendix A. Numerical implementation
Once the fluid velocity is updated via solving (2.1) and (2.2), the level-set function can then be advected by solving (2.3) and (2.4). Both the level-set advection and reinitialization equations are discretized via the fifth-order weighted essentially non-oscillatory scheme in space and via the third-order total variation diminishing Runge–Kutta scheme in time. More details can be found in the recent review by Gibou et al. (Reference Gibou, Fedkiw and Osher2018). It is well known that mass loss occurs in level-set methods for multiphase flow simulations. One important reason is the numerical error in the reinitialization procedure. We use the technique proposed by Sussman & Fatemi (Reference Sussman and Fatemi1999) to correct ϕ after the reinitialization procedure as follows:
 \begin{equation}\frac{{\partial \phi }}{{\partial t}} = \textrm{sign}({\phi _0})(1 - |\boldsymbol{\nabla }\phi |) + {\lambda _{ijk}}{\delta _\varepsilon }(\phi )|\boldsymbol{\nabla }\phi |.\end{equation}
Here, λijk is a constant for the fluid grid cell ijk, which is calculated by
 \begin{equation}{\lambda _{ijk}} = \; \frac{{ - \int_{{\varOmega _{ijk}}} {{\delta _\varepsilon }(\phi )\textrm{sign}({\phi _0})(1 - |\boldsymbol{\nabla }\phi |)} }}{{\int_{{\varOmega _{ijk}}} {{\delta _\varepsilon }(\phi ){\delta _\varepsilon }(\phi )|\boldsymbol{\nabla }\phi |} }}.\end{equation}
Here,  $\varOmega$ijk represents the domain of
 $[(x,y,z)|{x_i}_{ - 1/2} < x < {x_i}_{ + 1/2},{y_j}_{ - 1/2} < y < {y_j}_{ + 1/2}, {z_k}_{ - 1/2} < z < {z_k}_{ + 1/2}]$.
Although mass conservation may be preserved during the reinitialization procedure, there is still mass loss due to the numerical error in solving the level-set advection equation. In our present methodology, the mass loss per time step is limited to around 10−6. For most simulations in this study, the total time step is approximately 5 × 10⁴ and it may reach 5 × 10⁵ for a few cases. If there is no correction at each time step, the total loss of the droplet volume at the final steady state may become as high as 5 %–50 %. To further remove this error in the droplet volume, we use the interface-correction method proposed by Ge et al. (Reference Ge, Loiseau, Tammisola and Brandt2018). The droplet volume is modified to its initial value by moving the zero level set along the outward normal direction of the droplet surface, which is realized via solving the following equation:
 \begin{equation}\frac{{\partial \phi }}{{\partial t}} + \frac{{\delta V}}{{\delta t}}\frac{\kappa }{A}\boldsymbol{\cdot }|\boldsymbol{\nabla }\phi |= 0.\end{equation}
Here, δV is the droplet volume change during time interval δt and A is the droplet surface area. The convection term is discretized by employing the fifth-order weighted essentially non-oscillatory scheme. The correction of the droplet volume is conducted at each time step via solving (A3), and then the final change of the droplet volume for all simulations is limited to around 10−3. Notably, during the droplet volume modification at each time step, the displacement of the droplet surface is actually quite small, i.e. around 10−5a, thus this artificial correction of the droplet volume has little impact on the motion of adsorbed particles.
Regarding the solution of the governing equation for particle motion, i.e. (2.13), the two-stage Runge–Kutta method is employed as follows:
 \begin{gather}{\boldsymbol{r}^{n + 1/2}} = {\boldsymbol{r}^n} + \sqrt {\frac{{\varDelta t}}{{P{e_p}}}} \boldsymbol{Ran + u}_f^n\varDelta t + \frac{{\varDelta t}}{{6{\rm \pi}{f_d}\omega }}{({\boldsymbol{F}_{ip}} + {\boldsymbol{F}_{pp}})^n},\end{gather}
 \begin{gather}{\boldsymbol{r}^{n + 1}} = {\boldsymbol{r}^n} + \sqrt {\frac{{\varDelta t}}{{P{e_p}}}} \boldsymbol{Ran + }\frac{{\varDelta t}}{2}\left[ {\boldsymbol{u}_f^n + \frac{{{{({\boldsymbol{F}_{ip}} + {\boldsymbol{F}_{pp}})}^n}}}{{6{\rm \pi}{f_d}\omega }} + \boldsymbol{u}_f^{n + 1/2} + \frac{{{{({\boldsymbol{F}_{ip}} + {\boldsymbol{F}_{pp}})}^{n + 1/2}}}}{{6{\rm \pi}{f_d}\omega }}} \right].\end{gather}
Here, Δt is the time step size; n and n+1 are time-step numbers; n+1/2 represents the intermediate variables. The fluid velocity uf at the particle position is interpolated from adjacent fluid grids u via the Dirac delta function as follows:
 \begin{equation}{\boldsymbol{u}_f}(\boldsymbol{x^{\prime}}) = \delta (x - x^{\prime})\delta (y - y^{\prime})\delta (z - z^{\prime})\boldsymbol{u}(\boldsymbol{x}).\end{equation}
Here, the discrete form of the Dirac delta function δ is given by
 \begin{equation}\delta (r) = \left\{ {\begin{array}{@{}ll} {(5 - 2|r/{h_e}|- \sqrt { - 7 + 12|r/{h_e}|- 4{{(|r/{h_e}|)}^2}} )/8{h_e}}&{{h_e} \le |r|< 2{h_e},}\\ 0&{2{h_e} \le |r|,}\\ {(3 - 2|r/{h_e}|+ \sqrt {1 + 4|r/{h_e}|- 4{{(r/{h_e})}^2}} )/8{h_e}}&{0 \le |r|< {h_e}.} \end{array}} \right.\end{equation}
To compute the attachment force Fip due to the particle–interface interaction (i.e. (2.14)), the distance |d| between the particle and the droplet surface and the force direction d/|d| are also interpolated from the level-set function via the Dirac delta function
 \begin{gather}|\boldsymbol{d}|= \delta (x - x^{\prime})\delta (y - y^{\prime})\delta (z - z^{\prime})\phi ,\end{gather}
 \begin{gather}\boldsymbol{d}/|\boldsymbol{d}|= \delta (x - x^{\prime})\delta (y - y^{\prime})\delta (z - z^{\prime})\frac{{\boldsymbol{\nabla }\phi }}{{|\boldsymbol{\nabla }\phi |}}.\end{gather}
One thing that needs to be emphasized in the solution of the momentum equation (i.e. (2.2)) is that the particle-induced body force terms fp and fpe (i.e. (2.22) and (2.24)) needs to be distributed over several grids to avoid point-source-induced numerical instability, which is also realized by using the discrete Dirac delta function as shown in (A7).