1. Introduction
Pore structure, as an important parameter for evaluating the reservoir quality and hydrocarbon generation potential of source rock, is receiving increasing attention from scholars. As the source rock, as well as the reservoir of shale gas and oil, the study on the pore structure characteristics of shale is particularly important. Shale is a type of ultra-tight oil and gas reservoir with the pore size of a nanometer order. Among them, organic nano-pores are mainly from the pores or fractures developed during the accumulation and thermal evolution of organic matter, and the resulting pore network provides an important space for oil and gas adsorption and storage (Curtis Reference Curtis2002; Jarvie et al. Reference Jarvie, Hill, Ruble and Pollastro2007; Yao et al. Reference Yao, Liu, Tang, Tang and Huang2008; Loucks et al. Reference Loucks, Reed, Ruppel and Hammes2012; Cai et al. Reference Cai, Liu, Pan, Yao, Li and Qiu2013; Wang et al. Reference Wang, Xue, Tian, Wilkins and Wang2015). Reservoir space and efficiency are the research core of the shale reservoir. However, different from marine shale in North America, continental lacustrine shale in China has complex mineral compositions, abundant rock types, rapid phase transformation and strong reservoir heterogeneity. Organic-rich shales can be formed in different sedimentary environments and undergo compaction, diagenesis, tectonism and the superimposition of geological fluids, resulting in the diversity and complexity of shale pore and fracture systems (Loucks & Ruppel Reference Loucks and Ruppel2007; Abouelresh & Slatt Reference Abouelresh and Slatt2012; Bai et al. Reference Bai, Yu, Liu, Xie, Han, Zhang, Ye and Ge2018, Reference Bai, Yu, Han and Shen2020; Liu et al. Reference Liu, Zhang, Xu, Wang, Liu, Guo, Lin, Yan, Qin and Li2022).
In general, shale reservoirs have low porosity and small overall pore diameter, and due to the adsorption of internal organic matter and microporous surface, the proportion of free movable oil is much lower than that of conventional reservoirs (Yang et al. Reference Yang, Ning and Liu2014; Li et al. Reference Li, Zheng, Bi, Wu and Wang2017a; Sun et al. Reference Sun, Tuo, Zhang, Wu and Chai2019a). Therefore, the representation on the pore structure and fracture system should be combined with various characterisation methods to describe the types and combinations of reservoir space and to determine the lower limit of pore size and porosity of oil storage, which plays an important guiding role in the prediction of the shale oil sweet spot.
Hydrocarbon generation and expulsion simulation have been widely used as an experimental means to simulate the thermal evolution process of organic matter at long-term low temperature under actual geological conditions with short-term high temperature by using the time–temperature compensation principle (Dieckmann et al. Reference Dieckmann, Schenk and Horsfield2000; Sun et al. Reference Sun, Tuo, Zhang, Wu, Wang and Zheng2015, Reference Sun, Tuo, Zhang, Wu and Chai2019b; Song et al. Reference Song, Tuo, Zhang, Wu, Su, Li, Zhang and Zhang2018, Reference Song, Wang, Tuo, Wu and Wei2021; Wu et al. Reference Wu, Zhang, Sun, Li, Zhang and Long2018, Reference Wu, Zhang, Sun, Li, Zhang and Ji2019).
Additionally, the rise of unconventional oil and gas has promoted the hot development of simulation experiments. Hydrocarbon generation and expulsion simulation experiments with their different, for example, experimental systems, conditions and samples, have been widely used in the basic theoretical research of shale gas (Horsfield & Dueppenbecker Reference Horsfield and Dueppenbecker1991; Behar et al. Reference Behar, Vandenbroucke, Tang, Marquis and Espitalie1997; Tang et al. Reference Tang, Perry, Jenden and Schoell2000; Hill et al. Reference Hill, Zhang, Katz and Tang2007; Tian et al. Reference Tian, Xiao, Wilkins and Tang2012; Gao et al. Reference Gao, Schimmelmann, Tang and Mastalerz2014; He et al. Reference He, Zhang, Mi and Zhang2018; Mi et al. Reference Mi, Wang, He, Bai and Liu2018; Su et al. Reference Su, Lu, Zhang, Chen, Li, Xiao, Qiu and Han2020). These experiments mainly include the evaluation of the gas-forming potential of organic-rich shale (Mani et al. Reference Mani, Patil, Dayal, Kavitha, Hafiz, Hakhoo and Bhat2014; Wang et al. Reference Wang, Wang, Wu, Wang, Sun, Xu, Zhu, Sun and Wei2017; Gai et al. Reference Gai, Tian and Xiao2018; Ma et al. Reference Ma, Tan, Zheng, Shen, Wang, Shahzad, Jan and Schulz2021), hydrocarbon generation and expulsion of shale (Li et al. Reference Li, Zheng, Bi, Wu and Wang2017a, Reference Li, Krooss, Weniger and Littke2017b; Zhao et al. Reference Zhao, Pang, Jiang, Wang, Li, Zhang and Zheng2018), and influence factors on the formation and development of shale pores (Bai et al. Reference Bai, Wang and Jiao2012; Tiwari, et al. Reference Tiwari, Deo, Lin and Miller2013; Sun et al. Reference Sun, Tuo, Zhang, Wu, Wang and Zheng2015,, Reference Sun, Tuo, Zhang, Wu and Chai2019b). Therefore, the variation characteristics of pore structure in thermal simulation experiments combined with the pore model under geological conditions can be further used to evaluate the conditions of reservoir space.
However, there is geological fluid in actual geological conditions, and water–rock interaction will occur between the fluid and reservoir. Some scholars considered the flowing of fluids among the pore spaces in shales, and that the changing will occur in their chemical properties by the productions from water–rock reactions. Actually, most of the cognitions on the pore evolution in shales were based on field geological investigations (Chen et al. Reference Chen, Cao, Chen and Teng2010; Scislewski & Zuddas Reference Scislewski and Zuddas2010; Jin et al. Reference Jin, Mathur, Rother, Cole, Bazilevskaya, Williams, Carone and Brantley2013, 2021; Yang et al. Reference Yang, Zhang, Tang, Ding, Zhao, Dang, Chen, Su, Li and Lu2017). At the same time, the evolution of pore structures during the water–rock reactions had been built due to the oxidative weathering (Fischer & Gaupp Reference Fischer and Gaupp2005). A flow-through experiment was conducted by Liao et al. (Reference Liao, Chigira, Matsushi and Wu2014) to analyse the effects of water–rock interactions on the black shale and pore water. And these authors thought that the long-term oxidation and evaporation of pyrite will result in the forming of acidic solution rich in iron and sulphate from the pore water. Li et al. (Reference Li, Li and Zhu2022) simulated the sequential reaction conditions and found that the accumulation of the soluble protons releasing from water–rock reactions could affect the changing of mineral alterations and porosity evolution in shale. In a word, by the experimental analysis and field data characterisation, water–rock reactions mainly occurred on the surface of rocks firstly and then progressed into their interior by the flowing of fluid among these pore spaces. And in addition, this reaction would cause the occurring of oxidation and dissolution in active minerals and which will result in the developing of pore structures in shales. Therefore, to improve the understanding of the influence of the water–rock interaction on storage space during the thermal evolution of organic matter, conducting research on organic matter evolution and corresponding pore evolution under different fluid–rock ratios (FRRs) in laboratory conditions is necessary.
Therefore, based on the pore structure as an important parameter of the quality evaluation of the hydrocarbon source rock reservoir and hydrocarbon generation potential, combined with the temperature–time compensation principle of hydrocarbon generation and expulsion simulation experiment to the geological conditions, it is necessary to simulate the evolutional characteristics of pore structures at different thermal evolution stages under different FRRs. Thus, this would provide reference significance for the responding model of FRR to pore structures evolution.
2. Methods
2.1. Samples and pyrolysis experiments
The samples used in this research were collected from Chang 7 Yanchang Formation, Triassic, in Tongchuan, Ordos Basin, Shanxi Province, western China. The total organic carbon (TOC), hydrocarbon index, oxygen index and T-max of this sample were 13.75%, 483.49 mg g−1 TOC, 0.95 mg g−1 TOC and 451°C, respectively.
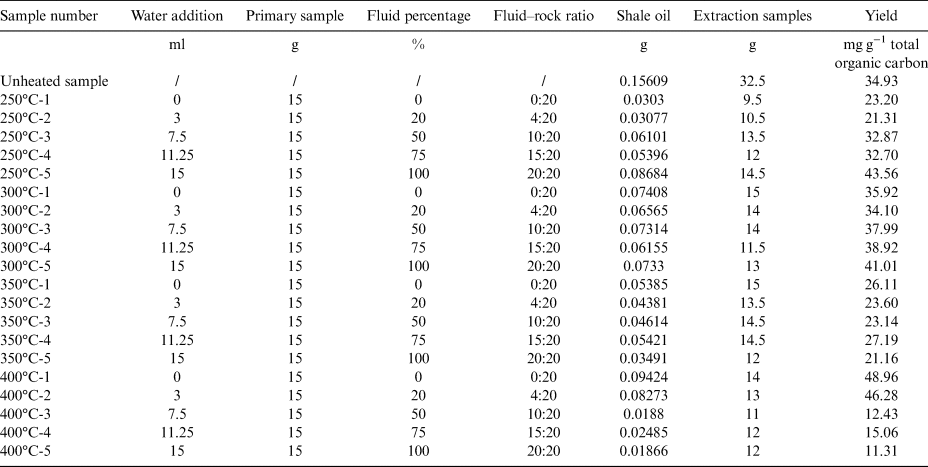
The pyrolysis experiments were conducted in a closed system with five autoclaves heated simultaneously. Before pyrolysis, the samples were pulverised to powers less than 200 mesh. Next, the powdered samples were divided into several portions with 15 g each part. Four temperature points 250°C, 300°C, 350°C, and 400°C were used in these pyrolysis experiments. Five FRRs 0:1, 1:5, 1:2, 3:4 and 1:1 (0:20, 4:20, 10:20, 15:20 and 20:20) were used for every temperature point, which corresponded to the different amounts (anhydrous, 3 ml, 7.5 ml, 11.25 ml, and 15 ml, respectively) of pure water additions. These experiments were at the same simulation temperature with different FRRs and were conducted simultaneously. All were heated to the target temperature point within 2 h and then remained at the target temperature for 72 h. When these pyrolysis experiments were over, the solid residues were recycled and extracted before pore structure analysis. The experiment conditions and the content of the shale oil are presented in Table 1.
Experiment conditions and shale oil content.

2.2. Low pressure N 2 adsorption
The pore structures of the solid residues were conducted using the low pressure N 2 adsorption measurement. The model of this physical adsorption instrument was Micromeritics ASAP 2460. The specific experimental conditions are as follows: (1) for removing the adsorbed moisture and volatile matter, approximately 0.4 g samples were automatically degassed at 110°C for 24 h in a vacuum; (2) the degassed samples were exposed to liquid nitrogen at −196°C along with the P/Po = 0.0001–0.995 (where Po represents the pressure of gas saturation, and P is the balance pressure); (3) next, based on the model of Brunauer–Emmett–Teller, Barrett–Joyner–Halenda analysis and density functional theory, we obtained the date of the pore structures (e.g., the specific surface area, pore volume and pore diameter).
3. Results
3.1. Effect of temperature on yield and pore structure of oil shale under the same water–rock ratio
3.1.1. Yield of oil shale
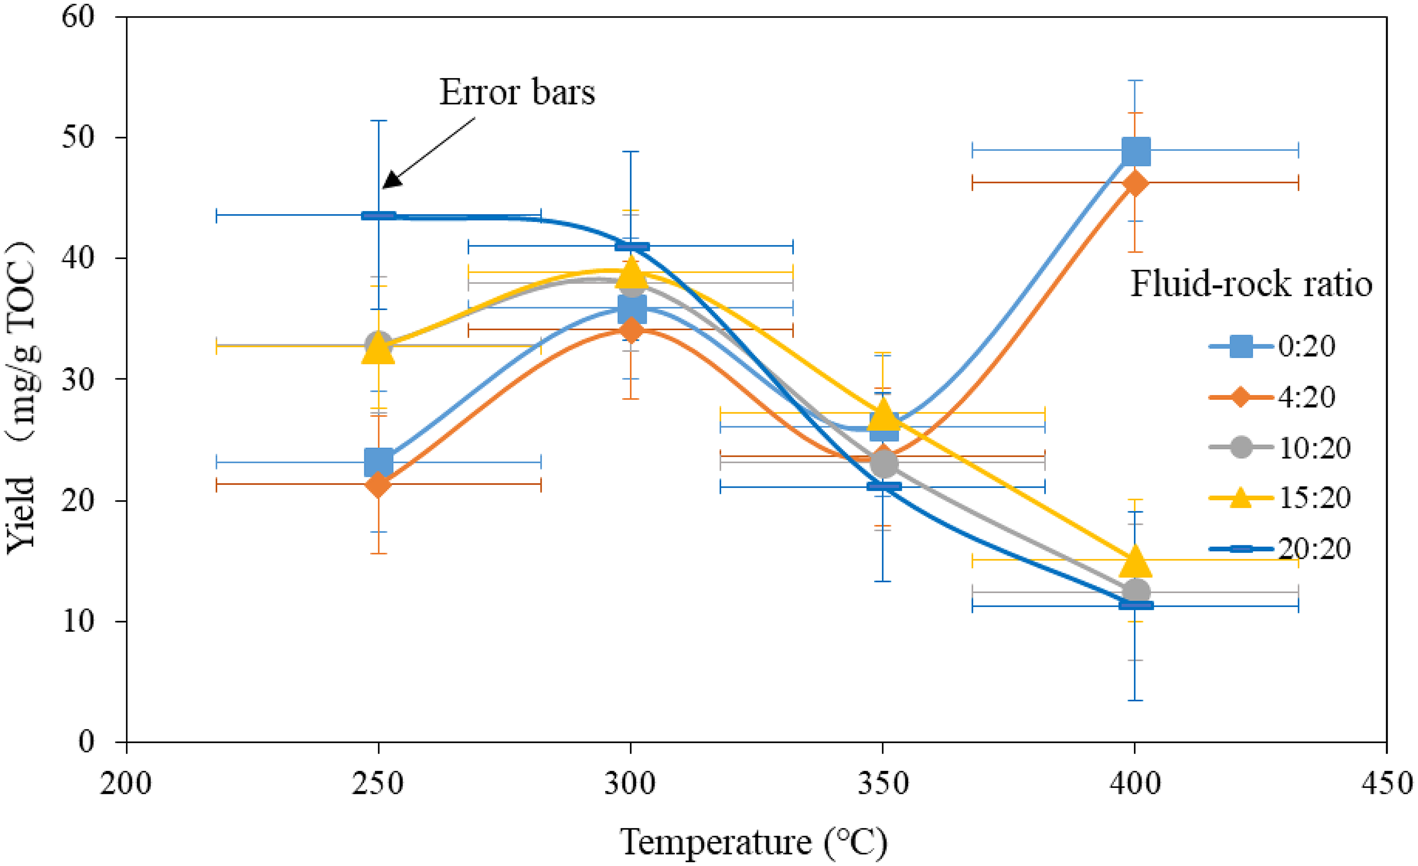
When the FRR was = 0:20, the corresponding experiment can be considered a series of anhydrous pyrolysis. As the temperature increased, the shale oil content increased, decreased and then increased again (Fig. 1). When the FRR was = 4:20, the trend of shale oil was the same as the result when the FRR was = 0:20. The difference between them was the yield of shale oil, and, the higher yield occurred on the series with a FRR = 0:20. From 250°C to 400°C, the difference value of yield between them was so close – in order they were 1.88 mg g−1 TOC, 1.81 mg g−1 TOC, 2.51 mg g−1 TOC and 2.67 mg g−1 TOC. But the rangeability of their content was very close at 250°C and 300°C as well as 350°C and 400°C. In addition, the yield difference at lower temperature section was less than that of the higher temperature stage.
Changing content of shale oil with different fluid–rock ratios: 250°C, 300°C, 350°C, and 400°C.

The results showed that the oil shales had a stronger storage capacity for in-situ shale oil at lower temperature stage. However, between 300°C and 350°C, which could be observed as the after oil- generation window, the reserves of in-situ shale oil showed a downward trend. Subsequently, the equilibrium appeared at the stage of 350°C–400°C. When the FRR was = 10:20, 15:20 and 20:20, the significant difference between the FRR = 0:20 and 4:20 was that the yield of shale oil showed a very obvious upward trend after 350°C. Moreover, when the FRR = 10:20 and 15:20, shale oil increased slowly and then decreased sharply. When the FRR = 20:20, shale oil decreased slowly and then dropped sharply.
3.1.2. Pore structure of oil shale
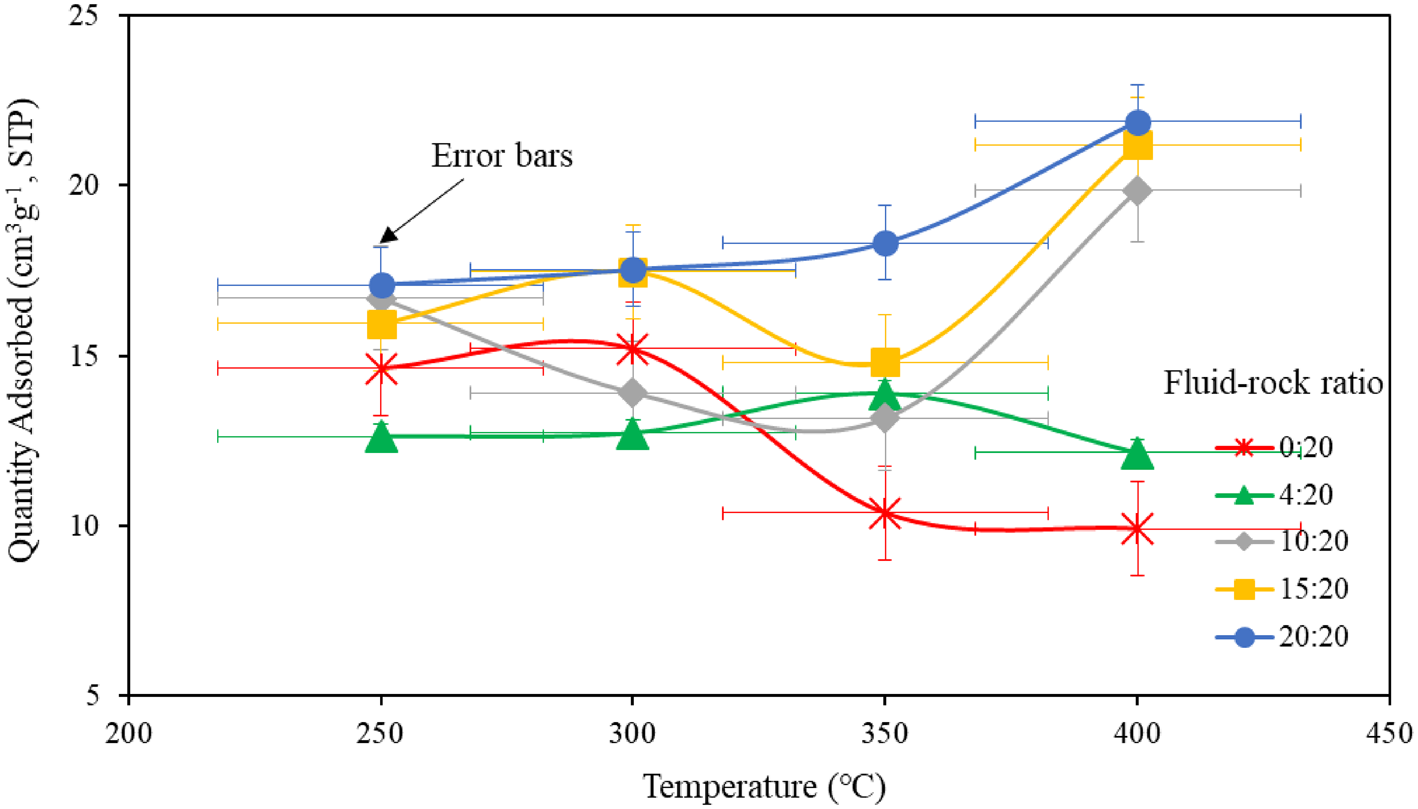
For the total gas adsorption capacity of the reservoir, the variation trend with the increasing temperature was similar to that of the shale oil yield under the same FRR; obvious differences also occurred from 350°C to 400°C (Fig. 2). When FRR was = 0:20 and 4:20, the gas adsorption capacity decreased from 350°C to 400°C, that is, the reservoir space decreased. When the FRR was 10:20, 15:20 and 20:20, the gas adsorption capacity increased during this temperature range. The trend of total gas adsorption capacity was opposite to the change in shale oil at this stage. Generally, when the FRR was 0:20, the gas adsorption capacity was in equilibrium and then decreased to the state of approximate equilibrium. Next, when the FRR = 4:20, the total gas adsorption amount was presented as a basically balanced, increasing slowly and decreasing slowly trend. When the FRR = 10:20, the gas adsorption capacity decreased rapidly, decreased slowly, and then rapidly increased. When the FRR = 15:20, as the temperature increased, the porosity increased. However, when the FRR = 20:20, the total gas adsorption capacity increased gradually.
Total gas adsorption capacity of reservoir with increasing temperature under the same fluid–rock ratio.

3.2. Effect of FRR on yield and pore structure of oil shale under the same temperature
3.2.1. Yield of oil shale
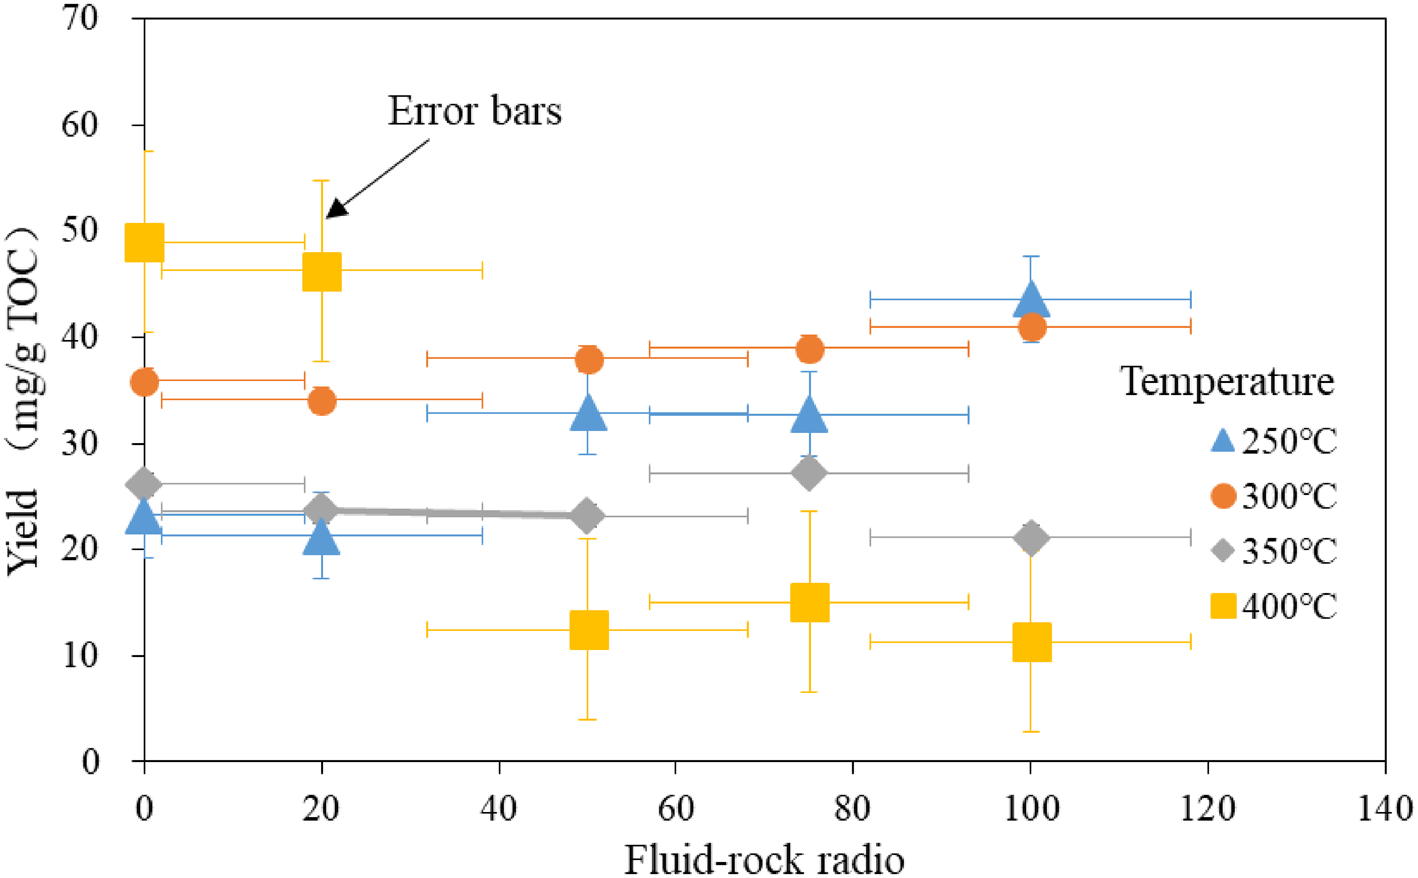
Figure 3 shows the variation trend of shale oil yield with the increasing FRR under the same simulated temperature. The temperatures most affected by the FRR were 250°C and 400°C. It gradually increased from the lowest point to the highest point at 250°C but gradually decreased from the highest point to the lowest point at 400°C. The changes at 300°C and 350°C were relatively gentle, namely, they did not change much.
Variation trend of shale oil yield with the increasing fluid–rock ratio under the same simulated temperature.

3.2.2. Pore structure of oil shale
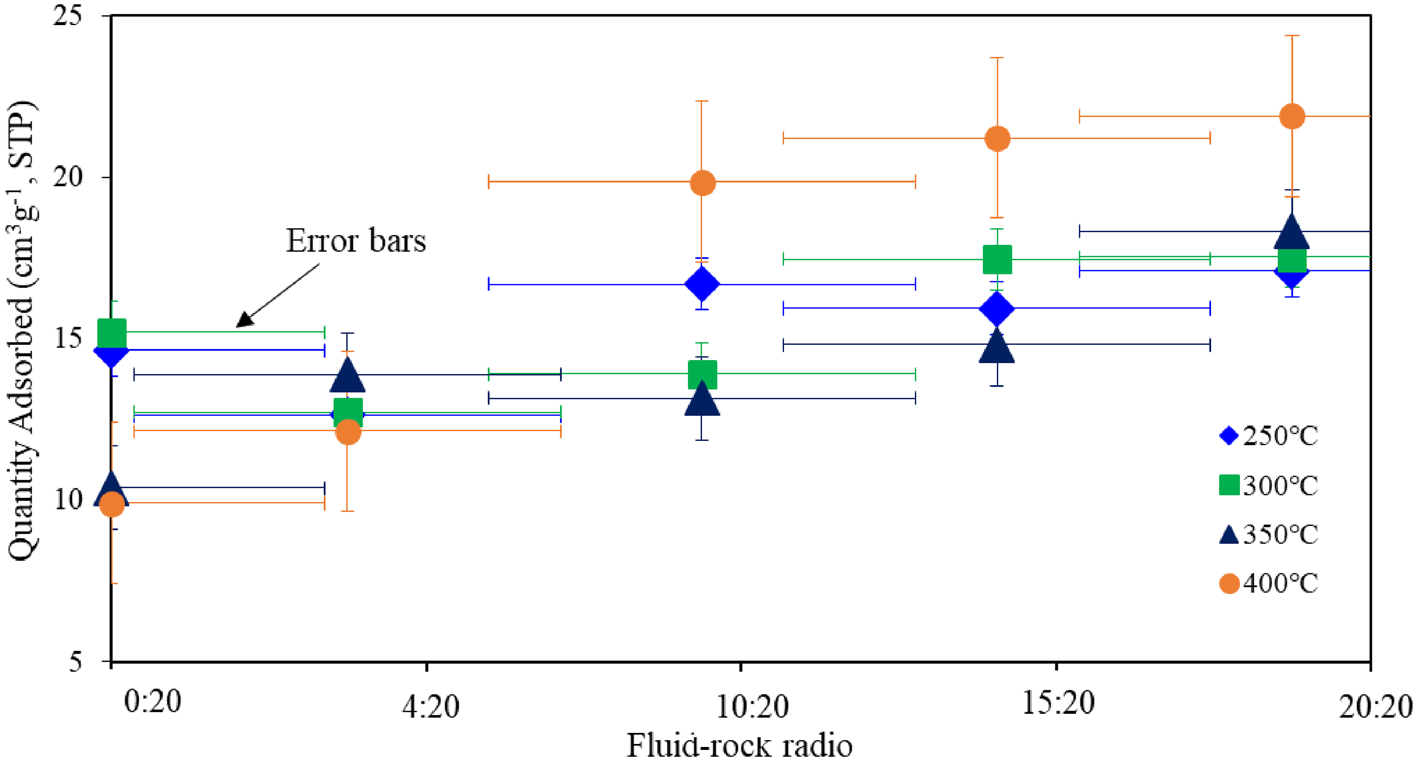
As shown in Fig. 4, the total gas adsorption at the four temperature points of 250°C–400°C showed a gradual upward trend. The slight difference between them was that the two temperature points of 250°C and 300°C showed a downward trend when the FRR was 4:20, while the two temperature points 350°C and 400°C presented an upward trend when the FRR was 4:20. When the FRR was higher than 4:20, the adsorption capacity in shale increased gradually.
Relationship between adsorption capacity and fluid–rock ratio at 250°C, 300°C, 350°C, and 400°C.

4. Discussions
4.1 Response of reservoir space under same water–rock ratio at different thermal evolution stages
Based on the literature, during the stage of 250°C–300°C, hydrocarbon generation was in a lower evolutionary stage dominated by oil generation. This also was characterised by a lower generation of hydrocarbon gases, and the corresponding dominating gas was water vapour, that was before the stage of the oil generation window (Sun et al. Reference Sun, Tuo, Zhang, Wu, Wang and Zheng2015, Reference Sun, Tuo, Zhang, Wu and Chai2019a, Reference Sun, Tuo, Zhang, Wu and Chai2019b). The yield of oil shale at this stage was consistent with the trend of gas adsorption in shale. Moreover, the higher the FRR, the more favourable it was for the generation of shale and the development of corresponding pore structures.
The size of pore space at this stage was positively correlated with the yield of shale oil, which indicated that the shale oil was mainly stored in the primary pores of oil shale or the reason of that the cracking of kerogen to reorganise the original pore structures with the unchanging pore size (Sun et al. Reference Sun, Tuo, Zhang, Wu, Wang and Zheng2015). The tendency of the shale oil yield and shale gas adsorption capacity at the stage of 350°C–400°C was completely different from that at the stage of 250°C–400°C. Moreover, when the FRR was lower than 4:20, the shale oil yield was the highest, while the corresponding total pore space changed to the minimum. However, when the FRR was higher than 4:20, it was the low point of shale oil production but the high point of pore space. The results indicated that the pore space of shale was mainly filled by soluble organic matters in the lower FRR. While in the higher FRR, the pore space filled with soluble organic matters was smaller, but more was the connected pores or expanded pore space during the thermal evolution of hydrocarbon generation. From the variation characteristics of average pore volume, specific surface area, and pore diameter on the macropores, mesopores and micropores could also be observed. Notably, the cubature formula of the sphere is V = 4/3πr3, and the formula for the specific surface area is S = 4πr2. The total volume of pores was composed of several pores that were approximately spherical; thus, the pores of total volume (V total pores) = n4/3πr3and total surface area (S total pores) = n4πr2. Among them, r is basically unchanged, while the values of V total pores and S total pores are increased gradually; thus, the numbers of pores also increased gradually.
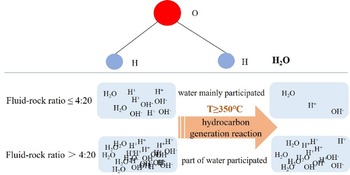
Therefore, after the of ‘oil window’ stage, when the FRR was lower than 4:20, water mainly participated in the hydrocarbon generation reaction. When the ratio of FRR was higher than 4:20, only part of water participated in the hydrocarbon generation reaction, as well as providing hydrogen ions. In other words, when the FRR was less than 4:20, water was sufficient to provide hydrogen ions for the pyrolysis after the oil window. When the FRR was higher than 4:20, the water content was higher, and water did not continue to participate in the hydrocarbon generation reaction, but existed in the reaction system as a fluid (Fig. 5). Therefore, temperature remained the main factor affecting the thermal evolution of hydrocarbon generation. In addition, temperature was beneficial to the generation and storage of shale oil within a certain range, but only occupied the storage space of shale oils or connected a certain storage space beyond a certain range.
Diagram of hydrocarbon generation reaction involving water after 350°C.

4.2 Response of reservoir space at the same evolutionary stage to different FRRs in oil shale
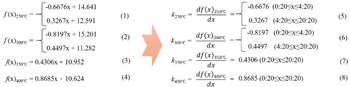
The difference in FRRs could be considered the difference in the size of the contact area between fluid and rock. Under the same experimental conditions, the larger the contact area, the more thorough the reaction should be. In the stage of 250°C–300°C before the oil generation window, when the FRR was less than 4:20, the pores appeared to decrease. The linear equations of FRR to the gas adsorption capacity (Fig. 6) were f(x)250°C = −0.6676x + 14.641 or 0.3267x + 12.591 and f(x)300°C = −0.8197x + 15.201 or 0.4497x + 11.282, respectively (where f(x) was gas adsorption, and x was the value of FRR). The corresponding positive correlation coefficient (R 2) was 0.6860 and 0.8854, respectively. In the stage of 350°C–400°C after the oil generation window, with the gradually increasing FRR, the amount of gas adsorption was an obvious linear increasing tendency; its linear equation was f(x)350°C = 0.4306x + 10.952 and f(x)400°C = 0.8685x + 10.624, with an R 2 = 0.8218 and 0.8961. In addition, from the slope in the linear equation of the FRR to gas adsorption, its rate of change could be observed. The slopes at different thermal simulation temperatures were k 250°C = −0.6676 (0:20≤x ≤ 4:20) and 0.3267 (4:20≤x ≤ 20:20), k 300°C = −0.8197 (0:20≤x ≤ 4:20) and 0.4497 (4:20≤x ≤ 20:20), k 350°C = 0.4306 (0:20≤x ≤ 20:20) and k 400°C = 0.8685 (0:20≤x ≤ 20:20), respectively. From 250°C to 300°C, when the FRR was less than 4:20, the decreasing rate in the two series was almost the same, and the increasing rate was almost the same when the FRR was greater than 4:20. At 350°C, the accelerating degree of gas adsorption was basically the same as that at 250°C–300°C, but there was a significantly faster increase that occurred at 400°C. This also indicated that the higher the degree of thermal evolution, the more significant was the effect of FRR on pore development and, the faster the efficiency. However, at the lower evolution stage, with the increasing of FRR, the pores developed slowly. Figure 3 shows the yield of primary shale oil. Temperature was the key factor controlling the yield of oil and gas; thus, the total hydrocarbons were basically conserved during the whole evolution stage with the increasing FRR. The higher residual oil during the pyrolysis experiments generated, the less expelled hydrocarbons were, which was also true in the opposing situation. Therefore, in combination with Fig. 3, the variation rate of expelled hydrocarbons was very small under the conditions of 300°C and 350°C, and the corresponding gas adsorption changed slowly. Similarly, the residual oil decreased sharply at 400°C, the corresponding expelled hydrocarbons should increase sharply, and the corresponding gas adsorption also increased rapidly. However, as the original shale oil gradually increased, the corresponding expelled hydrocarbons should decrease rapidly at 250°C, and the gas adsorption showed a slowly increasing trend. Thus, the increasing FRR promoted the conversion of kerogen to soluble organic matters. However, the pore structure in this stage was mostly primary pores or the internal structure of pores adjusted in the lower evolution stage, and the products, discharges and pristine organic matters were all stored in the primary pores.
Linear equations of fluid–rock ratio to gas adsorption capacity.

Therefore, the yield of residual oil increased at 250°C and decreased at 400°C, and almost no change was observed at 300°C and 350°C. In general, the changing rating of porosity was more related to the yield of residual oil at 250°C and 300°C, but was related to the yield of expelled oil at 350°C and 400°C. At 300°C and 350°C, the yield of expelled hydrocarbons and residual hydrocarbons were in the equilibrium state, indicating that 350°C was the starting point of the oil generation window again. Before 350°C, the increasing of FRR promoted the depolymerisation of kerogen and the transformation from kerogen to soluble organic matters. However, the primary and secondary migration of the source rocks in the form of expelled hydrocarbons did not occur or rarely occurred. After 350°C, the increasing of FRR promoted the thermal cracking of kerogen.
The ratio of fluid to rock was an indirect acting factor, which affected the evolution of organic matters and then the development of pore structures. Before the oil window, the lower the evolution degree, the higher the water content, and the more significant the effect. This may have occurred because under the lower simulated temperature, the water existed as water vapour, which connected the pore structure in the original source rocks. The part death holes for storing soluble organic matters were connected to the interconnected pores, which increased both the residual oil yield on the one hand and increased the measurably connected pore spaces on the other hand. In addition, the increased measured interconnected pores represented the increasing gas adsorption. And with the increase in the simulated temperature, the depolymerisation of kerogen increased, which also increased the total space of connected pores. In the higher evolution stage, the higher the water content, the more complete the kerogen reaction, which was also more conducive to the development of pore structures.
5. Conclusion
In this study, we analysed and proposed a response model of the FRR to the reservoir space in the primary formation of shale oil during hydrous pyrolysis. Based on the pyrolysis experiments and corresponding pore structures analysis of different temperatures (250°C, 300°C, 350°C and 400°C) plus the various FRRs (0:20, 4:20, 10:20, 15:20 and 20:20), our conclusions are as follows:
(1) FRRs could be seen as an indirect factor that influenced reservoir spaces of primary shale oil.
(2) Under the same simulated temperature and different FRRs, the pores were associated with the residual oil at 250°C–300°C and expelled oil at 350°C– 400°C, respectively. Thus, the starting point of the ‘oil window’ could be seen as 350°C. Before 350°C, with the increasing FRR, depolymerisation of kerogen and the transformation from kerogen to soluble organic matters could be promoted for the higher water content, which will further result in connected pores. After 350°C, there was an obvious linear increasing tendency in the amount of gas adsorption with the increasing FRRs and this further resulted in the better development of pore structures.
(3) Under the same FRRs and a different simulated temperature, the yield of oil shale and the pore structures were all positive to the FRR in shale before 350°C. After 350°C, hydrogen ions were sufficient to the hydrocarbon generation reaction when the FRR ≤ 4:20, which also was beneficial to the generation and storage of shale oil. However, when the FRR > 4:20, excess hydrogen ions were observed and resulted in the higher content of liquid water in the reaction system, which will further result in the occupancy of shale oil in the storage space or connecting a certain storage space.
(4) Therefore, this research provided linear equations for the relationship between FRR and gas adsorption capacity, and also played an important role in the study of exploration and development on shale oil.
6. Acknowledgements
This research was supported by the National Natural Science Foundation of China (Grant Number: 41903060), Natural Science Foundation of Shaanxi Province (Grant Numbers: 2021JQ-953, 2020|JQ-1000 and 2019JQ-996), Post-doctoral Foundation of Shaanxi Province (Grant Number: 2018BSHQYXMZZ07), the Open Foundation of Top Disciplines in Yangtze University (Grant Number: 2019KFJJ0818019) and the Hubei Provincial Department of Education (Grant Number: B2019032).