


I. Introduction
Regulation is often justified by the gains to the public that come from outcomes such as cleaner water and air, safer travel, less dangerous products, and more honest advertising. The costs of regulation are borne in large part by the firms that must comply with them. Costs can be roughly categorized into two sets: physical operational costs and compliance risks. The former are costs related to regulation’s mandated changes (relative to what firms would otherwise do) in production, distribution, or sales practices. The latter are uncertainties about prospective future mandates. Some approaches to regulation can be inherently riskier. For example, since the 1970s, regulators have relied increasingly on “guidance” rather than formal rulemaking in setting regulatory standards (DeMuth (Reference DeMuth2016), Epstein (Reference Epstein2016), and Calomiris (Reference Calomiris2018)), which observers believe has increased regulatory compliance risk. Guidance gives regulators greater flexibility in implementing regulation, but of course, that same flexibility implies greater uncertainties for firms about how regulation will evolve. Such uncertainty may in turn prevent firms from undertaking attractive investments due to the fear of an unforeseen regulatory response.
Although many observers often express the belief that regulation is costly to firms both through its operational burdens and its compliance risks, research has not made much progress in measuring these costs in a comprehensive manner (one that accounts for both risks and physical compliance costs) or even demonstrating that, in general, regulations are costly to firms. Recently, the Trump Administration claimed that deregulation was an important contributor to the acceleration of growth in the years after Trump’s 2016 election, but there is no hard evidence to quantify whether that is true, or, if so, how much of that growth should be attributed to deregulation.
Ours is not the first article to measure the cost of regulation or to use textual data for the measurement of regulation. With respect to the latter, several recent studies make use of the data produced by the Mercatus Center at George Mason University (GMU), which tracks the word flow of the federal government’s formal rule-making and has devised a means of attributing the relevance of that word flow at the sectoral level in the economy. Graph A of Figure 1 shows the GMU measure as an annual average across all economic sectors. By this measure, regulation is increasing over time. However, measures that assess regulation via the importance of the requirements it imposes—for example, the number of regulations passed with high estimated compliance costs, compiled by George Washington University (GWU), and reported as an aggregate time series—show a precipitous decline in regulation in the first year of the Trump Administration. This is shown as the solid line in Graph A of Figure 1. The contrast between these two aggregate regulatory measures suggests a better approach is needed.
Graph A of Figure 1 contrasts George Mason University’s (GMU) approach with the George Washington University’s (GWU) approach. The GMU presented by plotting the average, for each year, of the word counts of regulations published across 3-digit NAICS industries. The annual 3-digit NAICS industry-level regulation data come from Al-Ubaydli and McLaughlin (Reference Al-Ubaydli and McLaughlin2017) and are based on the Code of Federal Regulations. GWU refers to the number of economically significant regulatory rules tracked by GWU following Executive Order 12866, which identifies important regulations with an annual effect on the economy of USD 100 million or more. Graph B plots our measure of regulation, NetReg, separately for the Presentation and Q&A sections of the quarterly earnings call. Graph C presents the percentage of all earnings calls in the S&P Global data set that contain at least one sentence in either the Presentation or Q&A portion of the call that satisfies our regulatory filter.

FIGURE 1 Long description
A three-panel vertical stack of line graphs.
Graph A. Alternative regulatory measures.
The Y-axis ranges from 20 to 100. The X-axis spans 2010 to 2018. A solid black line representing G W U Economically Significant Rules fluctuates between 20 and 100, peaking in 2017 before a sharp drop. A dashed red line representing G M U Words Published Per Year (scaled) shows a steady, near-linear increase from 20 to 100 over the same period.
Graph B. NetReg.
The Y-axis ranges from negative 0.04 to 0.01. The X-axis spans 2010 to 2019. A solid black line for NetRegP (Presentation) and a dashed red line for NetRegQA (Q and A) both exhibit high-frequency volatility. The legend notes a correlation (Corr) of 0.031. Both lines generally oscillate between negative 0.03 and 0.01.
Graph C. Fraction of calls with regulat and concept words.
The Y-axis ranges from 0.34 to 0.42. The X-axis spans 2010 to 2019. A single black line with blue diamond markers tracks quarterly data. Each marker is labeled with its year and quarter (e.g., 09-Q3, 17-Q1). The trend shows a gradual upward climb with significant seasonal spikes, reaching its highest peak of approximately 0.43 in the first quarter of 2017.
Our goal in this article is twofold. First, we address the regulation measurement issue by proposing a novel text-based measure derived from corporate earnings calls. As we point out in our discussion of prior research, most other studies have employed data that are likely to identify physical operational costs but not costs related to compliance risks. Because earnings calls capture news that is discussed between firm management and investors, they are well-suited to identifying regulatory risks faced by firms. At the same time, discussions in earnings calls may not capture longstanding operational costs. From that perspective, our measure is geared toward identifying new costs, including new compliance risks, but may understate longstanding physical costs. For that reason, we see our article as complementing other contributions in the literature by being able to measure costs related to compliance risk that other studies have not identified.
Second, if news about regulatory risk is an important cost highlighted by earnings calls, this can be validated by analyzing the reaction of a combination of dependent variables to news about regulation. Although we are not able to formally test the extent to which risk versus new physical cost is driving our results, we develop two hypotheses that serve to organize the empirical implications of regulatory exposure depending on whether it reflects increased compliance risk or increased physical operational costs. We expect both kinds of regulatory exposure discourage growth, but they have different implications for other variables. Hypothesis 1 states that costs resulting from increased compliance risk should be reflected not only in lower growth but also in higher future expected stock returns and lower leverage (defined as the ratio of debt to the market value of assets).Footnote 1 Ceteris paribus, higher risk should cause firms: to reduce investment, resulting in lower growth; to reduce leverage as the likelihood of distress makes the tax advantage of debt less attractive; and to compensate equity investors more for bearing more risk. Hypothesis 2 states that increased current physical costs (as opposed to risks) should be reflected in both reduced growth and in immediate reductions in profit margins. We return to these hypotheses, summarized in Table 1, in our discussion of empirical findings. We think the findings across all the NetReg variables suggest that our measure captures both channels, and there are some results (the impact of our measure of new regulation on equity risk premia and leverage) that seem clearly linked to new risks related to regulation.

TABLE 1 Long description
The table consists of two columns: Hypothesis and Explanation.
Row 1:
- Hypothesis H 1: If regulatory discussions imply increased regulatory risk, future expected stock returns should be higher, future leverage should be lower, and firm growth should be abated.
- Explanation: Increased returns compensate for higher risk. If the firm were already at an optimal level, then higher risk should cause reduced leverage. Higher risk makes incremental growth more costly, producing a reduction in growth.
Row 2:
- Hypothesis H 2: If regulatory discussions imply increased physical compliance costs, future profit margins and growth should be reduced.
- Explanation: Higher physical costs reduce the ratio of profits to sales. Higher operating costs make growth less profitable and thereby produce a reduction in growth.
We apply natural language processing (NLP) methods to a corpus that filters the word flow related to regulation on the basis of its importance. Specifically, we undertake an NLP analysis of the transcripts of the earnings calls of publicly traded corporations. Earnings calls are quarterly opportunities for stockholders to hear from and question management about all the important influences on the values of companies. They are a primary opportunity to recognize news (including regulatory news) and discuss its strategic implications. For that reason, earnings calls are likely to highlight all elements of regulatory news, including both new compliance costs and new regulatory risks. Given the limited duration of the earnings calls—they last about 1 hour—if management and investors use the scarce resource of time to discuss regulation, that is a reliable indicator of its importance. Furthermore, since time is scarce for all earnings calls, the methodology should work equally well for identifying important regulatory issues across all industries. Finally, earnings calls are an opportunity for management and investors to share thoughts about strategy and risk on a forward-looking basis. If regulation entails compliance risks, this should be a key place where those concerns are reflected.
Because we analyze each company’s earnings calls separately, if the same regulatory news favors one company and harms another, our measure will capture such differences in regulatory exposure. For example, utility regulation that reduces energy costs may harm utilities but help firms that use the energy produced by utilities. Indeed, we find some evidence that this is true.
Earnings calls also permit investors to question management, which means that important aspects of news about regulatory costs that may be neglected or exaggerated in management’s presentation can be raised by investors in their questions. Of course, knowing that they will be questioned may make managers raise regulatory issues in anticipation of investors’ concerns. Interestingly, for most regulatory consequences, the analysis of the Presentation section produces the strongest and most robust estimates of regulatory consequences. In contrast, however, we find that only the Q&A portion of calls is statistically significant for forecasting 1-month-ahead stock returns. This suggests that focusing on regulatory discussion in both the Presentation and Q&A portions of calls yields useful information.
For each earnings call, we construct separate measures for the management Presentation and Q&A parts of the transcript. Our measure of regulation is NetReg, which captures both mentions of regulation (via the presence of the word root regulat) and its direction: positive (negative) NetReg indicates a greater (lesser) regulatory burden. As we discuss further below and illustrate in Graph B of Figure 1, this directional measure of regulation provides a dramatically different picture of regulation than one would get from just measuring the frequency of the use of regulation-related words in earnings calls or measuring the quantity of word flow in government publications related to regulation. To measure the direction of regulation, we introduce two new word lists that are associated with increasing and decreasing regulatory burden, respectively.Footnote 2 As a benchmark, we also construct a measure that captures the sentiment score of the transcript as a whole (AllSent). Sentiment is measured using the Loughran and McDonald (Reference Loughran and McDonald2011) sentiment dictionary.
Our measure of regulation captures not only new rules and guidance created by all the relevant domestic and foreign government sources, but it also captures how regulations are enforced for individual firms and how particular firms experience changes in both rules and their enforcement over time. A simple analysis of variance, reported below, suggests that the majority of variation that our measure captures is “within-firm” variation, rather than changes that are common across firms within a particular sector, or differences across firms that are constant, or variation across time that is common across all firms. Almost all of the variation reflects idiosyncratic nuances in the changing ways that regulations are imposed on a particular firm, though our measure also reflects occasional economy-wide regulatory shocks.
Our results indicate that more regulation has major negative implications for the future growth and profitability of firms, that more regulation forecasts lower future firm leverage, that both compliance risk and physical operational costs are channels through which regulation affects firms, and that compliance risk is likely the more important of the two channels. We also find that regulation has fewer negative consequences for large firms than for small ones (see also Davis (Reference Davis2017)). This result is consistent with a large literature on the political economy of regulation that sees regulation as less harmful to large firms because of their superior ability to lobby or the economies of scale in managing the operating costs and compliance risks associated with regulation, which in turn implies consequent competitive advantages of large firms over small firms that arise from greater regulation.Footnote 3
We find that the predictive power of the Presentation section for firm outcomes appears to come largely from its time-series variation, whereas the predictive power of the Q&A NetReg measure depends more on its cross-sectional variation. We hypothesize that when a firm faces an important and novel regulatory development, it explains it in the Presentation section of the call, which makes the associated regulatory discussion in the Q&A section less informative (since the important new information has already been revealed).
To further validate our measure, we show that NetReg is useful for capturing exogenous variation in regulatory costs and for interpreting the cross-sectional variation in firm exposure to the surprise 2016 election of Donald Trump. Trump had campaigned partly on a platform of pro-growth deregulation with a focus on specific types of businesses. We find that while firms, on average, benefited from deregulation after Trump’s election (in the sense that the impact of the pre-election measure of NetReg on sales growth declined post-election), this effect was almost entirely concentrated in firms with high stock returns around the surprise election results. We also find that those firms saw a relatively large post-election reduction in NetReg. This suggests that the stock market quickly understood which firms would particularly benefit from the election of Donald Trump and that an important part of this benefit was a decrease in the impact of firms’ regulatory burdens. We further show that the largest impact on firm discussion of the regulatory impact of Trump’s election happens in the Presentation section, which supports our hypothesis that news about major regulatory events is largely contained in the Presentation section of earnings calls. Our text measures are available at http://www.measuringregulation.com.
In the Supplementary Material, we provide a review of the literature on measuring the costs of regulation. Here we focus only on the fact that our NetReg measure captures information that is not closely related to prior measures of regulatory cost, which we believe reflects its comprehensive coverage of both new immediate costs and new risks that firms and their investors find worthy of discussion (as opposed to word counts of new regulations unweighted by importance, or measures of existing physical compliance costs, or measures that focus on other types of influences, such as political risks). Table 2 shows the lack of correlation between NetReg and the measures derived in other studies (Hassan, Hollander, van Lent, and Tahoun (Reference Hassan, Hollander, van Lent and Tahoun2019), Kalmenovitz, Lowry, and Volkova (Reference Kalmenovitz, Lowry and Volkova2025), Armstrong, Glaeser, and Hoopes (Reference Armstrong, Glaeser and Hoopes2025), Chang, Kalmenovitz, Lopez-Lira, and Hajda (Reference Chang, Kalmenovitz, Lopez-Lira and Hajda2023), and Kalmenovitz (Reference Kalmenovitz2023)).Footnote 4 Furthermore, in our regression analysis, we consider whether the effects captured by NetReg are also captured by other measures of regulation in the literature (whose authors were willing to share their data with us—including Hassan, Hollander, Van Lent, and Tahoun (Reference Hassan, Hollander, Van Lent and Tahoun2024), Armstrong, Glaeser, and Hoopes (Reference Armstrong, Glaeser and Hoopes2025), Chang, Kalmenovitz, Lopez-Lira, and Hajda (Reference Chang, Kalmenovitz, Lopez-Lira and Hajda2023), Donelson, Garfinkel, and Roudini (Reference Donelson, Garfinkel and Roudini2023), Kalmenovitz (Reference Kalmenovitz2023), and Kalmenovitz, Lowry, and Volkova (Reference Kalmenovitz, Lowry and Volkova2025)). As we discuss later, we find that NetReg’s predictive importance is not affected by including measures from other regulatory studies in the regression analysis.

TABLE 2 Long description
The table consists of three columns: Paper, Our Measure, and Correlation. It lists correlations for various external studies:
* Hassan, Hollander, van Lent, and Tahoun (2019) P Risk: Net Reg P (0.004) and Net Reg Q A (-0.008).
* Hassan, Hollander, van Lent, and Tahoun (2019) P Sentiment: Reg Sent P (0.055) and Reg Sent Q A (0.032).
* Armstrong, Glaeser, and Hoopes (2025) Total Government Agency Exposure: Net Reg P (-0.081) and Net Reg Q A (-0.092).
* Chang, Kalmenovitz, and Lopez-Lira (2023) Reg Pipeline: Net Reg P (0.011) and Net Reg Q A (0.003).
* Kalmenovitz (2023) Intensity (Regulations): Net Reg P (0.034) and Net Reg Q A (0.022).
* Kalmenovitz (2023) Intensity (Response): Net Reg P (0.001) and Net Reg Q A (-0.002).
* Kalmenovitz (2023) Intensity (Time): Net Reg P (0.014) and Net Reg Q A (0.003).
* Kalmenovitz (2023) Intensity (Dollars): Net Reg P (0.031) and Net Reg Q A (0.025).
* Kalmenovitz, Lowry, and Volkova (2022) Fragmentation: Net Reg P (0.030) and Net Reg Q A (0.011).
II. Data
Our measures of regulation are derived from textual analyses of all quarterly earnings calls of publicly traded firms from S&P Global’s Transcripts Data from 2009 to 2019. We merge these conference call data with pricing and accounting information for U.S. firms from CRSP and Compustat starting in 2008.Footnote 5 From CRSP, we collect daily stock returns, number of shares outstanding, and trading volume for firms traded on the NYSE, Nasdaq, and AMEX. From Compustat, we obtain quarterly information on firm fundamentals. We exclude financial services firms (SIC codes beginning with 6) because performance measures, such as sales growth, for financial services firms are noncomparable to other firms.
Our primary measures of firm fundamentals are annual sales growth, annual asset growth, leverage (current liabilities and long-term debt over total assets), operating (operating income over sales), gross margins (sales minus cost of goods sold over sales), and annual changes in margins. We allow the consequences of regulation to depend on firm size. To measure the size of the firm, we use the logarithm of sales over the quarter associated with the earnings call, with sales measured in millions of dollars.
All variables are measured relative to the quarter associated with the earnings call. As an example, for the quarter ending on June 30, 2012, Apple had its earnings release and conference call on July 24, 2012. All growth numbers are then relative to June 30, 2012.
Not all earnings calls discuss regulation, so we introduce a NoRegulat dummy variable that equals 1 for firms that have mentioned regulations in some earnings call in our sample but not in the present one, and is 0 otherwise. Some firms in our sample never mention regulations in any of their earnings calls; for such firms, we introduce a dummy variable, NeverRegulat, which is set to 1 for all of their firm-quarters.
To study the implications of regulation for stock returns, we examine returns, both in excess of the risk-free rate (1-month T-bill) and risk-adjusted, using the Fama and French (Reference Fama and French2015) 5-factor plus momentum, over 1-, 5-, and 22-trading days following the earnings call. Factor loadings used to calculate abnormal returns and alphas are estimated over a window from 252 to 31 trading days prior to the earnings call; for abnormal returns, the training window alpha is assumed to be 0. Returns are measured from the closing price of day t (the date of the conference call) for calls occurring prior to 4pm New York time and from the closing price of day t + 1 (the following trading day) for calls occurring at 4pm New York time or after. This timing ensures that our future returns are not contemporaneous with the information revealed in the earnings call. Contemporaneous returns are either from day t−1 to day t, or from day t to day t + 1, depending on whether the call is pre- or post-4pm. For our Apple example, the July 24, 2012 conference call took place after 4pm New York time. The 22-day return is measured from the close of July 25, 2012, to the close of Aug. 24, 2012. The estimation window for the calculation of alphas and risk factor loadings runs from July 25, 2011, through June 8, 2012.
To mitigate the influence of outliers in our regression analysis, we winsorize standardized unexpected earnings (SUE) and logarithm turnover (see Section IV.B), as well as sales growth, asset growth, leverage, operating margin, gross margin, operating margin growth, gross margin growth, and SG&A expenses, at the 2% level (impacting 4% of the observations). We also tried winsorization at the 1% level, which resulted in nearly identical results. Excluded from all firm performance regressions are firm quarters with missing values for total assets or sales that are missing or are below USD5 million. These quarters represent 21% of the sample. Table 5 summarizes the variable definitions, and Table 6 provides summary statistics for the data.
III. Measuring Regulation
Our text analysis is performed on the earnings call data set obtained from S&P Global. Before analyzing the calls, we perform the following cleaning steps: convert all words to lowercase; take out whitespace; remove stop words; and tokenize and stem all words (for further details on these standard procedures, see Gentzkow, Kelly, and Taddy (Reference Gentzkow, Kelly and Taddy2019)). For the sentiment analysis described below, we perform word negation, following the algorithm in Das and Chen (Reference Das and Chen2007), which appends the string “_NEG” to all words in a sentence that follow an English language negation word, such as “don’t” or “not.” Word negation was performed prior to all other cleaning steps. In our sentiment analysis, we ignore negated sentiment words.
Our measure of regulation, labeled NetReg, can be positive or negative. Negative values indicate reduced regulation (or deregulation), and positive values indicate more regulation. To construct this measure, we begin by separately searching the Presentation and the Q&A parts of each quarterly transcript for the word root “regulat,” which identifies the words that indicate the presence of a discussion of regulation (regulate, regulated, regulation, regulator, deregulate, etc.). We only focus on sentences mentioning regulat as well as one of a set of regulatory Concept words, to avoid instances of the use of regulat in other contexts (like engineering applications); we refer to such sentences as regulatory sentences. Focusing on regulatory sentences, as opposed to all sentences with regulat, has a minor effect on our NetReg measure. A further explanation of this filter and the list of Concept words are in Section 2 of the Supplementary Material and in Supplementary Material Tables A1 and A2.
To explore the novelty of the influences captured by regulat when measuring discussions of regulation, we also considered a broader approach that included other words that might be relevant for regulation, such as law and rule. Our prior, based on reading a sample of sentences, was that these words would not be very useful because, as we discuss further below, regulation discussions are largely about enforcement, not new laws or rules. To validate our reliance solely on regulat, we enlisted the help of ChatGPT. We randomly selected sentences from the earnings call corpus that either contained law, rule, or regulat. For these 3,000 sentences, we then asked ChatGPT to say whether those sentences contained salient information about the regulatory environment faced by the firm. For rule and law, ChatGPT found that the answer was yes less than half of the time (48% of the sentences included rule and 44% of the sentences included law). In contrast, ChatGPT answered yes for 90% of the sentences that included regulat. These results are summarized in Supplementary Material Table A3.
To gauge whether the discussion is one of increasing or decreasing regulation, we identify “Increasing” or “Decreasing” words that cooccur in the same sentence as regulat and convey a sense of increasing or decreasing regulatory exposure, respectively. These words are listed in Table 3 in order of their frequency of occurrence. Examples of sentences in which regulat is accompanied by Increasing or Decreasing words are provided in Table 4. It was from reading the context of these, and many other, sentences that we were able to judge whether words convey a sense of increasing or decreasing regulatory exposure. For example, it is not clear on an a priori basis whether the word “adapt” should be considered an Increasing word, a Decreasing word, or neither. By reading transcripts, one discovers, however, that “adapt” is often used to indicate the need for a firm to adapt to an increased regulation; if regulations did not increase, there would be no need to adapt. Two examples illustrate the point: “We are well prepared to adapt to the changing legislative, regulatory and economic environment.”; “Of course we’re adapting our business model to the reality of regulation as it exists through the FDA [Food and Drug Administration].” More examples are in the Supplementary Material. We emphasize that the choice of words indicating increasing or decreasing regulation was made by us prior to conducting the regression analysis in Section IV.

TABLE 3 Long description
The table is titled Regulatory Directionality Word Lists and is divided into two main categories.
* Increasing category: Contains 42 stemmed words. The highest frequency words include increas (16,442), growth (11,183), addit (8,982), uncertainti (5,419), higher (5,273), high (4,666), grow (3,422), pressur (2,944), concern (2,803), and negat (1,908). Lower frequency terms include prolifer (69), disproportion (39), and litigi (9).
* Decreasing category: Contains 42 stemmed words. The highest frequency words include approv (22,832), posit (8,503), improv (5,130), clear (4,725), good (4,370), progress (4,317), benefit (4,307), lower (4,155), reduc (3,197), and construct (2,612). Lower frequency terms include shrink (81), diminish (67), congratul (42), deregulatori (35), and both happili and congrat at 6 occurrences each.

TABLE 4 Long description
The table consists of a single column titled Sample sentences. Below the header, the word Sentences is listed, followed by a numbered list of 20 entries. Each entry contains a sentence followed by bracketed metadata for decreasing (dec), increasing (inc), and concept words.
1. Market’s been deregulated. [dec: deregul 1] [inc:] [concept: deregul 1, market 1]
2. And we have less regulatory measures there and also more attractive margins, which is good. [dec: good 1, less 1, attract 1] [inc:] [concept: measur 1, regulatori 1]
3. The regulatory approval process is progressing very well. [dec: approv 1, progress 1] [inc:] [concept: regulatori 1, approv 1, progress 1]
4. We continue to work on regulatory approvals and permitting. [dec: approv 1, permit 1] [inc:] [concept: regulatori 1, approv 1]
5. As a result of deregulation of petrol and diesel, this is very attractive. [dec: attract 1, deregul 1] [inc:] [concept: deregul 1]
6. There are regulatory pressures as you grow and as an industry matures, that’s absolutely normal, and we have to adapt to it. [dec:] [inc: pressur 1, adapt 1, grow 1] [concept: regulatori 1, pressur 1]
7. Competition, pricing and regulatory pressure have increased and are increasingly having an impact on our revenue. [dec:] [inc: pressur 1, increas 2] [concept: impact 1, regulatori 1, pressur 1]
8. There could well be an increased regulatory burden. [dec:] [inc: increas 1, burden 1] [concept: regulatori 1, burden 1]
9. We did this to serve a highly stressed industry pressured by increased regulatory burdens, growing transactional volumes and emerging payment technologies. [dec:] [inc: stress 1, high 1, pressur 1, burden 1, increas 1, grow 1] [concept: regulatori 1, pressur 1, burden 1]
10. This continues to be of particular importance as the regulatory burden grows disproportionately. [dec:] [inc: disproportion 1, burden 1, grow 1] [concept: regulatori 1, burden 1]
11. _A_ We have all regulatory approvals for construction. [dec: approv 1, construct 1] [inc:] [concept: regulatori 1, approv 1]
12. _Q_ Congrats on the regulatory progress. [dec: progress 1, congrat 1] [inc:] [concept: regulatori 1, progress 1]
13. _A_ And those are very friendly, deregulated markets. [dec: deregul 1, friend 1] [inc:] [concept: market 1, deregul 1]
14. _A_ And again, it’s just regulatory approvals. [dec: approv 1] [inc:] [concept: regulatori 1, approv 1]
15. _A_ And only about 1/3 of those were for regulatory approvals. [dec: approv 1] [inc:] [concept: regulatori 1, approv 1]
16. _A_ It’s highly regulated, so the barriers to entry are high. [dec:] [inc: high 2] [concept: barrier 1]
17. _A_ And what are the regulatory hurdles? [dec:] [inc: hurdl 1] [concept: regulatori 1, hurdl 1]
18. _Q_ Is this because of regulatory pressure? [dec:] [inc: pressur 1] [concept: regulatori 1, pressur 1]
19. _A_ Now we are being faced with some of the additional regulatory pressures. [dec:] [inc: addit 1, pressur 1] [concept: regulatori 1, pressur 1]
20. _Q_ Is it regulatory hurdles? [dec:] [inc: hurdl 1] [concept: regulatori 1, hurdl 1]
Our NetReg measure takes all regulatory sentences in the Presentation and Q&A sections, respectively, calculates the difference between the number of Increasing and Decreasing regulatory words occurring in those sentences, and divides by the total number of words in these sentences after stop words have been removed, i.e.,

where
$ S\in \left\{P, QA\right\} $
 refers to the section of the call and
$ {N}_S\left(\cdot \right) $
 counts the number of occurrences of a particular word group in regulatory sentences of section S, excluding stop words. A higher (lower) value of NetReg implies a higher (lower) regulatory burden. Sections of calls with no regulatory sentences have a NetReg of 0, indicating a neutral regulatory tone. Our simple filter does a good job of i) identifying meaningful regulatory references in earnings calls, as well as ii) identifying the directionality of the reference. Furthermore, our regulatory measurement procedure is straightforward to implement once the list of words in Table 3 is available.
We regard the use of subjective judgment in constructing the lists of Concept, Increasing, and Decreasing words as unavoidable for a simple reason: in the context of measuring regulation’s impact, it is very challenging to use supervised learning techniques to identify these words. A natural supervised technique would be to infer Concept, Increasing, and Decreasing words by identifying combinations of words that tend to result in positive or negative stock returns at the time of the earnings call.Footnote 6 The problem with this approach, however, is that there are many important high-frequency influences, other than regulation, on stock prices that are revealed in the earnings call, and thus the effect of regulatory mentions on the contemporaneous stock return may get swamped by these other factors; furthermore, it is not a priori obvious whether more regulation is good or bad for stock prices.
To validate our approach to measuring positive or negative regulation, we asked ChatGPT to read all the sentences in our database that contain regulat and to score the sentences as indicating increasing, neutral, or decreasing regulation. We then use that ChatGPT score to construct alternative measures of NetRegP and NetRegQA, which we label NetRegPLLM and NetRegQALLM, respectively (where LLM stands for large language model). The LLM measures consist of NetReg from (1), but are applied to sentences where ChatGPT does not disagree with the sign of NetReg, evaluated using (1) at the sentence level. If there are no regulatory sentences that pass the no-disagreement filter, then the respective NetRetPLLM and NetRegQALLM measures are left blank (i.e., unobserved). More details are in Section 2 of the Supplementary Material.
We, of course, do not know how ChatGPT reached its conclusions, and we would be uncomfortable relying on them entirely, but it is interesting to note that there is general agreement between the direction of regulation indicated by our NetReg measures and what is identified by ChatGPT. In our forecasting regressions, the coefficients on NetRegP and NetRegQA are nearly identical to those on NetRegPLLM and NetRegQALLM, which we discuss in Section III. As referenced in our literature review, we also show in Section III that including other studies’ measures of regulation (which are not correlated with our measures, as shown in Table 2) does not affect our regression results for the effects of NetReg.
We also use the Loughran and McDonald (Reference Loughran and McDonald2011) (LM) sentiment dictionary to identify positive and negative sentiment words in the earnings calls. We then define two sentiment-related measures for each part (Presentation and Q&A) of each call. The first of these, RegSent, which we constructed for purposes of comparison with other studies’ measures, computes the sentiment score for each sentence in which regulat appears together with a Concept word after dropping stop words, i.e.,

for the
$ {N}_S\left(\cdot \right) $
 used in equation (1). The second sentiment-related measure, AllSent, calculates the sentiment score for the entire Presentation or Q&A discussion of the earnings call, after removing stop words, i.e.,

where
$ {A}_S\left(\cdot \right) $
 measures the number of occurrences of a particular word group in all the sentences of section S. AllSent does not focus on regulation but rather is useful as a benchmark for the effects of sentiment in general, against which to compare the effects of regulation captured in NetReg.
We recognize the challenges in measuring regulation. NetRegP and NetRegQA are not flawless measures: they can and will be improved by future researchers. The extent to which they are imperfect, but pertinent, measures introduces an errors-in-variables problem that works against our finding economically or statistically important results. Yet, as we show below, we do find that these measures are associated with large and statistically significant consequences for firms’ performance. The ChatGPT-augmented NetRegLLM versions of our variables are even stronger forecasters of future outcomes. Our results likely provide a lower-bound estimate for the impact of regulation on firms’ outcomes because our measures of regulation are not perfect.
A. Regulatory Trends
Graph B of Figure 1 plots the time-series paths of
$ NetReg{P}_t $
 and
$ NetRegQ{A}_t $
 , which measure the quarterly equal-weighted average of NetReg for the Presentation and Q&A segments of calls, respectively. It is interesting that these two aggregate measures, plotted in Figure 1, are not highly correlated (with a correlation of only 0.03). Nor do they exhibit similar low-frequency variation. This highlights the advantage of considering the contents of the Presentation and Q&A sections separately, as we do. Management may not have an incentive to highlight all problems or risks, including those related to regulation, while investors’ questions may be directed precisely at topics about problems or risks that management seeks to avoid.
Graph C of Figure 1 shows the proportion of earnings calls mentioning regulat in regulatory sentences. We see a clear, but small, upward trend. From 2010 to 2019, the proportion of earnings calls in which regulation is discussed rises from about 34% of the Calls to about 38% of them. The series has a large spike in 1Q2017, the quarter following the Trump election.
Figure 2 plots the four sentiment-related measures, which differ according to i) whether sentiment is measured only within the sentence in which regulation is discussed or in the entire earnings call and ii) whether they are constructed from the Presentation or the Q&A portions of the earnings calls. Some highly interesting patterns emerge, which we believe are intuitively appealing and which help to validate these measures. First, sentiment scores for the Presentation portions are higher than the comparable sentiment scores for the Q&A portions (that is,
$ AllSent{P}_t> AllSentQ{A}_t $
 and
$ RegSent{P}_t> RegSentQ{A}_t $
 ). Unsurprisingly, management tends to be more sanguine than investors during earnings calls. Second, the sentiment scores of sentences in which regulation is the topic tend to be lower than the earnings calls as a whole (that is,
$ AllSent{P}_t> RegSent{P}_t $
 and
$ AllSentQ{A}_t> RegSentQ{A}_t $
 ). In other words, compared with other topics discussed in earnings calls, discussions of regulation, perhaps not surprisingly, tend to have more negative sentiment, whether it is discussed by management or investors. Third, sentiment scores are rising over time (sensible if improvements in economic activity are reflected in more positive sentiment), and similarly, there is some evidence that sentiment scores rose at the end of 2016 (the beginning of an acceleration in economic growth) for all four measures. Our two approaches to measuring regulation, NetReg and RegSent, are negatively correlated, as expected (
$ NetReg{P}_t $
 and
$ RegSent{P}_t $
 are correlated −0.53, and
$ NetRegQ{A}_t $
 and
$ RegSentQ{A}_t $
 are correlated −0.33 as shown in Supplementary Material Figure A1). The definitions of the text variables are in Table 5, and summary statistics are in Table 6.
Figure 2 shows the sentiment series using the Loughran-McDonald (LM) dictionary in sentences matching our regulatory filter in the Presentation (RegSentPt) and Q&A (RegSentQAt) portions of earnings calls. Also shown are the LM sentiment of the Presentation (AllSentPt) and Q&A (AllSentQAt) portions of the earnings call. The underscore t indicates each series is an equally weighted average of individual call measures within each quarter. Data are quarterly.

FIGURE 2 Long description
The X axis represents time in years from 2010 to 2019 with quarterly tick marks. The Y axis is labeled Call sentiment with values ranging from negative 0.015 to positive 0.015. A horizontal dashed line marks the zero baseline.
Four distinct lines are plotted from top to bottom.
* A solid black line for all Sent P sub t starts at approximately 0.010 in 2010 and shows a steady upward trend, ending near 0.018 in 2019.
* A dashed red line for all Sent Q A sub t remains relatively stable between 0.003 and 0.008 throughout the period.
* A dotted green line for reg Sent P sub t fluctuates around the zero baseline, starting slightly below zero and ending slightly above zero with a notable peak in 2017.
* A dash-dot light blue line for reg Sent Q A sub t is the lowest series, fluctuating between negative 0.015 and negative 0.005, showing a slight upward trend toward the end of the decade.

TABLE 5 Long description
The table consists of two columns: Variable and Name Description.
* Sales growth: Percentage growth in sales from quarter t minus 4 to quarter t.
* Asset growth: Percentage growth in total assets from quarter t minus 4 to quarter t.
* Operating margin: Operating income after depreciation divided by sales.
* Operating margin Delta: Change in operating margin from quarter t minus 4 to quarter t.
* Gross margin: Revenues minus cost of goods sold divided by sales.
* Gross margin Delta: Change in gross margin from quarter t minus 4 to quarter t.
* Leverage: Sum of current liabilities and long-term debt divided by total assets.
* Cost of goods sold: Cost of goods sold divided by sales.
* S G and A: S G and A divided by sales.
* Excess ret: Stock return in excess of the risk-free rate.
* F F 6 Ret: Excess stock return with respect to the Fama and French 2015 5-factor model augmented with the momentum factor.
* F F 6 Alpha: Alpha estimated from the F F 6 model over the trading-day window minus 252 to minus 31.
* Size: Logarithm sales from the quarter associated with the earnings call.
* log(M E): M E is the closing price times shares outstanding.
* log(B M): B M is the book value of common equity divided by market equity.
* S U E: Standardized unexpected earnings following Bernard and Thomas 1989.
* log(share turnover): Shares traded divided by shares outstanding on the day of the earnings call.
* [Inc/Dec/Tot][P/Q A]: Average number of increasing, decreasing, or total words in regulatory sentences of the Presentation or Q and A section.
* NetReg[P/Q A]: Net difference of increasing and decreasing words in regulatory sentences scaled by total words.
* RegSent[P/Q A]: Net difference of positive and negative tone words within regulatory sentences.
* AllSent[P/Q A]: Net difference of positive and negative tone words for the entire Presentation or Q and A section.
* Ind. NetReg[P/Q A]: 2-digit S I C industry average of NetReg[P/Q A].
* Ind. RegSent[P/Q A]: 2-digit S I C yearly industry average of RegSent[P/Q A].
* Ind. AllSent[P/Q A]: 2-digit S I C yearly industry average of AllSent[P/Q A].
* Ind.Adj. NetReg[P/Q A]: Firm-level NetReg[P/Q A] minus Ind. NetReg[P/Q A].
* Ind.Adj. RegSent[P/Q A]: Firm-level RegSent[P/Q A] minus Ind. RegSent[P/Q A].
* Ind.Adj. AllSent[P/Q A]: Firm-level AllSent[P/Q A] minus Ind. AllSent[P/Q A].
* NoRegulat: Dummy variable equal to 1 if the call from 4 quarters ago had no mention of regulat.
* NeverRegulat: Dummy variable for firms that have never mentioned regulat in any conference calls.

TABLE 6 Long description
The table contains 40 rows of data across 8 columns. Key financial metrics include:
* Sales Growth: 69,500 observations, mean 10.859, standard deviation 29.338, range -47.204 to 142.495.
* Asset Growth: 69,644 observations, mean 11.834, standard deviation 30.488, range -32.244 to 152.556.
* Operating Margin: 69,525 observations, mean 6.595, standard deviation 20.321, range -88.303 to 42.632.
* Leverage: 67,113 observations, mean 25.217, standard deviation 21.008, range 0.000 to 83.246.
* Excess Ret 22-day: 67,917 observations, mean 1.528, standard deviation 12.975, range -80.591 to 395.474.
* S U E: 33,077 observations, mean -2.412, standard deviation 1.837, range -7.161 to 1.622.
* Logarithm Market Equity: 71,996 observations, mean 7.265, standard deviation 1.839, range 0.317 to 13.886.
Text-based measures include:
* Tot P: 18,912 observations, mean 44.148, standard deviation 48.723, range 2.000 to 891.000.
* Net Reg P: 18,912 observations, mean -0.004, standard deviation 0.052, range -0.333 to 0.429.
* Tot Q A: 13,565 observations, mean 31.335, standard deviation 32.559, range 1.000 to 979.000.
* Net Reg Q A: 13,565 observations, mean -0.007, standard deviation 0.054, range -0.667 to 0.500.
* All Sent P: 24,922 observations, mean 0.018, standard deviation 0.013, range -0.048 to 0.075.
* All Sent Q A: 24,794 observations, mean 0.010, standard deviation 0.012, range -0.091 to 0.143.
Industry-adjusted measures (Ind. Adj.) generally show means near zero, such as Ind. Adj. Net Reg P with a mean of -0.0001 and a standard deviation of 0.048.
B. Case Studies
To build intuition for how our measures capture the regulatory environment faced by firms, we examine NetReg and AllSent for Duke Energy, a large utility operating in many regulated markets. Duke devotes a relatively large fraction of its earnings calls, both in the Presentation and the Q&A sections, to discussing its regulatory landscape. Duke mentions regulations in most of its earnings calls, as can be seen from its nearly complete NetReg time series (Supplementary Material Figure A2). We restrict attention to sections of calls that mention Increasing or Decreasing regulatory words from Table 3 five or more times in regulatory sentences. Sections with more regulatory modifier words are more informative about firms’ regulatory exposures.
The Aug. 7, 2013, Duke Energy earnings call contains the Presentation section with the lowest NetRegP score among all Presentation sections with five or more decreasing regulatory modifier words. We expect this call, therefore, to indicate an improving regulatory environment. Indeed, we first hear that “we [i.e., management] expect the second half of the year to be relatively stronger than the first half, primarily as a result of 3 items: First, constructive rate case outcomes.” As a regulated utility, Duke periodically asks its state regulators to approve rate increases and here expresses satisfaction with the allowed rate increases in this cycle. The company then discusses the regulatory approval of a decision to retire a nuclear power plant called Crystal River 3 on the west coast of Florida. It goes on to say that “2013 is an important year, with a number of regulatory proceedings to position the company for the future. We operate in constructive regulatory jurisdictions and have 5 approved or pending settlements with annual revenue increases of around USD600 million. This will result in less regulatory risk to the company, as well as more rate certainty for our customers.” Note the emphasis on the risk aspect of regulation. The company does not mention the physical cost of its regulatory compliance, but rather the lower level of future regulatory risk. It goes on to say that given its “focus on resolution of near-term priorities and constructive regulatory outcomes, we have positioned Duke for low risk, primarily regulated growth through 2015.” Duke is pleased about the low risk of its regulated growth. Finally, the company points out that “[l]ow load growth, new technologies, new regulations and ongoing cost pressures are just some of the forces that require new thinking and action. This includes innovation and technology deployment, continuous improvement [of] regulatory mechanisms.” Again, the management of Duke is focused on, among other matters, evolving regulations and improving the regulatory mechanism.
There are two main takeaways from this. First, our scoring methodology does indeed identify this quarter as a very positive one for Duke Energy from a regulatory perspective. Second, Duke is concerned primarily about the risk associated with its regulations, as well as with the smooth functioning of the regulatory process. Nowhere is there mention of the explicit cost of regulation to the firm or of the resources the firm expends to manage its regulatory environment. Risk and a rational regulatory process are the primary concerns.
We also analyze regulatory mentions by American Axle, an automotive parts manufacturer, and by AutoNation, a national car dealer. American Axle and AutoNation face lower regulatory scrutiny than does Duke Energy. These two firms discuss regulations on their earnings calls very infrequently. When they do, it is often in response to unusual regulatory developments. In 2018, American Axle is concerned about an unanticipated regulator-mandated electricity rate increase. In 2015, AutoNation discussed the increased “regulatory burden” of additional consumer protection regulations. These examples illustrate the strength of our method: we can identify infrequent, but important, regulatory mentions; obtaining similar information from other data sources is nearly impossible. These two case studies are analyzed in Section 3 of the Supplementary Material.
C. Analysis of Variance
In Table 7, we perform a variance decomposition of our NetRegP and NetRegQA measures, which allows us to identify how much of the variation in those measures reflects average sectoral effects, firm-fixed effects, time effects, or the residual (within-firm variation, after controlling for all of those). We perform a Cholesky-type decomposition, which assigns to each category of influence (in the order reported in Table 7) a percentage of variance. We also compare these variance decompositions to similar analyses on other, sentiment-based, measures.

TABLE 7 Long description
The table is titled Variance Decomposition of Text-based Measures. It consists of eight columns representing different measures: NetRegP, NetRegQA, NetRegP super L L M, NetRegQA super L L M, RegSentP, RegSentQA, AllSentP, and AllSentQA. The rows represent the adjusted R-squared values for three types of Fixed Effects (F E).
* Time F E: Values range from 0.0002 to 0.0085, with AllSentQA having the highest value.
* Industry F E: Values range from 0.0045 to 0.0558, showing an incremental increase over Time F E.
* Firm F E: This row shows the highest incremental contribution to R-squared across all measures. Values include 0.1062 for NetRegP, 0.0446 for NetRegQA, 0.1171 for NetRegP super L L M, 0.0387 for NetRegQA super L L M, 0.1544 for RegSentP, 0.0270 for RegSentQA, 0.3279 for AllSentP, and 0.2390 for AllSentQA.
The results are striking. Close to 90% of the variation in NetRegP, and close to 95% of the variation in NetRegQA, reflects within-firm variation in earnings call discussions of regulation, which is unrelated to the variation captured by time-, industry-, and firm-fixed effects. Changes in rules for all firms that are enforced similarly should produce common effects across firms (time effects). Similarly, such changes in rules for a given sector should produce common effects for firms in that sector (sectoral fixed effects). We interpret the lack of importance of industry and time effects as implying that firms perceive the idiosyncratic enforcement of regulations as important. Furthermore, because firm-fixed effects also explain little of the variation in our measures, we infer that firms perceive regulatory enforcement as varying importantly over time in ways that are idiosyncratic. Despite this finding, there are occasional large systematic regulatory shocks that our measures capture and that we discuss further in an event study of the impact of NetReg around the Trump inauguration.
There are obvious examples of such idiosyncratic variation, such as approval of new drugs or antitrust policies related to mergers. Our variance decomposition results suggest that such idiosyncratic events related to the changing enforcement of regulation are the main source of firm-level discussions of regulation. We return to the forecasting power of this idiosyncratic variation in the next section. It is interesting to note the contrast between the variance decompositions for our NetRegP and NetRegQA measures and the sentiment-based measures we construct for earnings calls. As Table 7 shows, within-firm variation contributes less to the variance of sentiment-based measures, suggesting that sentiment-based measures have a greater tendency to capture general news that is common across firms or across firms within a particular sector or that is specific to a firm but not time-varying.
D. Topics of Regulation
We also investigated whether the importance of NLP measures of regulation varies according to the specific regulatory topic being discussed, where topics are identified as “clusters” of associated words. For example, it may be that when regulation is discussed in the context of some topics (e.g., mergers and acquisitions or M&A), it has more or less importance than in the context of other topics (e.g., FDA approval of the company’s experimental drug). After all, management references to regulation can mean different things: passing or repealing a new regulation, beginning or ending an investigation or an enforcement action, approving or denying a merger or approving or denying a drug’s use, to name only a few. It is conceivable that some of these topical contexts are more important than others. Previous work has shown that sentiment can have very different meanings depending on topical context (Calomiris and Mamaysky (Reference Calomiris and Mamaysky2019)), suggesting that topic modeling is an effective unsupervised learning tool for economics applications.
To conserve space, we report those results in a separate Topic Analysis Appendix (Calomiris, Mamaysky, and Yang (Reference Calomiris, Mamaysky and Yang2024)). For our topic model, we use Latent Dirichlet Allocation (LDA), first proposed by Blei, Ng, and Jordan (Reference Blei, Ng and Jordan2003); the work of Steyvers and Griffiths (Reference Steyvers, Griffiths, Landauer, McNamara, Dennis and Kintsch2007) serves as a good primer. We estimate a 10-topic (more on this shortly) LDA model separately for the Presentation and Q&A portions of our corpus. An LDA topic model is represented as two sets of distributions: each of the 10 topics is a probability distribution over the words present in earnings calls (the topic-word distribution); and each document has a probability distribution over the 10 topics (the document-topic distribution).
With respect to the Presentation Section, we find that six topics (FDA, Fins, Legalese, M&A, Margins, and Util) are stable—in the sense that they systematically appear across different runs of the topic model estimation—and distinct enough that they are used on a standalone basis in our empirical analysis. The ProdMkt-Client group combines two stable, but similar, topics. Finally, the Euro-Legalese2 group combines two topics that are unstable across LDA runs and effectively represent a residual topic category. With respect to the Q&A Section, we find that there are four distinct and stable topics (FDA, Fins, M&A, Neg), which are used in the empirical analysis on a standalone basis. One topic group, ProdMkt-Client-EuroComp, is composed of relatively stable topics that have high similarity to one another, and the other topic group CorpFin-Util-Margins is unstable across evaluation runs and represents the residual topic category for the Q&A earnings call sections.
E. Limitations of the Measure
Despite their novelty, our NetRegP and NetRegQA measures have important limitations. First, our measures rely on the root “regulat,” and ignore specific mentions of regulatory agencies, like EPA (Environmental Protection Agency) or FERC (Federal Energy Regulatory Commission), if the root “regulat” is absent. While this is also a strength of our measure, since knowledge of specific regulatory agencies is not needed, it also leads to the possibility that we miss a sentence that discusses FERC regulations but without using the root “regulat.” One solution would be a systematic analysis of all regulatory agencies and other related entities mentioned in the vicinity of “regulat” across all earnings calls. This catalog of regulatory entities could then supplement the location of regulatory mentions.
Furthermore, our counting of increasing and decreasing regulatory words may miss important context, such as whether firms face minor or major regulatory overhauls. Here, modern LLM tools, with their ability to capture context, can help by allowing for the estimation of a mapping from regulatory text embeddings (i.e., a vector representation of regulatory sentences after they are run through a language model) to a scalar measure of regulatory intensity. Such a mapping can be estimated using machine learning techniques, such as lasso regressions, and the historical association between regulatory text and future firm outcomes.
Finally, in our application of modern LLM tools to the present corpus, we found that an off-the-shelf version of ChatGPT could not usefully identify variation in regulatory discussion across dimensions of risk versus current operational cost, regulatory stock versus flow, and rulemaking versus enforcement (see Section IV). We view this null result as indicative of a limitation of present AI models, which calls for further refinement. Perhaps the problem is a lack of context for the specific regulatory burdens faced by firms over time. Fine-tuning off-the-shelf models to capture such important variability in firm-level regulatory sensitivity may be helpful. We leave these important matters as open questions for future research.
IV. Empirical Findings
In this section, we first present our results examining the effects of NetReg on future values of sales growth and other dependent variables, including asset growth, leverage, and margins, using a variety of control variables. We explore differences in those results for large and small firms and perform other robustness tests on our specifications. We find that regulation negatively affects firms’ sales growth, asset growth, leverage, and margins. The effects are larger for small firms. We show (summarized in Table 9, Panels A and D) that these findings are similar whether or not firm-fixed effects are included in the regressions, although we note that empirical studies using natural language measures like NetReg tend to favor estimation without the inclusion of fixed effects.Footnote 7
We then subject the above results to a series of robustness checks, including introducing nonlinearities in our NetReg measure to the regression specification, checking the forecasting power of our ChatGPT-augmented NetRegLLM measures, and performing a comparison of the forecasting power of our NetReg measures versus alternative measures of regulatory burden proposed in the literature. Our NetReg measure is robust in all cases.
The third part of our analysis looks at how the outcome of the election of 2016 (where deregulation featured prominently in the winning candidate’s platform) changed the impact and magnitude of NetReg. We find that firms with high pre-election NetReg values experienced less of a decline in sales growth after the election than those values of NetReg normally would produce. This reduction in the cost of pre-election exposure to NetReg is greater for firms whose stock returns responded more positively to the news of Trump’s election. We also find that firms with high positive pre-election values of NetReg tend to see NetReg shrink after Trump’s election. This validation of our measure as a measure of the effect of exogenous regulatory changes (such as those that result from an election) shows that our measure captures at least some exogenous variation in regulation, which argues for, but of course does not definitively prove, a causal interpretation of NetReg.
Then, we show that regulation discussions in the Q&A section of Earnings Calls have positive effects on future excess returns. This implies that Q&A discussions about regulation imply an elevated level of risk, which is consistent with Hypothesis 1. Fifth, we expand the time horizon over which the effects on firm performance and leverage may occur, and we find that most effects of regulation news on future performance manifest over a 2-year response horizon; the exception is leverage, where negative effects from regulation continue to grow beyond that time horizon. Here, we consider the implications of our findings from the perspectives of Hypotheses 1 and 2, and, therefore, about the likely relative importance of compliance risk and physical operational burdens for explaining our findings. Sixth, we show that NetReg is not forecasted by lagged measures of firm performance or by lagged stock returns. We interpret NetReg, therefore, as measuring unforecastable regulatory news. This implies that the usefulness of NetReg for forecasting future sales growth, leverage, and other firm performance measures likely reflects exogenous regulation news (unrelated to lagged characteristics or contemporaneous control variables), rather than predictable responses of regulatory events to changes in firm performance. In contrast, our general sentiment measure for earning calls, AllSent, is predictable by lagged firm characteristics.
Finally, we extend our analysis to measure whether the effects of NetReg can be attributed to identifiable subcategories of regulatory news. We use ChatGPT to classify regulatory discussions along several dimensions—risk versus current operational cost, regulatory stock versus flow, and rulemaking versus enforcement—and find no consistent evidence that any one category drives our results, suggesting that NetReg captures regulation in broad rather than narrowly parseable terms. We then use an LDA topic model to identify which aspects of regulatory news have the largest effects on firm performance. We find that regulatory discussions related to mergers and acquisitions (M&A), actions by the FDA, the regulation of financial institutions (Fin), and utilities regulation (Util) stand out as areas of particularly large influence, and we explore possible interpretations of these topic areas, with details provided in the Topic Analysis Appendix (Calomiris, Mamaysky, and Yang (Reference Calomiris, Mamaysky and Yang2024)).
We provide no formal test to identify whether the effect of regulations on future outcomes we measure with NetReg is causal or simply a proxy for some unobserved firm heterogeneity. Of course, even if the effect is not causal, the forecasting relationship we study in the article—of present NetReg on future outcomes—is still of interest to market participants, corporate managers, and regulators.
We do, however, control for many other possible influences on future firm outcomes and find that none of them drive out the forecasting power of present NetReg. And the results reported in Table 2 and Supplementary Material Tables A6 and A7 suggest that measures from related literature discussed earlier do not account for our findings. Furthermore, as part of our robustness analysis in Section IV.F, we find that NetReg is not a predictable consequence of changes in past firm performance, but that NetReg does forecast future firm performance. For all these reasons, we believe it is unlikely that NetReg merely proxies for unobserved heterogeneity; if that were so, it would have to be important unobserved heterogeneity that is unrelated to multiple dimensions of past firm performance, which seems unlikely.
Finally, the 2016 election validation check on our measure also provides direct evidence that, at least in part, NetReg captures the effects of exogenous regulatory change on firm outcomes. Not only is this regime change visible in the time series of an aggregation of our firm-level measures, but we also are able to test whether the impacts of regulation for firms most subject to high pre-election regulation diminish the most in the immediate aftermath of Trump’s taking office, and we find that they do. We believe the totality of the evidence suggests (but, of course, does not prove) a causal interpretation of regulatory influences on firms’ performance.
A. Effects of Regulatory Tone on Firm Performance Measures
Our core analysis is a panel regression with firm-quarter observations, where we study how future firm outcomes depend on NetReg and AllSent. In our specifications, we control for other potential influences on future outcomes, including lagged firm size (logarithm sales); lagged annual firm growth, leverage, or profitability; industry-level measures of firm regulation calculated as equal-weighted averages in the firm’s 2-digit SIC industry over the prior 90 days; dummies indicating absence of regulatory mention; and industry-fixed effects. We also consider a version of the basic specification that drops the industry-fixed effect but includes firm- and time-fixed effects. The basic specification for firm i in quarter t is

where
$ {G}_{i,t\to t+4} $
 is the firm variable of interest (e.g., future sales or asset growth, year-ahead leverage, etc.),
$ {a}_j $
 is the 2-digit SIC industry-fixed effect,
$ C{T}_{i,t} $
 is the text-based “call tone” measure (NetReg or AllSent), and
$ {X}_{i,t} $
 is the vector of the quarter t control variables described earlier. In many specifications,
$ {X}_{i,t} $
 will also contain the lagged dependent variable. In some specifications, we include the
$ C{T}_{i,t}\times \log {(Size)}_{i,t} $
 (i.e.,
$ {I}_{i,t}=\log {(Size)}_{i,t} $
 ) interaction to study how the effect of our text measure depends on firm logarithm sales. In all specifications that interact firm size with our regulatory sentiment measures, we demean logarithm sales using the full-sample mean. All specifications include 2 dummy variables: NoRegulat (which takes the value of 1 if the firm does not mention regulation in a given call) and NeverRegulat (capturing that a firm never mentions regulation in the entire sample, see Table 5).Footnote
8 These control for any selection bias associated with the presence of any mention of regulation in the earnings call. Standard errors are clustered by 2-digit SIC codes and by quarter.Footnote
9 Note that clustering by 2-digit SIC codes is more conservative than clustering by firm because the former allows for interfirm correlations within an industry, whereas the latter does not.
Table 8 provides detailed results on all the specifications used to analyze the forecasting relationship between lagged NetRegP or NetRegQA and year-ahead sales growth. These results, and our findings for other dependent variables, are summarized in Table 9, which normalizes effects by the standard deviations of the NetReg and AllSent measures and where outcomes are expressed in percentage changes for each dependent variable. Table 8 (and similar tables in the Supplementary Material) report results in raw (not normalized) form, where all dependent variables are also expressed in percent.Footnote 10

TABLE 8 Long description
The table is titled Effects of NetReg on Sales Growth. The dependent variable is Sales Growth sub t plus 4 super i.
Key independent variables and their coefficients (standard errors in parentheses):
* NetRegP sub t super i: Coefficients range from -42.667 to -19.647, all significant at the 1% level (columns 1, 3, 5, 9).
* NetRegQA sub t super i: Coefficients range from -31.278 to -7.499, significant at the 1% or 10% levels (columns 2, 4, 6, 10).
* Industry Adjusted NetRegP sub t super i: -30.163 (column 7).
* Industry Adjusted NetRegQA sub t super i: -22.368 (column 8).
* Size sub t super i: Consistently negative and significant across all columns, ranging from -31.203 to -2.804.
* Sales Growth sub t super i: Positive and significant in most models, ranging from 0.067 to 0.088.
* No Regulat Dummy sub t super i: Negative coefficients, significant in columns 2, 3, 4, 6, 8, 9, and 10.
* Never Regulat Dummy sub t super i: Negative and significant across all applicable columns.
Interactions:
* NetRegP sub t super i times Size sub t super i: 9.019 (significant at 10% level in column 5).
* Industry Adjusted NetRegQA sub t super i times Size sub t super i: 5.085 (significant at 10% level in column 8).
Model Statistics:
* 2-digit S I C Industry Fixed Effects: Yes for all columns.
* Firm and Quarter Fixed Effects: Yes for columns 3 and 4; No for others.
* Number of observations: Ranges from 34,562 to 54,042.
* R-squared: Ranges from 0.066 to 0.435.
* Adjusted R-squared: Ranges from 0.064 to 0.401.
Table 8 shows that, in both the Presentation and Q&A sections, the 2 NetReg variables are associated with large and highly statistically significant effects on 1-year-ahead sales growth.Footnote
11 The effect is robust to the inclusion of various controls and either the inclusion of industry-fixed effects or, as an additional robustness check, firm- and time-fixed effects. We begin with a discussion of the specifications that do not allow the effects of NetReg to vary by firm size and that do not normalize for cross-industry differences. As reported in Table 9, a 1-standard-deviation increase in NetRegP forecasts a 1.56% (i.e., −30.181 ((coefficient estimate from the 1st column of Table 8)
$ \times $
 0.052 (standard deviation of NetRegP from Table 6))) reduction in next year’s sales. The comparable reduction in sales using the coefficient value for NetRegQA in column 2 is 0.97% (i.e., −18.019
$ \times $
 0.054 (standard deviation of NetReqQA)). The negative coefficients on No Regulat (current call does not mention regulat) and Never Regulat (regulat is never mentioned in any call for that company) indicate that companies whose earnings calls do not mention regulation tend to have lower sales growth in the subsequent year. Columns 3 and 4 of Table 8 show the version of this regression with firm- and quarter-fixed effects. The results remain statistically and economically strong.

TABLE 9 Long description
The table is divided into four panels: Panel A (Overall), Panel B (Quarter F E plus Firm F E), Panel C (Small Firm), and Panel D (Large Firm). Each panel measures the impact of six independent variables: NetRegP, NetRegQA, AllSentP, AllSentQA, NetRegP super L L M, and NetRegQA super L L M on five outcomes: Sales Growth, Asset Growth, Leverage, Operating Margin Delta, and Gross Margin Delta.
* Panel A (Overall): Sales Growth shows significant negative coefficients for NetRegP (-1.561), NetRegQA (-0.971), NetRegP super L L M (-1.602), and NetRegQA super L L M (-0.985). Asset Growth is negatively impacted by NetReg variables but positively by AllSentP (1.449) and AllSentQA (1.050).
* Panel B (Quarter F E plus Firm F E): Sales Growth remains negative for NetRegP (-1.098) and NetRegP super L L M (-1.041), while AllSent variables show positive significance. Asset Growth follows a similar trend with strong positive coefficients for AllSentP (1.733) and AllSentQA (1.149).
* Panel C (Small Firm): Shows the largest negative impacts on Sales Growth from NetRegP (-3.069) and NetRegP super L L M (-3.192). Leverage is also significantly negative for NetRegP (-0.576) and NetRegQA (-0.530).
* Panel D (Large Firm): Impacts are generally smaller. Sales Growth is negative for NetRegP (-0.777) and NetRegP super L L M (-0.784). Gross Margin Delta shows a rare positive significance for NetRegQA (0.305) and NetRegQA super L L M (0.245).
Columns 5 and 6 of Table 8 explore differences in the sales growth consequences of NetReg that are associated with firm size by interacting NetReg with the full-sample demeaned firm size. In both the Presentation and Q&A sections of the earnings calls, there are positive coefficients on the interaction of firm size and NetReg; the effect is significant at the 10% level for the Presentation section and significant at the 10.5% level for the Q&A section. Using both the simple coefficient values for NetReg and their interactions with size, for an average-sized firm, a 1-standard-deviation increase in NetRegP is associated with a 2.2% (i.e., −42.667 (coefficient in column 5)
$ \times $
 0.052) decline in sales growth, but at the 75th percentile of size, the effect is a 1.7% decline in sales growth (i.e., −42.667
$ \times $
 0.052 + 9.019 (interaction coefficient in column 5)
$ \times $
 0.052
$ \times $
 (6.813–5.644) (difference between 75th percentile and mean of size)). For the largest firm in our sample (with logarithm sales of 11.8, which is 6.2 above the mean), there is actually a small positive effect of 0.7% of NetRegP on sales growth. At the 25th percentile of size, the effect is a 2.8% decline in sales growth (i.e., −42.667
$ \times $
 0.052 + 9.019 × 0.052 × (4.419–5.644) (difference of 25th percentile and mean size)). The comparable computation for NetRegQA results in a 1.7% decrease in sales growth (i.e., −31.278 (coefficient from column 6)
$ \times $
 0.054). At the 75th percentile of size, the effect is a decline of only 1.1% (i.e., −31.278
$ \times $
 0.054 + 9.254 (interaction term in column 6)
$ \times $
 0.054
$ \times $
 (6.813–5.644)). At the 25th percentile of size, the effect is a decline of 2.3% (i.e., −31.278
$ \times $
 0.054 + 9.254
$ \times $
 0.054
$ \times $
 (4.419–5.644)). For the largest firm in the sample, the effect of NetRegQA on sales growth is roughly a positive 1.4%, in line with the NetRegP finding. This confirms the common view in the regulation literature that large firms enjoy an economy of scale in dealing with regulation.
Columns 7 and 8 of Table 8 measure NetReg in a way that adjusts for any cross-industry differences at the 2-digit SIC level, while also allowing its effect to vary by firm size. We adjust for cross-industry differences in NetReg by constructing two new variables, Ind. Adj. NetRegP and Ind. Adj. NetRegQA, which are the firm-level NetReg measures minus the 2-digit SIC industry average NetReg of the respective portions of earnings calls on that reporting date and over the prior 90 days (Ind. NetRegP and Ind. NetRegQA, see Table 5). The coefficients on Ind Adj. NetReg remain negative and highly statistically significant, and their magnitudes are similar to the unadjusted NetReg measures. For an average-size firm, after taking out the industry-specific mean of regulation, the implied reductions in sales from standard deviation increases in Ind. Adj. NetRegP and Ind. Adj. NetRegQA are 1.4% (i.e., −30.163 (coefficient from column 7 of Table 8)
$ \times $
 0.048 (standard deviation of Ind. Adj. NetRegP)) and 1.1% (i.e., 22.368
$ \times $
 0.050), respectively. The industry average effects (Ind. NetRegP and Ind. NetRegQA) are also very large and negative. A standard deviation increase in Ind. NetRegP reduces sales growth for the firms in the industry, on average, by 1.2% (i.e., −62.073 (coefficient in column 7)
$ \times $
 0.019 (standard deviation of Ind. NetRegP)); a 1-standard-deviation increase in Ind. NetRegQA reduces sales growth by 0.7% (i.e., 33.897 (coefficient in column 8) × 0.021 (standard deviation of Ind. NetRegQA)). This industry effect is in addition to any effects of firm-specific deviations from the industry mean, which are captured by Ind. Adj. NetRegP and Ind. Adj. NetRegQA.
In columns 9 and 10 of Table 8, we also include the lagged value of the NoRegulat variable, which controls for the absence of regulat in the earnings call from a year before, as well as the 1-year lagged value of NetReg. We control for NetReg from a year ago to see the extent to which the effect of NetReg in the present quarter on future sales growth is a manifestation of regulation already found in the past. We find that values of NetReg, beyond the most recent ones, have little effect on next year’s sales growth.
In Table 9, we summarize (in Panels A through D) normalized results of the effects of a 1-standard-deviation change in NetRegP and NetRegQA on year-ahead changes in each of our seven firm performance measures (sales growth, asset growth, leverage, operation margin change, and gross margin change). As a benchmark for comparison, in Table 9 we also include a general sentiment measure (AllSent) for the Presentation and Q&A sections of the Earnings Calls and show the impact of a 1-standard-deviation change in this measure on the dependent variables. For our seven performance measures, Panel A reports results for the whole sample with industry-fixed effects. Panel B checks for the robustness of the results of Panel A using quarter- and firm-fixed effects, without differentiating by firm size. Panels C and D consider our results from Panel A from the standpoint of small and large firms.Footnote 12
Table 9 shows that NetRegP discussions have economically and statistically significant negative effects on three (with firm-fixed effects) or four (without firm-fixed effects) of the five dependent variables (and the impact on leverage becomes larger as more time passes, as we explain below). NetRegQA (without firm fixed effects) displays similar effects on sales growth, asset growth, and leverage, but not on the margin change measures; these results are absorbed by firm-fixed effects. The magnitude of the effects of NetRegP on sales growth and asset growth is relatively larger than the effects on margins in the absence of firm-fixed effects, and when firm-fixed effects are included, the effects on margins also lose statistical significance. All effects are larger for small firms than for large firms.
The results of Panel B provide a useful complement to the analysis of variance results in the prior section. Most of the variation in firms’ discussions of regulation is idiosyncratic in nature and represents time series rather than cross-sectional differences. Yet, introducing firm-fixed effects diminishes the forecasting power of NetReg for some future outcomes. We interpret this to mean some firm-level outcomes, such as sales growth, asset growth, and leverage, are forecastable by time-series variation in firm discussions of regulatory impact. But other outcomes, such as operating and gross margins, are potentially forecastable by cross-sectional differences across firms in regulatory discussion rather than by within-firm time-series variation. Furthermore, introducing firm-fixed effects has a larger impact on NetRegQA than on NetRegP. This may be because management teams discuss important new regulatory developments in the Presentation section to preempt later investor questions, resulting in less forecastability from within-firm time-series variation in NetRegQA; we return to this point in the next subsection. A deeper investigation into the causes of these differences in forecastability is an interesting area for future research.
B. Robustness Checks
In the results reported in Supplementary Material Tables A4 and A5, we experimented with alternative functional forms to the simple linear treatment of NetReg in the results reported thus far. The Supplementary Material Table A4 alternative specification adds the square of NetReg to all the specifications. In some cases, the squared term was significant and positive (indicating a diminution of the linear effect), and in others it was significant and negative (indicating an increase in the linear effect). But the coefficients on NetReg are similar to the linear specification, and the overall results are qualitatively the same as those reported earlier.
The Supplementary Material Table A5 alternative specification divides NetReg into its positive (
$ IncReg=\max \left(0, NetReg\right) $
 ) and negative (
$ DecReg=-\min \left(0, NetReg\right) $
 ) component parts. The null hypothesis that the effects of IncReg and DecReg are the same but of opposite sign is not rejected in most cases. The coefficient values for IncReg are typically negative, and those for DecReg are typically positive. The coefficients for the margin variables tended to be larger for IncReg, while those for DecReg were greater for sales and asset growth.
It is conceivable that firms might discuss regulation a year ahead of anticipated bad performance to shift blame for reduced growth or profitability away from themselves. That possibility would work against a causal interpretation of a positive coefficient on NetReg. However, this “cheap talk” interpretation of our evidence implies that when one divides NetReg into its positive (more regulation) and negative (deregulation) components, the positive components (i.e., attempts to shift blame) would drive the results, as managers have no incentive to falsely give deregulation credit for their own successes. However, our finding that DecReg has a larger impact on sales and asset growth argues against the “cheap talk” interpretation.
The two rightmost columns in Table 9 repeat the analysis after replacing our NetReg measures with their NetRegLLM counterparts, which use our measures only if the directionality of the effect is confirmed by ChatGPT. In the vast majority of cases, the forecasting power of the ChatGPT-augmented versions of our NetReg measures is higher than the forecasting power of our base measures. This suggests that our results represent a lower bound of the impact of regulations on firm outcomes. More nuanced measures will likely find even higher impacts. We conjecture that the main reason for the relative weakness of NetRegQA effects in Table 9 is that firms choose to discuss important and novel regulatory developments in the Presentation section of their earnings calls, which may reduce the frequency and importance of similar discussions in the QA section. We report results without firm-fixed effects because one might be concerned that firm-fixed effects can overlook cross-sectional differences, especially for firms with infrequent but important regulatory events. In any case, results with and without firm-fixed effects are similar, suggesting within-firm NetReg variation is an important driver of our results.Footnote 13
In Supplementary Material Tables A6 and A7, we examine the impact of other studies’ measures of regulation on our outcome variables. We come to three conclusions. First, in standalone regressions that contain only the external measures, but not our own NetReg measures, Supplementary Material Table A6 shows that the external regulatory measures typically have less forecasting power for our outcome variables relative to our own measures. Second, our NetReg measures do far better in the firm and quarter-fixed effect regressions than the external regulatory variables, suggesting that firm-fixed effects are a very high hurdle for any firm-level measure of regulatory burden, and our measures capture more within-firm variation than do external measures.
Third, when including these various external regulatory measures in our forecasting regressions with NetReg, the forecasting coefficients on our NetReg measures remain largely unchanged. Consistent with our findings in Table 2, which shows the external regulatory measures are not correlated with our measures, Supplementary Material Table A7 shows that our regulatory measures contain information that is not spanned by other measures proposed in the literature.
Finally, in Supplementary Material Table A6, we also investigate whether the questions in the Q&A section exhibit different behavior from the entirety of the Q&A section. We find that NetReqQ—a measure constructed using equation (1) applied to only the questions part of the Q&A section—behaves similarly to NetRegQA but with less forecasting power. We conclude that the Answers part of the Q&A section contains important regulatory information.
C. Validation of NetReg by Trump’s Election
We investigate how the surprise election of Donald Trump as President in 2016 affected regulatory outcomes for firms. We begin by recognizing that many outcomes affecting sales growth, including our measure, NetReg, itself, may have changed as a result of the election. Our approach to investigating how Trump’s election mattered for regulatory costs begins by measuring all firms’ NetRegP and NetRegQA in the quarter immediately prior to the election (when Trump’s election was not forecastable and was viewed by most as less likely than not). We investigate whether Trump’s inauguration as President was associated with a diminution of the effect on sales growth that would have happened in the year after Trump took office (a period captured by the indicator variable, Inauguration) if he had not been elected. We investigate this, both for the average of sales growth across all firms and differentially across firms.
The time period of our analysis runs from Jan. 1, 2015 to Jan. 31, 2018. Quarters with sales growth starting from Apr. 20, 2016 to Oct. 20, 2016, are omitted. Quarters prior to this are classified as pre-election quarters, and quarters after this period are classified as post-election. Since Inauguration Day was Jan. 21, 2017, this means pre-election quarters had at least 9 months of their 12-month ahead sales growth happen before Trump was inaugurated, whereas post-election quarters had at least 9 months of the 12-month ahead sales growth taking place after Trump’s inauguration. In the pre-election period, we use the usual NetRegP and NetRegQA measures as in all other specifications. In the post-election period, we use the NetReg measures from the quarter immediately prior to the election.
To capture firms whose prospects were particularly sensitive to regulatory concerns related to Trump’s election, we construct the variable Trump, which measures the stock return of the firm in the 3-day window around the Nov. 8, 2016, election. In Supplementary Material Table A9, we observe that the firms that benefited most from Trump’s election were firms involved in natural resources extraction, for-profit education, and various heavy industries. By comparison, the industries that reacted the least positively and, in a few cases, negatively reflected a more eclectic group of businesses that were not the focus of Trump’s policies.
Specifically, we distinguish five effects related to Trump’s inauguration in the regression analysis in Table 10. The first two capture aspects unrelated to regulation per se. In the first row of the table, the coefficient on Trump by itself measures how firms with different values of Trump fared differently in their sales growth in the pre-election period. Second, the coefficient on Inauguration by itself measures whether all firms (irrespective of their regulatory treatment or Trump values) experienced an average increase in sales growth after Trump’s election. For example, if Trump’s tax or foreign policies were relatively favorable for business growth, those would be reflected in this coefficient.

TABLE 10 Long description
A regression table titled Effects of N E T R E G Around Trump Inauguration. The dependent variable for all four columns is Sales Growth sub t plus 4 super i.
Independent variables and their coefficients (standard errors in parentheses):
* Trump super i: Column 3 is 0.035 (0.172); Column 4 is 0.025 (0.153).
* N E T R E G P sub t super i: Column 1 is -46.663*** (9.624); Column 3 is -25.754*** (5.344).
* N E T R E G Q A sub t super i: Column 2 is -13.859 (10.995); Column 4 is 23.605 (17.432).
* Inauguration sub t super i: Column 1 is 4.182** (1.814); Column 2 is 4.490** (1.783); Column 3 is 2.417* (1.208); Column 4 is 2.679** (1.087).
* Size sub t super i: Column 1 is -2.658** (0.972); Column 2 is -2.448** (0.938); Column 3 is -2.606** (0.960); Column 4 is -2.408** (0.936).
* Sales Growth sub t super i: Column 1 is 0.110* (0.051); Column 2 is 0.111*** (0.037); Column 3 is 0.104 (0.100); Column 4 is 0.105* (0.051).
* No Regulat Dummy sub t super i: Column 1 is -1.407 (1.348); Column 2 is -3.644* (1.846); Column 3 is -1.694 (1.215); Column 4 is -4.198** (1.726).
* Never Regulat Dummy sub t super i: Column 1 is -4.393* (2.216); Column 2 is -6.441** (2.699); Column 3 is -5.017** (2.165); Column 4 is -7.380** (2.509).
* Trump super i asterisk N E T R E G P sub t super i: Column 3 is -3.772*** (0.954).
* Trump super i asterisk N E T R E G Q A sub t super i: Column 4 is -8.082*** (2.255).
* Trump super i asterisk Inauguration sub t super i: Column 3 is 0.270 (0.240); Column 4 is 0.292* (0.153).
* N E T R E G P sub t super i asterisk Inauguration sub t super i: Column 1 is 42.464** (18.427); Column 3 is 14.418 (13.116).
* N E T R E G Q A sub t super i asterisk Inauguration sub t super i: Column 2 is 31.551*** (9.231); Column 4 is 7.626 (22.700).
* Trump super i asterisk N E T R E G P sub t super i asterisk asterisk Inauguration sub t super i: Column 3 is 4.134*** (0.966).
* Trump super i asterisk N E T R E G Q A sub t super i asterisk asterisk Inauguration sub t super i: Column 4 is 3.655 (4.094).
Summary Statistics:
* 2-digit S I C Ind. F E: Yes for all columns.
* Number of observations: 16,597 (Col 1); 15,285 (Col 2); 15,918 (Col 3); 14,684 (Col 4).
* R-squared: 0.084 (Col 1); 0.080 (Col 2); 0.090 (Col 3); 0.087 (Col 4).
* Adjusted R-squared: 0.081 (Col 1); 0.076 (Col 2); 0.086 (Col 3); 0.083 (Col 4).
The next three effects capture cross-sectional characteristics related to regulation and their effects in the post-inauguration period. The first of these, the interaction of Trump and the two pre-election NetReg variables, measures whether the coefficient on NetReg for firms with high Trump values was different from that of other firms in the pre-election period. A negative coefficient indicates that firms whose stocks benefited more from Trump’s election were also those with greater negative effects in the pre-election period for any given NetReg score. Second, the interaction of Inauguration with either NetReg variable would be positive if Trump’s post-inauguration period saw an increase in sales growth conditional on the pre-election NetReg values, indicating that the negative effect of NetReg on sales growth from the pre-election period was diminished by Trump’s presidency. Finally, the triple interaction of the two NetReg variables with Inauguration and Trump should be positive if firms that were the greatest stock market beneficiaries from Trump’s election experienced a bigger post-election reversal in the negative effects associated with their NetReg values in the pre-election period.
The first two columns in Table 10 report results for a simplified version of the model that does not take into account the interactions with the Trump variable; the last two columns include those interactions. The results reported in the first two columns show that the coefficient on Inauguration is positive and significant, indicating that Trump’s first year in office was associated with higher sales growth for firms on average. The coefficients on the interactions of Inauguration with both of the NetReg variables are positive and significant, indicating that firms with high pre-election NetReg values experienced higher sales growth than other firms, which we interpret as evidence that Trump’s election mitigated the costs of exposure to high regulatory costs prior to the election.
We take cross-sectional variation in Trump into account in the last two columns of Table 10. The interaction of Trump and both NetReg variables is negative and significant, indicating that firms with higher Trump values faced greater regulatory costs on sales growth in the pre-election period for a given value of the NetReg variables. The coefficient on the triple interaction is positive and significant for NetRegP but is statistically insignificant for NetRegQA, which mirrors the weaker statistical significance of results related to NetRegQA compared to NetRegP in Table 9.
One interpretation of the weaker response of the triple interaction related to the Q&A section is that discussions in the Q&A section may be a noisier measure of regulation, especially in quarters with large regulatory events—like the Trump election—which management teams discuss in the Presentation section of earnings calls. For example, if regulatory issues are discussed adequately in the Presentation section, investors may not raise them in the Q&A section. To test this, we analyze the relationships between pre-election and post-inauguration values of NetRegP and NetRegQA, which we report in Supplementary Material Table A10. Consistent with the view that the Q&A section measure is noisier, we find that serial correlation across the two periods of NetRegP is greater than serial correlation of NetRegQA. We also find that for firms with high Trump values and positive NetRegP values prior to the election, there is a tendency for NetRegP to fall after the inauguration. But consistent with the view that Q&A measures of NetReg are noisier, there is no similar evidence of a reversal for firms with high Trump values and positive pre-election NetRegQA.
D. Return Regressions
In Table 11, we report the results of NetReg measures for stock returns. Here, as is standard practice, we control for the logarithm of market equity (in millions), the logarithm of the book-to-market (BM) ratio (the logarithm of book equity over market equity), and SUE defined similarly to Bernard and Thomas (Reference Bernard and Thomas1989). These variables are measured on the end date of the quarter corresponding to the earnings call. As in Tetlock, Saar-Tsechansky, and Macskassy (Reference Tetlock, Saar-Tsechansky and Macskassy2008), we control for abnormal excess returns on the day of the call and over the 21 trading days before the call. We also control for alpha and logarithm of share turnover, defined as daily shares traded divided by shares outstanding on the day of the earnings call.Footnote 14

TABLE 11 Long description
The table titled Impacts of NetReg and AllSent on Returns consists of 7 columns and 4 data rows. The columns are: Metric Name, NetRegP, NetRegQA, AllSentP, AllSentQA, NetRegP super L L M, and NetRegQA super L L M.
* Excess Ret (22-day): NetRegQA is 0.229**, AllSentP is 0.188**, AllSentQA is 0.400***, and NetRegQA super L L M is 0.318***.
* F F 6 Ret (22-day): NetRegQA is 0.152*, AllSentP is 0.256***, AllSentQA is 0.350***, and NetRegQA super L L M is 0.237***.
* Excess Ret (Call Day): AllSentP is 0.672*** and AllSentQA is 0.785***.
* F F 6 Ret (Call Day): AllSentP is 0.683*** and AllSentQA is 0.784***.
Empty cells indicate non-significant results. Asterisks denote significance levels: * for 10%, ** for 5%, and *** for 1%.
We find that NetRegQA (but not NetRegP) has positive, large, and statistically significant effects on future excess and risk-adjusted abnormal returns in the 22-day period following earnings calls (the methodology to calculate returns is detailed in Section II). We find negative, albeit statistically insignificant, impacts of NetReg on contemporaneous call-day excess and abnormal returns.Footnote 15 Though we do not have power to reject the null for contemporaneous returns, the same-day negative returns and future positive returns due to NetReg are consistent with the risk explanation.Footnote 16 Higher regulatory exposure makes investors demand higher risk compensation, which is accomplished via lower stock prices on the day of the call and higher future returns. We interpret the difference between NetRegQA and NetRegP effects on returns as indicating that questions raised by analysts about regulation (while perhaps noisier in general as a measure of regulation, as discussed at the end of the prior section) may be more relevant for measuring the importance of the discussion as news to the market about risk.Footnote 17
E. Persistence of Effects Beyond 1 Year Ahead
Our empirical findings thus far have focused on 1-year-ahead forecasts, but the magnitudes of the effects we measure could be misleading if these variables adjust with protracted lags to changes in regulation news. We use the local projections method of Jorda (Reference Jorda2005) to calculate cumulative impulse responses to a 1-standard-deviation shock in NetRegP and NetRegQA. Footnote 18
In Figure 3, we report impulse responses for sales growth and leverage. After 2 years, the effect of a NetRegP shock on an average-sized firm’s sales growth flattens out. The cumulative 4-year effect on sales growth is slightly larger than the 1-year effect. For NetReqQA, almost the entire effect for an average-sized firm happens in year 1, as the 4-year cumulative effect is very similar to the 1-year effect. We also calculate the impulse responses for a larger firm (75th percentile by logarithm sales) and find in both the Presentation and Q&A cases it is smaller than the effect for an average-sized firm, as was to be expected given the results in Table 8. We conclude that NetRegQA has a one-time, persistent effect on the level of sales, while NetRegP has a continuing effect over the next year or two. There is no evidence of reversals in either case.
Figure 3 shows the response of sales growth and leverage to a 1-standard-deviation shock to NetRegP (presentation) and NetRegQA (Q&A). We use the local projection method of Jorda (Reference Jorda2005) to calculate the cumulative impulse response as the sum of all prior and current single-period responses to a 1-standard-deviation shock of the respective NetReg measure. Shown are the cumulative responses for an average-sized firm, as well as for a firm in the 75th percentile. The impulse response assumes that the NetReg shock is orthogonal to all other influences. Standard errors assume independence of successive shocks. The bands in the figure show 95% confidence intervals.

FIGURE 3 Long description
A four-panel grid of line graphs. All graphs share an x-axis labeled Years, ranging from 1 to 4.
Top-Left Panel: Sales Growth in Response to Net Reg P. The y-axis ranges from negative 0.06 to 0.02. A black line for Average Firm remains relatively flat near negative 0.01. A maroon line for 75th Pct. Size shows a downward trend from negative 0.015 to negative 0.03. Shaded 95 percent confidence intervals surround both lines.
Top-Right Panel: Sales Growth in Response to Net Reg Q A. The y-axis ranges from negative 0.06 to 0.02. Both the black line (Average Firm) and maroon line (75th Pct. Size) show a slight downward trend, starting near negative 0.01 and ending near negative 0.015 and negative 0.02 respectively.
Bottom-Left Panel: Leverage in Response to Net Reg P. The y-axis ranges from negative 0.05 to 0.01. The black line for Average Firm is nearly horizontal just below zero. The maroon line for 75th Pct. Size shows a steady linear decrease from negative 0.005 at year 1 to negative 0.025 at year 4.
Bottom-Right Panel: Leverage in Response to Net Reg Q A. The y-axis ranges from negative 0.05 to 0.01. The black line for Average Firm stays close to negative 0.005. The maroon line for 75th Pct. Size trends downward from negative 0.01 to negative 0.02.
In all panels, a dashed horizontal line at zero serves as a baseline, and the confidence intervals for the 75th percentile firms are wider than those for average firms.
Figure 3 shows a very different picture for the impulse response for leverage. As in the case of sales growth, there is no reversal in the impulse response. However, in the case of leverage, by the fourth year, the cumulative response is an order of magnitude larger than the 1-year response, especially for NetRegP, and after 4 years, the decline in leverage does not appear to be flattening. The effect is most pronounced for average-sized firms but is also present for large (75th percentile) firms. This suggests that leverage adjusts much more slowly than sales growth to regulatory shocks, and the long-run effect on leverage is substantially understated by the coefficient reported in Table 9. Impulse responses for other variables are reported in the Supplementary Material.
The combination of our empirical findings (that regulatory news predicts significant reductions in growth and leverage, an increase in expected future returns, and a smaller negative change in operating margins) contains elements that confirm both Hypothesis 1 and Hypothesis 2 about the channels through which regulation affects firms (reflecting a combination of compliance risk and physical operational costs). Nevertheless, we believe the findings suggest the relative importance of Hypothesis 1 (consequences of increased regulatory compliance risk), given that the magnitudes of the long-run effects on growth, leverage, and returns are large compared to the coefficients on the margin-related variables, as shown in Table 9 and by the discussion of long-term impacts on leverage in Figure 3.
F. Is Regulatory Discussion Forecastable by Other Variables?
Next, we examine the question of whether NetReg itself is forecasted by firms’ past operating performance, as measured by sales, asset growth, margins, and stock returns. A potential concern about our interpretation of our regulation measures as indicators of news is that discussions of regulation may reflect “cheap talk” by firms attempting to blame previous poor performance on regulation when, in fact, poor performance reflects other influences. If that were true, we would expect problems in sales growth or profitability to predict mentions of regulation. If the NetReg measures capture news, they should not be forecastable using prior firm performance.
In the specification that includes all lagged firm performance measures (sales, assets, and operating margin growth), none of them are statistically significant forecasters of NetReg, either for the Presentation or the Q&A sections of Earnings Calls. The adjusted R-squared values are around 9% for NetRegP and 3% for NetRegQA in all specifications.Footnote 19 The regulatory discussion from the Presentation section is more forecastable than the unscripted regulatory discussion from the Q&A section. NetRegP and NetRegQA are predicted positively by their own lagged values (with NetRegQA much less so), and NetRegP is predicted negatively by firm size. The lagged 1-month risk-adjusted return has no forecasting power for NetReg. This is an important finding because it addresses the concern that discussions about regulation may reflect managerial cheap talk (e.g., poor stock market performance prompting managers or shareholders to talk more about regulation).
In summary, NetRegQA and NetRegP are mainly forecastable by their own past, and NetRegP is related to firm size. Adjusted R-squared values are small. Other variables related to firm income measures or past stock returns have little forecasting power for NetRegP or NetRegQA. In contrast, AllSent is highly predictable by lagged firm performance.Footnote 20 The adjusted R-squared values are much higher, and lagged operating performance and stock returns have significant forecasting power for future AllSent. Therefore, AllSent’s limited ability for forecasting future firm outcomes, as documented in Table 9, cannot necessarily be interpreted as the impact of new information about the firm, because a lot of this information was knowable based on lagged firm operating characteristics. This highlights the specialness of the regulatory information conveyed by NetReg, which is effectively unpredictable by past firm performance.
G. Breaking Down NetReg or Capturing the Importance of Different Topical Contexts
Does the impact of NetReg depend on identifiable differences in the kinds of news captured by the measure? Might one be able to distinguish within NetReg observations between the effects of concerns about new regulations versus concerns about changes in enforcement of existing regulations? Are there identifiable differences in the responses to risks of future regulation as opposed to current operational costs? Is it possible to differentiate between discussions of preexisting regulation and new regulation (that is, regulatory stock versus flow)?
We explored those possibilities by enlisting the help of ChatGPT. We developed prompts for ChatGPT that asked it to characterize NetReg into categories based on these 2 sets of distinctions (risk versus current cost and stock versus flow). The ChatGPT queries associated with these analyses are shown in the Supplementary Material. In each case we modified our core regression in (2) by interacting NetReg (i.e., CT in the regression) with an indicator that signals whether any regulatory sentences in the call contained discussion of risk or cost in one specification and stock or flow in another. We did not find consistent results implying that our NetReg results are driven by one category rather than the other, and that was true for risks versus current operational costs and existing stock versus flow of regulations.
We report one additional experiment for illustrative purposes. Given the lack of salient results using the risk-cost and stock-flow prompts, we constructed a considerably more sophisticated prompt to classify regulatory sentences into those about enforcement, rulemaking, or neither. This prompt, shown in the Supplementary Material, allows us to classify whether a call discusses specific rule-related news, specific enforcement news, or neither. In Supplementary Material Table A8, we show the results of these interaction regressions for all our dependent variables. For sales growth, the positive and significant coefficient on the interaction of the enforcement dummy with NetRegP seems to suggest that rule-making is more important than enforcement in driving our NetRegP results, but the coefficient on the interaction of rule-making and NetReg is 0, not positive and significant, so that interpretation is not correct.
That seemingly inconsistent result in Supplementary Material Table A8 mainly reflects the fact that ChatGPT was unable to categorize most of our observations into one or the other category. In other words, our reported effects for NetReg above reflect observations that are not coded either as new rules or new enforcement issues, or both; most of the observations (120,000 out of our nearly 200,000 observations of NetReg) are simply not coded by AI as falling into either of the two categories. Furthermore, when we tried to validate those AI rankings by reading a random sample of the observations, the rankings did not seem to plausibly capture any identifiable differences that we could see. We tried many alternative prompts without any change in the outcome. We conclude that NetReg captures news about regulation in vague and broad ways, and attempts to parse the data in order to distinguish responses to regulatory stock from flow, regulatory risk or current costs, or regulatory rulemaking or enforcement, are presently difficult with our data but can be interesting to investigate in future research.
We also considered sorting NetReg observations according to topical differences. Using the LDA method for identifying topics related to regulation, we explored in Calomiris, Mamaysky, and Yang (Reference Calomiris, Mamaysky and Yang2024) whether NetReg’s effects on dependent variables are different across topical categories, which we explain in the Topic Model Appendix. For both the Presentation and Q&A sections, we find that the most significant topic areas with negative regulatory influence are M&A and FDA. This makes sense given the potential importance of regulatory approval for mergers or new products. Financial regulation (Fins) shows a negative effect on leverage in the Q&A section. Since we restrict our sample to nonfinancial firms, this finding is not mechanical. We interpret the effect of Fins on the leverage of nonfinancial firms as implying a negative effect on borrowing firms from the regulation of financial firms (perhaps reflecting reduced credit supply effects from financial regulation). Interestingly, we also observe a topic with a positive coefficient: utility regulation for asset growth and leverage. This positive effect is driven by observations for nonutilities, perhaps suggesting a positive effect of more utility regulation on utility customers.
Overall, these results confirm the view of regulation we presented in the introduction. Regulatory news can mean very different things (e.g., new prudential regulations on financial intermediaries, as opposed to drug or merger approvals, or utility price limits), and each of these can have different implications for different firms (e.g., consumers or producers of energy). The analysis of topical context reinforces our view that a text-based measure of regulation, like NetReg, can capture a wide variety of influences.Footnote 21
V. Conclusion
We study a new way to measure regulation and its effects on firm growth, profitability, leverage, and stock returns. Our measure of regulation, NetReg, identifies mentions of the string regulat accompanied by words indicating increasing or decreasing regulation in corporate earnings calls. We believe corporate earnings calls are an ideal setting in which to measure the impact of regulations on firms and that this setting is equally relevant for all industries, regardless of their specific regulatory bodies. The majority of variation in our regulatory measure is due to idiosyncratic within-firm changes in regulatory exposure, suggesting that our measure captures information that industry- and economy-wide measures cannot reflect.
Higher NetReg has substantial negative effects on future sales growth, asset growth, and leverage from increased regulatory burden, as expressed in the Presentation section of earnings calls. The discussion of regulatory exposure in the Presentation section of earnings calls also has a negative (but lesser) effect on profit margins, and only in the absence of firm- and time-fixed effects. Excess stock returns are substantially higher after earnings calls exhibiting higher NetRegQA. This suggests that regulatory exposures identified in earnings calls reflect, at least in part, regulatory risks.
Effects of regulation are smaller for large firms, indicating substantial economies of scale in managing exposure to regulation. The decreased impact of our regulatory measure on future corporate outcomes after the Trump inauguration for firms with high pre-election NetReg and strong positive stock reactions to Trump’s election demonstrates that our measure captures, at least in part, exogenous variation in firm-level regulatory exposure.
Supplementary Material
To view supplementary material for this article, please visit http://doi.org/10.1017/S0022109026103147.


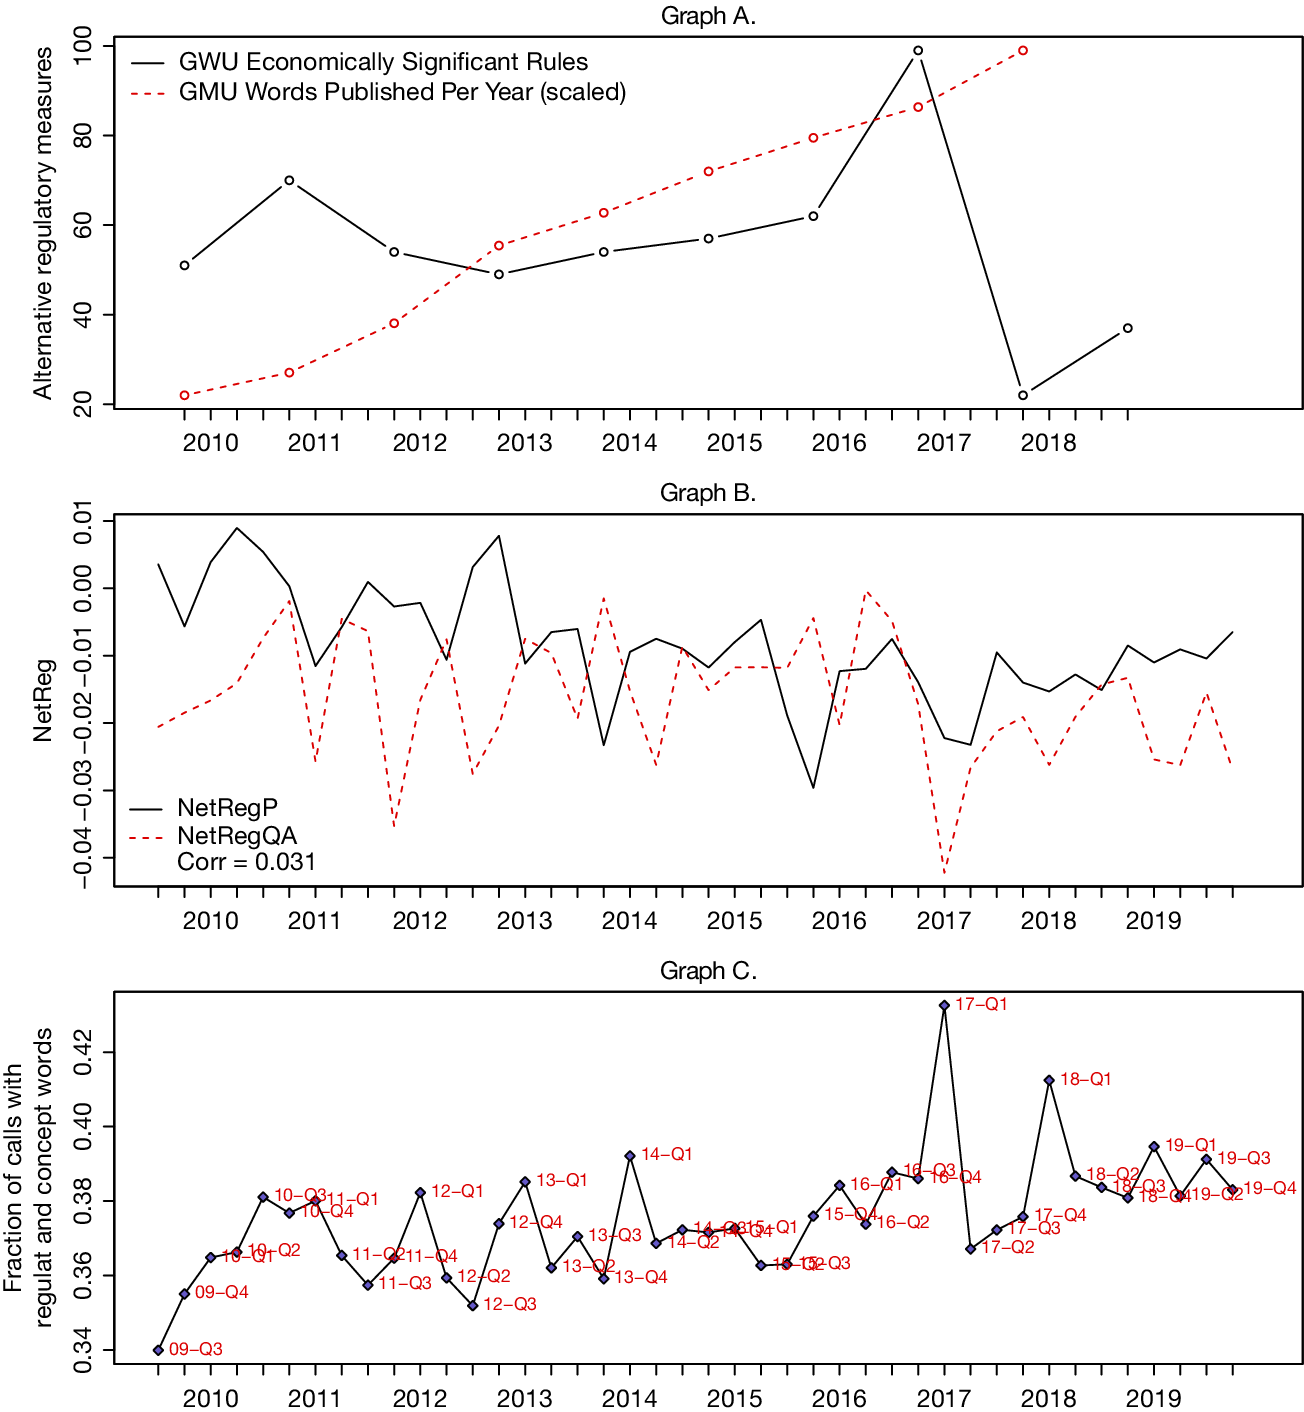
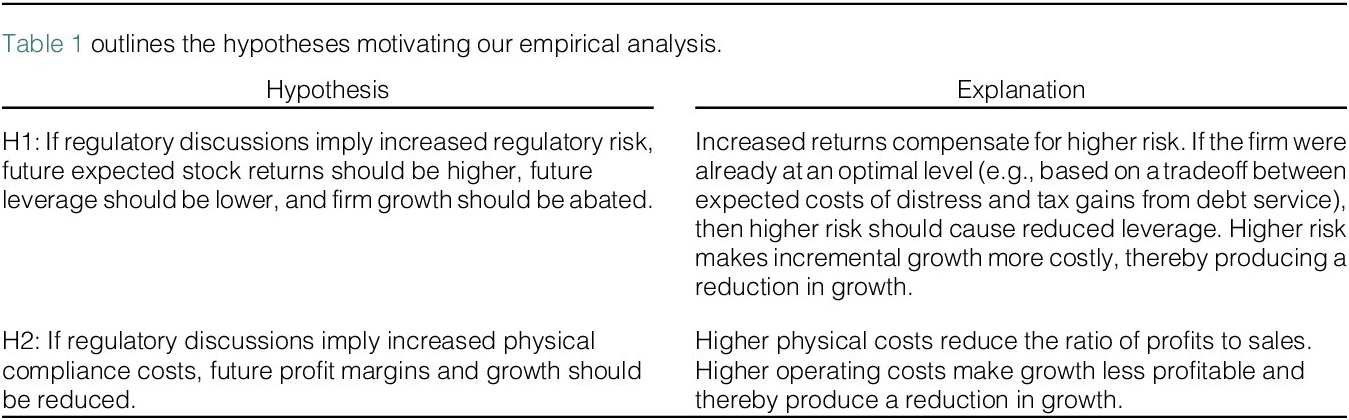
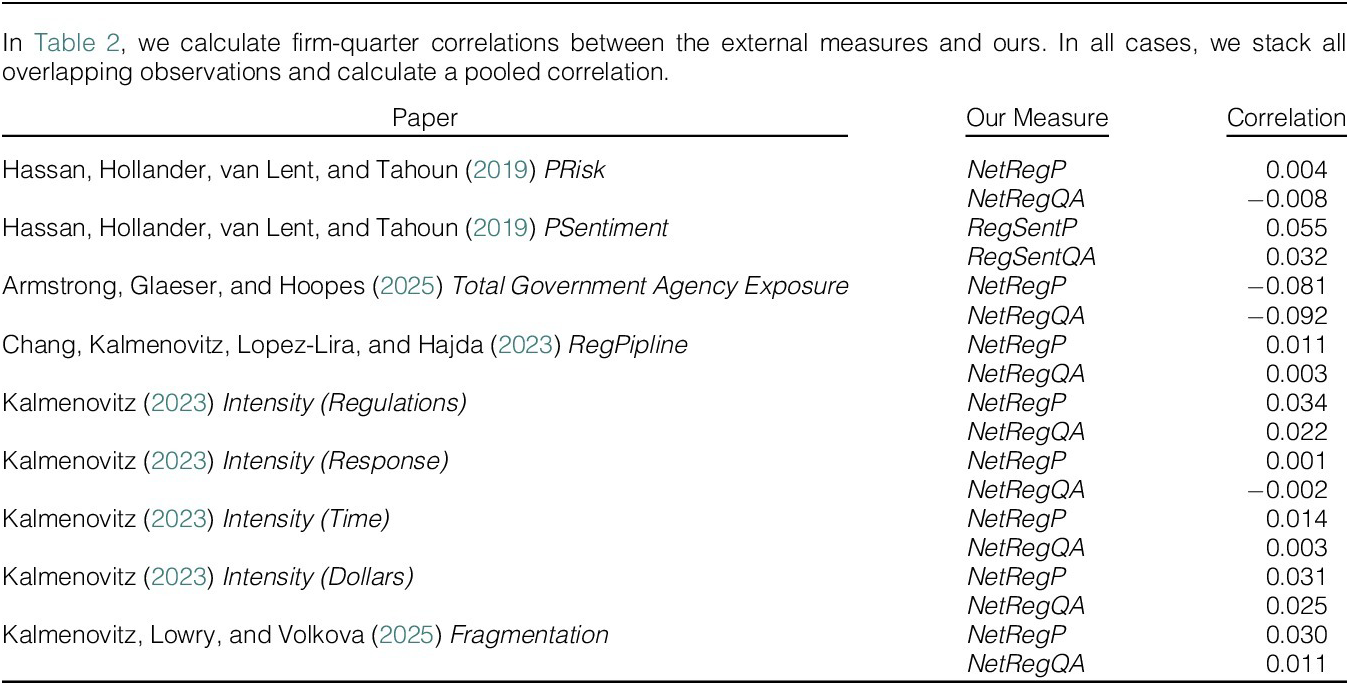
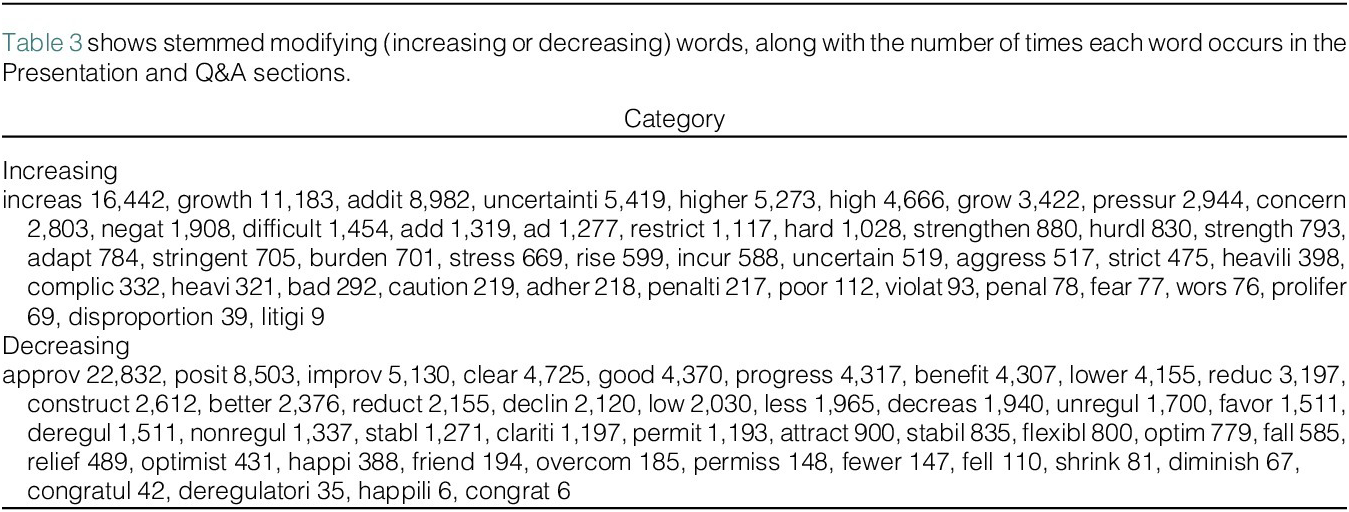
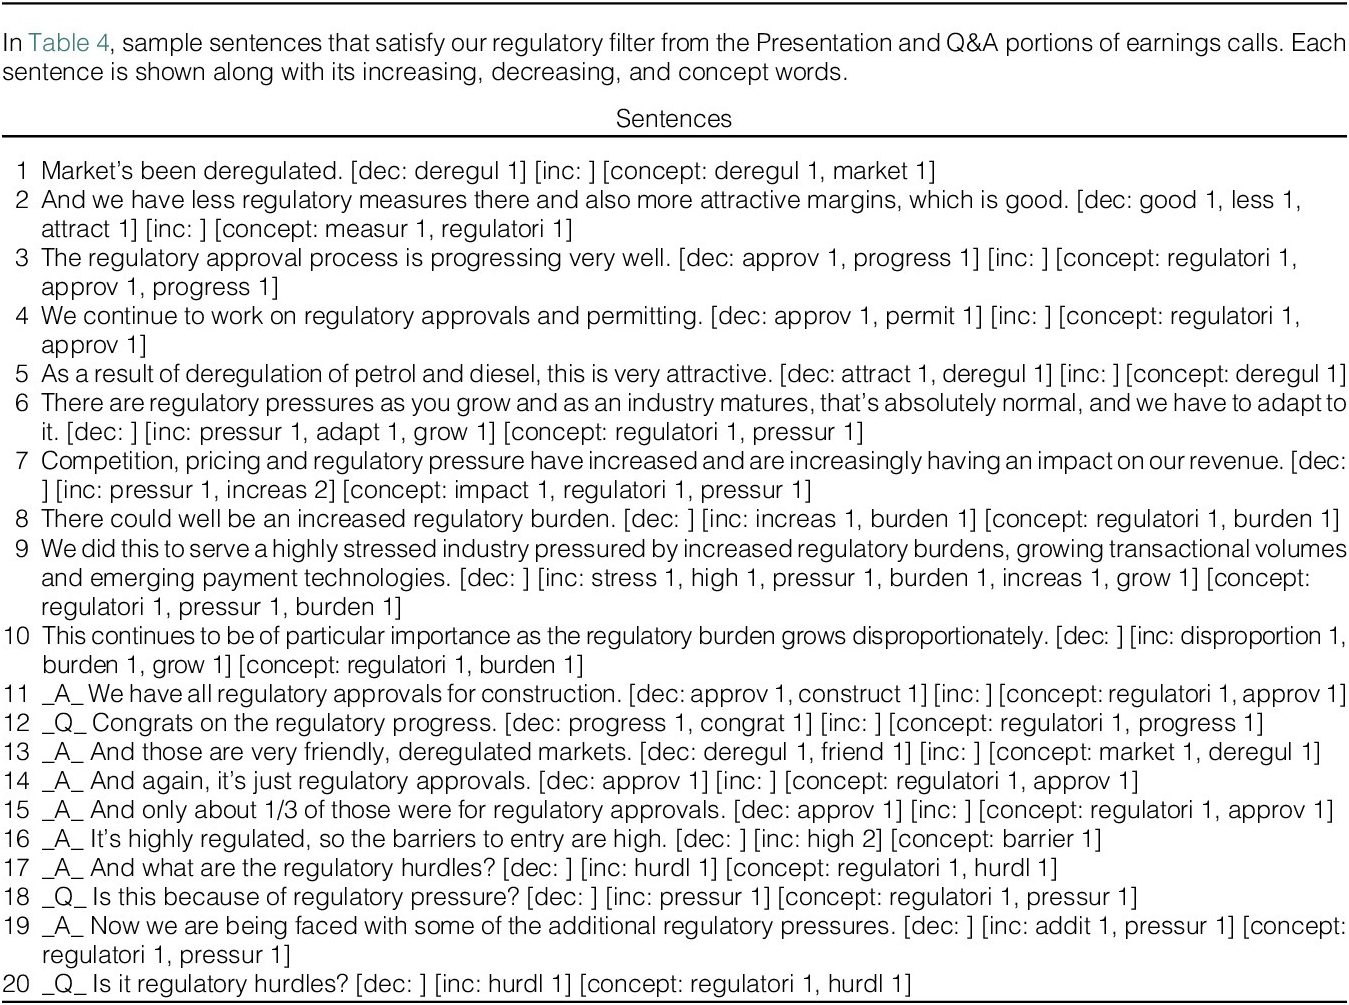
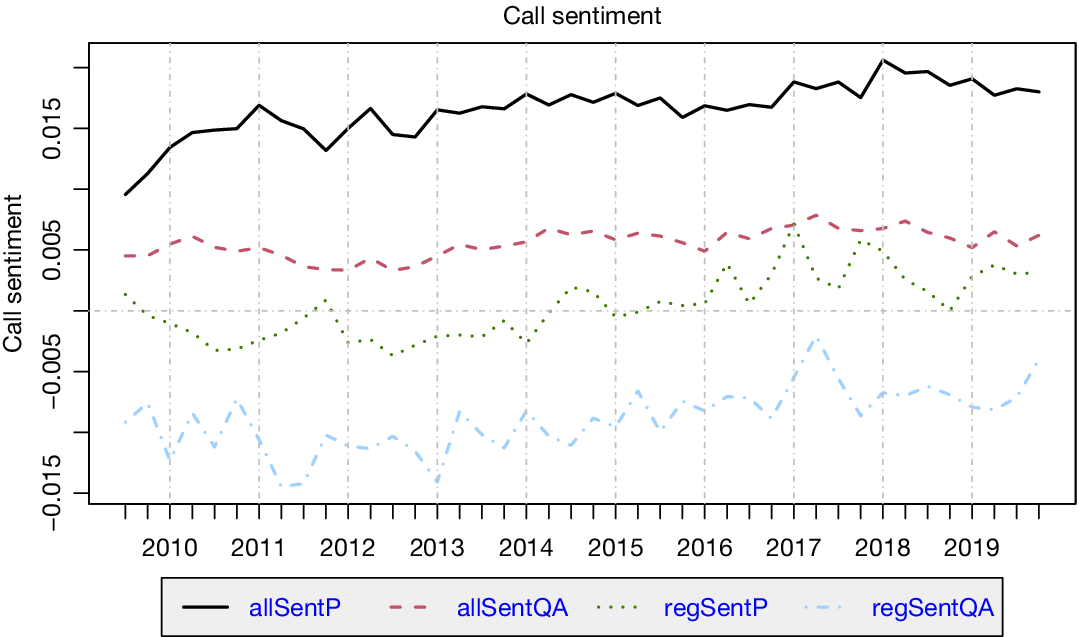
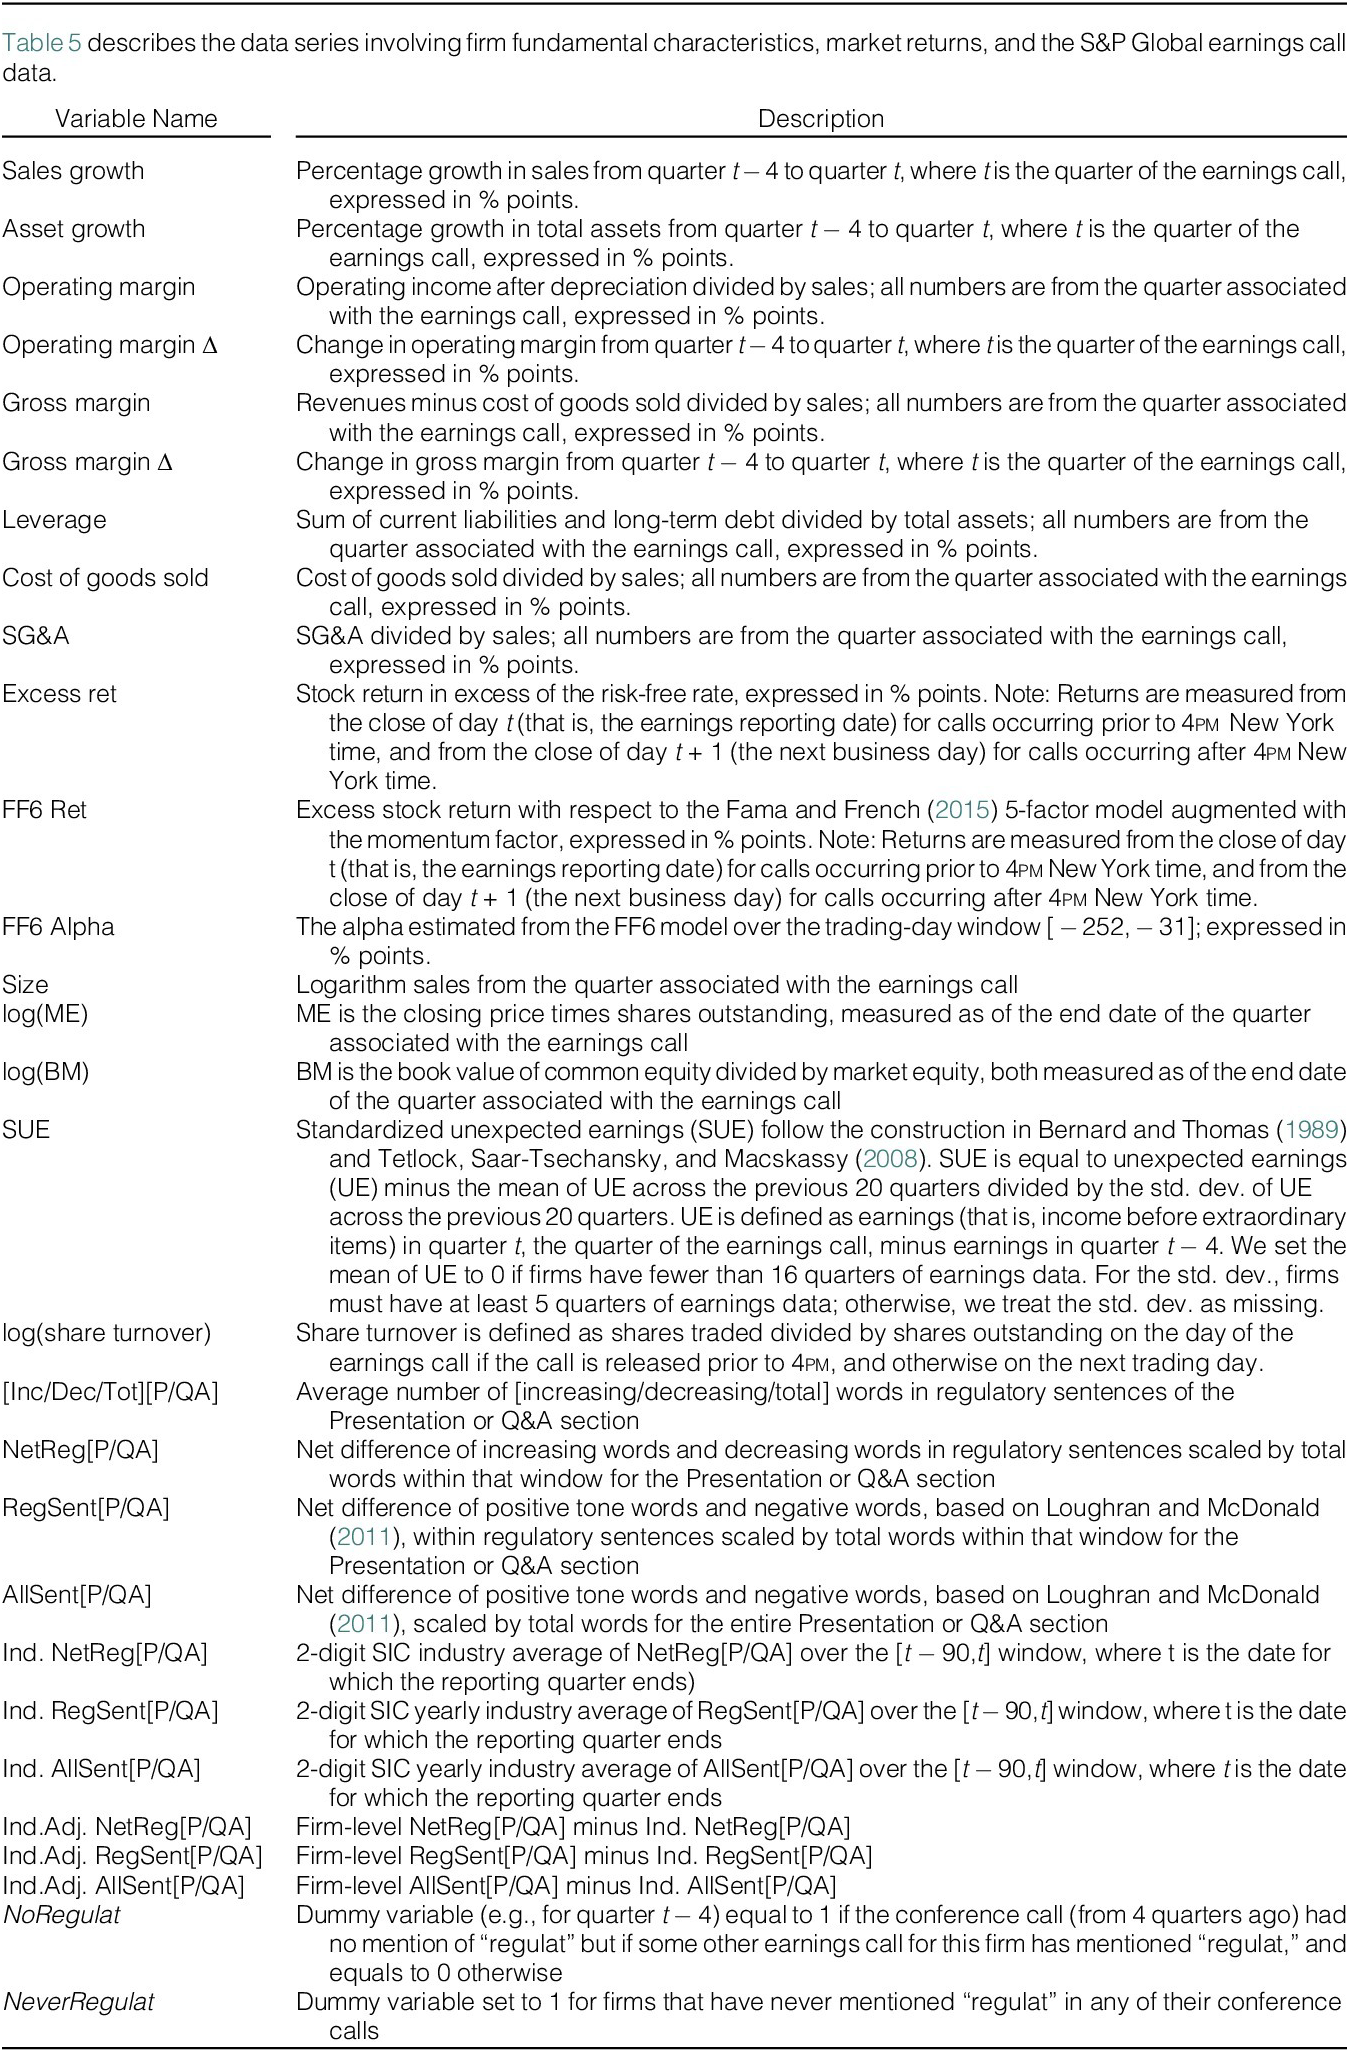
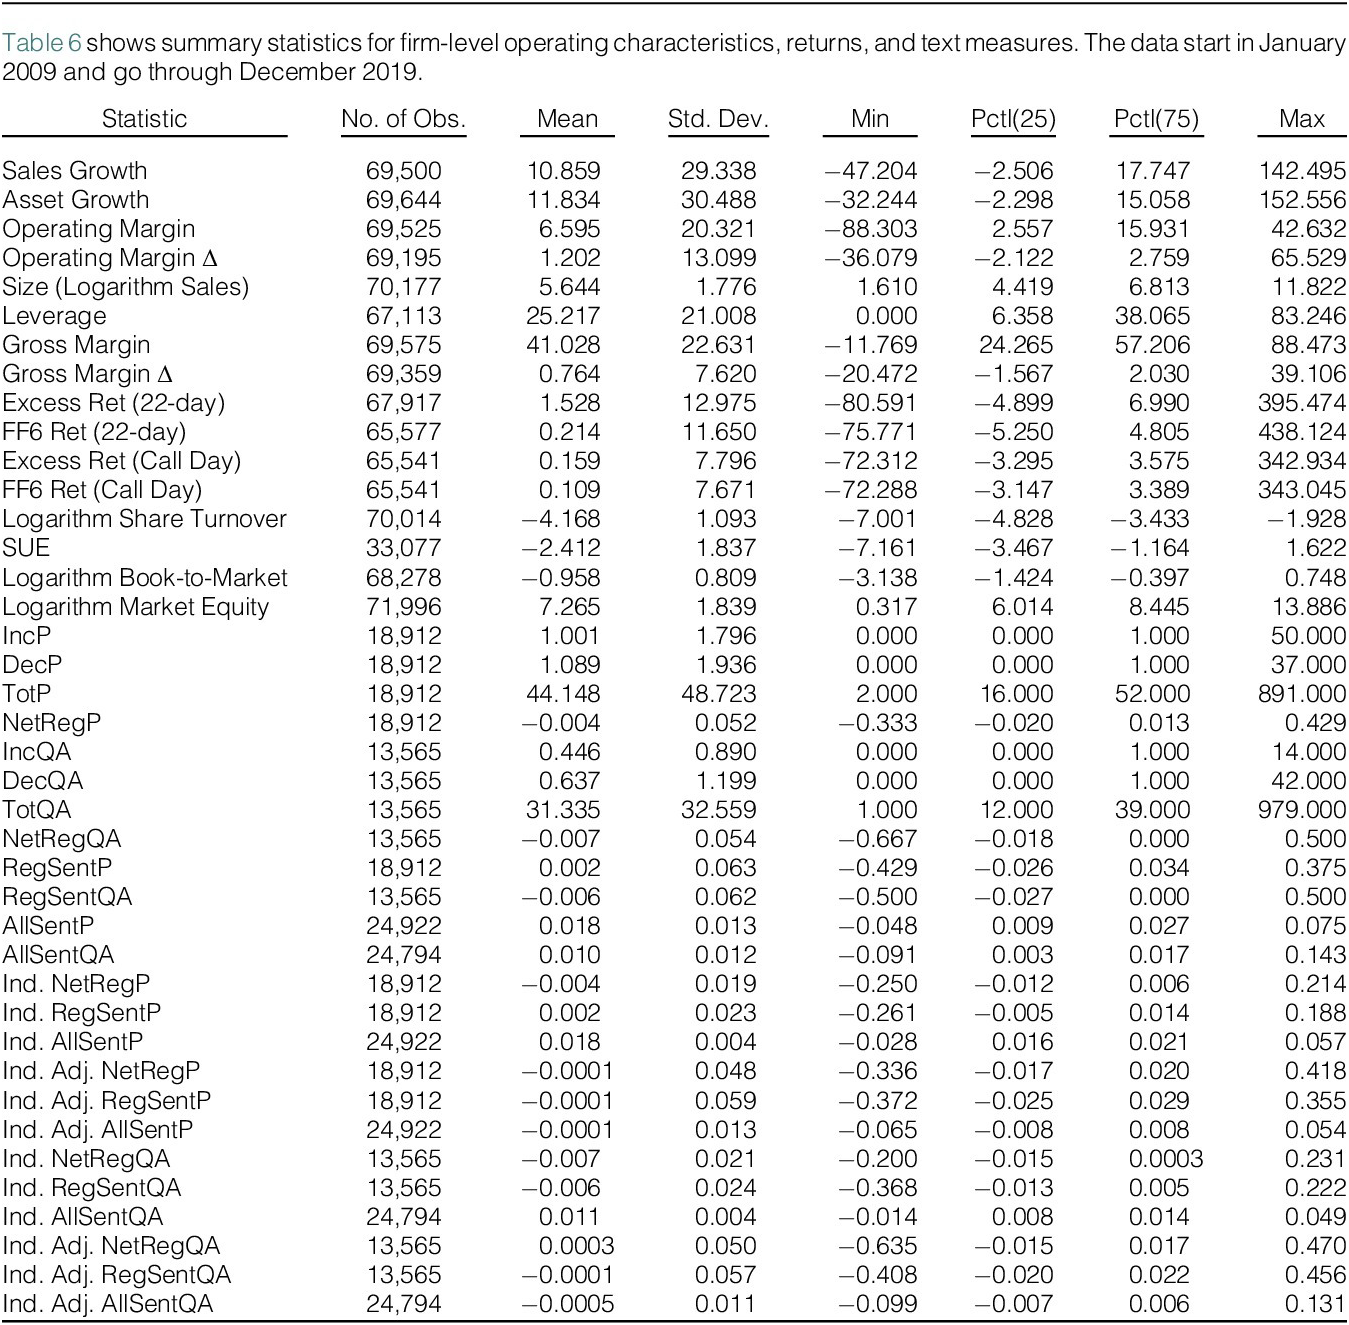
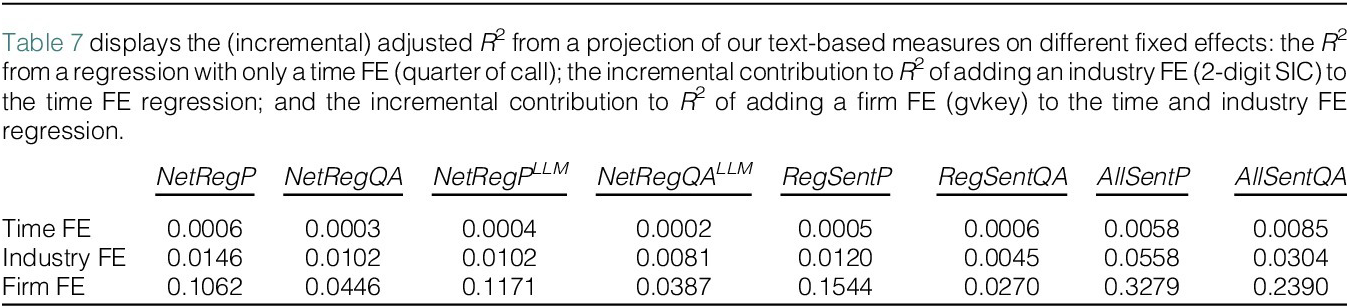
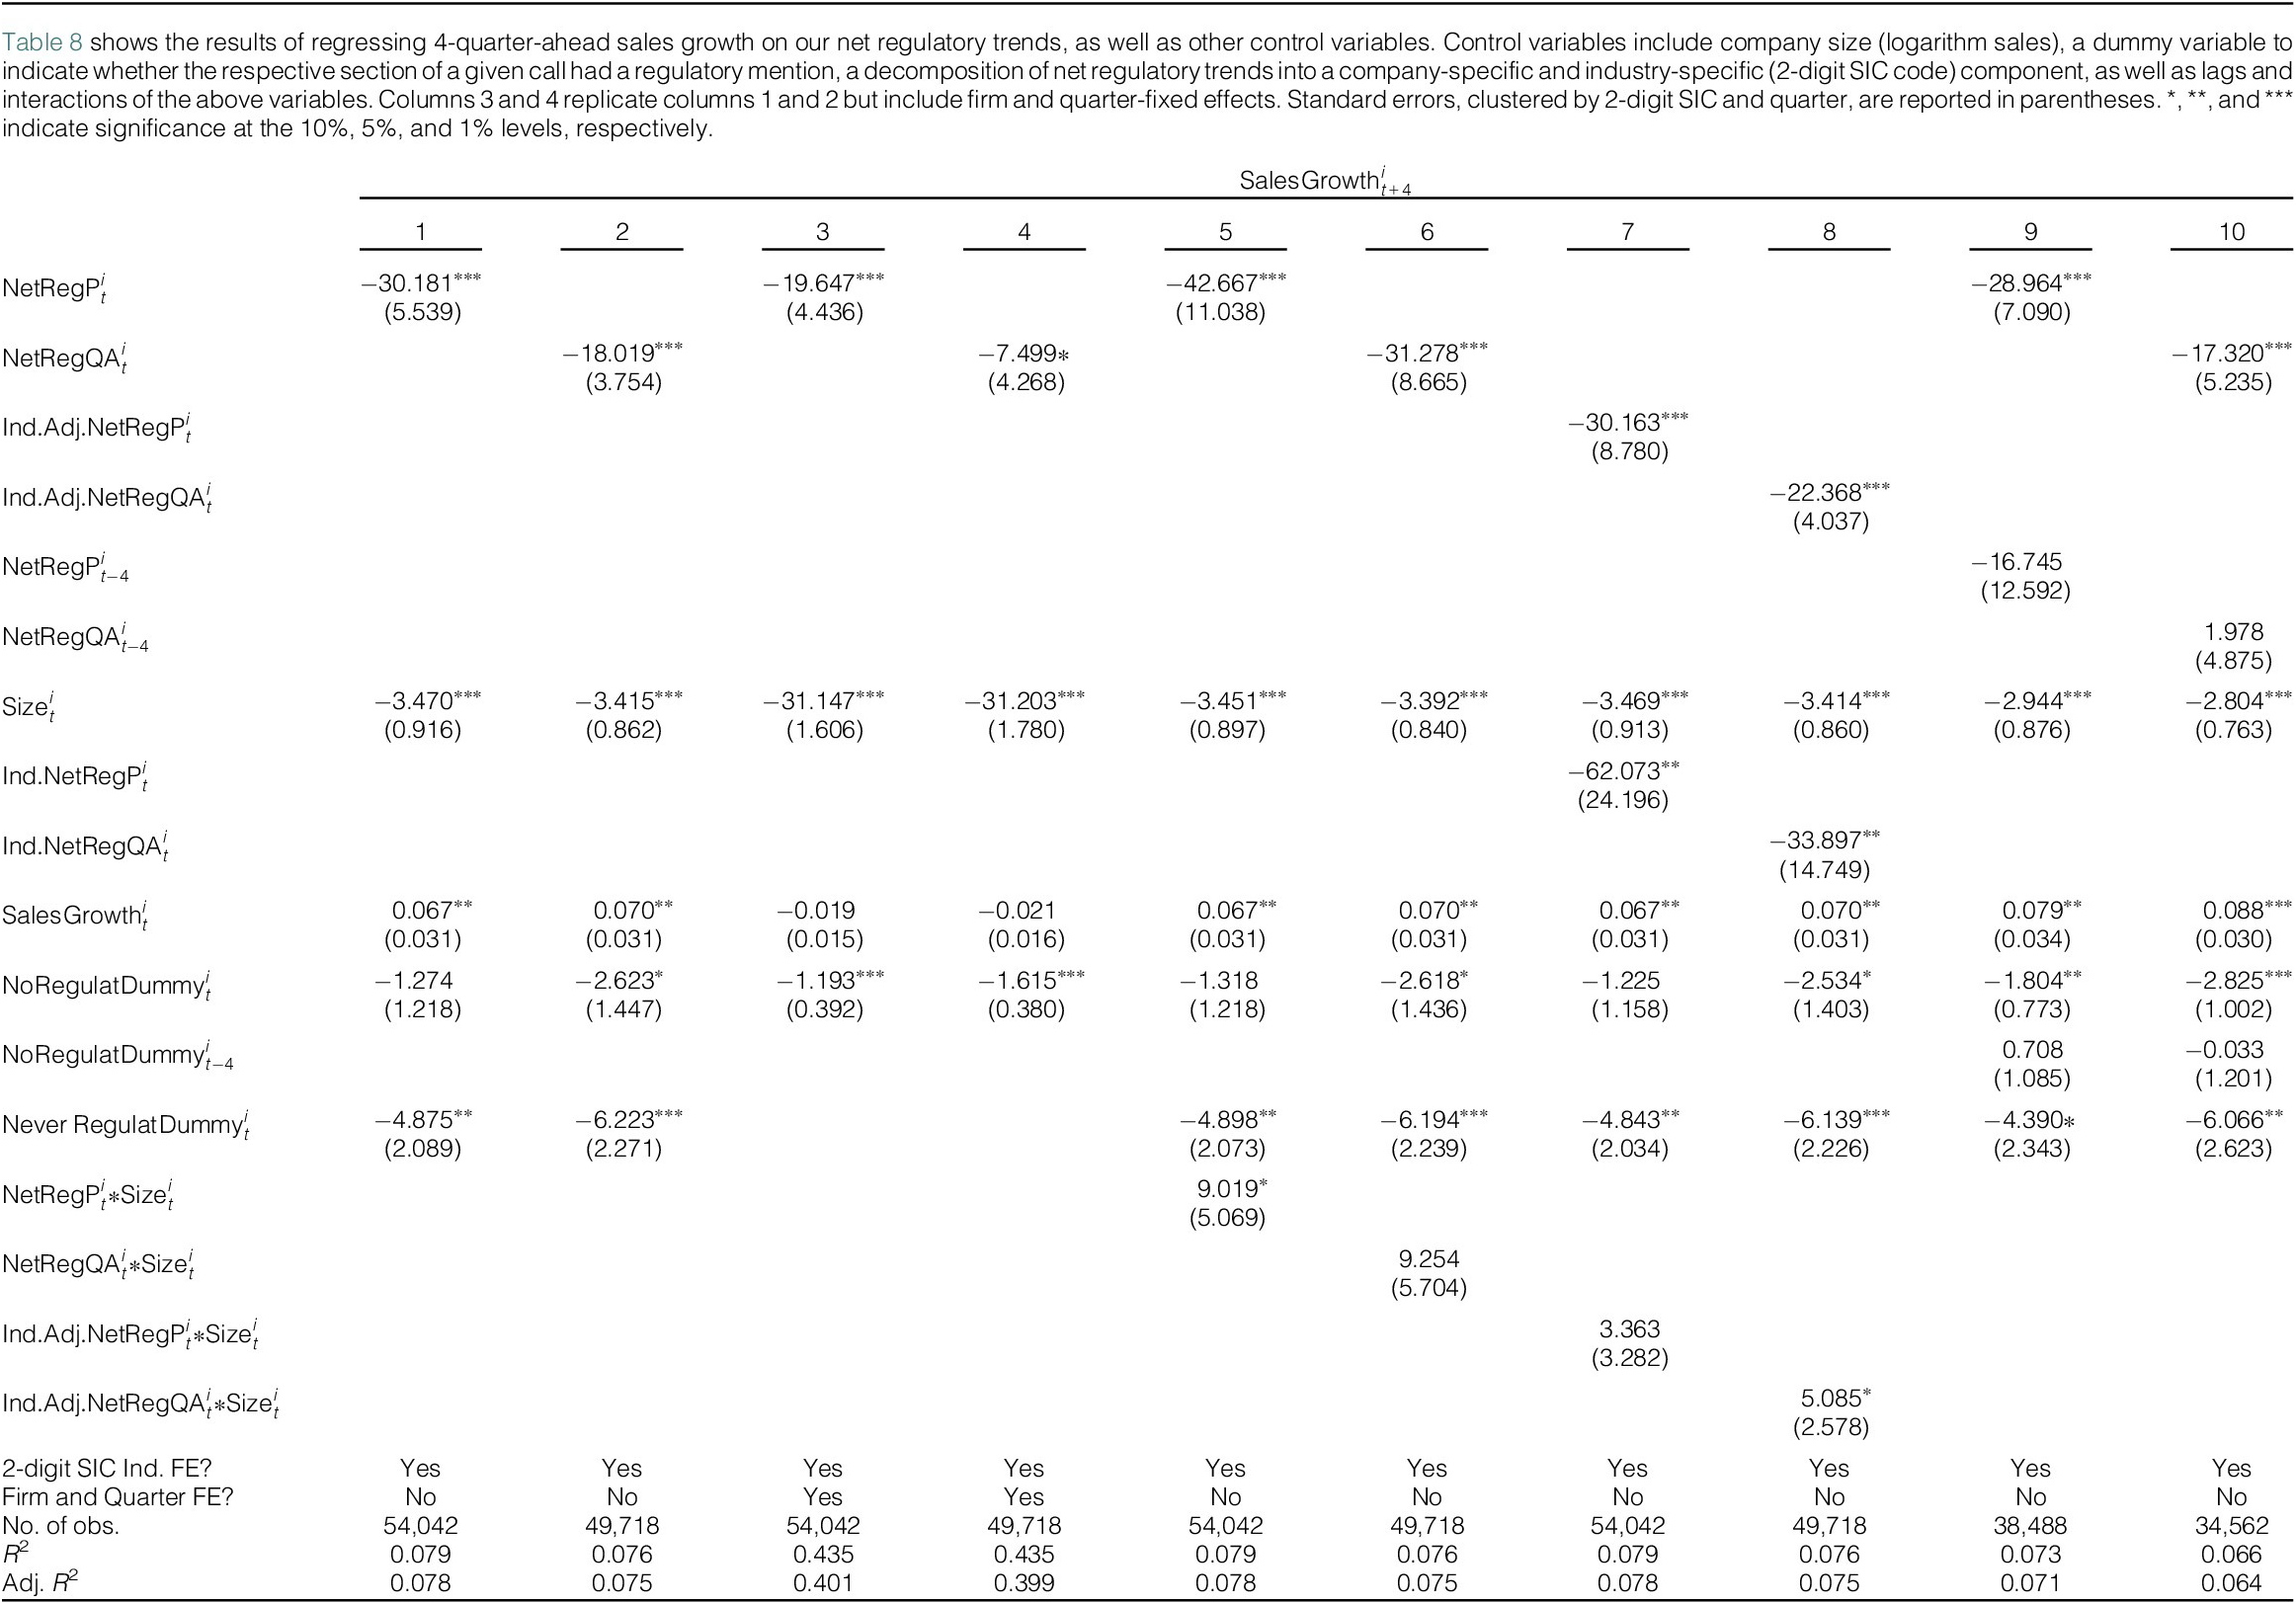
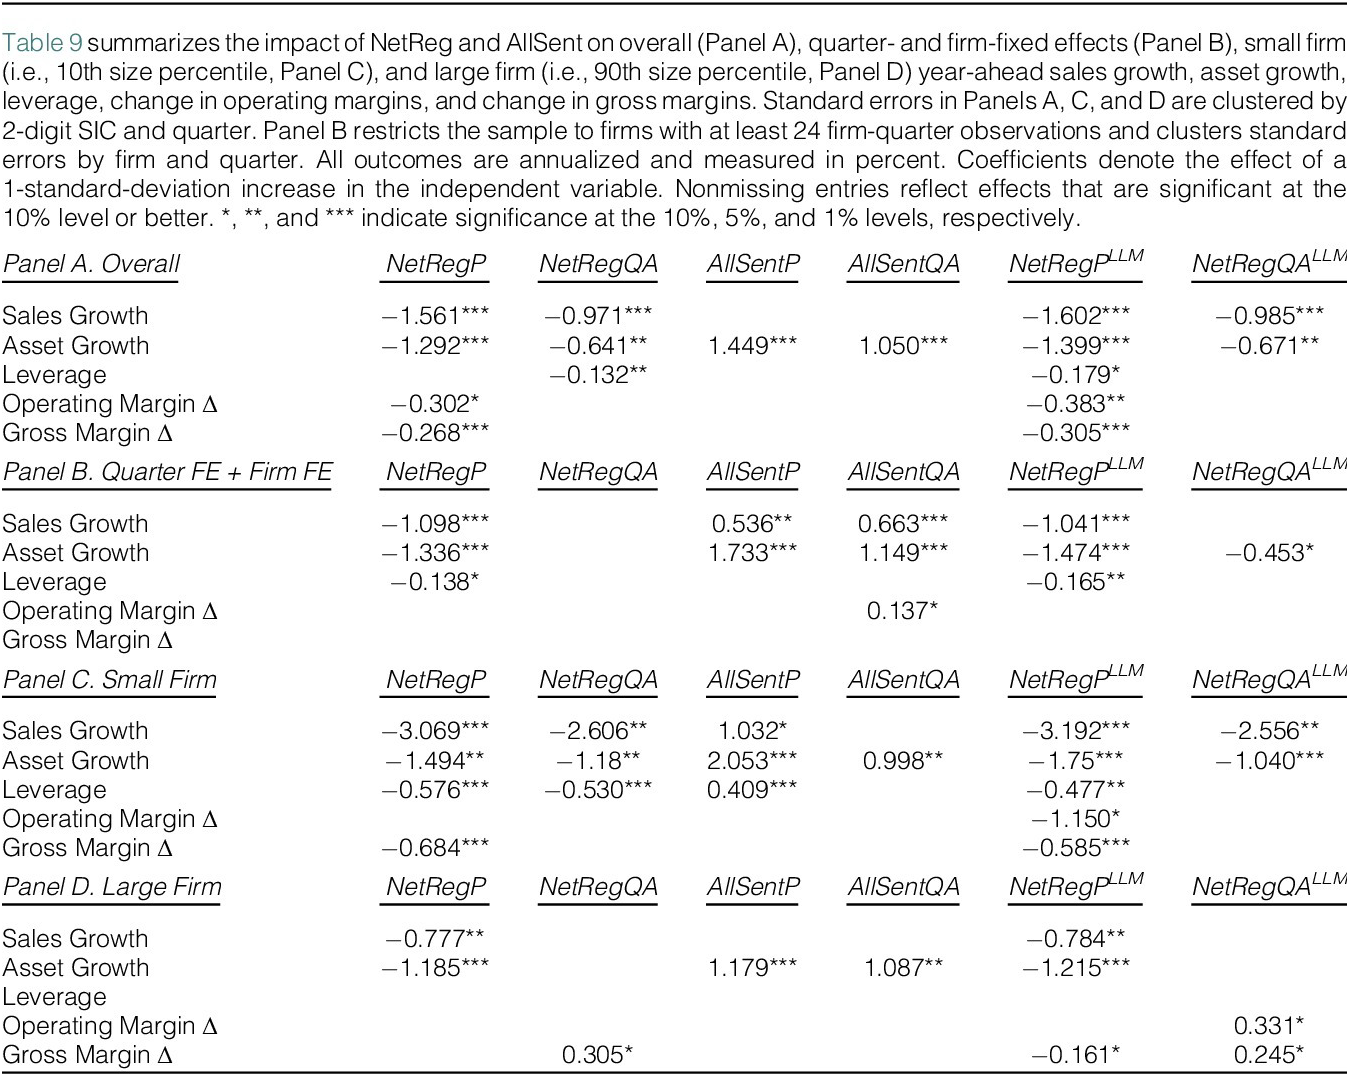
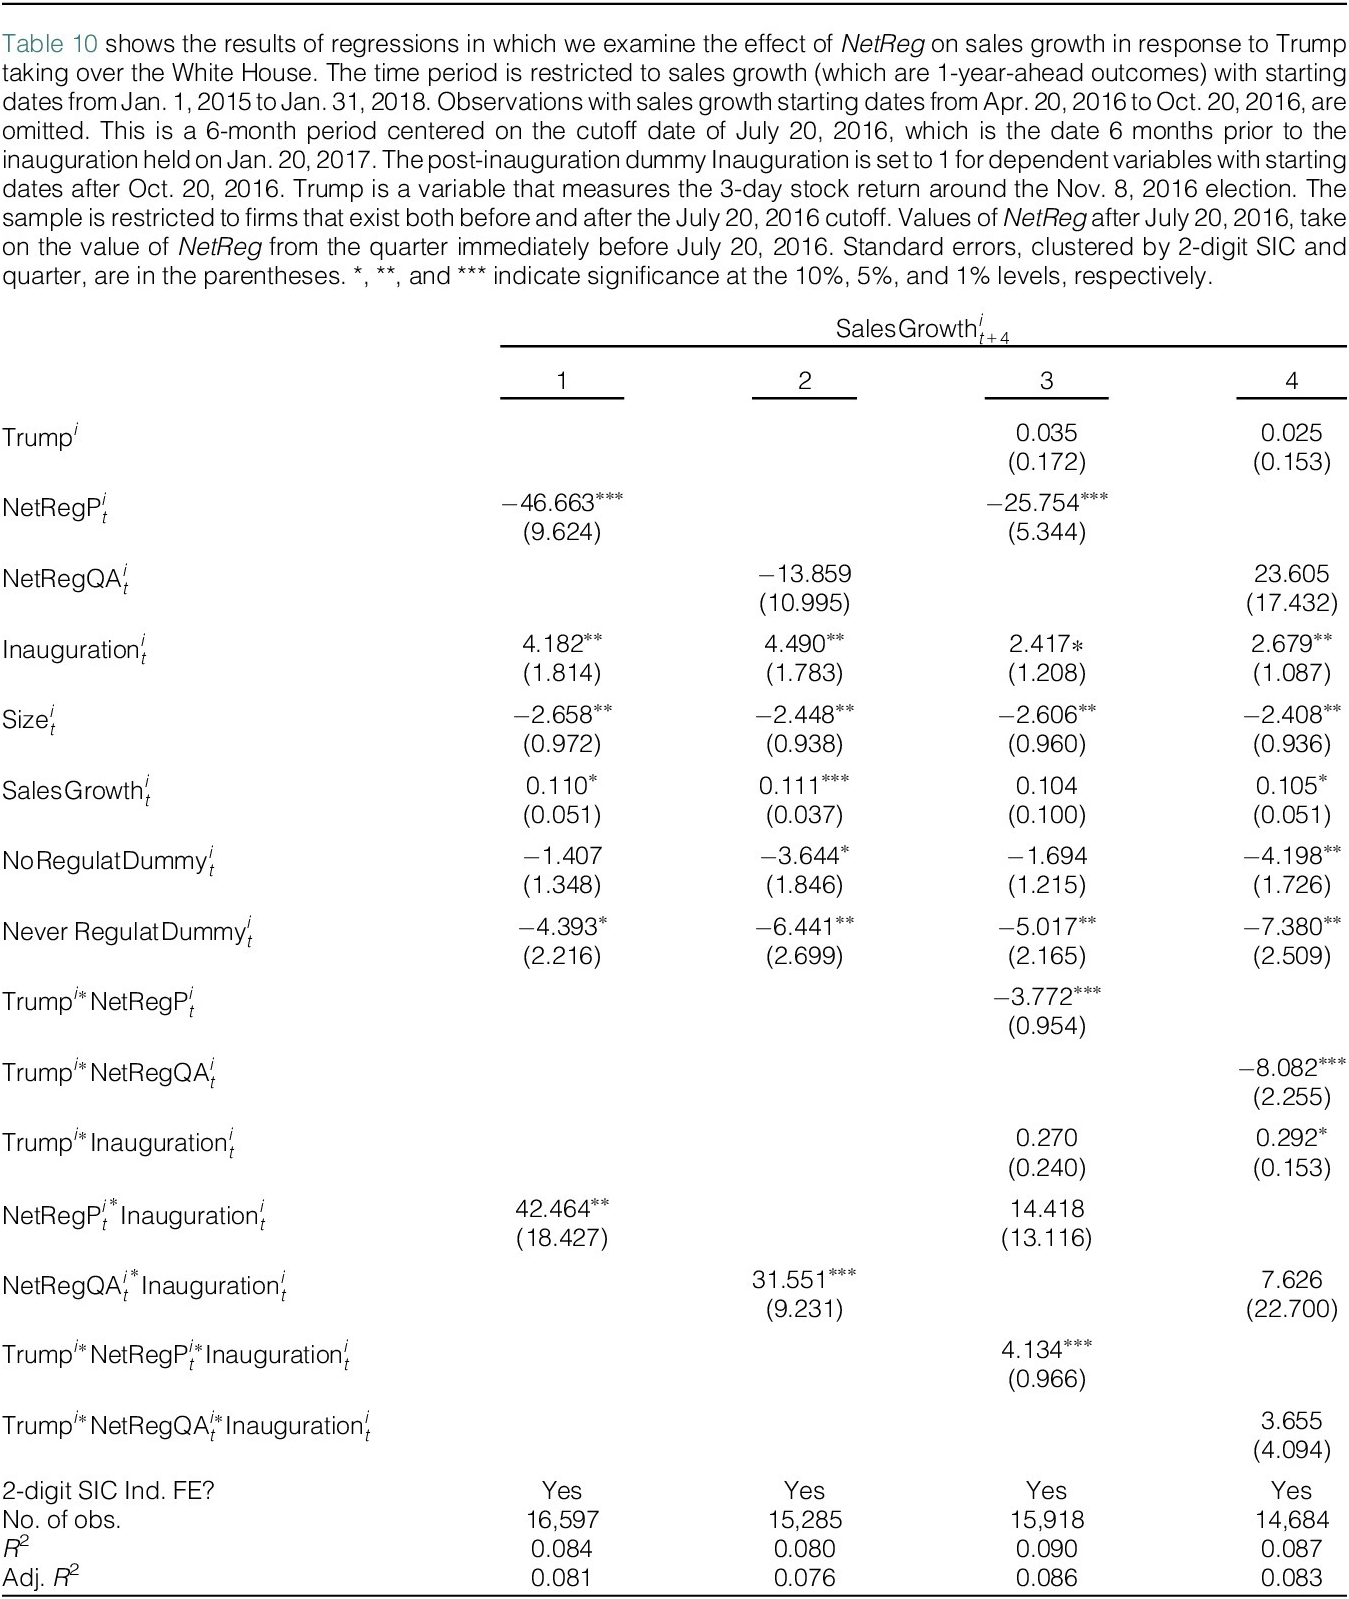
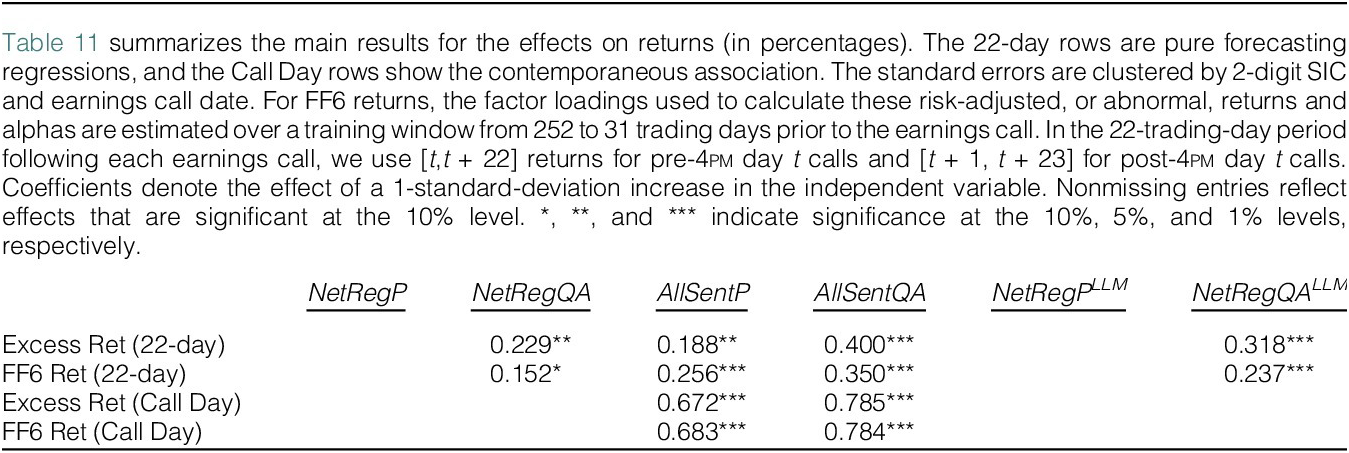
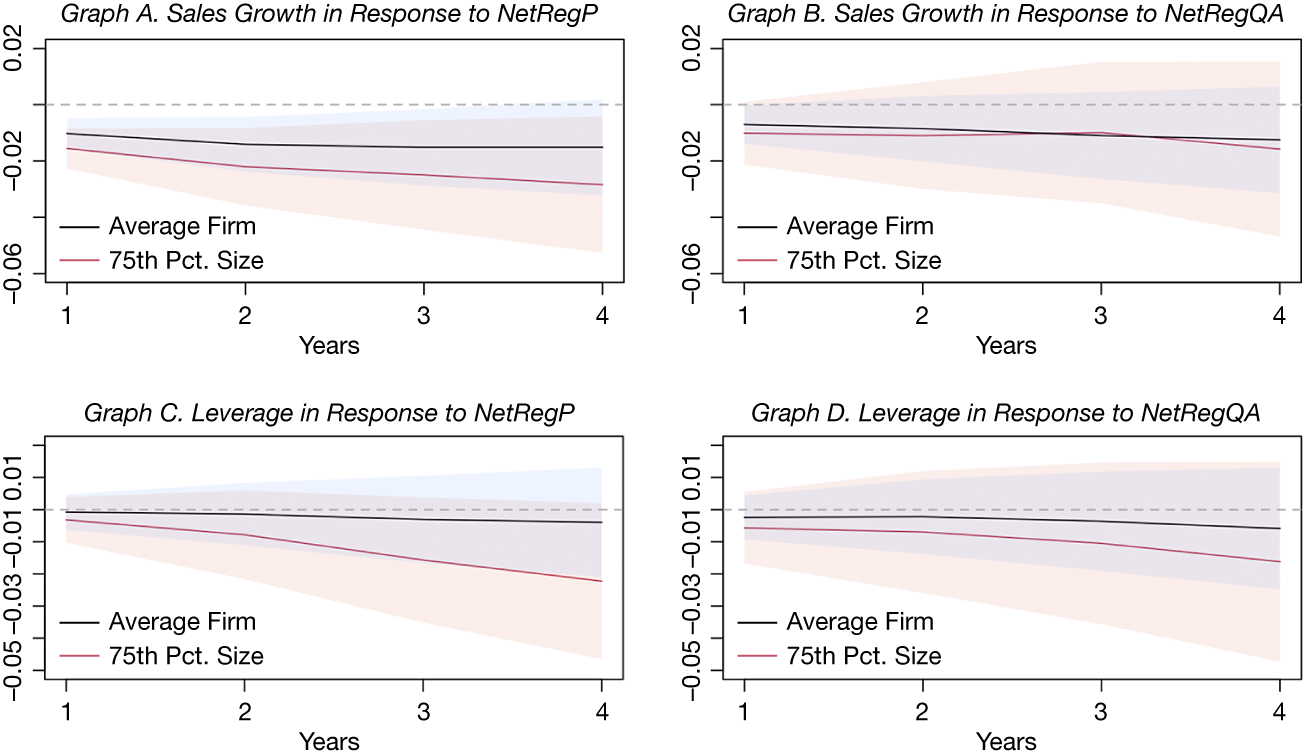


 Open access

