Theories explaining how a local area can structure, catalyze, or inhibit political behavior and attitudes tend to rely on two types of causal stories: either a person has to perceive something about the place in order for it to matter (e.g., community racial composition inspires fear) or something about the place structures action without the need for perception (e.g., lack of public space inhibits interaction). A common approach to studying context is to combine individual level data on behavior or attitudes with administrative data about place (e.g., a census tract, zipcode or city). However, we know people experience these places differently, and we suspect these differences have political consequences.
In this paper, we assess an alternative measure that overcomes this challenge and measures context at the individual level. A recent innovation in measuring perceptions of contextual boundaries and content directly is being used in several research projects (Wong et al. Reference Wong2012)Footnote 1 ; the basic idea is to measure “place” at the individual level, asking respondents to draw a map of their “local community,” rather than using fixed, administrative units.
Survey researchers have long asked people to engage in new tasks; the idea that a stranger would come into your home and ask you to express your opinions using scales was once a very novel thought, requiring adjustment and learning (Groves Reference Groves2011). We see the map drawing task as following the same line of innovation in the measurement of public opinion as pioneered by Gallup and others. This paper investigates the consequences of asking people to do this new task, so we can evaluate and improve efforts to measure context at the individual level.
The validity question is whether hand drawn maps and their descriptions bear some clear relationship with what we think of as a “local community.” The reliability question is whether people can draw and describe similar maps if asked to do so at different points in time. We are also able to add to the conceptual literature on “community” by examining whether it is a tangible construct in the minds of ordinary people, not simply a normative aspiration or motivation.
Data: the Measuring Local Communities Canada survey
We use data from the Measuring Local Communities Canada (MLCC) survey—an online two-wave panel survey of roughly 7800 respondents in English Canada conducted in 2012—based on a convenience sample.Footnote 2 Our respondents’ perceptions of their environments are not meant to be generalizable to the nation, but our measure of context is broadly applicable, as are the questions our measure raises about standard practices of using administrative units as measures of context.
In addition to answering traditional survey questions, our respondents created and referred to a couple of maps. After giving their postal code and checking a Google Map to make sure we had correctly located them, they answered a few questions about their residence. Then, they proceeded to a new map centered again on where they lived and were asked to draw their “local community.” The map-drawing task was one of the first in the survey, so respondents were not primed to think about particular issues by other survey questions. They could zoom in and out, and they could draw any shape(s) they liked.
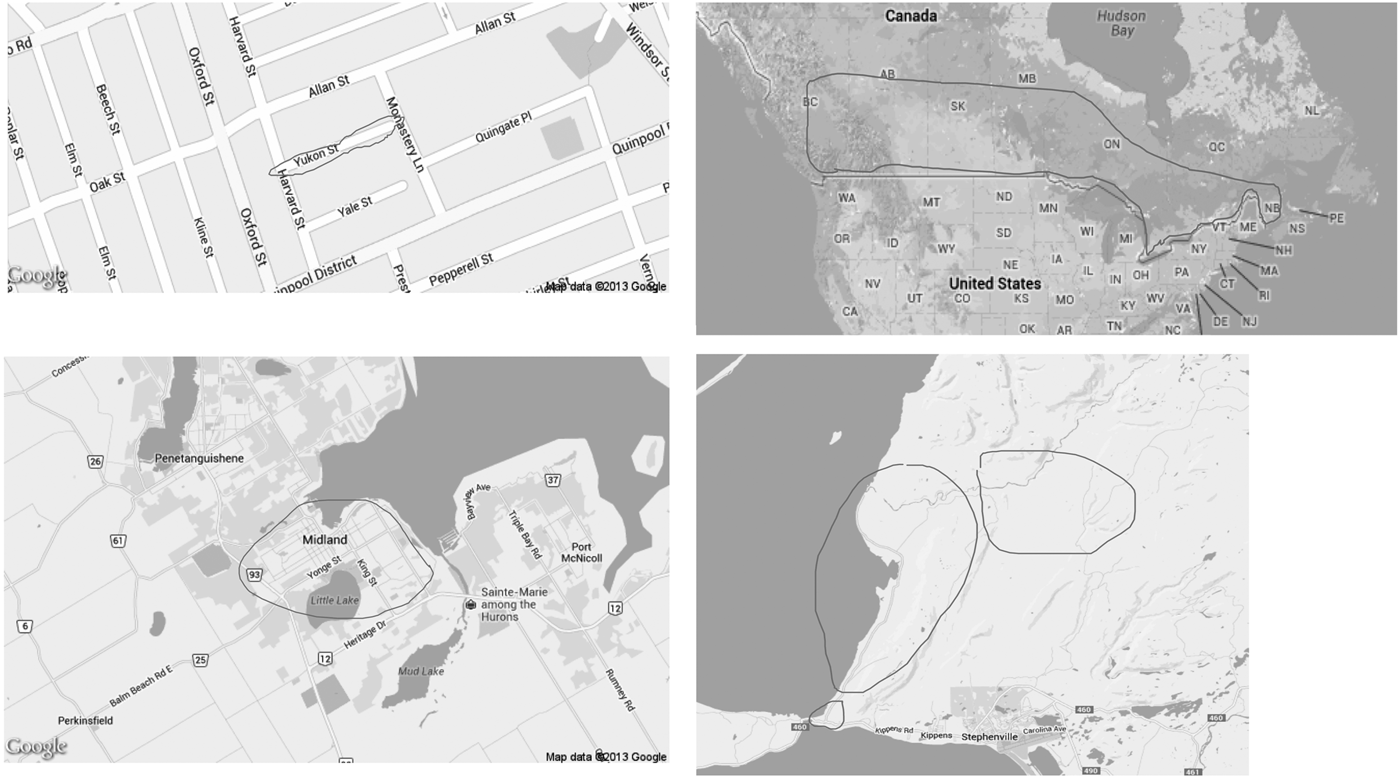
Figure 1 shows four examples of the “local communities” drawn: the top row shows examples of small and large communities, one focusing on a single street and the other containing most of the habitable land of Canada; the bottom left map represents a median size community of 12 km2; and the bottom right is a community composed of multiple polygons. While the distribution in their sizes is unimodal, people’s “local communities” vary a great deal—ranging from a single street to multiple continents—and about 16 percent of the communities drawn were composed of multiple polygons.Footnote 3
Example hand drawn “local communities” from the MLCC Survey 2012. MLCC = Measuring Local Communities Canada.
Validity of the measure: do the maps capture individualized context?
Can we interpret the drawings as telling us something about the boundaries of “local community” as they exist in people’s minds? And, does asking for respondents’ descriptions of their environments give us information above and beyond what Census numbers provide?
Content and convergent validity
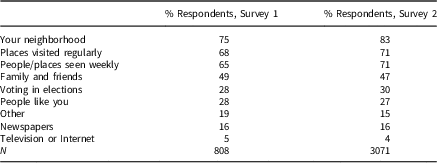
Scholars tend to conceptualize “community” as place, space, and networks of social ties and allegiances. Nevertheless, Hillery (Reference Hillery1955) identified 95 definitions of “community,” and the count can only have increased dramatically over the past half century. We provided no definition of “local community” in the survey, since part of our purpose was to discover its diverse meanings for ordinary people (which may not reflect what social scientists theorize). The instructions did state that there was no right answer and that we had not included a definition because we wanted to know what was important to the respondents. We included a follow-up question for 10 percent of the respondents in the initial survey and for all respondents in wave 2, asking them what they were thinking about as they drew their “local community.” The options were derived from past theoretical and empirical research on community (e.g., Hillery Reference Hillery1955; Keller Reference Keller2003; Wong Reference Wong2010; Agnew Reference Agnew2011). As Table 1 shows, regular contact matters: “neighborhood” was mentioned by 75 percent of respondents, 65 percent answered people or places seen on a weekly basis, and 68 percent chose places visited regularly. Politics was much less salient: only 28 percent mentioned people or places you think about when you go vote.
Considerations During “Local Community” Drawing

Valid measures of individualized context should reveal information about the salient people and places physically near a person. Respondents reported that they were thinking about people with whom they were spatially interdependent, and both frequency of interactions and proximity to one’s home help determine where people draw the boundaries of their communities. These self-reports support the content validity of the map-drawing measure, eliciting the types of responses expected from operationalization of the concept of “local community.”
Convergent validity captures the extent to which variables that theoretically should be related are, in fact, related. For example, one might expect that people who commute greater distances would include their work colleagues in their community and therefore stretch their community boundaries. We also expect that people living in cities would draw smaller communities than individuals living in more rural areas. For example, if one thinks only of neighbors as potential community members, a resident of Toronto could have hundreds of neighbors in her block, whereas a resident of Grise Fiord has about 130 residents in her entire hamlet.
We find evidence of a relationship between commuting distance and community size among our respondents in the workforce: the greater the commuting distance, the larger the drawn community. In a robust regression model using the log of commuting distance as the predictor and the log of map size as the outcome, the coefficient is 0.37 (p<0.05). We also find a negative relationship between population size and community size: the greater the number of residents in a respondent’s Census subdivision (CSD), the smaller the community she draws. The coefficient for the log of CSD population is −0.359 (p<0.00) from a robust regression model.Footnote 4
Community size and commuting distance and population size should be and are related, providing evidence of convergent validity (Campbell and Fiske Reference Campbell and Fiske1959).
Discriminant validity
If the drawings of “local communities” are very sensitive to the conditions under which the task is done, we might worry we are capturing a survey artifact rather than a personally relevant “pseudoenvironment” (Lippmann Reference Lippmann1991; Schwarz and Sudman Reference Schwarz and Sudman1992; Schwarz Reference Schwarz1995). We randomized the zoom-level of the map to assess anchoring effects, and preceded the map with a randomized geographic cue to assess priming effects. A valid measure should show patterns of responsiveness, but it should not completely change the typical map if our measure of local communities has a focal geographic meaning in the minds of the survey respondents.
Anchoring effects
The resolution of the map initially presented to the respondent could influence the size of people’s maps. In other words, a respondent who sees a map encompassing her neighborhood might draw a smaller community than if she had seen a map encompassing her city. If there were large anchoring effects, we would be concerned about both the validity and reliability of the map-drawing measure (Wilson et al. Reference Wilson1996; Furnham and Boo Reference Furnham and Boo2011). To test this possibility, we randomized the resolution of the maps initially presented, ranging from several blocks to an entire metropolitan area. Respondents could zoom in and out using the Google Maps interface, but we chose to limit the resolutions initially presented so that it would be a relatively quick task for respondents to locate their own home on the map.
While there is greater variance in the size of communities drawn for respondents shown maps with the greatest area, there is no consistent effect on the median size of the communities (see Appendix C.1). When we estimate the effect of randomly assigning the map resolution on the area of the “local communities,” the results largely confirm these findings: for three of the five zoom levels, the initial zoom level of the maps people see first has no statistically or substantively significant effect on the size of their “local communities.” Respondents who saw maps at the level of the city did draw maps that were distinct, but the means were only about 5 km2 larger than people shown maps zoomed into the level of the street or buildings. The absence of large anchoring effects provides support in favor of the discriminant validity of the measure (Campbell and Fiske Reference Campbell and Fiske1959), while the pattern of increasing variance is convergent validity evidence.Footnote 5
Priming effects
Social scientists have long been aware that the context of the survey could influence respondents’ judgments and answers (Tourangeau and Rasinski Reference Tourangeau and Rasinski1988; Zaller and Feldman Reference Zaller and Feldman1992). Because researchers cannot always control where in a survey their questions appear, we want to test whether our map-drawing measure is particularly susceptible to primes about geography. Could explicit cues about particular levels of aggregation before the map-drawing measure change the typical size of maps drawn? To assess this possibility, we randomized whether respondents were asked two questions immediately before the map drawing measure. Four-fifths of the respondents were primed to think of one particular context with the following questions: “Thinking about where you live, how close do you feel to your [neighborhood/ city/ province/ Canada]?” And, “If you could improve your work or living conditions, how willing or unwilling would you be to move to another [neighborhood/ city/ province/ Canada]?” A control group received no treatment and proceeded from a question about home ownership directly to the map-drawing.
We find that priming respondents to think of different salient contexts immediately before the map-drawing measure has no substantively large effect on the typical size of maps drawn. The average size of the communities drawn by respondents receiving the “neighborhood” prime is smaller than that of the control, but it is only 1.6 km2 smaller on average. The variance of the map sizes drawn did increase with the size of the geographic cue, providing evidence that the treatment was received (see Appendix C.2).
The fact that the typical size of the maps drawn is not substantively influenced by anchoring or priming effects is evidence in favor of its discriminant validity, while the fact that the variance of the map sizes changes sensibly supports the convergent validity analysis. This is particularly encouraging for its future applications, since researchers cannot always control exactly where a question is placed in a questionnaire.Footnote 6
Content within geographic boundaries: administrative versus individualized context
What people say about their local communities (and about maps shown with fixed bureaucratic units) is not identical to what the Census itself would say about those places. The mapping measure captures something different from what administrative units contain, although, as one might expect, people’s subjective contexts are correlated with their “objective” contexts. We focus on the case of ethnic context here because of the large literature on inter-ethnic conflict in which context plays a major explanatory role.
Measures of objective context
For our objective context measures, we use data from the 2006 Canadian Census. We created measures of ethnic context for five geographic units: the dissemination area (DA), CSD, federal electoral district (FED), forward sortation area (FSA), and provinces/territories in which respondents live. By using these different geographic units, we are able to compare the perceptions of contexts varying in size and political salience. We created an index of the percentage of visible minorities following the Statistics Canada definition (see Appendix D.1).
Measures of subjective context
After respondents drew and described their local community, they answered questions about their perceptions of the relative size of ethnic/racial groups in their community. The list of groups included: Blacks, Canadian Aboriginals, Whites, Chinese, Latin Americans, South Asians (East Indian, Pakistani, Sri Lankan, etc.), and Other Asians (Korean, Japanese, Filipino, etc.) The percentage visible minority in a context was an index adding together responses for Blacks, Chinese, Latin Americans, South Asians, and other Asians. We then showed respondents a map with one of six geographic areas highlighted at random with equal probability: the respondent’s DA, CSD, FSA, FED, province, or Canada as a whole. They were asked to describe the ethnic make-up of this context. Thus, we were able to gauge perceptions of a range of geographic contexts.
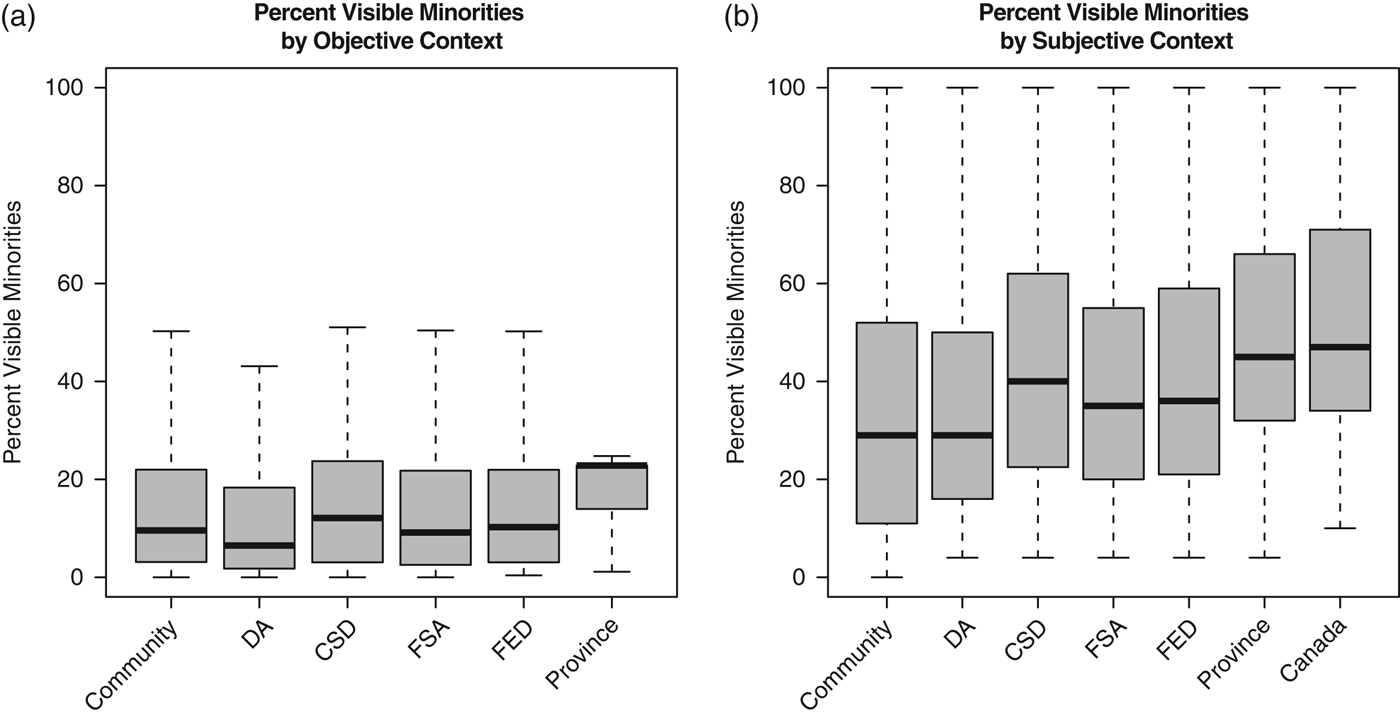
Figure 2(a) shows a boxplot of the percentage of visible minorities as reported by the Census. The median percentage of visible minorities for the contextual units in our survey is 9 percent for respondents’ local communities, 6 percent in DAs, 8 percent in FSAs, 10 percent in CSDs, 10 percent in FEDs, and 23 percent in provinces. In Canada overall, visible minorities make up 16 percent of the population.
Distribution of visible minorities recorded by the Canadian Census 2006 for administrative geographies containing the MLCC respondents and for their self drawn communities (left panel, a). In the right panel (b), the boxplots show the range of perceptions reported by respondents seeing one of the administrative units in which they live and their hand-drawn community. MLCC = Measuring Local Communities Canada.

In contrast, our respondents have different perceptions of the racial/ethnic diversity across the contexts in which they live. Figure 2(a) shows a summary of the distributions of perceptions of visible minorities across the multiple levels of context. The median is 37 percent for their own local communities (labeled “Commmunity” on the plot), 30 percent for DAs, 35 percent for FSAs, 39 percent for CSDs, 35 percent for FEDs, 45 percent for provinces, and 47 percent for Canada; the degree of misperception tends to increase with the size of the contextual unit, regardless of whether one measures misperception using the actual numbers given by respondents or recalculated as a proportion of their overall responses. The ranges (and maxima) for subjective context are also much greater than for objective context.Footnote 7 Respondents are clearly overestimating the percentages of visible minorities at all levels, meaning (1) Census numbers are not good proxies for what people perceive in their contexts, (2) the relationships between contextual predictors and policy preferences could vary a great deal, depending on whether objective or subjective measures are used, and (3) people’s misperceptions of the levels of ethnic diversity in their individually-drawn communities are relatively similar to their misperceptions of diversity in other bureaucratic units. In other words, respondents are not more knowledgeable or accurate about a context they have defined as being personally relevant, relative to other geographic units. Furthermore, the fact respondents describe their “local community” in similarly distorted ways as administrative units in which they live provides more evidence that for ordinary people, “local community” is a tangible space and place (not simply an abstract construct).Footnote 8
Test–retest reliability
The same person asked to draw a map twice might end up drawing communities that differ, not because of changes in the internal understanding of local context, but because new and difficult tasks are likely to produce noisy outcomes. To address this question, we conducted a short follow-up survey 4–5 months later. We showed respondents the same resolution of the map they were initially shown in the first survey and asked them to draw their “local community”: if someone zoomed out from Google resolution 16 to 10 in wave 1 to draw a large community, she would have to do it again in wave 2 in order to draw a similar map. This is a difficult task and a high bar for reliability. While we do not believe anyone will draw an identical map from wave 1 to wave 2, a reliable measure would have communities drawn roughly in the same place and of the same size. After all, if respondents are thinking of people they know or places they see on a regular basis as they are drawing their “local communities,” these should not change dramatically within a few months’ time. However, if the maps are not at all similar, it raises questions about whether the term “local community” is actually substantively meaningful to ordinary people (i.e., it would also impugn the validity of the measure even as it would cast doubt on reliability). Assessing the test–retest reliability in this measure highlighted the novelty of this measurement assessment: a map is a two-dimensional object, and there are many more ways for such objects to differ from each other than there are for one-dimensional objects like scale ratings.
Centroid distance and size of communities
There are multiple ways to determine the reliability of the measure over time. As shown in Table 1, what respondents were thinking about while drawing their communities was very similar at both time 1 and 2. We also looked at whether the community maps drawn at time 1 and 2 overlapped and found that 95 percent did. Of course, even if maps intersect, are they generally centered in the same location? To capture this difference in centers, we measure the distance of the centroids of the polygons drawn. The median distance between centroids of maps drawn between 4 and 5 months apart is 1.3 km, and the mean is 20 km. Although some communities differed by large distances (such as those for five respondents who volunteered that they had moved), thus pulling the mean upwards, half of all maps differed by less than 1.3 km in centroids. To see this kind of difference on a Google Map would require that one be zoomed in to about level 15, where one clearly can see streets. This is a surprisingly reliable method, if test–retest reliability is measured using differences between centroids.
If respondents’ maps in waves 1 and 2 overlap and have relatively similar centroids, they still may differ a great deal in size. We were surprised to find that the median difference in the size of respondents’ communities drawn over the two waves is 0 km2, and the median of the absolute value of the difference is 13 km2. This provides additional evidence that cues from previous questions in the survey and from differences in respondents’ personal experiences between waves do not affect grossly respondents’ local community sizes.
Overlap of maps
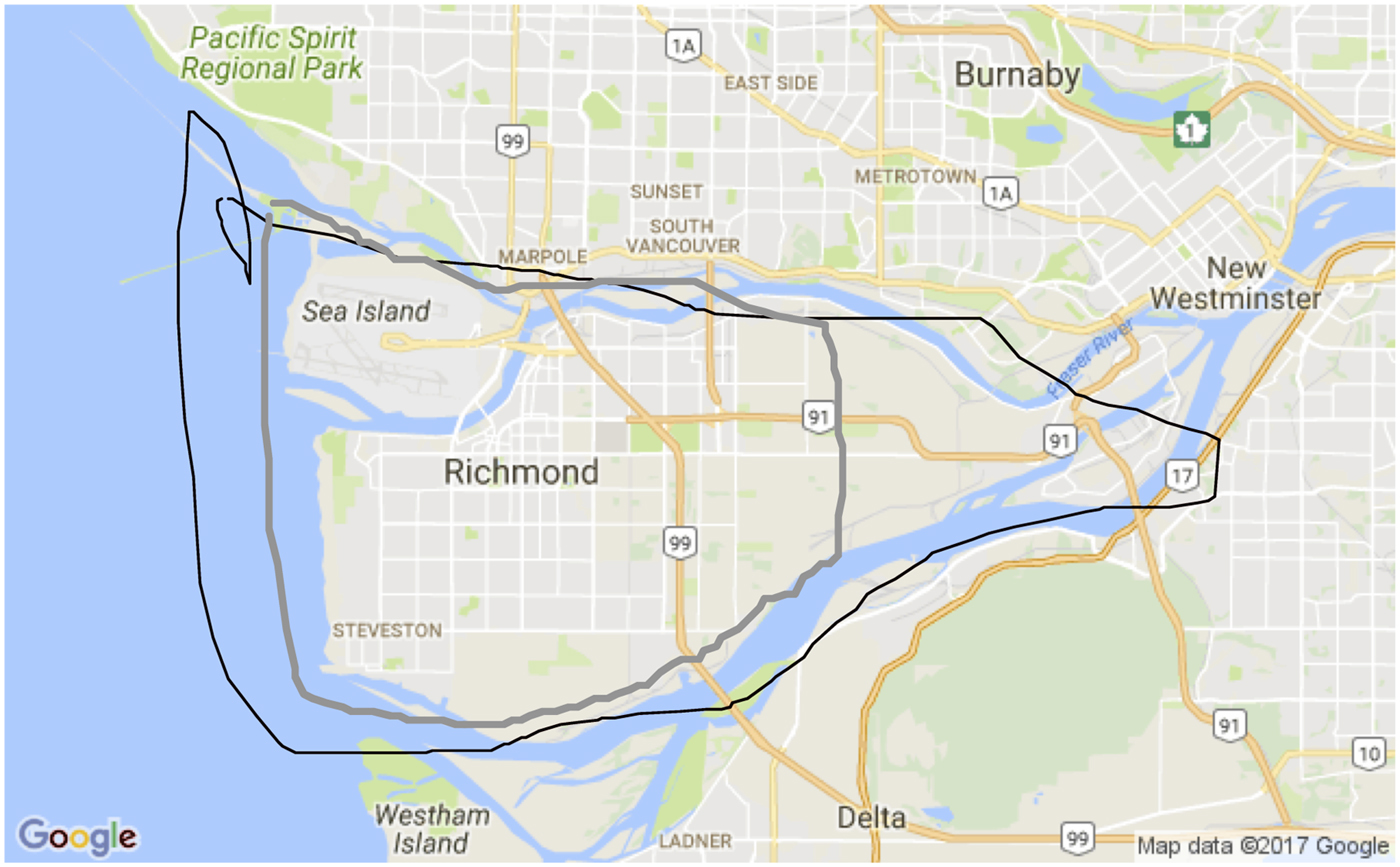
Finally, we looked at the percentage of the communities drawn that overlap. Because these numbers will differ, depending on whether the map drawn in wave 1 or wave 2 is used as the baseline, we calculated the percentages in both ways. The median percent of map 1 that is in map 2 is 66 (mean=60 percent). The median percent of map 2 that is included in map 1 is 68 (mean=60 percent). As an illustration of map overlap, Figure 3 shows an example where 63 percent of the map from wave 1 is in that of wave 2, and 98 percent of the map in wave 2 is in the map of wave 1.
An example of one respondent’s “local communities” drawn in the initial survey (black, larger) and the follow-up (thick gray, slightly smaller).

Overall, the results indicate that the map-drawing measure is surprisingly reliable despite the novel task. The evidence of reliability is important because it confirms the concept “local community” is meaningful to respondents, the task of drawing one’s local community is not so challenging it cannot be replicated, and the measure can capture similar information over time. For its future use as an outcome measure for program evaluation, this evidence is especially promising.
Discussion and conclusion
Ordinary citizens are capable of picturing local contexts, drawing them using a Google Map interface on a computer, and describing them. We show these measures are valid and reliable; the maps drawn are neither non-attitudes nor ephemeral entities. We also show that what people report about their maps does not directly reflect government statistics—at least when it comes to racial/ethnic characteristics—and that researchers can measure ordinary citizens’ perceptions of where they live.
The environments in which people live may affect them in numerous ways. The accuracy of people’s perceptions of the partisanship and unemployment levels where they reside may also vary, and scholars will need to look at how people learn about where they live. Should we think of “context” broadly speaking having an impact on political judgments, or are different facets of it seen and interpreted in a variety of ways? By assessing a novel measure of Lippmann (Reference Lippmann1991)’s public’s “pictures in their heads” focused on the subjective nature of both the boundaries of communities and their content, we hope to support new approaches to studying the mechanisms involved in linking context with racial threat, sociotropic retrospective voting, and partisan sorting, among other important political phenomenon.
Finally, we speculate that these maps may help scholars assess the impact of policy interventions aimed at improving the lives of residents living in a particular locale. For example, does the introduction of ideas of private property change how people see the land where they live? Does a change in policing policies affect how people would draw the area in which they feel safe? Or, does the presence of city bikes expand the meaning of “local,” as they explore new areas in the city where they live with a different mode of transportation? By measuring changes in maps over time, scholars could help policy makers better track the impact of these types of interventions and understand the mechanisms by which context affects attitude and actions.
Acknowledgements
This work was supported by the Social Science and Humanities Research Council of Canada. Thanks also to the Russell Sage Foundation, where Wong was a visiting scholar during the writing of this article.