I. INTRODUCTION
Rise in energy demands and scarcity of fossil fuels have compelled us towards the development of sustainable energy systems and innovation of high energy storage devices.Reference Patrice Simon1 Consequently, there is an urgent demand for efficient energy storage devices, which are of low cost and are environmentally friendly. Among the various energy storage devices, supercapacitors and next-generation batteries have gained considerable attention. Recent developments in the field of supercapacitors have arisen, as they possess attractive properties such as fast charge–discharge periods, wide operational window, and excellent cyclability.Reference Frackowiak2 The prevenient properties make them promising candidates for energy storage applications in various fields viz, portable electronics, regenerative braking systems in hybrid vehicles, and backup power supplies.Reference Salunkhe, Lee, Chang, Li, Simon, Tang, Torad, Hu and Yamauchi3 Ragone plot, which correlates power density and energy density of various energy storage devices, shows that supercapacitors possess higher energy density than traditional capacitors and higher power density than batteries/fuel cells, bridging the gap between a traditional capacitors and batteries.Reference Patrice Simon1,Reference Tang, Jia, Zhai and Xia4–Reference Peng, Peng, Wu and Xie7
Based on the charge storage mechanism in supercapacitors, they can be divided into two classes: electrical double-layer capacitors (EDLCs) that are based on charge separation and accumulation at the electrode/electrolyte interface and pseudocapacitors that rely on fast redox or intercalation reaction of the electrode material.Reference Patrice Simon1,Reference Lang, Hirata, Fujita and Chen6,Reference Liu, Zhang, Wu, Lin, Shen and Lou8–Reference Bao, Zang and Li11 The EDLCs are usually based on porous carbons, hence electrodes possess lower specific capacitance. On the other hand, pseudocapacitors exhibit high specific capacitance (∼1000 F/g), several times higher than the EDLC-type supercapacitors because of higher levels of charge storage occurring from redox reactions, which shows a great interest for future applications.Reference Patrice Simon1,Reference Lang, Hirata, Fujita and Chen6,Reference Bao, Zang and Li11 The specific energy (E) of supercapacitors can be enhanced by increasing the operating voltage window (V) and/or capacitance (C) as E = 1/2CV 2. Supercapacitors have been used with organic and ionic liquids to enhance the energy density by having a high operational window.Reference Demarconnay, Calvo, Timperman, Anouti, Lemordant, Raymundo-Piñero, Arenillas, Menéndez and Béguin12 However, there are challenges regarding safety, toxicity, and flammability of these systems.Reference Liu, Li, Ma and Cheng13,Reference Mohana Reddy, Gowda, Shaijumon and Ajayan14 Aqueous electrolytes have gained attention as they can be used to overcome the prementioned issues in addition to having a faster ion transport and environmental benignity with the downside of lower operational window (∼1 V), which limits the overall energy of the device.Reference Khadke and Krewer15,Reference Xia, Shirley Meng, Yuan, Cui and Lu16 Therefore, the fabrication of asymmetric supercapacitors (ASCs) in aqueous electrolytes is attaining attention due to the extended operating voltage window. To address this issue, asymmetric systems have been developed by implementing two different electrode materials, typically materials which tend to have higher over potential to water splitting reactions to further increase the operational window. Therefore, an asymmetric device configuration with correctly charge-balanced electrodes can provide an advantage of having an extended cell voltage and high specific energy.Reference Wang, Xiao, Hou, Hu, Liu and Wu17
Recently developed pseudocapacitive electrode materials include conductive polymers such as polyaniline and polypyrrole, and nanosized transition metal oxides such as RuO2, Co(OH)2, V2O5, MoO3, etc.Reference Singh and Chandra18–Reference Simotwo and Kalra23 Metal oxides are excellent candidates owing to their high theoretical capacitance, higher over potential to water splitting reactions, low cost, and nature friendliness.Reference Lokhande, Dubal and Joo24–Reference Devan, Patil, Lin and Ma27 However, lower conductivity hinders their application which further undermines their cyclic stability and limits the specific power extracting capability.Reference Zeng, Yu, Meng, Fang, Lu and Tong28,Reference Salunkhe, Tang, Kamachi, Nakato, Kim and Yamauchi29 One of the approaches to boost their conductivity is by embedding them with carbonaceous matrix such as activated carbon, graphene, and CNTs.Reference Frackowiak2,Reference Wang, Zhang and Zhang26,Reference Zhang and Zhao30 These carbon-based composites possess higher electrical conductivity, surface area, and chemical stability, which further enhances energy density. For example, Qu and coworkers fabricated 2D sandwich-like Fe3O4@graphene nanocomposites, wherein the synergistic effect of Fe3O4 and graphene lead to high capacitance and thus high energy density. The Fe3O4 @ graphene nanocomposites exhibited a good cycle life when tested in a three-electrode setup as anode materials. The nanocomposite showed a superior capacitance of around 300 F/g as compared to the capacitance of 150 F/g for the pristine Fe3O4 electrode. In addition, the composite exhibited a long stable cycle life of 1000 cycles and retained around 95% of initial capacitance value. The pristine Fe3O4 electrode showed a capacitance fade of more than 50% of its initial capacitance after 1000 cycles.Reference Qu, Yang and Feng31 Guan et al. showed an increase in capacitance in Fe3O4–CNT composite compared to pure Fe3O4. While CNT/Fe3O4 composite anode showed a capacitance of 117 F/g, pristine Fe3O4 anode exhibited a capacitance of only 86 F/g.Reference Guan, Gao, Yang, Wang, Yuan, Wang, Zhang and Liu32 The above studies purely focused on increasing single electrode capacitance and no full device studies were reported. Bulk of the literature on asymmetric full devices uses activated carbon as the anodes, which limits the overall device energy density. For example, Wang et al. developed an asymmetric device using porous nickel cobalt oxide (NixCo3xO4) nanowire array as the positive electrode and commercially available activated carbon as the negative electrode. The positive electrode (Nix–Co3x–O4 nanowire array) exhibited an individual electrode capacitance of 1479 F/g at a current density of 1 A/g while the activated carbon showed a capacitance of only 186.5 F/g at a current density of 1 A/g, resulting in an overall asymmetric device capacitance of 105 F/g at a current density of 1 mA/cm2, as it is limited by the lower charge-storing electrode.Reference Wang, Yan, Sumboja and Lee33 Moreover, the high capacitance variations between the two electrodes leads to difficulties in charge/mass balancing. Li and coworkers fabricated the Ni3S2@b-NiS core shell structure with single-crystal b-NiS nanorods as the external shell and the hollow-structured Ni3S2 as the porous internal core. The Ni3S2@b-NiS positive electrode exhibited a capacitance of 1158 F/g at a current density of 2 A/g and the negative electrode, activated carbon showed a capacitance of 280 F/g at 2 A/g. The overall asymmetric device showed a device-level capacitance of 133 F/g at a current density of 1 A/g.Reference Li, Wang, Xin, Wu and Lou34 However, the electrodes were fabricated using an extensive hydrothermal route (>25 h). Moreover, heavy nickel foam was used as a substrate for electrode fabrication and the mass of the substrate was neglected for capacitance calculations. Overall, an asymmetric device, developed by combining two different pseudocapacitive materials with high capacitance and/or improved operational window, can significantly boost the energy density of asymmetric devices.
Amongst various metal oxides being investigated as electrode materials, iron oxide (Fe3O4) is nature abundant, possesses large theoretical capacitance, and exhibits a stable and wide operating potential window in anodic range, making them promising electrode materials for ASCs.Reference Tang, Jia, Zhai and Xia4,Reference Zeng, Yu, Meng, Fang, Lu and Tong28,Reference Yang, Ding, Lin, Chen, Li, Qiang, Ebrahimi, Mai, Wong and Wang35–Reference Lu, Zeng, Yu, Zhai, Liang, Xie, Balogun and Tong39 However, like most transition metal oxides, it suffers from low electronic conductivity.Reference Zeng, Yu, Meng, Fang, Lu and Tong28 To address this issue, tremendous effort has been devoted to incorporating iron oxide in a carbonaceous matrix such as graphene, activated carbon, or CNTs.Reference Qu, Yang and Feng31,Reference Xia, Hao, Lei, Wang, Sun and Wang40,Reference Wang, Xu, Yi, Wei, Guo and Wang41 Even though significant efforts have been dedicated to this field, the composites exhibit short cycle life and yield poor performances. This is due to the structural instability of the iron oxides resulting from large volume expansion during electrochemical cycling. This often leads to delamination of this active material from the electrode host surface causing poor rate performance and limited cycling.Reference Zeng, Yu, Meng, Fang, Lu and Tong28,Reference Li, Wang, Zhou, Wang, Ba, Li, Huang and Liu42
In this work, we attempt to resolve the structural instability of iron oxide-based electrodes for superior cycling stability and demonstrate a full ASC device with high energy density and extended cycle life. The iron oxide nanofiber-based anode was fabricated using a simple yet fast process of electrospinning, typically a blend of a carbon precursor and an iron oxide precursor were electrospun followed by pyrolysis treatment (carbonization) to form iron and iron carbide and then subsequent in situ electrochemical conversion to iron oxide. The decomposition process during pyrolysis results in the development of pores within the nanofibers that enable buffering during volume expansion of iron oxides. The continuous fiber morphology with three-dimensional interfiber spacing further facilitates improved contact between electrolyte and iron oxides resulting in lower interfacial resistance. The iron oxide anode delivers a capacitance of 460 F/g at a current density of 1 A/g in 6 M KOH electrolyte in a potential window of 1.3 V. For a full device fabrication, we integrated iron oxide anode with cobalt oxide cathode. Cobalt oxide (Co3O4) was particularly chosen as it has a higher theoretical capacitance, good electrochemical response, wide operational potential window in cathodic range and environmental benignity.Reference Zeng, Yu, Meng, Fang, Lu and Tong28,Reference Li, Wang, Zhou, Wang, Ba, Li, Huang and Liu42,Reference Zhai, Wan, Sun, Chen, Sun, Xia and Xia43 As previously discussed, cobalt oxide suffers from low conductivity; hence, nanostructured cobalt oxide structures were synthesized using a simple chemical route and were mixed with conductive carbon to fabricate the cathode. The charge-balanced asymmetric cell (iron oxide//cobalt oxide) in 6 M KOH developed in this work can be operated in a voltage window of 1.6 V with no gas evolution at the upper potential. This enabled a device-level capacitance of 95 F/g (based on the total weight of both electrodes) at a current density of 0.5 A/g, which corresponds to a device-level energy density of ∼40.53 W h/kg at a power density of 2432 W/kg. Furthermore, the device retained around 75% of its initial capacitance after 12,000 cycles at a current density of 1 A/g.
II. EXPERIMENTAL
A. Materials
Polyacrylonitrile (PAN, Mw = 150,000 g/mol), iron acetylacetonate (purity 97%) and N,N-dimethylformamide (DMF, purity ≥99.8%), potassium hydroxide (reagent grade, 90%, flakes), and cobalt acetate (99.995% trace metals basis) were purchased from Sigma Aldrich (St. Louis, Missouri). All chemicals were used without further processing.
B. Fabrication of the iron oxide anode
The polymer composite solution for electrospinning was prepared by mixing 0.5 g of PAN and 0.5 g of iron acetylacetonate in 4.5 g of DMF solvent. The blend was kept under constant stirring and heating at 60 °C for 10 h to form a homogenous mixture. The mixture was loaded into a Becton Dickinson 5 mL syringe with a Luer lock tip (Becton, Dickinson and Company, Franklin Lakes, New Jersey) and 18-gauge stainless steel needle (Hamilton Corporation, Reno, Nevada). The syringe with the needle was connected to a NE-400 model syringe pump (New Era Pump Systems, Inc., Farmingdale, New York) and the solution flow rate was controlled. The grounded aluminum collector was placed ∼5–6 inches from the tip of the needle. Electrospinning was performed at room temperature with a relative humidity below 15%. A potential difference of 7–8 KV [Series ES (30 KV), Gamma High Voltage Research, Inc., Ormond Beach, Florida] was applied between the collector and the tip of the needle. The flow rate of the solution was kept constant at 0.2 mL/h. The as-spun nanofibers were collected and stabilized in a convection oven at 280 °C for 6 h in air. Finally, these stabilized nanofiber mats were carbonized at 1000 °C for 1 h with a heating ramp rate of 1 °C/min under a constant flow of nitrogen gas to synthesize iron/iron carbide–carbon nanofibers (Fe–CNFs). The fiber mat is then cut using a 13-mm hole punch and electrochemically cycled [cyclic voltammetry (CV)] to undergo in situ conversion of iron/iron carbide to iron oxide during first 35 electrochemical cycles in a three-electrode setup in 6 M KOH electrolyte to form iron oxide-based CNFs (FeOx–CNFs). The obtained FeOx–CNFs are binder free and free standing and were used as-is in the device.
C. Fabrication of the cobalt oxide nanopowder cathode
Cobalt oxide nanopowder was synthesized using a simple chemical route. Typically, 40 mL of 2 M KOH solution was mixed with 40 mL of 1 M cobalt acetate slowly over a period of 0.5 h under constant stirring at 400 rpm to obtain a homogeneous solution. This homogeneous solution was then kept undisturbed for 2 h for the precipitation of cobalt hydroxide. The solution was then filtered through a Whatman filter paper using vacuum filtration. This cake was washed with DI water several times till the pH of the cake was 7. The cake was then dried in an oven to remove the moisture at 60° for 2 h, crushed into fine powder using mortar and pestle and then oxidized in tube furnace at 500° for 6 h at a ramp rate of 1 °C/min under constant flow of air to get cobalt oxide nanopowder (CoOx–NP).
A suspension (slurry) of the electrode material was prepared by mixing the cobalt oxide nanopowder, carbon black, and polytetrafluoroethylene in a mass ratio of 90:5:5 in acetone. The suspension was ultrasonicated (Cole-Parmer ultrasonic bath 1510) at 30 kHz at 50% power. The slurry was then allowed to stir overnight at 50 °C. The slurry was accurately weighed, drop casted on the graphite current collector and was spread evenly to form a thin uniform layer. The electrode was then dried in the convection oven at 60 °C for 1 h till a thin conformal layer was observed.
D. Materials characterization
Morphological and elemental characterizations of nanofibers were carried out using a scanning electron microscope (Zeiss Supra 50VP, ZEISS, Thornwood, New York) equipped with an energy dispersive X-ray spectrometer. The average size of the nanofibers and nanoparticles was determined using ImageJ software (National Institutes of Health, Bethesda, Maryland). The phase formation of the materials was characterized using a Rigaku Smart Lab X-ray diffractometer in Bragg–Brentano mode (Cu Kα as incident radiation with λ = 0.1540598 nm) operated at a voltage of 40 KV and a current of 40 mA (Rigaku Corp., Tokyo, Japan). The surface chemistry of the sample was analyzed using X-ray photoelectron spectroscopy (Physical Electronics Versa Probe 5000 spectrometer with monochromatic Al Kα as an excitation source, Physical Electronics, Inc., Chanhassen, Minnesota). All the XPS spectra were analyzed and deconvoluted using CASA XPS software (Casa Software Ltd., Teignmouth, United Kingdom). The surface area of the FeOx–CNFs was characterized using nitrogen adsorption-desorption isotherm. The samples were degassed at 196 °C under vacuum for 24 h to remove the moisture prior to the adsorption–desorption measurements.
E. Electrochemical tests
Electrochemical measurements were performed in both three-electrode (half-cell) and two-electrode (full-cell) configurations using a 1/2-inch T-type Swagelok pipe fitting and a 1/2-inch 2-way pipe fitting, respectively. The electrochemical performance of the cells was characterized by CV, galvanostatic charge–discharge (CD) tests, and electrochemical impedance spectroscopy (EIS) using a Gamry reference 3000 potentiostat electrochemical workstation (Gamry Instruments, Inc., Warminster, Pennsylvania). For the three-electrode cell measurements of the FeOx–CNFs and CoOx–NP, we used a nickel mesh counter electrode and a saturated Ag/AgCl reference electrode. The electrolyte used was aqueous 6 M KOH. For all two-electrode cell measurements, the full-cell device was assembled with FeOx–CNFs as the negative freestanding electrode, slurry pasted CoOx–NP on the current collector as the positive electrode, Celgard 3305 as the separator, 1/2-inch graphite rods as the current collectors, and 6 M KOH aqueous solution as the electrolyte. The electrodes were 13 mm in diameter and the overall weights of the composites (carbon, oxides, and binder, if applicable) were considered for electrochemical measurements. Before performing electrochemical measurements, the separator was soaked overnight in the electrolyte. Stability/cycling tests were carried out at room temperature at a current density of 1 A/g over the potential range of 0–1.6 V for the two-electrode configuration. For EIS measurements, we used an AC perturbation of 10 mV at frequencies of 100 kHz to 0.01 Hz.
The specific capacitances (C s) were calculated from the CV curves according to the following equation:
 $${C_{\rm{s}}} = {{\int {I{\rm{d}}v} } \over {2vmV}}\quad ,$$
where C s, v, I, m, and V represent the capacitance (F/g), the scan rate, the current (A), the total mass of one electrode (g), and the voltage window (V), respectively. Similarly, the SC was obtained from CD curves using Expression 2.
 $${C_{\rm{s}}} = {{It} \over {mV}}\quad ,$$
where C s is the specific capacity (F/g) of a single electrode or cell, I is the CD current (A), t is the discharge time (s), m represents the total mass of the electrode (g), and V indicates the potential window. The optimal mass ratio required for charge balancing the two electrodes was estimated using the following equation:
 $${{{m^ + }} \over {{m^ - }}} = {{\left( {\Delta {V^ - }} \right){C^ - }} \over {\left( {\Delta {V^ + }} \right){C^ + }}}\quad ,$$
where C − and C + are the capacitances (in F/g) measured at the same scan rate (20 mV/s), using the three-electrode system, for negative and positive electrodes, respectively. While ΔV + and ΔV − denote the working potential window for the positive and negative electrodes, respectively. The required mass ratio for positive and negative electrode material (m +/m −) was thus estimated as 5.2 at 20 mV/s.
The total weight of both the electrodes was considered for the full-cell performance calculations. The calculation of specific energy and power is based on the following equations:
 $$E = {1 \over 2}{C_{\rm{s}}} \times {V^2}\quad ,$$
 $$P = {E / {\Delta t}}\quad ,$$
where E, C s, V, P, and t stand for specific energy (mass normalized energy), specific capacitance, discharging voltage window excluding ohmic drop, specific power released, and the discharge time, respectively.
III. RESULTS AND DISCUSSION
A. Structural and spectroscopic characterization of FeOx–CNFs
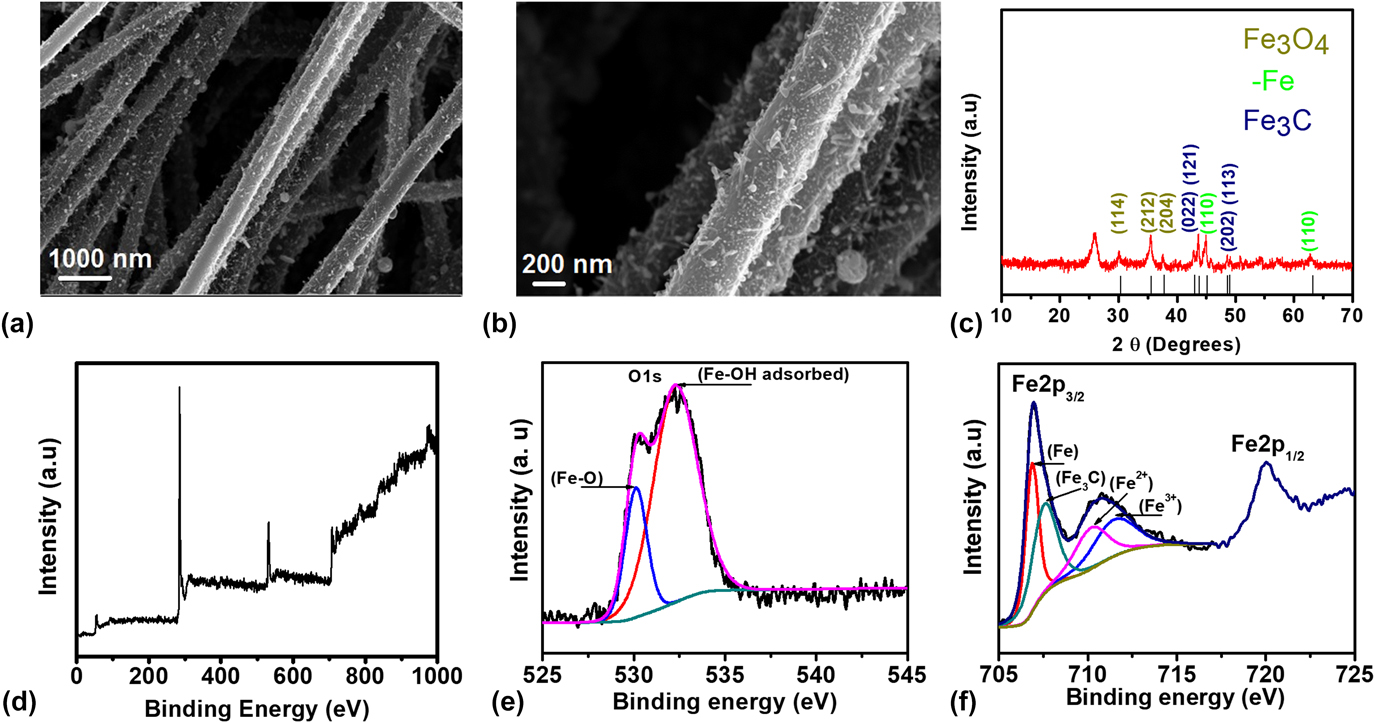
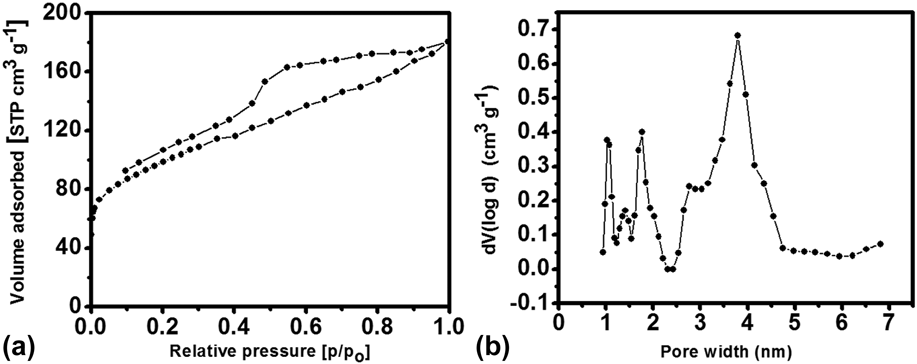
The iron/iron carbide-based nanofibers were first fabricated using a simple method of electrospinning followed by stabilization in air at 280 °C and then carbonization in inert environment at 1000 °C to get iron and iron carbide-based CNFs (Fe–CNFs). Furthermore, Fe–CNFs were electrochemically converted to iron oxide-based CNFs (FeOx–CNFs) by cycling in 6 M KOH electrolyte. Figures 1(a) and 1(b) show the scanning electron microscopy (SEM) images demonstrating the morphology of the FeOx–CNFs. Iron oxide nanoparticles with the size range of 5–20 nm can be observed throughout the surface of the nanofibers. The SEM images further show good porosity on the surface and interconnectivity between the fibers. To quantify the porosity, BET surface area analysis was conducted (Fig. 2). The FeOx–CNFs exhibit a surface area of 336 m2/g and show the presence of multimodal porous structure in both meso- and micropore range. This multiporous structure is expected to facilitate good ion transport for pseudocapacitive storage as well as a reasonable surface area for additional charge storage via the electric double-layer mechanism.
(a, b) SEM images of FeOx–CNFs; (c) XRD pattern of FeOx–CNFs; (d) overall XPS spectra; (e) O 1s core level spectra; and (f) Fe 2p core level spectra of FeOx–CNFs.

(a) N2 isotherm of Fe–CNFs; (b) pore size distribution of FeOx–CNFs.

The crystallographic phase was determined by XRD [Fig. 1(c)], which shows the presence of pure Fe3O4 in addition to unconverted iron carbide and pure iron present prior to electrochemical conversion. The strong diffraction peaks in the pattern at 30.0°, 36.16°, and 38.30° could be indexed to (114), (212), and (204) planes, respectively, of Fe3O4 (JCPDS card 01-075-0449). The peaks at 44.60° and 65.00° are associated to the planes (110) and (200) of α-Fe (JCPDS card 03-065-4899).Reference Ujimine and Tsutsumi44 The XRD pattern shows peaks at 2θ = 37.65°, 37.77°, 42.90°, 43.75°, 45.01°, and 51.84° correspond to the planes (112), (021), (121), (210), (103), and (212), respectively, for Fe3C according to JCPDS card 98-000-0170.Reference Zhai, Wan, Sun, Chen, Sun, Xia and Xia43 The FeOx–CNFs were further characterized by XPS. The Fe 2p spectrum [Fig. 1(e)] for the sample exhibited a doublet with Fe 2p 3/2 and Fe 2p 1/2 peaks located at ∼711.2 and 724.7 eV, respectively. Furthermore, the Fe 2p 3/2 peak is comprised of four deconvoluted peaks appearing at ∼707, 708.2, 710.3, and 711.5 eV, which are associated with α-Fe, Fe3C, Fe2+, and Fe3+, respectively.Reference Bonnet, Ropital, Lecour, Espinat, Huiban, Gengembre, Berthier and Marcus45 The presence of Fe3+ and Fe2+ in this spectrum indicated the presence of mixed oxidation states for Fe. The absence of shakeup peak at 719 eV, which is a significant characteristic of Fe2O3, confirmed the presence of Fe3O4.Reference Grosvenor, Kobe and McIntyre46,Reference Allen, Curtis, Hooper and Tucker47 The deconvolution of O 1s spectrum [Fig. 1(f)] resulted in two strong peaks at 530.4 and 532.6 eV. The peak at 530.4 eV is associated to lattice O2− from Fe3O4 (Fe–O–Fe) and the peak at 532.6 eV is associated to the hydroxyl group (Fe–O–H adsorbed) and water present on the oxide surface due to adsorption.Reference Jia, Luo, Yu, Sun, Liu and Huang48,Reference Baltrusaitis, Cwiertny and Grassian49 Both XRD and XPS confirmed the presence of iron oxide (Fe3O4) in the FeOx–CNF sample.
B. Electrochemical performance of FeOx–CNFs
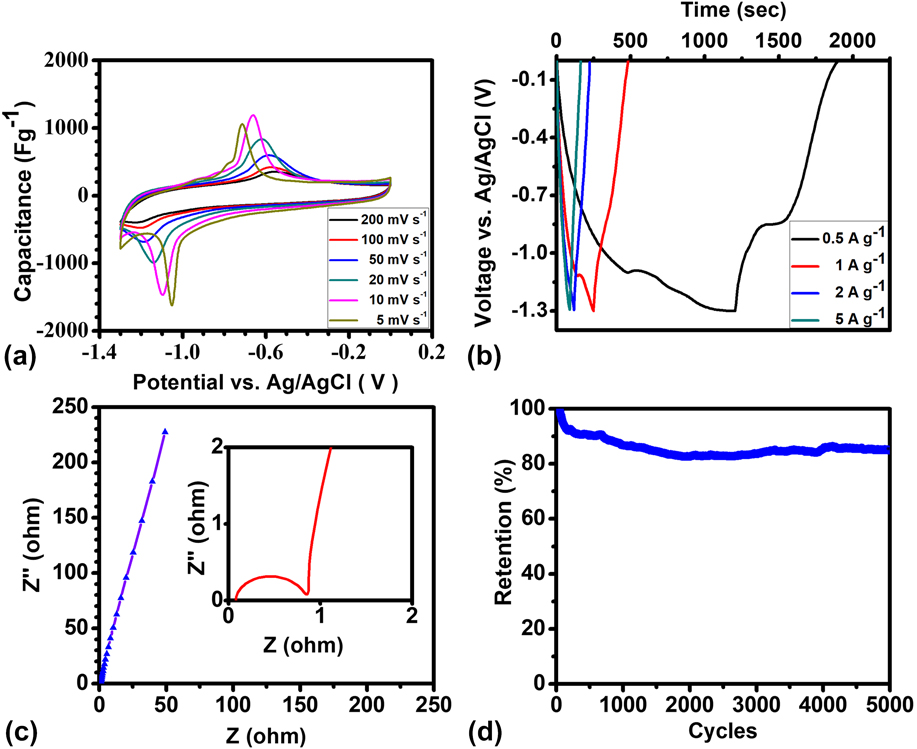
The electrochemical performance of the FeOx–CNFs was studied using CV, galvanostatic CD, and EIS. The tests were carried out in a three-electrode setup with FeOx–CNFs as the working electrode (1.5 mg), nickel foam as the counter electrode, and Ag/AgCl as the reference electrode in 6 M KOH electrolyte. Figure 3(a) displays the cyclic voltammograms of the FeOx–CNFs at various scan rates ranging from 5 to 200 mV/s in a voltage window of 0 to −1.3 V versus Ag/AgCl. We can see two strong peaks contributed by redox reaction at −0.7 and −1.3 V versus Ag/AgCl. Additionally, CV exhibits a wide rectangular behavior possibly originating from the porous structure of FeOx–CNFs, which contributes to the EDLC. CV exhibits well-defined symmetric peaks attributed to the reversible redox conversion of Fe3O4 and Fe(OH)2 as per the following reactionReference Ujimine and Tsutsumi44:
 $$3{\rm{Fe}}{\left( {{\rm{OH}}} \right)_2} + 2{\rm{O}}{{\rm{H}}^ - } \mathbin{\lower.3ex\hbox{$\buildrel\textstyle\leftarrow\vskip 1pt\over{\smash{\rightarrow}\vphantom{_{\vbox to.5ex{\vss}}}}$}} {\rm{F}}{{\rm{e}}_3}{{\rm{O}}_4} + 4{{\rm{H}}_2}{\rm{O}} + 2{{\rm{e}}^ - }\quad .$$
(a) Cyclic voltammetry curves of FeOx–CNFs at various scan rates; (b) galvanostatic CD curves at various current densities; (c) Nyquist plot; and (d) cycling stability of FeOx–CNFs at 1 A/g.

The presence of synergistic effect between conducting porous CNFs (double layer, nonfaradaic) and iron oxide (faradaic) possibly contributes to improved redox kinetics and better accessibility of the electrolyte ions. A specific capacitance of 325 F/g was achieved for FeOx–CNFs at 20 mV/s. The symmetric CV curves of FeOx–CNFs indicate reversibility in charge storage and redox reactions. The specific capacitance values from the CV curves were found to be ∼357, 343, 324, 279, 235, 193, and 175 F/g at scan rates of 5, 10, 20, 50, 100, 150, and 200 mV/s, respectively. Furthermore, galvanostatic CD measurements [Fig. 3(b)] were carried out for FeOx–CNFs at various current densities from 1 to 10 A/g in a potential window of −1.3 to 0 V (versus Ag/AgCl). The nonlinear behavior accompanied by plateau regions observed during charging (at potential −1.1 V) and discharging (at potential −0.7 V) versus Ag/AgCl is in good agreement with the CV results and are further corroborating the presence of faradaic capacitance along with double-layer capacitance. FeOx–CNFs achieved a maximum specific capacitance of 460 F/g at a current density of 1 A/g. The capacitance decreased to 171 F/g at 10 A/g as expected due to diffusion limitation and underutilization of the active material at higher specific currents. The typical Nyquist plots observed for the FeOx–CNF system [Fig. 3(c)] exhibited a semicircle in the high frequency region and a vertical line (close to 90°) in the low frequency region. The diameter of high frequency semicircle (∼0.8 Ω) represents charge-transfer resistance at the electrode/electrolyte interface. The small charge-transfer resistance observed for FeOx–CNFs could be attributed to the good electrical connectivity arising from binder-free electrodes, ease of electrolyte accessibility, and a large electrode/electrolyte contact region. Furthermore, the low frequency vertical line indicates near ideal capacitive behavior. The electrode retains 82% of its initial capacitance [Fig. 3(d)] when cycled at 1 A/g for 5000 cycles.
C. Characterization of cobalt oxide nanopowder
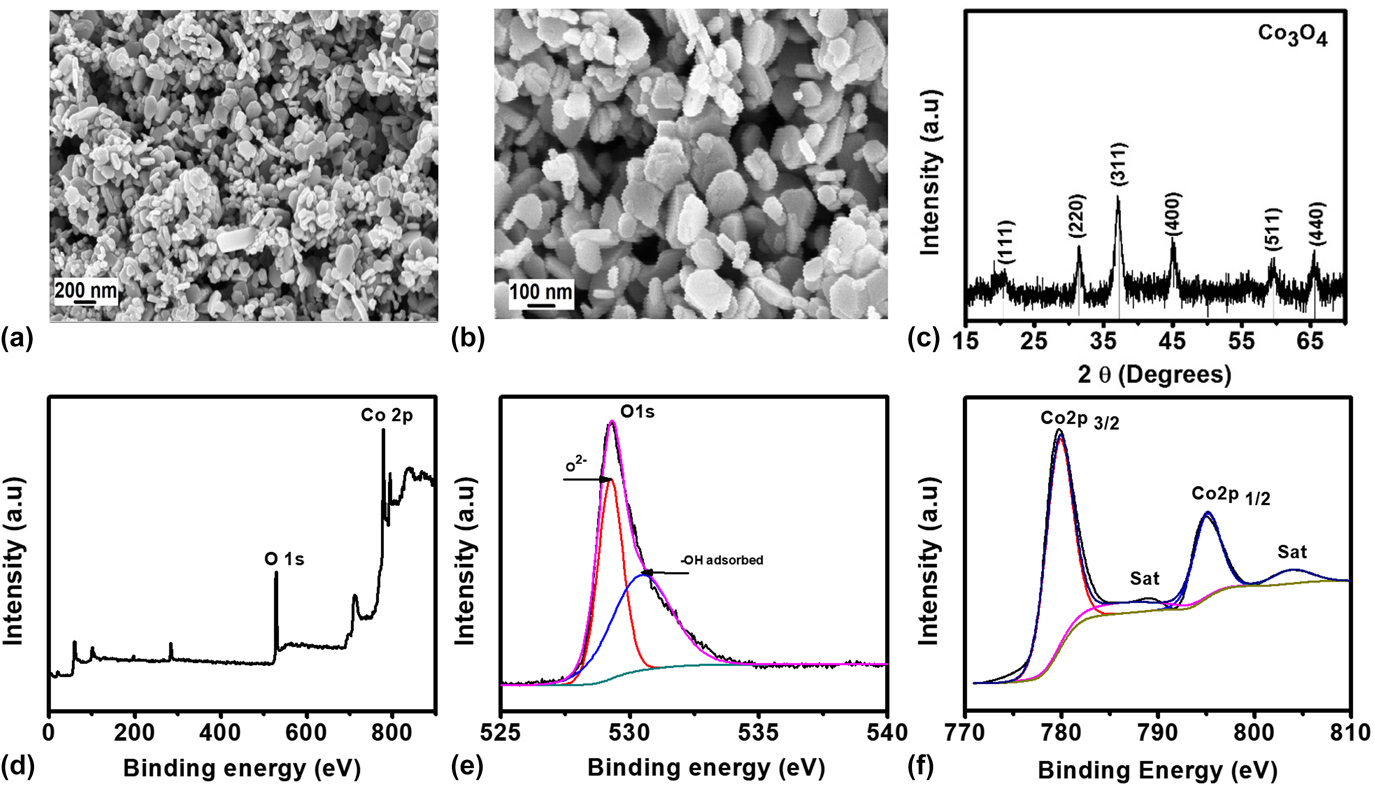
The synthesis of cobalt oxide nanopowder (CoOx–NP) was achieved by chemical synthesis followed by air oxidation. Figure 4(a) shows the SEM images demonstrating the morphology of the CoOx–NP. The nanoparticles lie in the range of 80–150 nm. The crystallographic phase of the cobalt oxide was characterized by XRD technique. The diffraction peaks at 2θ = 20.5°, 32°, 37.2°, 45°, 59.6°, and 60° were observed, which can be indexed to (111), (220), (311), (400), (511), and (440) planes of Co3O4 (JCPDS card 03-065-4899).Reference Salunkhe, Tang, Kamachi, Nakato, Kim and Yamauchi29
(a, b) SEM images of CoOx–NP; (c) XRD pattern of CoOx–NP; (d) overall XPS spectra; (e) O 1s core level spectra; and (f) Co core level spectra of CoOx–NP.

To further understand the species interaction of the CoOx–NP, XPS analysis was conducted. For Co3O4 nanopowder, the XPS peak for Co 2p showed two major peaks with binding energies of 779.86 and 795.1 eV, corresponding to Co 2p 3/2 and Co 2p 1/2, which are characteristic peaks for the Co3O4 phase [Fig. 4(f)]. The two small peaks at 786 and 803.92 eV are typical Co 2p shakeup satellite peaks of Co3O4. The energy difference between the Co 2p 3/2 and Co 2p 1/2 peaks is approximately 15 eV. The deconvoluted XPS spectra [Fig. 4(e)] for O 1s display two types of contributions for oxygen species. One is the oxygen species corresponding to the spinel Co3O4 phase (530.01 eV), resulting from the Co–O bond and the other one indicates the presence of –OH species on the surface of nanostructured Co3O4 grains (531.5 eV), possibly resulting from surface moisture adsorption.
D. Electrochemical performance of cobalt oxide nanopowder (CoOx–NP)
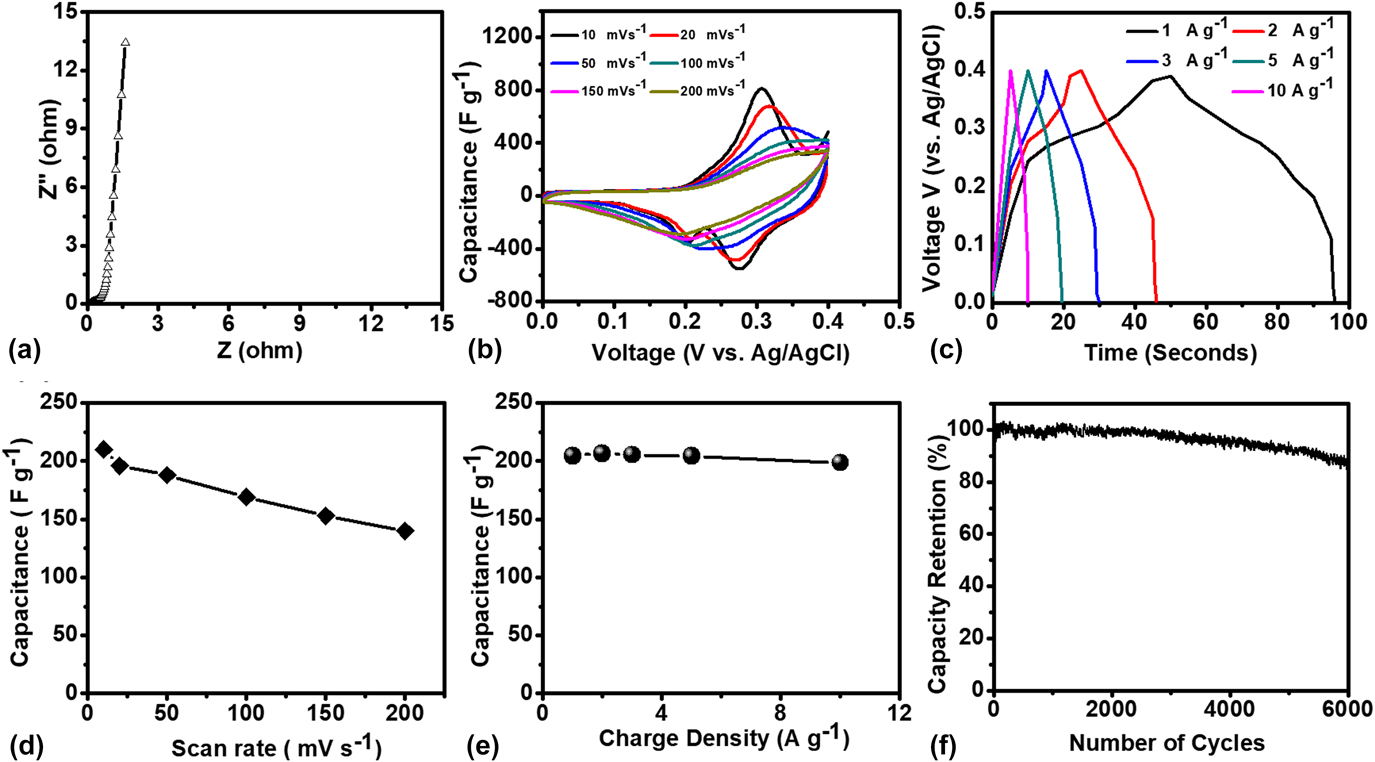
To evaluate the electrochemical performance of CoOx–NP, a three-electrode system was used to perform EIS, CV, and galvanostatic CD measurements at room temperature in 6 M KOH aqueous electrolyte. The electrochemical behavior of CoOx–NP was first studied using EIS and measurements were carried out [Fig. 5(a)]. The typical Nyquist plots observed for the CoOx–NP system exhibited a semicircle located in the high frequency region and a vertical line (close to 90°) in the low frequency region. The semicircle observed at higher frequency arises from the presence of charge-transfer resistance at the electrode/electrolyte interface and the diameter of this semicircle indicates the magnitude of the interfacial charge-transfer resistance associated with faradic reactions. However, negligible semicircle is observed for CoOx–NP, which suggests rapid charge-transfer kinetics at the electrode surface. The small charge-transfer resistance observed for CoOx–NP could be attributed to good electrical connectivity and ease of electrolyte accessibility to the nanostructured materials. The low frequency vertical line indicates nearly ideal capacitive behavior. Figure 5(b) shows CV curves in the range of 0–0.4 V versus Ag/AgCl at various scan rates where the mass of the electrode was 2 mg. We can clearly see two prominent redox peaks, i.e., an oxidation peak at 0.31 V and a reduction peak at 0.29 V versus Ag/AgCl, implying a strong contribution from the redox reactions. Nonrectangular shape suggests little or no EDLC contribution due to the low porous structure. The redox peaks can be attributed to the following reversible reactions of Co3O4 with –OH anions from the 6 M KOH electrolyte as shown belowReference Wang, Li, Chang, Yang, Wu and Liu50:
 $${\rm{C}}{{\rm{O}}_3}{{\rm{O}}_4} + {\rm{O}}{{\rm{H}}^ - } + {{\rm{H}}_2}{\rm{O}} \mathbin{\lower.3ex\hbox{$\buildrel\textstyle\leftarrow\vskip 1pt\over{\smash{\rightarrow}\vphantom{_{\vbox to.5ex{\vss}}}}$}} 3{\rm{CoOOH}} + {{\rm{e}}^ - }\quad ,$$
 $${\rm{CoOOH}} + {\rm{O}}{{\rm{H}}^ - } \mathbin{\lower.3ex\hbox{$\buildrel\textstyle\leftarrow\vskip 1pt\over{\smash{\rightarrow}\vphantom{_{\vbox to.5ex{\vss}}}}$}} {\rm{Co}}{{\rm{O}}_2} + {{\rm{H}}_2}{\rm{O}} + {{\rm{e}}^ - }\quad .$$
(a) Nyquist plot of CoOx–NP; (b) Cyclic voltammetry curves of CoOx–NP at various scan rates; (c) galvanostatic CD curves at various current densities of CoOx–NP; (d) capacitance as a function of scan rate of CoOx–NP; (e) capacitance as a function of current density of CoOx–NP; and (f) cycling stability of CoOx–NP at 1 A/g.

The specific capacitance values calculated from the CV curves at different scan rates are comparable to those reported in the literature.Reference Salunkhe, Tang, Kamachi, Nakato, Kim and Yamauchi29,Reference Abouali, Garakani, Zhang, Xu, Heidari, Huang, Huang and Kim51–Reference Yan, Wei, Qiao, Shao, Zhao, Zhang and Fan54
The symmetric CV curves of CoOx–NP indicate reversibility in charge storage and redox reactions. The specific capacitance values were found to be ∼220, 190, 180, 175, 160, and 140 F/g at scan rates of 10, 20, 50, 100, 150, and 200 mV/s, respectively. The rate capability of CoOx–NP is shown in Fig. 5(d), which illustrates specific capacitance as a function of scan rate. Furthermore, galvanostatic CD measurements were carried out for CoOx–NP at various current densities from 1 to 10 A/g in a potential window of 0–0.4 V (versus Ag/AgCl) [Fig. 5(c)]. The nonlinear behavior accompanied by plateau regions observed during charging (at potential 0.31 V) and discharging (at potential 0.29 V) versus Ag/AgCl is in agreement with the CV results and is further corroborating the presence of faradaic reaction. The maximum specific capacitance of ∼200 F/g was observed at 1 A/g; the electrode exhibited 190 F/g at 10 A/g, suggesting good charge transport and complete utilization of the active material even at higher specific currents [Fig. 5(e)]. Furthermore, CoOx–NP retained ∼86% of the initial specific capacitance when cycled at 1 A/g over 6000 cycles [Fig. 5(f)]. This indicates the good electrochemical performance and cycling stability of the CoOx–NP composite.
E. Electrochemical evaluation of ASC FeOx–CNF‖CoOx–NP
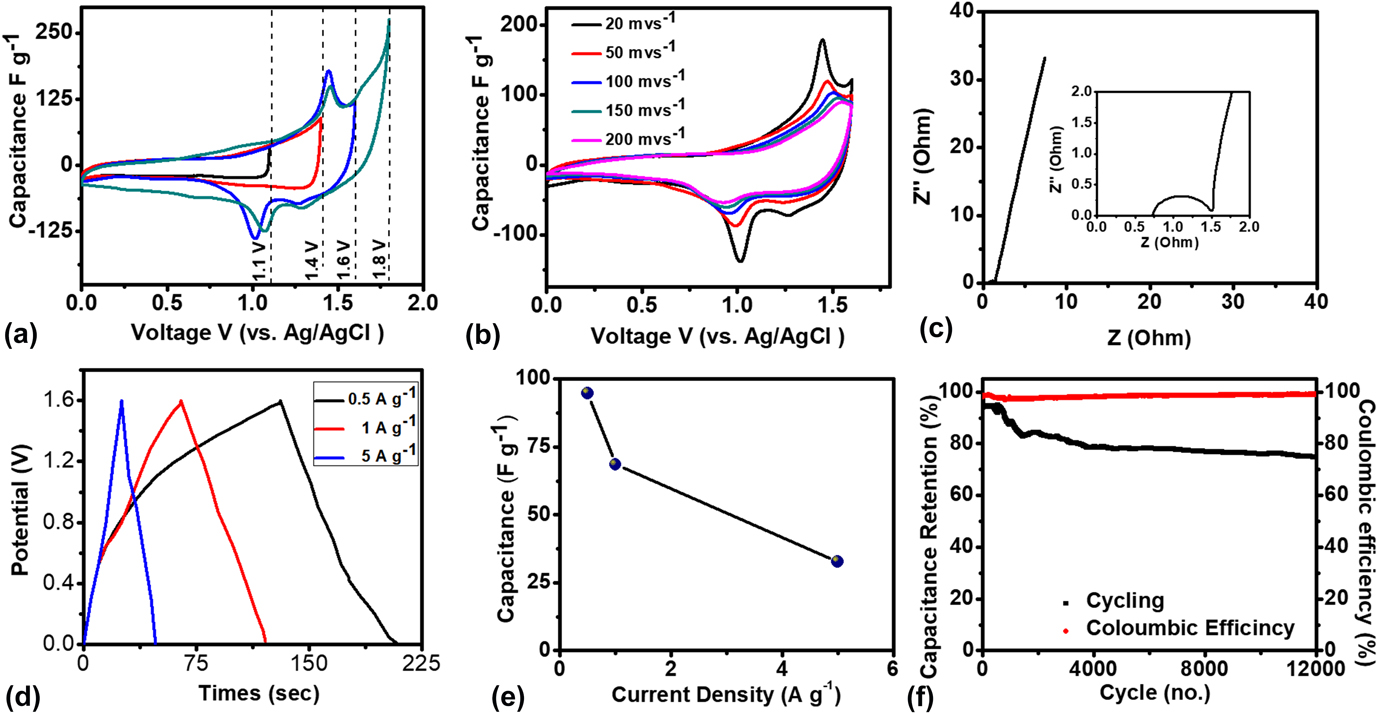
To further evaluate the practical application of the FeOx–CNF anode and cobalt oxide nanopowder as the cathode, a novel aqueous asymmetric device was assembled. The capacitive performance was evaluated using CV, galvanostatic CD, and EIS. The positive electrode of the ASC is Co3O4 with a grain morphology that provides channels to a large number of electrolyte ions to penetrate deep inside the redox material, which further helps in complete utilization. On the anodic side, iron oxide plays an interesting role by providing fast charge-transfer through its porous structure as well as large electrode/electrolyte interface. Thus, this specially designed ASC is expected to combine the advantages of these two earth-abundant materials to provide high specific energy and specific power. The performance of the ASC was first evaluated using CV studies in different potential windows after it was mass/charge balanced at 20 mV/s. As shown in Fig. 6(a), a series of CV tests are undertaken in different potential windows to determine an optimal operational window in a 6 M KOH electrolyte. There are no prominent redox contributions in a voltage window of 1.1 V while in an extended window of 1.7 V, we see redox contribution in addition to electrolyte decomposition. Hence, a working potential window of 1.6 V was selected as it exhibited both redox peak contribution and electrolyte stability. Increase in potential window from 1.1 to 1.6 V leads to substantial increase in capacitance with contribution from the redox reactions and it can be further confirmed from the CV integral area. The ASC was cycled at various scan rates from 20 to 200 mV/s in a potential window of 1.6 V. The CV curves exhibit a nonrectangular shape and reversible redox peaks, which suggests dominant capacitance contribution from redox reactions.
(a) Cyclic voltammetry curves of ASC operated at various potential windows; (b) cyclic voltammetry curves of ASC at various scan rates operated at 1.6 V, (c) EIS of asymmetric device; (d) galvanostatic CD curves at various current densities; (e) capacitance as a function of current density; and (f) cycling stability of ASC at 1 A/g.

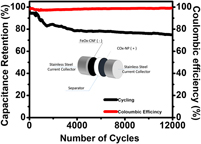
Figure 6(c) shows Nyquist plot of a full-cell device fabricated in a two-electrode system. The plot shows a semicircle located in the high frequency region and a vertical line in the low frequency region. The diameter of high frequency semicircle (∼0.83 Ω) represents charge-transfer resistance at the electrode/electrolyte interface. However, the increase in interfacial charge-transfer resistance for the asymmetric device as compared to the positive electrode (CoOx–NP) indicates that it is limited by the negative electrode (FeOx–CNFs). The galvanostatic CD tests for the FeOx–CNFs//CoOx–NP ASC at different current densities were conducted. As shown in Fig. 6(d), the full ASC, assembled with a total mass of 3.1 mg in 6 M KOH electrolyte, delivers device-level specific capacitances (on the basis of the weight of both electrodes) of 94.7 F/g, 68 F/g, and 32 F/g at current densities of 0.5, 1, and 5 A/g, respectively. As one of the main parameters of the supercapacitor, its long term cycling stability was studied; the ASC device retained around 75% of its initial capacitance after 12,000 cycles at a current density of 1 A/g while maintaining a very high columbic efficiency of 99.8%. It is worth mentioning that the capacity essentially stays stable after 1500 cycles evident by the almost steady curve.
Overall, our asymmetric device shows higher cycle life and capacitance retention compared with the previously reported ASCs. For e.g., Dai and coworkers demonstrated ternary nickel sulfide-based asymmetric devices, Ni3S2-MWCNT-NC//AC which delivered a capacitance of 55.8 F/g at 1 A/g. The asymmetric device retained around 90% of its initial capacitance after 5000 CD cycles at 4 A/g with 90% columbic efficiency.Reference Dai, Chien, Lin, Chou, Wu, Li, Wu and Lin55 Li et al. developed porous nickel cobalt sulfide-based asymmetric device, Ni–Co–S//AC; the device delivered a capacitance of 92 F/g at a low scan rate of 5 mV/s. The asymmetric device had a capacitance fade of 21% when cycled for 6000 CD cycles at 80 mA/cm2.Reference Li, Li, Wu, Rui and Zeng56
The energy and power densities of the ASC device were calculated based on the galvanostatic discharge curve. The ASC developed in this work displayed a maximum energy density of 40.54 W h/kg at a power density of ∼2432 W/kg. These values are higher than values previously reported in the literature, Ni3S2-MWCNT-NC//AC (19.8 W h/kg at 798 W/kg),Reference Dai, Chien, Lin, Chou, Wu, Li, Wu and Lin55,Reference Tang, Yin and Gong57 NiCo2S4-NCF//OMC-NCF (45.5 W h/kg at 512 W/kg),Reference Shen, Wang, Xu, Li, Dou and Zhang58 Ni–Co sulfide nanowire//AC (25 W h/kg at 447 W/kg),Reference Li, Cao, Qiao, Zhou, Yang, Xiao and Zhang59 mesoporous NiCo2S4//AC (25.5 W h/kg at 334 W/kg),Reference Wu, Pu, Ji, Zhu, Jing, Chen and Jiao60 NiCo2S4 nanotube//RGO (31.5 W h/kg at 156.6 W/kg),Reference Chen, Jiang, Zhang, Xia, Zhao, Guo, Qi and Wan61 Ni1.5Co1.5S4//RGO (37.6 W h/kg at 775 W/kg),Reference Chen, Jiang, Zhao, Zhang, Guo and Xia62 and Ni–Co–S nanosheets//AC (41.4 W h/kg at 414 W/kg),Reference Li, Li, Wu, Rui and Zeng56 and Fe3O4@carbon nanosheet//CPY (18.3 W h/kg at 0.351 W/kg).Reference Fan, Niu, Duan, Liu and Shen63 This enhanced storage capacity and a wider operational window using metal oxide composites resulted from the superior individual electrode performance and higher overpotential to water splitting reactions.
IV. CONCLUSION
In summary, a simple scalable method of electrospinning is used to fabricate FeOx–CNF anode to demonstrate a high performance negative electrode material for ASCs. The iron oxide anode enhances the potential window in addition to energy density as well as power density. Iron oxide materials could be very suitably used for future applications due to their superior performance, low cost, easy preparations, and earth abundancy. The assembled ASC (Co3O4‖Fe3O4) displays a device-level capacitance of 94.53 F/g (based on the total weight of both electrodes) at a current density of 0.5 A/g in a wide potential window of 1.6 V. Combining high performance of the individual materials into a full device has resulted in a device with supercapacitor-like power and cycling behavior that delivers a promising battery-like specific energy of 40.53 W h/kg. The ASC exhibited a capacity retention of around 75% after 12,000 cycles when cycled at 1 A/g.
Supplementary Material
To view supplementary material for this article, please visit https://doi.org/10.1557/jmr.2018.13.
ACKNOWLEDGMENTS
We would like to thank National Science Foundation for funding this work under award numbers CMMI-1537827 and CMMI-1463170. We are very grateful to Drexel University Centralized Research Facility for the use of their characterization equipments. We would like to thank Dr. Mykola Seredych from Prof. Yury Gogotsi’s group and Bryan Byles from Prof. Ekaterina Pomerantseva’s group at Drexel University for their help with the surface area measurements and X-ray photoelectron spectroscopy measurements, respectively.