Introduction
This study is concerned with preferences for earlier or later retirement in Europe. While the dominant literature focuses on the financial incentive structures of pension systems to explain retirement behaviour (supply-side explanations, e.g. Gruber and Wise Reference Gruber and Wise1999, Reference Gruber and Wise2004), we investigate both monetary and non-monetary determinants and also account for demand-side explanations. Using data from the European Social Survey for individuals who retired in the period 1995–2011, we assess a multitude of factors that may shape individuals' preferred age of retirement and that may lead to a mismatch between preferences and behaviour. We distinguish instances in which retirement occurs earlier than preferred (involuntary retirement) from instances in which retirement occurs later than preferred (involuntary work).
The study of retirement preferences and of mismatches between preferences and behaviour is of interest for several reasons. A limiting assumption in the economics literature is that retirement preferences are revealed through behaviour (Lumsdaine and Mitchell Reference Lumsdaine, Mitchell, Ashenfelter and Card1999) and that it is hence sufficient to study the latter. This revealed preference approach fails to account for the frequently observed discrepancies between preferences and behaviour. Previous studies have identified high shares of involuntary retirees who retired earlier than they would have preferred (e.g. Dorn and Sousa-Poza Reference Dorn and Sousa-Poza2010; Szinovacz and Davey Reference Szinovacz and Davey2005). At the same time, sizeable shares of older workers continue working until higher ages than they would prefer, as will be shown in the present study.
Prior research shows that unfulfilled preferences in the form of involuntary retirement (retiring earlier than preferred) or involuntary work (working longer than preferred) have negative implications for older individuals' health, their economic and psychological wellbeing (e.g. Dingemans and Henkens Reference Dingemans and Henkens2014; Gallo et al. Reference Gallo, Bradley, Siegel and Kasl2000; Shultz, Morton and Weckerle Reference Shultz, Morton and Weckerle1998; Smith Reference Smith2006; Van Solinge Reference Van Solinge2007). According to data from the US Health and Retirement Study, the degree to which retirement is perceived as voluntary or involuntary significantly affects retirees' happiness (Calvo, Haverstick and Sass Reference Calvo, Haverstick and Sass2009; see also Calvo Reference Calvo2006; De Vaus et al. Reference De Vaus, Wells, Kendig and Quine2007). Moreover, job displacement and involuntary retirement have dramatic effects on the income, health and mortality of older individuals (Calvo and Sarkisian Reference Calvo and Sarkisian2011; Sullivan and von Wachter Reference Sullivan and von Wachter2009). Those who are pushed out of the labour market prematurely are bereft of opportunities to prepare adequately for retirement, both economically and psychologically, while those who need to stay in the workforce longer than preferred may be overburdened by health problems or alternative commitments such as care-taking (for a review, see Steiber Reference Steiber and Michalos2014).
The last study that has documented the prevalence of involuntary retirement in Europe in a cross-national setting is based on data from the late 1990s (Dorn and Sousa-Poza Reference Dorn and Sousa-Poza2010). The present study updates the evidence on the extent to which retirement in Europe is voluntary or involuntary using data from Round 5 of the European Social Survey (ESS) that has been fielded in 2010/11. In contrast to most available research on mismatches between retirement preferences and behaviour (e.g. Dorn and Sousa-Poza Reference Dorn and Sousa-Poza2010; Van Solinge and Henkens Reference Van Solinge and Henkens2007), our analyses are not restricted to involuntary retirement (retiring earlier than preferred) but also address involuntary work (retiring later than preferred). That is, instead of using the direct indicator of mismatch available in the ESS that is limited to measuring involuntary retirement (‘Did you want to retire then or would you have preferred to continue in paid work?’), we use data on preferred and actual ages of retirement (asking at what age respondents retired and at what age they would have liked to retire) to compute a bi-directional indicator of mismatch.
Applying a life course approach, we ask how past experiences in the work and family domain affect retirement preferences and retirement behaviour and how they affect the match between the two. The paper is organised as follows. Subsequent to the outline of our key conceptual distinctions and the description of the data used, we provide some descriptive results comparing preferred and actual ages of retirement in a diverse set of European countries. In the second part of the analysis, we use regression models to estimate the determining factors of preferred and actual ages of retirement and their degree of congruence or incongruence in 23 European countries. We conclude with a discussion of our main results.
Retirement preferences, involuntary retirement and involuntary work
In this study, retirement refers to the beginning of the stage in a person's life course in which he or she is no longer gainfully employed. This includes older individuals who have reached statutory retirement ages and are officially retired as well as those who have permanently exited the labour market using alternative pathways to retirement (Kohli et al. Reference Kohli, Rein, Guillemard and Van Gunsteren1991), such as the long-term unemployed and the permanently disabled (operationalisation details below).
Retirement preferences in this study refer to workers' stated preferences concerning the age at which to retire. Such preferences are shaped by the available and financially viable retirement options and the incentive structures set by pension systems (Hofäcker Reference Hofäcker2015), as well as by health constraints, normative expectations and the family situation (e.g. Shultz, Morton and Weckerle Reference Shultz, Morton and Weckerle1998; Van Soest, Kapteyn and Zissimopoulos Reference Van Soest, Kapteyn and Zissimopoulos2007). Cross-country comparative analyses of preferred ages of retirement in Europe have previously been carried out by Esser (Reference Esser2005) using Eurobarometer data from 1992 and 2003 and by Hofäcker (Reference Hofäcker2015) using ESS data from 2010/11. While these studies take a prospective approach studying preferences for future retirement, the present study takes a retrospective approach comparing past behaviour with preferences. The retrospective approach entails both a strength and a weakness of design: on the one hand, it allows us to contrast preferences with behaviour and hence to identify mismatch – something that prospective approaches using cross-sectional data do not allow. On the other hand, retrospective data on retirement preferences do not allow the potential adaption of preferences between the year of retirement and the interview to be taken into account. In fact, the perception of retirement may not remain stable in the first years after the retirement transition (Hershey and Henkens Reference Hershey and Henkens2014: 242). This may present a limitation of our research design. At the same time, it could be argued that the perception of and satisfaction with retirement right before or after labour market exit is not the most relevant one for policy considerations. We observe the degree of voluntariness of the retirement transition as perceived by retirees following some amount of acclimatisation and adaptation.
Mismatches in the timing of preferred and actual retirement are conceptualised as follows.
Involuntary retirement
Involuntary retirement results from constraints to employment that may derive from a lack of demand for older workers' labour (e.g. unemployment or other employment constraints for older workers, legal provisions of mandatory retirement), from alternative commitments that do not allow for continued work (e.g. care responsibilities) or from health limitations (e.g. chronic illness or disability). Poor health may, but need not, result in involuntary retirement, however. On the one hand, if a worker's health condition does not permit any kind of employment, an early labour market exit may be in line with preferences (voluntary retirement, e.g. using disability insurance schemes; see Kohli et al. Reference Kohli, Rein, Guillemard and Van Gunsteren1991). On the other hand, if the health status creates ‘professional incapacity’ (inability to continue working in the same job) but would allow for continued employment in a different job, a lack of alternative employment or re-training opportunities may result in perceptions of involuntary retirement.
Involuntary work
Involuntary work results from constraints to retirement. It pertains to continued work until a higher age than preferred due to non-anticipated changes in context conditions. Negative shocks on the expected income in retirement, for instance, may create the financial necessity to work longer than previously preferred. In a similar vein, when age thresholds for eligibility to pension benefits are raised, or when early exit options are closed, this may compromise older workers' retirement preferences. In these instances, they may have to continue working (involuntarily) until sufficient pension benefits become accessible. In the long run, individuals would be expected to adapt their preferences to the new circumstances, but in the short or medium run there may be an acutely felt gap between preferences and available options. Involuntary work may also be the result of poor health that is not bad enough to render the worker ‘wholly and permanently disabled’ and thus eligible to a disability pension. In this case the worker may have to continue in paid work until a basic pension can be drawn. Moreover, family-related responsibilities such as the need to take on intensive care for a family member may arise as a time constraint. This may lead to a preference for an earlier exit from the labour market than is possible given the need to remain in employment until a sufficient pension can be drawn. Finally, those who have worked part-time during a substantial part of their careers may not be fully aware that they have not accumulated sufficient pension wealth until close to their expected age of retirement and may thus find out late in their careers that they will need to work longer than they had planned for.
Data
We use data from Round 5 of the ESS fielded in 2010/11 (face-to-face interviews). The ESS is renowned for its high methodological standards that allow for high-quality cross-country comparative analyses in Europe (Jowell et al. Reference Jowell, Roberts, Fitzgerald and Eva2007). Our sample of interest consists of pensioners who retired in the period 1995–2011 at ages 50–69 and who are between ages 50 and 85 at the time of interview. Since retirement at age 70 or above is very rare in Europe, the restriction to those retiring before age 70 results in the exclusion of less than 1 per cent of the sample. We include retirees who left the active labour force for regular retirement or via alternative pathways such as long-term unemployment or disability. That is, we include persons who fulfil one of the following four sets of conditions:
-
1. They report ‘retirement’ to be their current ‘main activity’ and have retired at age 50 or later.
-
2. They report being retired but not as their main activity (the main activity being ‘housework’ in 70 per cent of these cases and being ‘ill or disabled’ in 20 per cent of these cases), their last job ended more than one year ago and they were aged 50 or older when their last job ended.
-
3. They report being permanently ill or disabled as their current ‘main activity’, their last job ended more than one year ago and they were at least 50 years of age when their last job ended.
-
4. They are currently unemployed and their last job ended more than one year ago at or after age 50.
The first category includes the vast majority of our sample of 2,107 male and 2,098 female retirees; about 2 per cent belong to group 2, and about 3 per cent to groups 3 and 4, respectively. Per definition, the sample excludes current part-time retirees who continue being gainfully employed. The data at hand do not allow us to determine whether the respondents had made use of part-time retirement schemes in the past (i.e. phased or partial retirement). About 6 per cent of the male sample and about 20 per cent of the female sample reported that their last job had been a part-time job. These late-career part-time workers may or may not have been partly retired. They were simply asked in what year they retired. We assume that respondents report the year in which they fully retired and exited the labour market as their ‘year of retirement’.
The survey items of core interest capture respondents' year of retirement (‘In what year did you retire?’) and their preference (‘At what age would you like to or would you have liked to retire?’). Based on these, we compute individuals' actual age of retirement (AAR) and their preferred age of retirement (PAR). AAR is obtained using information on respondents' age at the time of interview and the year in which they retired. In the survey, only those who report retirement as their current main activity were asked about the year in which they retired. For the other groups of retirees, we use information on the ‘year in which their last job ended’ to compute their AAR. All respondents, irrespective of their current main activity, are asked about their PAR.
For the regression analyses, AAR and PAR are recoded into five categories: retirement before age 60, at age 60, at ages 61–64, at age 65 and later than age 65 (see below for rationale). A third variable combines information on AAR and PAR to measure the degree of congruence between preferences and behaviour. This variable has three categories: (a) involuntary work defined as having worked until a higher age than preferred; (b) voluntary retirement defined as having retired at the preferred age – plus or minus one year; and (c) involuntary retirement, defined as having had to retire at an earlier age than preferred. Note that the applied definition of voluntary retirement entails a rather conservative measure of the occurrence of mismatch.
Descriptive findings
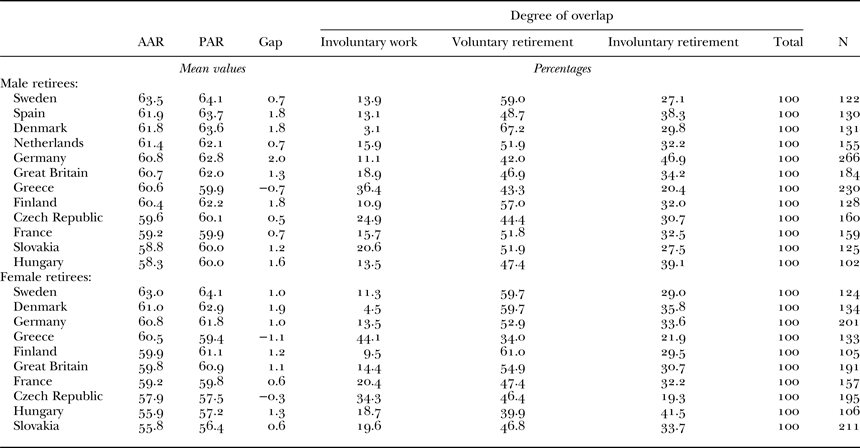
The descriptive analyses compare average ages of actual and preferred retirement (AAR and PAR) in the period 1995–2011 across 12 countries that offer a sample of at least 100 female retirees and/or 100 male retirees (Czech Republic, Denmark, Finland, France, Germany, Great Britain, Greece, Hungary, Slovakia, Spain, Sweden and the Netherlands). Table 1 shows weighted average AAR using the sampling weights provided in the data: the average AAR among male retirees is highest in Sweden (63.5), Spain (61.9), Denmark (61.8) and the Netherlands (61.4), followed by Germany, Great Britain, Greece and Finland, while it is below 60 in the Czech Republic, France, Slovakia and Hungary. Female retirees' average AAR varies between 55.8 (Slovakia) and 63.0 (Sweden).
Actual and preferred ages of retirement

Notes: Sample: retirees who retired at ages 50–69 in the years 1995–2011. Shown are the weighted means of actual ages of retirement (AAR), preferred ages of retirement (PAR) and of the gap between the two (PAR − AAR) as well as the weighted shares of respondents who retired later than they preferred (involuntary work), who retired at the preferred age (± one year), and who retired earlier than they preferred (involuntary retirement).
Source: European Social Survey Round 5.
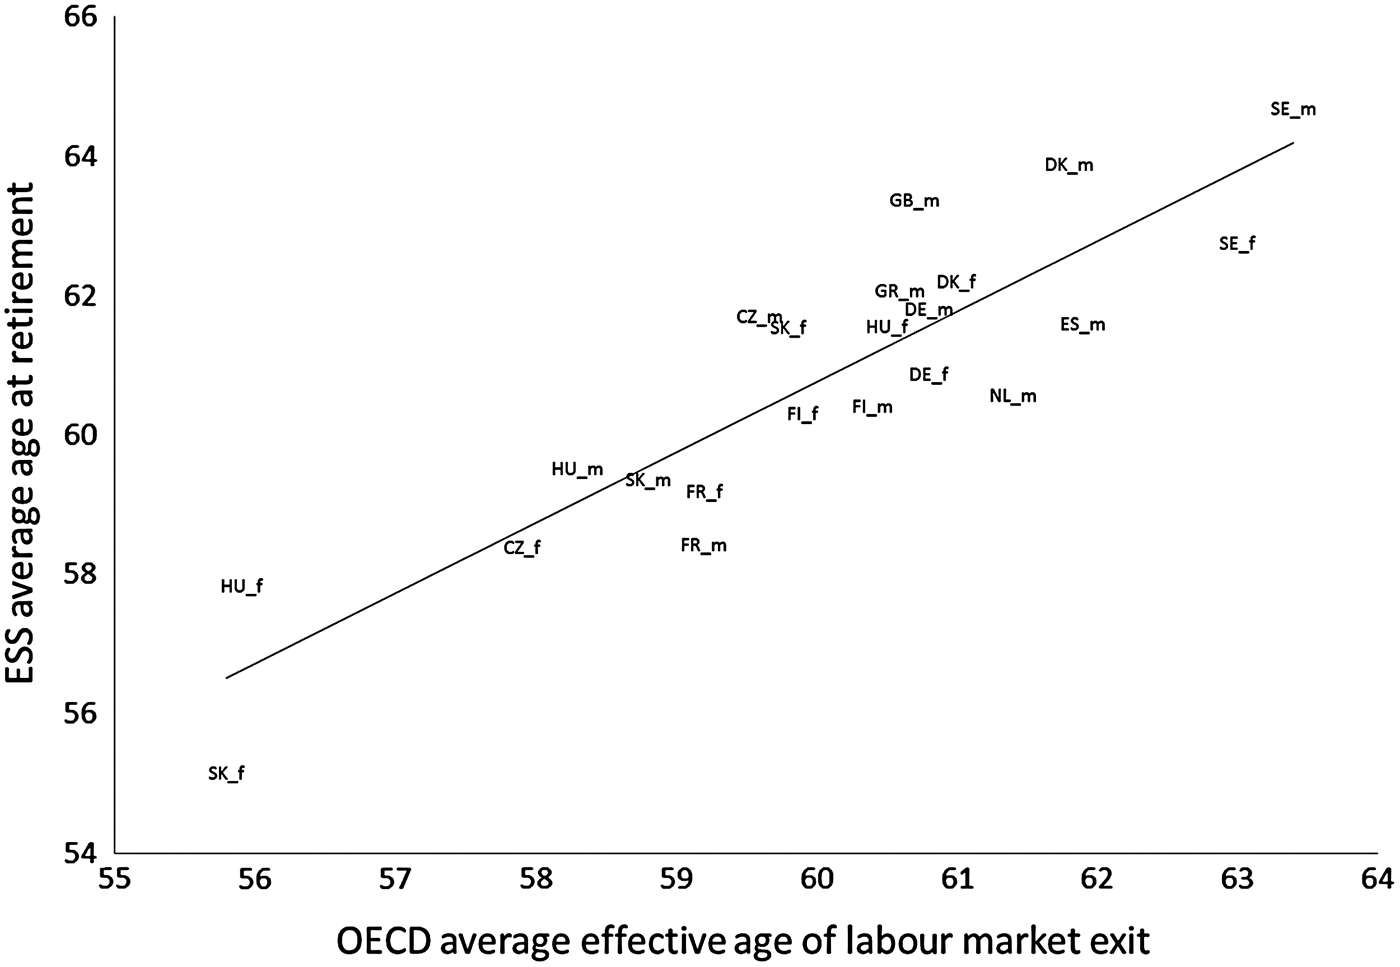
These survey-based estimates show a country ranking similar to a ranking based on official labour force data (see Figure 1). The Organisation for Economic Co-operation and Development publishes estimates of ‘average effective ages of labour market exit’ that are calculated as a weighted average of withdrawals from the labour market at different ages and for five-year periods. This resembles our approach of defining a retirement window (in our case 1995–2011) and to estimate the average age of exit among those who retired from paid work during this period. The two measures do not fully concur due to somewhat different definitions (see the notes below Figure 1), yet the estimates strongly correlate (r = 0.89). Our baseline data of AAR from the ESS thus appears to be representative of country-specific retirement patterns and are subsequently used for comparative analyses with preferences.
Actual ages of retirement, comparing European Social Survey (ESS) with Organisation for Economic Co-operation and Development (OECD) data.

In addition to estimates of average AAR, Table 1 presents estimates of weighted average PAR and the degree of overlap between AAR and PAR. In some of the countries, male retirees' preferences match their behaviour rather closely, as reflected in small gaps between PAR and AAR of less than a year (in Sweden, the Netherlands, Greece, the Czech Republic and France). In Spain, Denmark, Germany, Finland and Hungary, by contrast, the gap amounts to more than one and a half years. German men who retired in the period 1995–2011, for instance, would have preferred to work an average of two years longer than they effectively did or were able to do (1.8 in Denmark, Finland and Spain, and 1.6 in Hungary).
The varying magnitude of the gap between AAR and PAR across countries is reflected in the shares of retirees reporting involuntary work, voluntary retirement or involuntary retirement. The share of voluntary retirees – those whose preferences match their behaviour – among men is highest in the Nordic countries (67% in Denmark, 59% in Sweden, 57% in Finland), while it amounts to less than 50 per cent in Spain, Germany, Great Britain, Greece, the Czech Republic and Hungary. In some of the latter countries, the high prevalence of incongruence between AAR and PAR is due to widespread involuntary retirement, reported by more than a third of male retirees in Germany (47%), Hungary (39%), Spain (38%) and Britain (34%). In Greece and the Czech Republic, by contrast, the comparatively small share of voluntary retirees is due mainly to a high prevalence of involuntary work (36% of Greek men and 25% of Czech men have worked longer than they would have preferred). With the notable exception of Greece, the prevalence of involuntary retirement is higher than that of involuntary work. The shares of involuntary male retirees vary between 20 per cent (Greece) and 48 per cent (Germany); the shares of involuntary male workers vary between 3 per cent (Denmark) and 36 per cent (Greece). The pattern for women resembles that for men. The mean AAR is lower than the mean PAR in all countries except Greece and the Czech Republic. A third of female retirees or more retired involuntarily in Denmark, Germany, Hungary and Slovakia, while involuntary work is most common in the Czech Republic (34%) and Greece (44%).
Modelling preferred and actual ages of retirement
Hypotheses for preferred ages of retirement
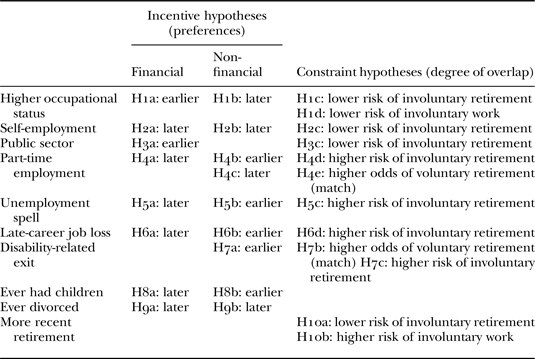
We expect the characteristics of employment careers to be key to understanding older workers' PAR. A defining characteristic of careers is the occupational status of the last job (Hayward Reference Hayward1986). Higher-status occupations tend to be associated with greater rewards in financial and non-financial terms (offering higher wages but also greater prestige and intrinsic job quality than lower-status jobs; see Muñoz de Bustillo et al. Reference Muñoz de Bustillo, Fernández-Macías, Antón and Esteve2011). For pure financial reasons, we would expect those working in higher-status occupations to prefer an earlier retirement simply because they can better afford an earlier exit from the labour market (they tend to have greater accumulated pension wealth and a better pension coverage). Work motivation is shaped also by non-financial factors, however (Lawler Reference Lawler and Lorsch1987; Steiber Reference Steiber2008; Warr Reference Warr1982). The rewards of skilled jobs, such as greater opportunities for personal development and self-realisation, would be expected to encourage workers to remain in employment until higher ages (Hayward Reference Hayward1986). This contention is supported by evidence from the Survey of Health, Ageing and Retirement in Europe. The higher the workers' occupational status, the less they report wanting to retire as early as possible (Wahrendorf, Dragano and Siegrist Reference Wahrendorf, Dragano and Siegrist2013). Classic job design theory (Hackman and Oldham Reference Hackman and Oldham1976) suggests that the mastery of challenging and interesting job tasks performed with a high degree of autonomy and discretion will increase workers' motivation to retire later (for supportive evidence, see Blekesaune and Solem Reference Blekesaune and Solem2005; Wahrendorf, Dragano and Siegrist Reference Wahrendorf, Dragano and Siegrist2013). Finally, those in higher social positions tend to enjoy better health and longer lives, representing another non-financial reason for why those in higher-status occupations may be less prone to early retirement (Hayward Reference Hayward1986; Van Solinge and Henkens Reference Van Solinge and Henkens2010). As shown by this example of occupational status, the financial incentives associated with some of the predictors of retirement preferences and the non-financial incentives associated with the same predictors may work in opposite directions (Damman, Henkens and Kalmijn Reference Damman, Henkens and Kalmijn2011; Raymo et al. Reference Raymo, Warren, Sweeney, Hauser and Ho2011). To deal with this complexity of counteracting mechanisms, we systematically organise the presentation of our research hypotheses along these lines in what follows (for an overview, see Table 2).
Overview of research hypotheses

Note: H: hypothesis.
Those who work in higher-status occupations are expected to prefer retirement at younger ages because they are more likely to be able to afford an early exit (Hypothesis 1a). Yet, there are also reasons to expect the reverse: those in higher-status occupations may prefer retiring later because they tend to obtain greater intrinsic rewards from work (higher job quality), to enjoy better health and a higher life expectancy, and to be more achievement-oriented (Hypothesis 1b).
Those who used to be self-employed are expected to prefer longer work lives than those who used to be in dependent employment, for financial (Hypothesis 2a) and for non-financial reasons (Hypothesis 2b). The underlying assumptions are that the self-employed tend to enjoy higher job control and a greater potential for self-realisation than the dependently employed, while their financial situation tends to be less secure and they are often not covered by state pension systems (Blossfeld, Buchholz and Hofäcker Reference Blossfeld, Buchholz and Hofäcker2006). All of these factors are conducive to later retirement. However, the self-employed are a heterogeneous group in terms of their motivation for choosing self-employment. Assuming that women are more likely to become self-employed in order to be able to work at home and to improve their work–life balance than men (Dawson, Henley and Latreille Reference Dawson, Henley and Latreille2009), whereas men are more likely to become self-employed in order to obtain a greater degree of independence and job control than women (ibid.), we may expect to find stronger effects of self-employment on preferences for later retirement for men than for women.
Employment in the public sector is expected to be associated with preferences for earlier retirement for financial reasons (Hypothesis 3a): public-sector workers are financially more secure than private-sector workers; they enjoy a high level of dismissal protection and they are more likely to have access to well-funded early retirement (Hofäcker Reference Hofäcker2015). Moreover, public-sector employees may be a selective group if the initial decision to work in the public sector is co-determined by a weaker career commitment and preferences for earlier retirement. This is likely to be an undue generalisation, however. The work motivation of public-sector employees is very heterogeneous and may in many cases involve a strong public service orientation.
Expectations regarding the impact of part-time employment are ambivalent. Phases of part-time work are associated with lower accumulated pension wealth and would be expected to encourage later exit (Hypothesis 4a). If part-time workers have jobs of lower intrinsic quality and/or are less committed to employment, however (as contended by Hakim Reference Hakim1991), they may prefer an earlier exit (Hypothesis 4b). Finally, considering that part-time work preceding full retirement may be part of an agreement of phased retirement, late-career part-timers could be expected to prefer later retirement (Hypothesis 4c). That is, those who prefer working until higher ages may choose to do so on a part-time basis. Note, however, that the data do not provide information on the employment motivation of late-career part-timers. The analyses presented in this paper can thus not discriminate between Hypotheses 4a and 4c.
Since disrupted employment careers may increase the financial pressure to work longer, we expect those affected by unemployment during their careers to prefer later retirement (Hypothesis 5a). Long-term unemployment may damage workers' employment commitment, however (Hyggen Reference Hyggen2008), especially at older ages when hiring rates dwindle (Adler and Hilber Reference Adler and Hilber2009). The experience of unemployment, especially when spells last longer than a year (long-term unemployment), may thus be associated with preferences for earlier retirement, reflecting a weaker employment commitment among discouraged workers (Hypothesis 5b).
Similar mechanisms are assumed to be at work for those who experience job loss in their late careers: for financial reasons, those who lose their last job involuntarily (e.g. following a dismissal or a firm closure) would be expected to prefer a later retirement than those who left their last job for regular retirement (Hypothesis 6a). Assuming that job loss disrupts older workers' commitment, however, a negative effect on the PAR would be expected (Hypothesis 6b).
Those who gave up their last job for reasons related to illness or disability are likely to have had a longer history of poor occupational health and possibly less gratifying jobs than those leaving their last job for regular retirement. For this reason, we expect them to prefer an earlier exit from the labour market (Hypothesis 7a), i.e. a disability-based pathway to early retirement.
We also consider experiences in the family domain as predictors of PAR, focusing on two events that may or may not have occurred in the past: parenthood and divorce. Assuming that parents of children of any age have a greater financial need than those who remained childless, we may expect them to prefer later retirement (Hypothesis 8a). Child rearing might furthermore be associated with career breaks – especially for women – and the need to make up for these breaks by working until higher ages. We would thus expect mothers to prefer later retirement than non-mothers for financial reasons (lower accumulated pension wealth) and for career reasons (desire for professional achievement in late-starting careers; see Moen and Roehling Reference Moen and Roehling2005). If we assume the childless to be more work-oriented, however, we would expect them to prefer longer work careers than parents (Hypothesis 8b). A divorce tends to be costly for both partners. Divorcees can thus be assumed to need to work longer than they may have, had the marriage remained intact (Hypothesis 9a). Moreover, after a divorce, the work role may attain a more central role. This may also be expected to foster preferences for later retirement (Hypothesis 9b). Note that the analyses presented in this paper cannot discriminate between Hypotheses 9a and 9b.
Hypotheses for involuntary retirement
The degree to which retirement preferences can be realised depends on workers' retirement options, on the one hand, and on their opportunities for continued employment, on the other. Based on this general logic, we would expect those in higher-status occupations to be better able to realise their preferences due to a better employment outlook compared to their counterparts in lower-status occupations. Therefore, we predict a lower risk of involuntary retirement in higher-status occupations (Hypothesis 1c). Assuming lower constraints to continued employment also for the self-employed, we predict a lower risk of involuntary retirement for them compared to dependent workers (Hypothesis 2c). Also public-sector workers may be less at risk of redundancy and eventually involuntary retirement than private-sector workers (Hypothesis 3c). Conversely, due to greater employment constraints, part-time workers may have greater difficulty realising preferences for later retirement and would hence be expected to be more at risk of involuntary retirement than full-time workers (Hypothesis 4d). If part-time work is part of an arrangement of phased retirement, however, part-time workers may achieve a high degree of match between preferences and behaviour (Hypothesis 4e).
Unemployment leaves scars, increasing the risk of recurring unemployment throughout the career (Arulampalam, Booth and Taylor Reference Arulampalam, Booth and Taylor2000; Eliason and Storrie Reference Eliason and Storrie2006). We may thus expect those affected by unemployment (especially by long-term unemployment) during their career to face a higher risk of involuntary retirement (Hypothesis 5c). The same mechanism can be assumed for those who were dismissed or laid off from their last job, since for older workers it is particularly difficult to find a new job (Adler and Hilber Reference Adler and Hilber2009). Moreover, research has shown dramatic effects of job displacement on the health of older workers (Sullivan and von Wachter Reference Sullivan and von Wachter2009). In sum, we expect those affected by late-career job loss to face a high risk of involuntary retirement (Hypothesis 6d).
Poor health conditions may have an ambiguous effect. Assuming that health limitations lead to a preference for an earlier exit, we may expect to find a great deal of overlap between PAR and AAR among older workers with chronic illnesses or a disability (given provisions for disability pensions, Hypothesis 7b). However, among those who would like to continue working in a different job, early disability-related retirement may be perceived as involuntary. In this case, and if we assume restricted employment chances for individuals with poor health, we would expect to find high rates of involuntary retirement among those who left their last job for health reasons (Hypothesis 7c).
Retirement due to the emergence of care responsibilities (e.g. when a family member develops intensive care needs) may also be perceived as involuntary. With the data at hand, that lack information on care-giving at or close to retirement, we cannot formally test such contentions. However, when respondents indicate having left their last job for ‘personal or family reasons’ (as opposed to retirement, involuntary job loss or exit for health-related reasons), we may assume that in many cases this is related to the emergence of care responsibilities.
Finally, given pension reforms across Europe that have not only restricted workers' possibilities and financial incentives to retire early but also firms' possibilities to send older workers into early retirement (and that have resulted in higher actual ages of retirement in more recent cohorts; e.g. Ebbinghaus and Hofäcker Reference Ebbinghaus and Hofäcker2013), we may expect the prevalence of involuntary retirement to have decreased for more recent retirement cohorts (Hypothesis 10a).
Hypotheses for involuntary work
Involuntary work is conceptualised in this study as the result of unexpected or abrupt changes in circumstances that force individuals to revise their retirement plans. Such shocks may derive from pension reforms that introduce stronger penalties for early retirement or increase the minimum age at which a pension can be drawn. From this perspective, we predict involuntary work to have become more prevalent for more recent retirement cohorts (Hypothesis 10b). Other factors that may lead to involuntary work are poor working conditions and occupational health risks, which may undermine the capacity and motivation to work. We may hence expect those working in lower-status occupations, who tend to be more strongly exposed to occupational health hazards,Footnote 1 to be more at risk of involuntary work (Hypothesis 1d). Finally, late parenthood or divorce can increase the odds of involuntary work, assuming that these events create the financial need to continue working. Testing this contention is difficult with the data at hand, however, because we cannot determine the timing of these events (we only know whether parenthood or a divorce ever occurred throughout the life course). Similarly, we cannot test the impact of partners' joint retirement behaviour nor of care needs that arise before the expected retirement age, due to a lack of information about such events and the partners' situation in the data.
Method
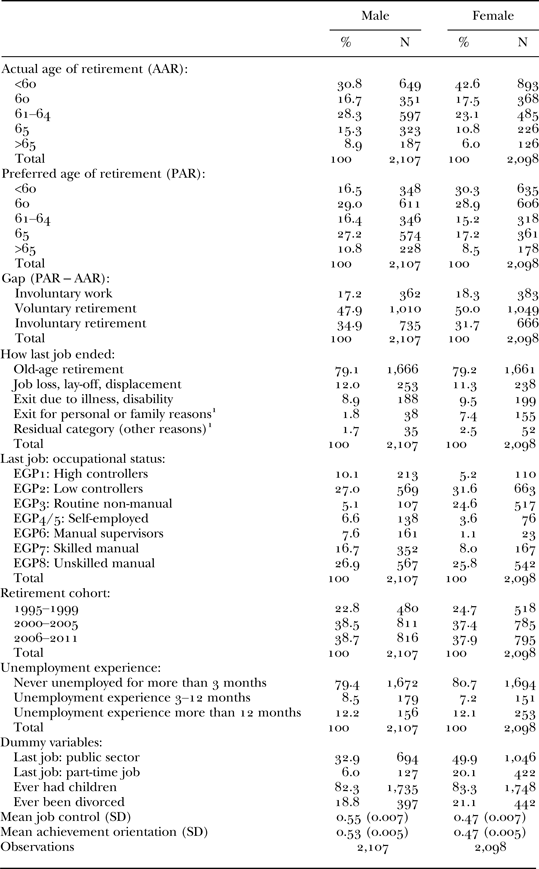
We run regression analyses to identify the determinants of AAR, PAR and the degree to which they overlap. Preferred ages of retirement are heavily clustered: 56 per cent of our male and 46 per cent of our female sample prefer to retire at the ages of 60 or 65 (see Table A1 in the Appendix). The pattern is similar in most of the countries studied.Footnote 2 For this reason, we use multinomial logistic regression models (MLM) to estimate the relative odds of five retirement options: retiring before age 60, at age 60, at ages 61–64, at age 65 and after age 65. MLM are preferred over ordered logit models because we expect early retirement decisions to be shaped by different factors than decisions concerning continued work until or beyond age 65. In line with this expectation, we find the proportional odds assumption of ordered models to be violated (Brant test). The degree of congruence between PAR and AAR is modelled using the three-category variable described above that distinguishes between involuntary work, voluntary retirement and involuntary retirement. The results from the MLM are presented as marginal effects.
For this part of the analysis, we use data from 23 European countries (the 12 countries included in the descriptive analyses plus Belgium, Croatia, Cyprus, Estonia, Ireland, Lithuania, Norway, Poland, Portugal, Slovenia and Switzerland). The countries have established different ‘retirement regimes’ (Ebbinghaus and Hofäcker Reference Ebbinghaus and Hofäcker2013), some of which entail persistent early exit cultures (e.g. France or Spain) whereas others encourage late retirement (e.g. Sweden or Switzerland). Differences across countries in terms of pension policies and retirement cultures can have important contextual effects on both PAR and AAR. We control for enduring differences between retirement regimes by including country fixed effects in all models. Estimating separate models for women and men, we can account for the fact that retirement regimes are (still) gendered in some countries (Ebbinghaus and Hofäcker Reference Ebbinghaus and Hofäcker2013: 815). A limitation of this approach is that the country fixed effects cannot control for changes in statutory pension ages or early exit options in the observed retirement window (1995–2011). From 1990 to 2010, most European countries have introduced pension reforms that restricted early retirement options, introduced incentives for later retirement, or adjusted eligibility conditions or pension benefits to changes in life expectancy (Kohli and Arza Reference Kohli, Arza, Binstock and Goerge2011: 256). Since such reforms can be observed in most of the countries, we may assume similar trend effects across countries that we seek to account for by including retirement cohorts as controls. In fact, very few of the interactions between countries and cohorts in our study are significant (three out of 44), so that we can assume country effects to have remained sufficiently stable over time. Moreover, the fixed-effects approach is deemed preferable over a two-level model that includes a set of macro-level indicators describing pension policy configurations, because it allows us to control for all time-invariant differences between countries, including welfare system characteristics and labour market conditions.
The explanatory variables include earlier experiences in the life course such as the characteristics of retirees' past employment careers and of their last jobs as well as some aspects of their family history (had children, had a divorce). In terms of the continuity of employment careers, we have information on whether respondents had ever experienced a spell of unemployment, and whether this spell lasted for less than three months, 3–12 months or more than a year. Moreover, we know how respondents' last job ended. This is captured by the survey question: ‘Which of the reasons shown on this card best describes your main reason for leaving your last employer?’ The answers were recoded into: (1) the reference category retirement (‘I retired’); (2) late-career job loss (‘I was made redundant or dismissed’, ‘my employer stopped operating’, ‘my own/family business was closed/sold’, ‘my contract ended’); (3) health-related exit (‘illness or disability’); (4) exit for personal or family reasons (‘personal or family reasons’); and a residual category (‘other reasons’). The latter is retained as a control, but due to small cell sizes estimates of its effect are omitted from the regression tables (for a description of the sample, see Table A1 in the Appendix).
To characterise the last job before labour market exit, we draw on the EGP scheme of occupational status that has been developed for cross-national research (Erikson, Goldthorpe and Portocarero Reference Erikson, Goldthorpe and Portocarero1979). We use the Stata command ‘iskoegp’ to transform information on respondents’ occupation according to the International Standard Classification of Occupations (four-digit ISCO-88), a differentiation between dependent employment and self-employment, and the presence of supervisory duties (‘In your main job, did you have any responsibility for supervising the work of others?’) into an EGP-based scheme that differentiates EGP1: higher-grade professionals, administrators and managers; EGP2: lower-grade professionals, technicians, administrators and managers; EGP3: routine non-manual employees; EGP4/5: employers and self-employed workers; EGP6: lower-grade technicians and supervisors of manual workers; EGP7: skilled manual workers; and EGP8: non-skilled manual workers. Agricultural work and agricultural self-employment are excluded from the analysis. Additional information on the last job in the ESS pertains to employment in the public or private sector and to working hours. Working hours were measured by the survey question: ‘Regardless of your basic or contracted hours, how many hours did you normally work a week (in your main job), including any paid or unpaid overtime?’ We defined part-time work as working less than 30 hours per week.
To account for gender-specific retirement patterns, we run separate regression models for women and men. We run two sets of nested models, keeping sample sizes constant across different model specifications: (a) the parsimonious models include only the more objective characteristics of past employment careers and jobs; (b) to test some of the mechanisms hypothesised to underlie the effects found in the parsimonious models, respondents' achievement orientation and the intrinsic quality of their last job and are entered as covariates. The former draws on items from the Schwartz Human Values Scale designed to measure achievement orientation (Bardi and Schwartz Reference Bardi and Schwartz2003). We use the following two indicators: Recognition (‘How much is this person like you? It's important to him/her to show his/her abilities. S/he wants people to admire what s/he does') and Success (‘How much is this person like you? Being very successful is important to him/her. S/he hopes people will recognise his/her achievements'). The two indicators correlate at r = 0.51. To measure job quality, we compute a summative index of three indicators of job control (Cronbach's alpha = 0.85): ‘How much did the management at your work allow you: (a) to decide how your own daily work was organised?; (b) to influence policy decisions about the activities of the organisation?; (c) to choose or change your pace of work?’ (0 = no control to 1 = complete control). Job control is considered a key dimension of intrinsic job quality in the sociological literature that is associated with skilled work tasks, greater opportunities for self-realisation through work, work motivation and employment commitment (Gallie and Zhou Reference Gallie, Zhou and Gallie2013; Steiber Reference Steiber and Gallie2013). The assumption underlying our research design that retrospective information about the characteristics of the last job before retirement is accurate is evidence-based. Collecting longitudinal data, Beehr and Nielson (Reference Beehr and Nielson1995) show that job characteristics described by individuals before and after retirement strongly correlate. In other words, retrospective accounts of specific job characteristics such as job control are highly consistent with reports of the same characteristics when the person had still done the job. Details on the characteristics of our sample are provided in Table A1 in the Appendix.
Findings
Findings for male retirees
Men who used to be self-employed (EGP4/5) or to work in high-status occupations (EGP1) tend to prefer a later retirement than those who used to be employed in low-status occupations (EGP8; see Table 3, Model 1, support for Hypotheses 1b, 2a and 2b). Having been self-employed increases the probability of preferring to retire later than at age 65 by 0.11. Part-time work in the last job is also found to be associated with a higher probability of preferring to retire after age 65. Those who used to work in the public sector, by contrast, are found to be more likely to prefer early retirement before age 60 than their private-sector counterparts (support for Hypothesis 3a). Turning to factors related to the continuity of work careers, we find the expected effect of disrupted careers. Having experienced a spell of unemployment of more than 12 months increases the probability of preferred retirement at age 65 by 0.07 (support for Hypothesis 5a). The involuntary loss of the last job shows no effect on preferences (lack of support for Hypotheses 6a and 6b), suggesting that late-career job loss tends to be an exogenous shock that is not associated with the characteristics of those affected.
Multinomial logistic regression models of preferred ages at retirement, 1995–2011, male retirees

Notes: Shown are marginal effects; country fixed effects included but not shown. The sample includes 2,107 retirees from 23 European countries who retired at age 50 or later, excluding those who used to work in agriculture. Exit for family reasons excluded due to small cell size (see Table A1 in the Appendix). Reference categories are in parentheses. Pseudo R 2 for Model 1 = 0.13 and for Model 2 = 0.14.
Significance levels: * p < 0.05, ** p < 0.01.
Model 2 shows the regressions for men's PAR that include additional controls for respondents' achievement orientation and for the intrinsic quality of their last jobs. In line with expectations, both variables are significantly associated with a higher likelihood of preferring late retirement. Moreover, in line with assumptions on the mediating role of these factors, they are able to explain a good part of the effects of occupational status observed in Model 1 (i.e. the marginal effects of EGP1 and of self-employment are rendered non-significant). This supports the contention that entrepreneurs and those working in higher-status occupations prefer later retirement because they tend to have jobs of higher intrinsic quality (note that the mediation works through job control, not achievement orientation).Footnote 3 Neither the public-sector effect nor the effects of part-time work or unemployment shown in Model 1 appear to be mediated by these factors. Finally, we do not find significant effects of family-related events on PAR (lack of support for Hypotheses 8a, 8b, 9a and 9b).
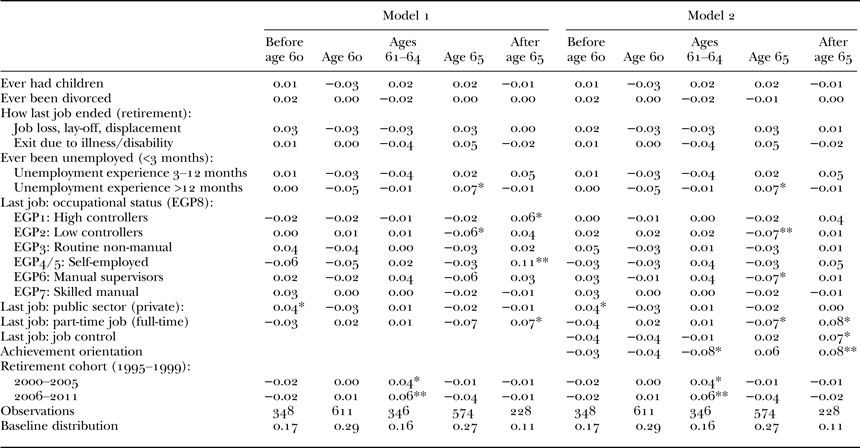
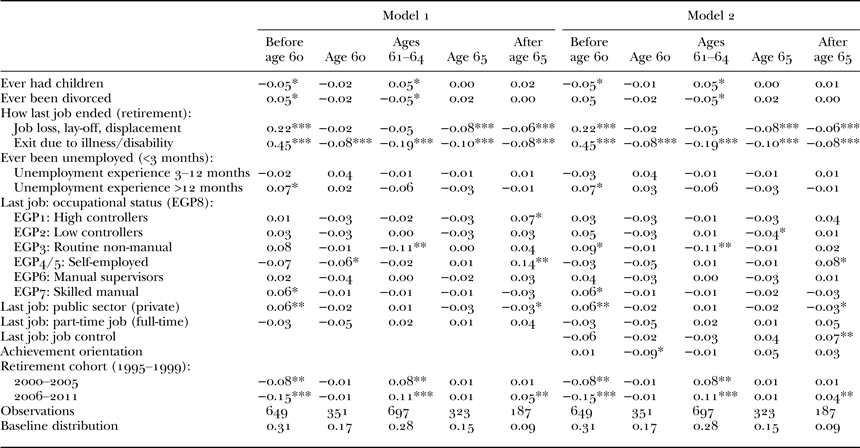
Turning to men's AAR (Table 4, Model 1), we find that the preferences for longer working lives among those who worked in high-status occupations and the self-employed largely align with their retirement behaviour. Having been self-employed, for example, increases the probability of having worked beyond age 65 by 0.14. Conversely, having worked in the public sector increases the probability of having retired before age 60 by 0.06, which also corresponds with PAR. The determinants of PAR and AAR differ in some other respects, however.
Multinomial logistic regression models of actual age at retirement, 1995–2011, male retirees

Notes: Shown are marginal effects; country fixed effects included but not shown. The sample includes 2,107 retirees from 23 European countries who retired at age 50 or later, excluding those who used to work in agriculture. Exit for family reasons excluded due to small cell size (see Table A1 in the Appendix). Reference categories are in parentheses. Pseudo R 2 for Model 1 = 0.16 and for Model 2 = 0.16.
Significance levels: * p < 0.05, ** p < 0.01, *** p < 0.001.
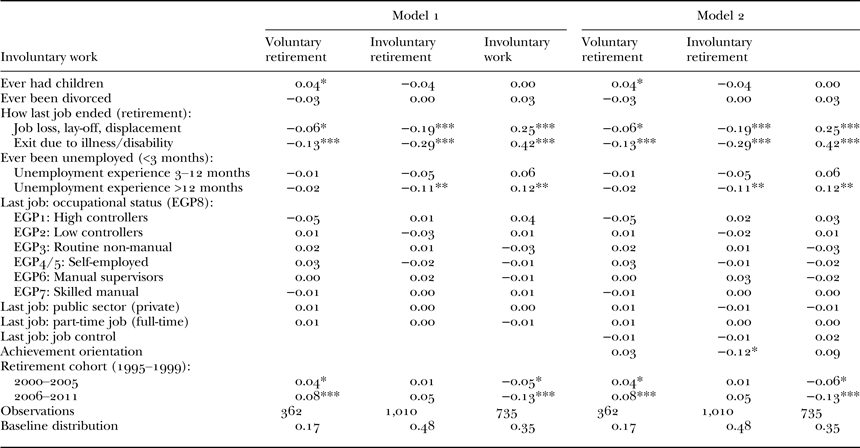
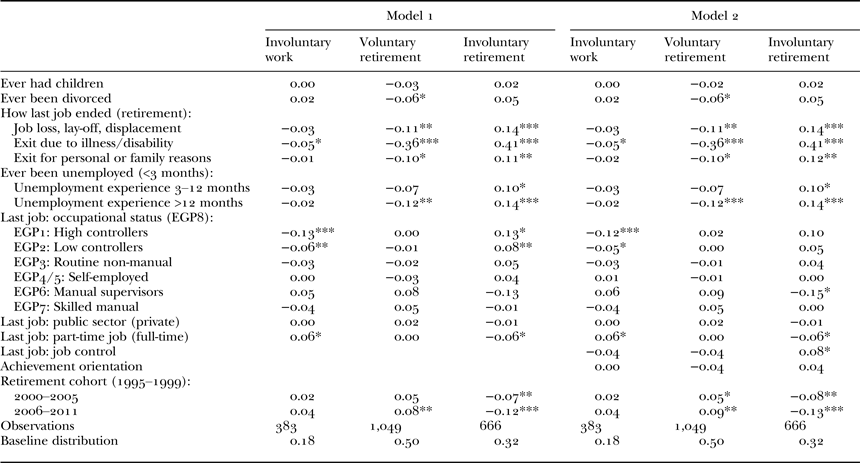
For instance, while we do not find an association between late-career job loss and PAR (Table 3), those who were laid off from their last job are significantly more likely to have taken early retirement, and less likely to have worked until the age of 65 (Table 4). A similar pattern is found for those who lost or gave up their last job for health reasons (illness/disability). Such exits show no association with PAR, yet they are significantly associated with higher probabilities of earlier retirement. As a result, we find strong effects of these exit pathways on the likelihood of involuntary retirement (Table 5; support for Hypotheses 6d and 7c). Those affected by a long spell of unemployment during their careers tend to prefer a later exit (Table 3), yet they show a higher probability of early retirement below age 60 (Table 4). Given this discrepancy between preferences and behaviour, the experience of unemployment is found to increase the risk of involuntary retirement significantly (support for Hypothesis 5c).
Multinomial logistic regression models of the degree of congruence, 1995–2011, male retirees

Notes: Shown are marginal effects, country fixed effects included but not shown. The sample consists of 2,107 retirees from 23 European countries who retired at age 50 or later, excluding those who used to work in agriculture. Reference categories are in parentheses. Pseudo R 2 for Model 1 = 0.11 and for Model 2 = 0.11.
Significance levels: * p < 0.05, ** p < 0.01, *** p < 0.001.
While we find little difference between retirement cohorts on men's preferences, those who have retired more recently have tended to retire later. The probability of having retired before age 60 is 0.15 lower for those who have retired between 2006 and 2011 compared to those who have retired in the second half of the 1990s (Table 4). This is in line with evidence of a reversal of early retirement patterns in more recent cohorts (Ebbinghaus and Hofäcker Reference Ebbinghaus and Hofäcker2013). As a result, the risk of involuntary retirement has significantly dropped in more recent cohorts while the risk of involuntary work has significantly increased (Table 5; support for Hypotheses 10a and 10b).
Finally, fathers appear to be more at risk of involuntary work than childless men. This may be related to adult children's continuing need for financial support, the costs of late parenthood or fathers' desire to have more time for grand-parenting.
Findings for female retirees
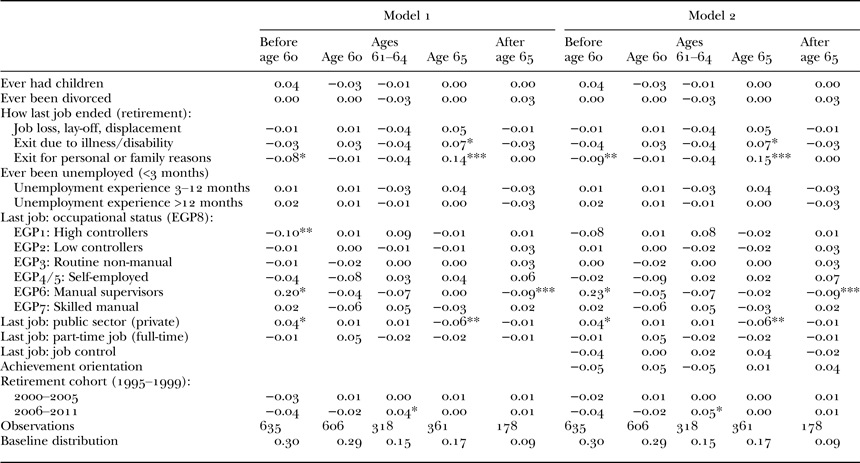
Similar to our results for men, we find the predicted effects of occupational status and public-sector employment (see Table 6, Model 1). Those who used to work in high-status occupations (EGP1) are significantly less likely to prefer retirement before age 60, while the reverse is found for manual workers (EGP6, support for Hypothesis 2a). Those who used to work in the public sector are significantly more likely to prefer retirement before age 60 and less likely to prefer retirement at age 65 (support for Hypothesis 3a). In contrast to what we find for men, self-employment and part-time employment are not found to affect women's retirement preferences, suggesting that these forms of employment have gendered qualities. Late-life part-time employment is less likely to be linked to arrangements of phased retirement for women than men. While some men may use part-time work in their late careers to realise a preference for a longer working life, for women, part-time work in the last job is more likely to be the continuation of a part-time career. The finding that self-employment increases men's but not women's PAR was predicted based on the assumption that women's motivation for self-employment is less strongly linked to the quest for self-directed work than men's and more strongly linked to work–life balance goals. Moreover, in contrast to men, women show higher probabilities of preferring to work until age 65 when they left their last job for health reasons (lack of support for Hypothesis 7a), personal or family reasons.
Multinomial logistic regression models of preferred age at retirement, 1995–2011, female retirees

Notes: Shown are marginal effects; country fixed effects included but not shown. The sample includes 2,098 retirees from 23 European countries who retired at age 50 or later, excluding those who used to work in agriculture. Reference categories are in parentheses. Pseudo R 2 for Model 1 = 0.19 and for Model 2 = 0.19.
Significance levels: * p < 0.05, ** p < 0.01, *** p < 0.001.
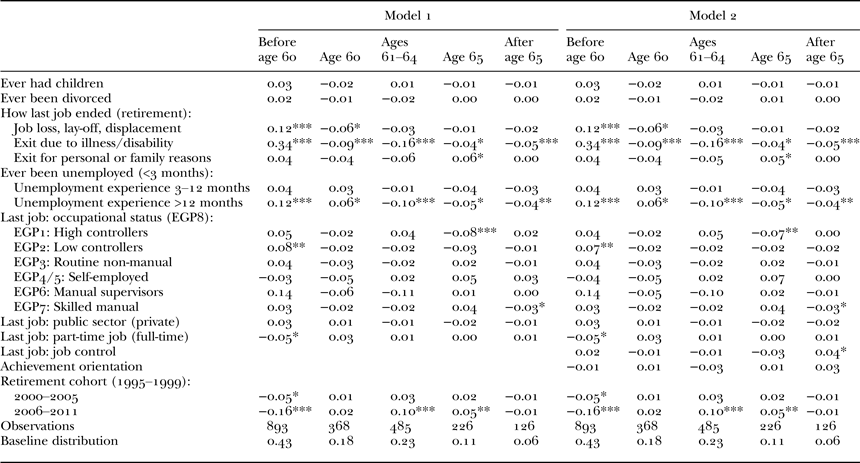
Results for women's actual retirement behaviour (Table 7) and its match with preferences (Table 8) are similar to those for men with regard to the effects of disrupted employment careers. Those affected by late-career job loss or unemployment tend to retire earlier – a behaviour that is not reflected in their PAR. As a result, these groups face an increased risk of involuntary retirement (support for Hypotheses 5c and 6d). Women who ended their last job for reasons related to illness or disability or for personal or family reasons also show a significantly higher likelihood of involuntary retirement. This supports the contention that a labour market exit due to poor health is perceived as involuntary when continued work is made impossible by restricted employment chances (support for Hypothesis 7c). Contrary to expectations, women who used to be employed in high-status occupations are found to have a significantly higher risk of involuntary retirement than their counterparts in lower-status occupations (lack of support for Hypothesis 1d). The reverse is found for female part-timers, who show a lower probability of involuntary retirement and a higher probability of involuntary work than their counterparts whose last job involved full-time hours (lack of support for Hypothesis 4d). Finally, we observe a positive trend effect on AAR in the more recent cohorts of female retirees, and a decreasing risk of involuntary retirement (Hypothesis 10a).
Multinomial logistic regression models of actual age at retirement, 1995–2011, female retirees

Notes: Shown are marginal effects; country fixed effects included but not shown. The sample includes 2,098 retirees from 23 European countries who retired at age 50 or later, excluding those who used to work in agriculture. Reference categories are in parentheses. Pseudo R 2 for Model 1 = 0.21 and for Model 2 = 0.21.
Significance levels: * p < 0.05, ** p < 0.01, *** p < 0.001.
Multinomial logistic regression models of the degree of congruence, 1995–2011, female retirees

Notes: Shown are marginal effects, country fixed effects included but not shown. The sample consists of 2,098 retirees from 23 European countries who retired at age 50 or later, excluding those who used to work in agriculture. Reference categories are in parentheses. Pseudo R 2 for Model 1 = 0.10 and for Model 2 = 0.10.
Significance levels: * p < 0.05, ** p < 0.01, *** p < 0.001.
Discussion
The results of this study corroborate the view that retirement preferences cannot be read off from behaviour (‘revealed preference approach’): we find a high prevalence of mismatch between the age at which Europeans prefer to retire and the age at which they actually retire. Substantial shares of the population either retire earlier than they would prefer (involuntary retirement) or retire later than they would prefer (involuntary work). The share of men who retired in the period 1995–2011 and who are affected by either of these two types of mismatch exceeds 50 per cent in many of the countries studied. The observation that retirement behaviour is often not in line with stated preferences (and related to this outcome: that preferred retirement is shaped by different factors than actual retirement) suggests that retirement decisions are often made in the context of heavily constrained options.
On the one hand, we find evidence for employment constraints, as reflected in the high share of older workers who retire early although they would like to continue working. Our regression analyses identify risk factors for the experience of involuntary retirement including employment histories that involve late-career job loss, unemployment, illness or disability. This suggests that a substantial share of early retirement is not due to the attractiveness of early retirement regimes (‘pull factors’ such the availability of financially viable pathways for an early exit from work) but to a lack of employment opportunities for older workers (‘push factors’ such as poor health or low re-hiring rates of older workers upon late-career job loss; Ebbinghaus and Hofäcker Reference Ebbinghaus and Hofäcker2013). Moreover, the finding that health-related exits from the labour market tend to be involuntary suggests that those who gave up their last job for health reasons would in many cases have preferred continued employment under other circumstances (e.g. had they been given the chance to re-train, to change jobs and carry out different work tasks, to obtain better working conditions, or had they been able to work part-time).
On the other hand, we find evidence for retirement constraints as reflected in the substantial shares of older workers who would have preferred to retire earlier than they had the chance to. While we were able to identify some key predictors of involuntary retirement such as disrupted employment careers and health-related labour market exits, we were less successful in identifying risk factors of involuntary work (i.e. fatherhood and part-time work for women). In any case, we find that this type of mismatch has become more prevalent among more recent cohorts and we may speculate that it will further increase in the future, in the light of pension system reforms that raise statutory age thresholds and tighten retirement benefits (Arza and Kohli Reference Arza, Kohli, Arza and Kohli2008) and that put increasing pressure on older workers to continue working despite a lack of decent jobs for them.
From the perspective of current efforts to increase the age at which older workers retire, involuntary retirement may be perceived as the more relevant issue (it prevents older workers contributing to a society's productivity and welfare), yet this view overlooks that involuntary work may bar people from other socially productive activities, e.g. care work or volunteerism.
The finding of high rates of mismatch between preferred and actual ages of retirement in Europe is highly policy relevant in light of the research, discussed in the Introduction, which alerts us to the very negative consequences of involuntary life course transitions. In normative terms, we may argue that liberal and democratic societies should maximise their members' possibilities for choice and for living according to their preferences (to the extent that these are reasonable). It is true that ‘you can't always get what you want’ (Schellenberg and Silver Reference Schellenberg and Silver2004). In view of the challenges posed by ageing societies, retirement decisions have to be made under resource constraints. Still, retirement is not just a consumption good like any other but one of the key life course phases. As such, it is an important part of the moral economy of the life course, in other words, of the implicit moral ‘contract’ between the individual and society that rewards a long period of work in adulthood with income security in old age (Kohli Reference Kohli1987). Individuals who have worked throughout their lives under the assumption that they will eventually benefit from publicly funded retirement should not at the end be deprived of it. When pension systems need to be reformed for fiscal reasons, older workers should at least be given enough time to assemble an alternative funding base for their retirement and to anticipate other potential changes caused by retirement in terms of time use and social relationships. Moreover, if individuals need to remain employed until higher ages it will be important to improve older workers' job opportunities (more jobs), to improve their working conditions and the intrinsic quality of their jobs (better jobs) and to create opportunities for re-training for those affected by health limitations (different jobs). Such developments would increase the share of older workers with preferences for late retirement (thus reducing voluntary early retirement and involuntary work) while allowing those who would like to continue working until older ages to do so (thus reducing widespread involuntary retirement). As corroborated by the present study, jobs of higher quality are conducive to the development of preferences for longer working lives and later retirement.
The majority of older European workers who are currently approaching retirement prefer to retire before the age of 65 (Hofäcker Reference Hofäcker2015), which could be taken as evidence that behavioural patterns of early retirement are based on preferences for exits before the legal retirement age. Yet, as evidenced by the high prevalence of involuntary exits, it is important to note that workers' preferences are only one factor shaping behavioural outcomes (supply-side explanation); the other key factor is the availability of jobs (demand-side explanation). As noted by Hayward (Reference Hayward1986, 1034), ‘it may be the opportunities for continued employment associated with a particular occupation rather than the financial attractiveness of retirement per se that induces early retirement’. To date, these insights from empirical social research are not yet given due consideration in policy discussions. Policy makers across Europe continue to retain a strong focus on ‘reforming’ the financial incentive structure of early retirement.
Acknowledgements
The authors gratefully acknowledge the support of the MacArthur Foundation Research Network on an Aging Society. An early version of this article was presented at a network meeting in Chicago, USA, June 1, 2012. We thank the network members for their valuable feedback. Part of the study was carried out when Nadia Steiber held a Marie Curie Fellowship at the European University Institute (EUI), San Domenico di Fiesole, Italy.
Appendix
Description of sample characteristics