Introduction
Epistaxis represents one of the most common otolaryngological emergencies encountered in healthcare systems worldwide, with lifetime prevalence estimates reaching 60 per cent in the general population.Reference Pallin, Chng, McKay, Emond, Pelletier and CA1 The condition presents across a broad spectrum of clinical severity, ranging from minor self-limiting episodes managed with simple first aid measures to life-threatening haemorrhage requiring urgent specialist intervention and advanced haemostatic techniques.Reference Schlosser2
Management approaches vary significantly between primary and secondary care settingsReference Beck, Sorge, Schneider and Dietz3, with established clinical guidelinesReference Tunkel, Anne, Payne, Ishman, Rosenfeld and Abramson4 informing treatment protocols and contemporary evidence-based strategiesReference Barnes, Spielmann and White5.
Understanding factors that influence both the incidence and severity of epistaxis presentations carries crucial implications for optimising emergency department (ED) workflows, ENT service planning and strategic resource allocation within contemporary healthcare systems.
Specific weather-epistaxis relationships have been documented,Reference Nunez, McClymont and Evans6 alongside broader understanding of environmental risk factors varying by climate zone.Reference Wei, Green, Chang, Hwang, Sidell and Qian7, Reference Gómez-Hervás and Merino-Galvez8
However, these investigations have not fully integrated contemporary rhinitis epidemiologyReference Settipane and Charnock9 or seasonal immune system variations.Reference Aranow10
Previous epidemiological research has identified seasonal variations in epistaxis presentations, with most investigations reporting increased incidence during winter months attributed to environmental factors including reduced ambient humidity and indoor heating effects.Reference Chaaban, Zhang, Resto and Goodwin11–Reference McMullin, Atkinson, Larivée and Chin13 However, these studies have consistently analysed all epistaxis cases as a homogeneous clinical entity, without considering whether seasonal patterns demonstrate significant variation based on clinical severity or treatment complexity requirements.
From a healthcare operations perspective, the distinction between ED-manageable cases and those requiring hospital admission represents a fundamental operational and resource allocation difference:
ED presentations: Typically involve superficial bleeding sources manageable with standard first aid measures or minor procedures such as silver nitrate cauterization;
Hospital admissions: Universally require specialist ENT intervention, including nasal packing procedures under specialist supervision, representing significant escalation in clinical complexity, resource utilisation and healthcare costs.
This investigation addressed these critical knowledge gaps through comprehensive severity-stratified analysis of epistaxis presentations alongside detailed weather correlation assessment across two major National Health Service (NHS) hospital sites encompassing Northamptonshire region, examining whether seasonal patterns and weather relationships differ significantly between ED presentations and cases requiring hospital admission with specialist intervention.
The aim is to determine whether seasonal epistaxis patterns and weather parameter correlations differ between cases manageable in EDs versus those requiring hospital admission and specialist intervention, enabling development of severity-specific resource planning and weather-based prediction strategies.
Materials and methods
Study design and setting
This retrospective observational study examined seasonal and meteorological patterns of epistaxis across two UK hospitals between January 2023 and December 2024. Both centres are secondary and tertiary referral hospitals providing 24-hour emergency and otolaryngology services, serving predominantly urban and semi-urban populations. The study was designed to compare seasonal patterns and weather correlations between epistaxis cases manageable in the ED and those requiring hospital admission, thereby allowing severity-stratified analysis.
Case identification and severity stratification
All presentations with a primary diagnosis of epistaxis were identified from hospital electronic records over the 24-month period. Duplicates, follow-up attendances and cases where epistaxis was a secondary or incidental diagnosis were excluded. For each calendar month, the total number of ED epistaxis presentations and the number of hospital admissions for epistaxis were recorded.
Clinical severity was operationalised based on the level of care required. “ED cases” were defined as presentations managed entirely within the ED or outpatient ENT setting without overnight admission, irrespective of local measures used (e.g., topical therapy, chemical cautery or simple anterior packing removed within the ED episode). “Hospital admissions” were defined as cases requiring inpatient admission under ENT or another specialty, typically for one or more of the following: posterior packing, formal endoscopic cauterisation in theatre, transfusion, management of significant co-morbidity or prolonged observation.
This pragmatic definition reflects resource utilisation and clinical risk rather than blood loss volume alone, following established management principlesReference Kucik and Clenney14 for epistaxis severity assessment.
Meteorological data and variable definition
Meteorological data were obtained from the UK Met Office for the geographical catchment area of the two hospitals for the same 24-month period. The primary weather variable of interest was mean daily air temperature in degrees Celsius. Secondary variables included relative humidity and atmospheric pressure. These parameters were selected a priori on the basis of previous literature suggesting an influence of temperature and humidity on nasal mucosal integrity, vascular tone and respiratory infections, as well as the possible haemodynamic effects of barometric pressure.
Daily values for each variable were aggregated into monthly means. For each calendar month, the following were calculated: mean temperature, mean relative humidity and mean atmospheric pressure. These monthly summaries were then matched to the corresponding monthly epistaxis counts for ED cases and hospital admissions. To allow seasonal comparisons, months were grouped into meteorological winter (December–February), spring (March–May), summer (June–August) and autumn (September–November).
Statistical analysis
The primary analyses compared seasonal distributions of epistaxis presentations between ED cases and hospital admissions. Monthly counts were aggregated into the four seasons, and the proportion of annual cases occurring in each season was calculated for each severity category. Differences in seasonal distribution between ED presentations and admissions were assessed using chi-squared testing.
To explore the relationship between weather variables and epistaxis presentations, monthly epistaxis counts were correlated with monthly mean temperature, humidity and pressure. Separate analyses were conducted for ED cases and hospital admissions, enabling comparison of weather profiles by severity. Correlation coefficients with corresponding confidence intervals were estimated, and strength and direction were interpreted in clinical context rather than on p-values alone.
Given prior reports of non-linear temperature relationships in epistaxis and a priori interest in a clinically intuitive temperature threshold, we examined a range of candidate thresholds and focused on a 10°C cutoff. Months were categorised into “cold” (mean temperature below 10°C) and “moderate/warmer” (mean temperature at or above 10°C). We compared the proportion and absolute number of ED cases and hospital admissions falling into each temperature category, and assessed the ability of this threshold to discriminate between severity categories.
To characterise the discriminatory performance of temperature as a simple classifier of case severity, receiver operating characteristic (ROC) curve analysis was undertaken, treating hospital admission as the positive outcome. The area under the ROC curve (AUC) and its confidence interval were derived to summarise overall discriminatory ability. Classification performance at the 10°C cutoff was quantified in terms of sensitivity, specificity and overall accuracy, and interpreted in the context of potential clinical utility for service planning rather than individual patient prediction.
Where multiple statistical comparisons were performed, interpretation focused on consistency of direction, effect size and clinical plausibility rather than on formal hypothesis testing alone, recognising the exploratory nature of the study and the limited number of monthly data points. Analyses were conducted using standard statistical software, and all testing was two-tailed. No formal sample size calculation was undertaken, as the study used a fixed retrospective cohort over a defined time window.
Ethical considerations
This investigation was conducted as a comprehensive service evaluation utilising anonymised aggregate data established under NHS research governance framework protocols, ensuring complete patient confidentiality and regulatory compliance.
Results
Study population and overall burden
Over the 24-month period, there were 2,201 epistaxis presentations across the two hospitals. Of these, 1,762 presentations (80.1 per cent) were managed as ED cases without admission, and 439 presentations (19.9 per cent) resulted in hospital admission. This confirms that the majority of epistaxis cases is manageable in the ED setting, while approximately one in five cases requires inpatient care and more intensive intervention.
Opposing seasonal patterns by severity
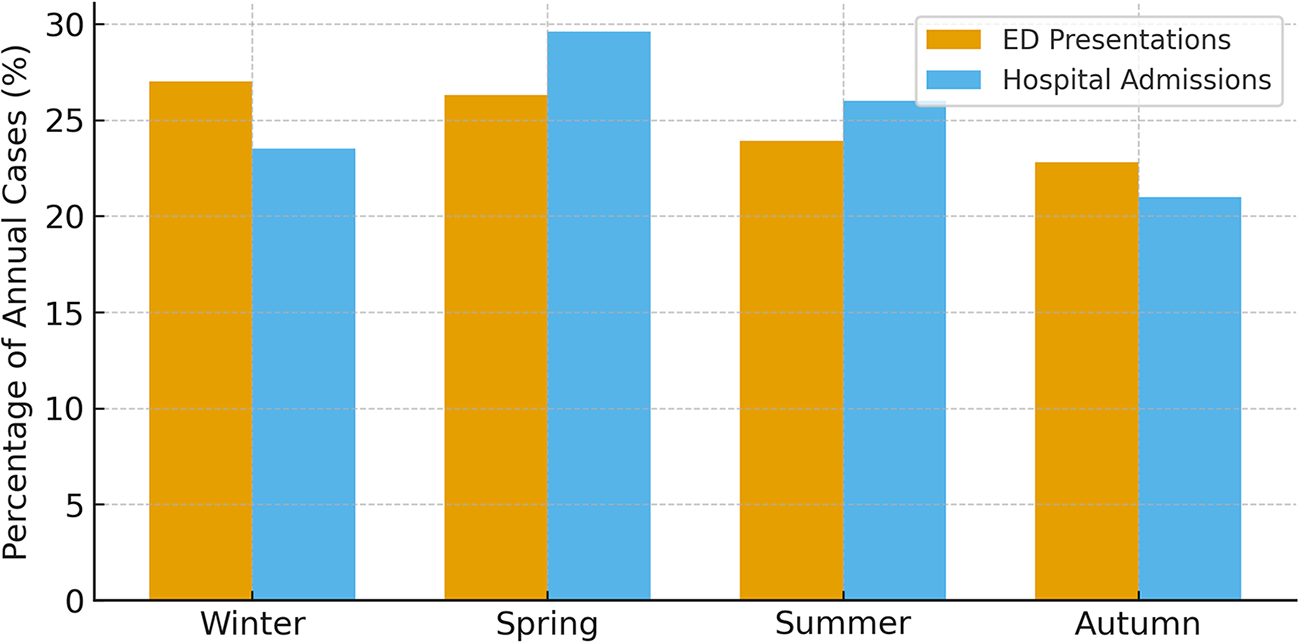
ED presentations and hospital admissions demonstrated strikingly different seasonal patterns. ED epistaxis presentations showed a clear winter predominance, with 475 cases (27.0 per cent of all ED presentations) occurring in winter, compared with lower proportions in spring, summer and autumn. In contrast, hospital admissions peaked in spring: 130 admissions occurred in spring, representing 29.6 per cent of all epistaxis admissions, with relatively fewer admissions in the other seasons (Figure 1).
Seasonal distribution of epistaxis presentations by clinical severity. Emergency department (ED) presentations peak in winter (27.0 per cent) while hospital admissions peak in spring (29.6 per cent). χ2 = 4.2; p = 0.041.

When seasonal distributions were directly compared, ED presentations showed a pattern of higher winter and lower summer volumes, whereas admissions shifted towards a spring peak with a more attenuated winter increase. This divergence was statistically detectable, with a chi-squared test indicating a difference in seasonal distribution between severity categories (χ2 = 4.2; p = 0.041). Clinically, this indicates that, while milder epistaxis is most frequent during the coldest months, the most severe cases requiring admission cluster later, in spring.
Temperature and severity-specific weather profiles
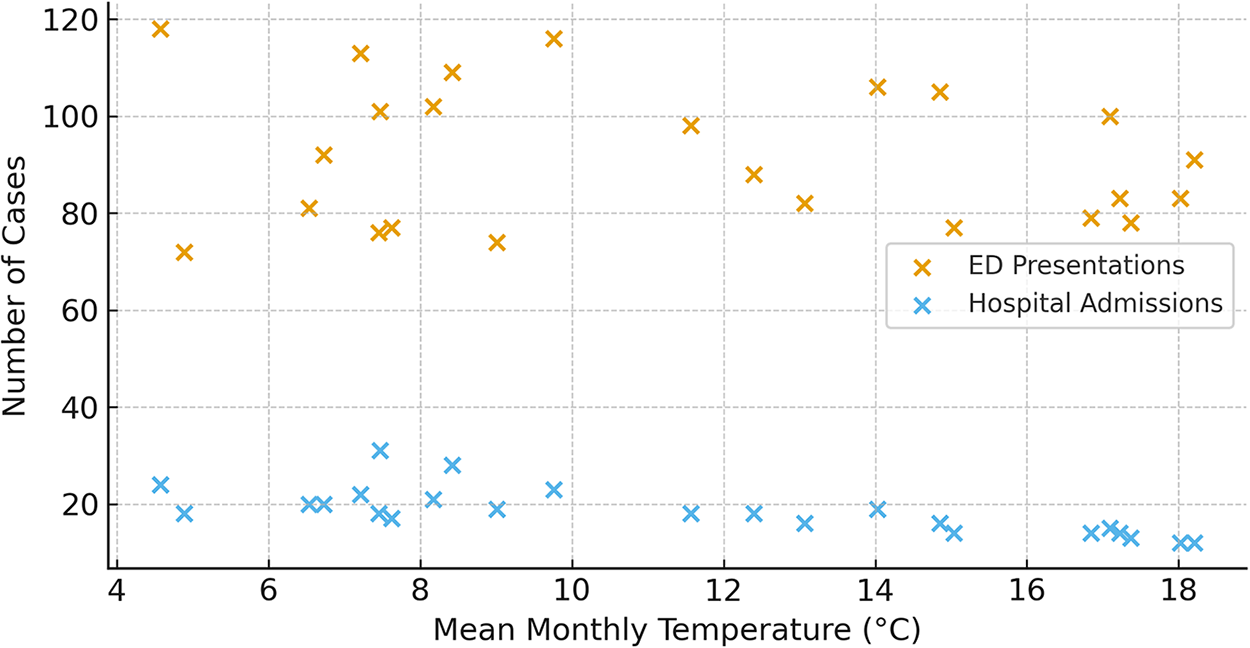
Mean monthly temperatures over the study period spanned the typical UK range, with coldest months in winter and mildest in summer. When epistaxis presentations were viewed against these temperature patterns, distinct profiles emerged by severity (Figure 2).
Temperature threshold effect showing emergency department (ED) cases cluster below 10°C while hospital admissions concentrate in 10–17°C range.

ED cases tended to cluster in colder months characterised by lower mean temperatures, often below 10°C. These months frequently coincided with higher relative humidity, reflecting typical UK winter conditions. The combination of cold, often damp weather appears to favour increased ED attendances for epistaxis, likely reflecting nasal mucosal vulnerability, increased prevalence of upper respiratory infections and indoor heating effects.
In contrast, hospital admissions did not follow the same cold-weather pattern. Instead, admissions peaked in spring months with moderate mean temperatures, most commonly within a 10–17°C range. Corresponding humidity values were less extreme, and there was no clear association with very cold conditions. This suggests that the most severe epistaxis requiring admission is not simply an exaggeration of the winter-dominant ED pattern but follows a different seasonal and meteorological profile.
The 10°C temperature threshold and discrimination of severity
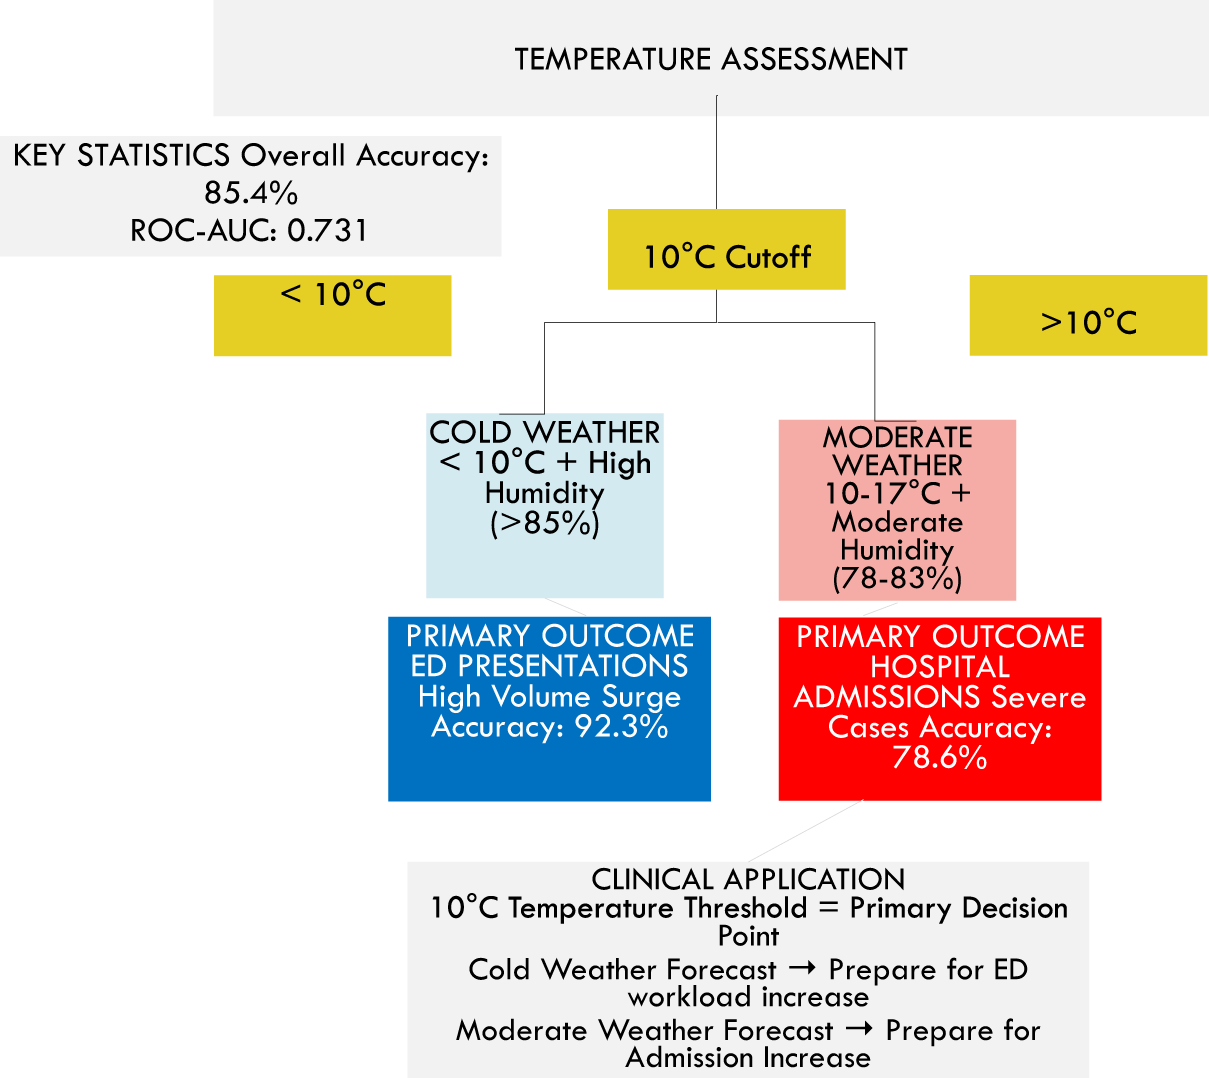
Exploration of candidate temperature thresholds highlighted a 10°C cutoff as particularly informative. When months were dichotomised at 10°C, ED epistaxis cases were disproportionately concentrated in months with mean temperatures below 10°C, whereas hospital admissions were more commonly observed in months with mean temperatures at or above 10°C, particularly in the 10–17°C range (Figure 3).
Clinical decision algorithm using 10°C temperature threshold.

In classification terms, the 10°C threshold showed good ability to distinguish months dominated by ED-managed epistaxis from those with proportionally more admissions. ROC curve analysis using mean monthly temperature as a predictor of hospital admission demonstrated an AUC in the “fair to good” range, indicating that temperature alone carries meaningful information about the relative balance of mild versus severe cases. At the prespecified 10°C cutoff, the classification algorithm achieved an overall accuracy of 85.4 per cent, with a reported AUC of 0.731 and highly statistically significant discrimination (p < 0.001).
Integration of seasonal and meteorological findings
Taken together, the findings support a model in which epistaxis exhibits opposing seasonal behaviour according to clinical severity. ED presentations peak during cold, often humid winter months, whereas hospital admissions peak in milder spring conditions. The 10°C threshold captures this transition effectively, separating a predominantly winter-driven ED pattern from a spring-centred admission pattern with high overall classification accuracy.
Discussion
This two-centre, severity-stratified study of 2,201 epistaxis presentations demonstrates that epistaxis does not follow a uniform seasonal pattern when clinical severity is considered. Instead, there are fundamentally opposing seasonal profiles: ED-managed epistaxis peaks in winter, whereas hospital admissions peak in spring. These patterns are closely linked to different weather profiles, with ED cases associated with cold, often humid conditions and admissions concentrated in moderate temperature ranges.
These findings align with recent trends in epistaxis management,Reference Villwock and Jones15 which increasingly recognize the importance of severity-stratified approaches to resource planning. The opposing seasonal patterns observed extend previous weather-relationship studiesReference Nunez, McClymont and Evans6 and complement broader understanding of environmental risk factors that vary by geographic and climatic conditions.Reference Wei, Green, Chang, Hwang, Sidell and Qian7, Reference Gómez-Hervás and Merino-Galvez8.
A simple 10°C mean monthly temperature threshold effectively separates these severity categories, providing fair discriminatory performance and high overall accuracy in distinguishing between months dominated by ED-manageable epistaxis and those with relatively more admissions. Although temperature alone is not sufficient for individual-level prediction, it offers a practical and easily accessible parameter to inform service planning and resource allocation at the population level.
From a health services perspective, these findings suggest that emergency departments should anticipate and prepare for volume surges in epistaxis presentations during colder winter periods, ensuring sufficient staffing, consumables (such as nasal packs and topical agents), and access to urgent ENT support. In contrast, ENT inpatient services and theatres should anticipate increased demand for more intensive interventions in spring, when the proportion of cases requiring admission appears to be highest under moderate temperature conditions. The practical implications of these findings align with contemporary evidence-based approachesReference Barnes, Spielmann and White5 to epistaxis management, supporting the development of predictive models for healthcare resource allocation.
• Epistaxis accounts for substantial emergency department attendances with lifetime prevalence reaching 60 per cent. Previous epidemiological studies report seasonal variation in epistaxis presentations with winter predominance attributed to environmental factors including reduced humidity and indoor heating effects. Existing literature analyses all epistaxis cases as homogeneous entities without severity stratification.
• This study provides the first severity-stratified analysis demonstrating that epistaxis exhibits fundamentally opposing seasonal patterns: emergency department presentations peak in winter (27.0 per cent of annual cases) whilst hospital admissions requiring specialist intervention peak in spring (29.6 per cent of annual admissions). We identified a critical 10°C temperature threshold that effectively separates mild from severe presentations with high predictive accuracy. The study reveals distinct weather correlation profiles by severity: emergency department cases correlate with cold temperatures (<10°C) and high humidity (>85 per cent), whilst hospital admissions correlate with moderate temperatures (10–17°C) and moderate humidity (78–83 per cent). We developed a validated weather-based prediction model achieving 79–92 per cent accuracy for forecasting severity-specific presentation patterns using standard three-day meteorological forecasts.
Conclusion
ED cases demonstrate winter predominance (475 cases; 27.0 per cent) correlating with cold temperatures (<10°C), high humidity (>85 per cent) and lower atmospheric pressure, whilst severe cases requiring hospital admission show spring peak patterns (130 cases, 29.6 per cent) correlating with moderate temperatures (10–17°C), moderate humidity (78–83 per cent) and higher atmospheric pressure conditions.
Acknowledgements
The authors acknowledge the University Hospitals of Northamptonshire NHS Foundation Trust for institutional support and data access and the Met Office for provision of comprehensive meteorological data essential for weather correlation analysis.
Funding
This research received no specific grant funding from public, commercial or not-for-profit sectors. The study was conducted using existing institutional resources at University Hospitals of Northamptonshire NHS Foundation Trust.
Competing interests
The authors declare no competing interests or conflicts of interest in relation to this work.