Introduction
Depressive disorders are an important public health problem because they are highly prevalent and adversely affect quality of life (QoL) and levels of disability (Kessler et al. Reference Kessler, McGonagle, Zhao, Nelson, Hughes, Eshleman, Wittchen and Kendler1994; Offord et al. Reference Offord, Boyle, Campbell, Goering, Lin, Wong and Racine1996; Bijl et al. Reference Bijl, Ravelli and van Zessen1998; Ayuso-Mateos et al. Reference Ayuso-Mateos, Vazquez-Barquero, Dowrick, Lehtinen, Dalgard, Casey, Wilkinson, Lasa, Page, Dunn and Wilkinson2001). It has been projected that in the future they will be the second most frequent cause of years lost to disability in the world (WHO, 2001). The impact of depression on patients' well-being and QoL has been shown to be equal to, or greater than, that of several other major chronic medical conditions (Wells & Sherbourne, Reference Wells and Sherbourne1999; Sprangers et al. Reference Sprangers, de Regt, Andries, van Agt, Bijl, de Boer, Foets, Hoeymans, Jacobs, Kempen, Miedema, Tijhuis and de Haes2000; Bonicatto et al. Reference Bonicatto, Dew, Zaratiegui, Lorenzo and Pecina2001).
Cases of depression are classified into subgroups according to the criteria of the International Classification of Disorders (ICD), to facilitate treatment planning in the clinical situation. The ICD-10 (WHO, 1992) categorizes episodes of depressive disorder into two types: ‘single’ and ‘recurrent’. Each episode is, in turn, classified according to level of severity: ‘mild’, ‘moderate’, ‘severe’, ‘severe with psychotic features’ and ‘unspecified severity’. The level of severity is defined according to the ICD-10 by the number of depressive symptoms. The sum of these symptoms, which produces the total score used to determine the level of depression, does not take into consideration the type of symptoms that the patient presents. In other words, according to the current categorical system, patients who present symptoms such as plans to commit suicide, depressed mood for 2 weeks, increased fatigue and reduced concentration and attention, but who do not present disturbed sleep, diminished appetite, decreased interest and ideas of guilt and unworthiness, would have a ‘mild’ level of depression. On the contrary, patients endorsing eight of the nine symptoms, but without suicidal thoughts, would have a diagnosis of ‘severe’ depression. The only exception is the presence of psychotic symptoms, which changes the level of severity to ‘severe with psychotic features’ regardless of the number of depressive symptoms.
It is assumed that the more severe the level of the depressive episode, the greater likelihood the episode will be associated with lower QoL, even though little empirical evidence exists to support this. The distribution of QoL in the depressed population has been relatively little studied (Kruijshaar et al. Reference Kruijshaar, Hoeymans, Bijl, Spijker and Essink-Bot2003). Several studies have provided evidence for a continuum in the impact on QoL (e.g. Ravindran et al. Reference Ravindran, Matheson, Griffiths, Merali and Anisman2002; da Silva Lima & de Almeida Fleck, Reference da Silva Lima and de Almeida Fleck2007) as the severity of depression increases but they have generally used limited samples, considering its small size, the procedure of recruitment or the diagnostic method, and above all they have not been focused on the distinction of depression severity according to the criteria of the World Health Organization (WHO).
It has been suggested that ‘mild’ depression may be an unnecessary category because it is limited in time, the impact on QoL that it produces is low, and it would be diagnosed with low frequency in clinical samples compared with population samples (Keller et al. Reference Keller, Klein, Hirschfeld, Kocsis, McCullough, Miller, First, Holzer, Keitner and Marin1995; Dowrick et al. Reference Dowrick, Casey, Dalgard, Hosman, Lehtinen, Vazquez-Barquero and Wilkinson1998). Hence, there is interest in studying whether subjects with mild depression constitute a different sample from individuals without a depressive disorder, according to the QoL that they present.
The aim of this study was to analyse whether the type of depression (single or recurrent) and the different levels of severity (mild, moderate, severe), as defined by ICD-10, correlate with the impact on a person's QoL. The null hypothesis was that recurrent episodes and higher levels of severity of depression would have a greater negative impact on QoL.
Method
Subjects
The sample for this study comprised 551 persons: 238 without depression diagnosis constituting the control group, and 313 endorsing a diagnosis of depressive episode. Data were obtained from the Outcome of Depression International Network (ODIN) project. This project is a multi-centre epidemiological study designed to provide reliable and valid data on the prevalence, risk factors and outcome of depressive disorders within the European Union, based on an epidemiological sampling framework, and also to assess the impact of psychological interventions on the outcome of depression. A detailed description of the aims and methods of the study is provided elsewhere (Dowrick et al. Reference Dowrick, Casey, Dalgard, Hosman, Lehtinen, Vazquez-Barquero and Wilkinson1998; Ayuso-Mateos et al. Reference Ayuso-Mateos, Vazquez-Barquero, Dowrick, Lehtinen, Dalgard, Casey, Wilkinson, Lasa, Page, Dunn and Wilkinson2001).
The study was undertaken in five countries and nine geographical areas, and included a total sample of 8764 individuals. Each centre identified one rural and one urban setting in which to conduct its research. Community study samples were identified through census registers or lists of patients registered with primary care physicians. The different research teams involved made the choice on which sampling procedure to use based on their previous experience in community surveys. The overall response rate for the first phase of the survey was 65%, which included variations by study site, ranging from 54% (rural Ireland) to 90% (urban Spain).
Procedure
A two-phase sampling procedure (Dunn et al. Reference Dunn, Pickles, Tansella and Vazquez-Barquero1999) was adopted in the ODIN study. The first phase consisted of the use of mental health screening instruments and the collection of sociodemographic and medical data. This screening phase included the Beck Depression Inventory (BDI; Beck et al. Reference Beck, Ward, Mendelson, Mock and Erbaugh1961), with a cut-off score >12 (Lasa et al. Reference Lasa, Ayuso-Mateos, Vazquez-Barquero, Diez-Manrique and Dowrick2000), and the General Health Questionnaire (GHQ-12; Goldberg et al. Reference Goldberg, Gater, Sartorius, Ustun, Piccinelli, Gureje and Rutter1997). The second phase included offering all of those scoring at or above the BDI threshold, and a random 5% of responders below the threshold, a detailed interview with the Schedules for Clinical Assessment in Neuropsychiatry (SCAN) version 2.0 (WHO, 1994). The SCAN was used to generate diagnoses of depressive disorders on the basis of ICD-10 and DSM-IV categories.
Health-related QoL was assessed using the 36-item short form of the Medical Outcome Study (MOS) General Health Survey (SF-36; Stewart et al. Reference Stewart, Hays and Ware1988; Ayuso-Mateos et al. Reference Ayuso-Mateos, Lasa, Vazquez-Barquero, Oviedo and Diez-Manrique1999). The SF-36 has been shown to be a valid and reliable measure of QoL in depressed patients, with a high internal consistency for most subscales (ranging from 0.7 in the pain dimension to 0.9 in the physical functioning) (Ayuso-Mateos et al. Reference Ayuso-Mateos, Lasa, Vazquez-Barquero, Oviedo and Diez-Manrique1999). The translations of the SF-36 into several different languages have been shown to be culturally appropriate and comparable in their content (Vilagut et al. Reference Vilagut, Ferrer, Rajmil, Rebollo, Permanyer-Miralda, Quintana, Santed, Valderas, Ribera, Domingo-Salvany and Alonso2005). In the SF-36 higher scores indicate better QoL.
Controls were the individuals who had scores <12 in the BDI, no diagnosis at the SCAN, and had completed at least six of the eight subscales on the SF-36 questionnaire (n=238). Cases were persons with an ICD-10 diagnosis of depressive disorder following the SCAN interview. These included single and recurrent depressive episodes (F 32, F 33) that were mild, moderate or severe on the SCAN (n=313), and they had completed at least six of the eight subscales of the SF-36 questionnaire. The severe level included the subjects diagnosed as having severe depression with psychotic features (n=6, 1.1% of the total sample). The final sample sizes for the depression severity groups were: mild (n=132), moderate (n=124), and severe (n=57).
Statistical analysis
Statistical comparisons (χ2 for categorical variables and one-way ANOVAs for continuous variables) were performed to test for differences across groups in the main characteristics (age, gender, distribution by country, marital status, rural versus urban setting, presence versus absence of long-term illness or disability, and number of days sick during the past 6 months) of the groups of depression severity. A series of ANOVAs was then performed to study the differences between levels of severity in each of the eight subscales on the SF-36. Post-hoc analyses (Scheffé when homoscedasticity could be assumed, Games–Howell when it could not) were performed to test for differences between specific groups. Effect sizes (Hedges' g) were calculated for each paired comparison. These analyses (ANOVAs and post-hoc tests) were then repeated, controlling for age, gender, country, marital status, setting, presence of long-term illness or disability and number of days sick during the past 6 months, as it has been suggested that these variables affect the level of QoL and could be confounders of the effect of depression severity (Bijl & Ravelli, Reference Bijl and Ravelli2000; Kruijshaar et al. Reference Kruijshaar, Hoeymans, Bijl, Spijker and Essink-Bot2003; Buist-Bouwman et al. Reference Buist-Bouwman, Ormel, de Graaf and Vollebergh2004; Jorngarden et al. Reference Jorngarden, Wettergen and von Essen2006). Age and number of days sick were entered as covariates, and the remaining potential confounders were included as independent variables in the model, and the main effects of severity of depression were examined.
To test whether the level of severity of depression was associated with a greater number of symptoms, measured by the BDI scores, a univariate ANOVA was performed comparing the four groups of severity with the BDI score as a dependent variable. Moreover, to test the interaction of BDI scores and level of depression with extent of QoL, correlation analyses were performed separately for each group of severity between the BDI score and each of the eight SF-36 subscales.
The potential effect of different covariates on QoL was also analysed with a multiple-indicators multiple-causes (MIMIC) model in which a two-latent factor model of QoL (mental and physical) was assumed, with four indicators for factor, and several 0–1 dummy variables were introduced as covariates on the second-order QoL latent factor: gender (women as the reference category); age in years; presence of disability; diagnosis of depression; and marital status (dichotomizing as not widowed versus widowed and using not widowed as the reference category). These analyses were conducted in AMOS version 7.0 (Arbuckle, Reference Arbuckle2006). The asymptotically distribution-free (ADF; Browne, Reference Browne1984) estimator was used, which does not assume multivariate normality of the measured variables. According to the usual recommendations on using several indices to assess fit (Reise et al. Reference Reise, Widaman and Pugh1993), given the sensitivity to sample size shown by χ2, the assessment of the model was based on multiple criteria: (a) χ2, (b) the comparative fit index (CFI), (c) the goodness-of-fit index (GFI), (d) the Tucker–Lewis index (TLI), and (e) the root mean square error of approximation (RMSEA). A good fit is indicated by low values for χ2, values >0.90 for CFI, GFI and TLI, and values <0.06 for RMSEA (Bentler, Reference Bentler1990).
Finally, t tests for independent samples were carried out to compare mean SF-36 scores between persons with recurrent depression and persons with a single episode. All analyses were performed with the statistical package SPSS release 14.0 (SPSS Inc., USA).
Results
The comparison of demographic characteristics across levels of depression severity indicated statistically significant differences in age [F(3, 547)=6.6, p<0.001], marital status [χ2(9)=56.3, p<0.001], distribution across countries [χ2(12)=127.9, p<0.001] and setting [χ2(3)=8.3, p=0.040]; there were no statistically significant differences according to gender [χ2(3)=2.2, p=0.539]. The depressed groups were older [mean age of 43.9 (s.d.=10.5) years for the severe depression group and 44.9 (s.d.=11.1) years for the moderate depression group] than the control group [mean=40.1 (s.d.=12.6) years], with no differences across levels of severity; a higher proportion of individuals who were separated or divorced was related to higher levels of depression; people with severe or moderate depression were more prevalent in the UK and Ireland and less prevalent in Spain; and there were more people with severe or moderate depression living in an urban setting. There were statistically significant differences across the severity groups in the percentage of persons with long-term illness or disability [χ2(3)=91.3, p<0.001], with higher percentages for the mild and moderate depression groups (30.2% and 34.6%, respectively) and lower percentages for the control (15.9%) and severe depression (19.2%) groups. There were also statistically significant differences across the severity groups in the number of days sick during the past 6 months [F(3, 288)=11.0, p<0.001]. According to the post-hoc analyses, the control group reported less days sick (mean=1.46, s.d.=0.84) than the depression groups, without differences between the groups of people with depression.
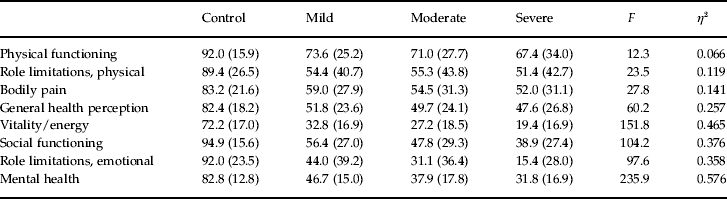
The one-way ANOVAs with depression severity as the independent variable and the eight subscales of the SF-36 as dependent variables resulted in significant differences (p<0.001) in all cases (see Table 1), with effect sizes (η2) ranging between 0.07 and 0.26 for the physical health variables and between 0.36 and 0.58 for the mental health variables. Post-hoc analyses (with p set to 0.00625 (0.05/8) controlling for type I errors associated with multiple comparisons) indicated that the control group had statistically significantly higher scores (i.e. better QoL related to health status) on all of the eight subscales compared with the rest of the groups, with large effect sizes (e.g. ranging between 0.94 and 2.57 for the paired comparisons between controls and mild depression groups) (specific results for each paired comparison available on request from the corresponding author); with no differences between the three levels of severity in people with depression, except for the subscale of mental health between mild and moderate depression, with a lower score for the moderate depression group [p<0.001, g=0.53, 95% confidence interval (CI) 0.60–1.26] and significantly lower scores for the severe group compared with the mild group in emotional role limitations (p<0.001, g=0.79, 95% CI 0.46–1.11), social functioning (p<0.001, g=0.64, 95% CI 0.32–0.96), vitality/energy (p<0.001, g=0.79, 95% CI 0.47–1.11) and mental health (p<0.001, g=0.95, 95% CI 0.62–1.28). There were no statistically significant differences between the moderate and severe depression groups.
Comparison of SF-36 mean scores according to the severity of depressive symptoms

Scores given as mean (standard deviation).
All F's had p<0.001.
Allowance for confounders in the ANOVAs led to qualitatively similar conclusions. When these analyses were carried out introducing all the confounders into the model, the main effect of severity remained significant (p<0.001) for the eight SF-36 subscales, and the same pattern of specific differences between groups in post-hoc comparisons was found.
ANOVA comparing BDI scores between the groups of depression severity indicated a significant effect [F(3, 546)=450.6, p<0.001]. Post-hoc analyses showed that the control group had a significantly (p<0.001) lower score (BDI mean 3.62, s.d.=3.4) than the remaining groups; the mild depression group (BDI mean=21.4, s.d.=7.7) had significantly lower scores than the severe group (p<0.001) but without differences compared with the moderate depression group (p=0.365, BDI mean=22.8, s.d.=7.3); and the severe group (BDI mean=29.3, s.d.=2.9) had significantly higher scores than the rest of the groups (p<0.001).
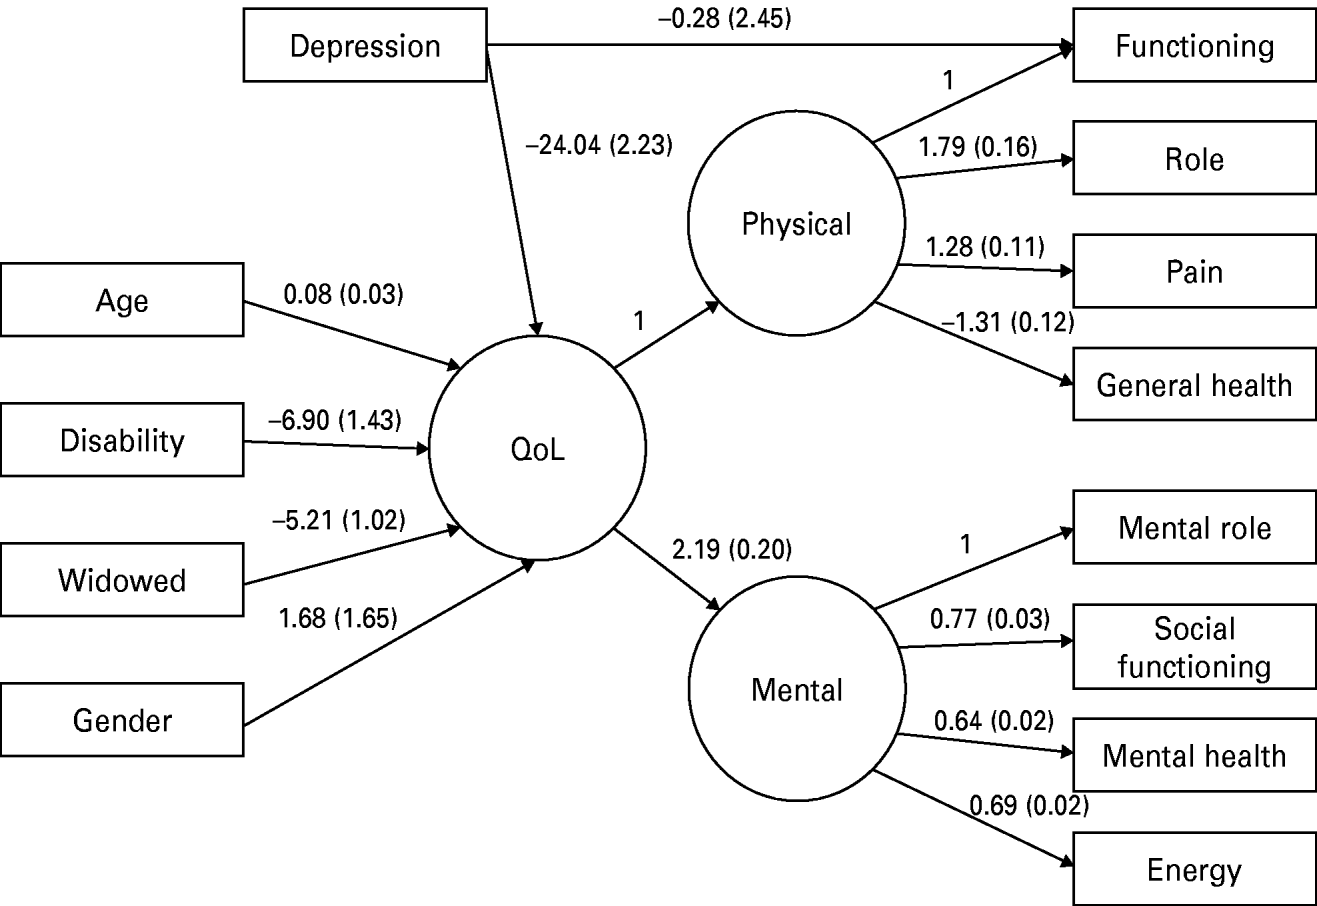
The MIMIC model including covariates presented a moderately adequate fit to the data: CFI=0.925, GFI=0.992, TLI=0.887, χ2/df=4.601, RMSEA=0.081. Given that the interest here was in analysing the effects of factors related to QoL, no further corrections were made on the model to improve the fit. All regression weights were statistically significant (p<0.01), except for the direct path from depression status to one specific indicator of QoL. The model with the unstandardized weights and standard errors is depicted in Fig. 1 (specific results for each paired comparison available on request from the corresponding author). The direction of the weights indicates that depression status, being widowed, the presence of disability, being older, and being a woman are related to a decreased QoL.
The multiple-indicators multiple-causes (MIMIC) model. Depression and covariates effects on the quality of life (QoL) latent structural model: unstandardized weights. Standard errors are given in parentheses.

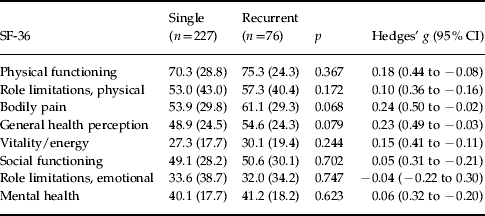
Finally, comparisons of means according to the type of depression (single depressive episode versus recurrent depression) indicated that there were no statistically significant differences between these two groups for any of the eight SF-36 subscale scores (see Table 2). The distribution of cases of mild, moderate or severe depression did not differ significantly between the single- and recurrent-episode depression groups.
Comparisons of SF-36 mean scores between depressed individuals with single or recurrent depression

CI, Confidence interval.
Scores given as mean (standard deviation).
Discussion
The main aim of the present study was to analyse the relationship between level of depression severity and QoL related to health status. It seems clear from the present results that depression has a negative effect, although this effect is not very marked. There were almost no differences between each step from one to the next level of severity of depression. The main differences appeared in the step from normal mood state to depression. At this step QoL deteriorates, and from there generally remains, regardless of the level of severity according to the ICD-10 classification of depression or whether there is a single episode or recurrent depressive episodes.
Depression and QoL
In the sampled studied, the classification of depression into three levels of severity proposed by the ICD-10 is not valid in terms of its impact on QoL. The current system for distinguishing between mild, moderate and severe depression is categorical, involving a simple addition of symptoms, with no consideration of the weight according to its importance or intensity. It could be that different symptoms have different weight in the impact on QoL of depressive subjects, and the inclusion of additional symptoms to those with the highest weights is not indicating an increase in severity of depression.
Recurrent depression was not found to be associated with worse QoL compared with a single episode of depression. This lack of difference in degree of QoL between recurrent and single episodes could be explained, hypothetically, by the fact that individuals with recurrent depression adapt to their situation, and therefore they give more positive answers to the SF-36 than subjects in their first episode. Another hypothesis could be that individuals with recurrent depression ‘know’ their disorder and seek treatment earlier (Merikangas et al. Reference Merikangas, Wicki and Angst1994; Kruijshaar et al. Reference Kruijshaar, Hoeymans, Bijl, Spijker and Essink-Bot2003; Paykel, Reference Paykel2003), or that their health-care professionals ‘know’ their disorder better and therefore treat them earlier and more successfully, so their depressive episodes are shorter, which could increase their QoL, diminishing differences with single depression. The present sample is from a community setting, and could present differences with a clinical setting, where the observation that recurrent depression is more disabling than a single depressive episode was originally made (O'Leary et al. Reference O'Leary, Costello, Gormley and Webb2000).
The comparisons between the categories of depressive episode and severity in the BDI scores also indicated that the threshold between mild and moderate depression could be arbitrary; the control group had lower scores than the rest of groups, severe group had higher scores but there were no differences between mild and moderate.
Validation of the current classifications of depressive episodes
The current model for classification of mood disorders takes the depressive episode as a categorical entity; the model is unitary, with disorders differentiated largely on the basis of severity (Kessing, Reference Kessing2007). The way ICD-10 handles severity has been praised, and recommended for preservation in future editions (Paykel, Reference Paykel2002).
There have been very few studies that validate this classification of severity levels of depressive episodes with other clinical correlates, such as biological markers, prognosis, outcomes and treatment responses. This classification has only been validated by Kessing (Reference Kessing2004), in a sample comprising all psychiatric in-patients in Denmark discharged between 1994 and 1999 with a diagnosis of a single depressive episode, testing its power to predict risk of relapse and suicide, with the result that patients with increasing levels of severity were significantly associated with a higher risk. Hamalainen et al. (Reference Hamalainen, Isometsa, Laukkala, Kaprio, Poikolainen, Heikkinen, Lindeman and Aro2004), in a population study in Finland, showed that more severe depressive episodes are associated with a predictably larger use of health services.
The current classification has been questioned by some researchers (Parker and Manicavasagar, Reference Parker, Manicavasagar, Parker and Manicavasagar2005 a, b; Parker, Reference Parker2006), who argue that the ICD-10 describes depressive disorder as a single condition varying by severity, and that this model has not generated any replicable biological changes or correlates at a satisfactory level, and has not been informative in identifying treatment-specific effects.
In our study, the subjects with mild depressive episodes presented a significant difference in QoL compared with subjects without depression. This difference is greater than that seen between the different severity groups. Moreover, in follow-up studies, it has been reported that mild depressive patients are five times more likely to have depressive disorder after 1 year (Kessing, Reference Kessing2004; Lyness et al. Reference Lyness, Heo, Datto, Ten Have, Katz, Drayer, Reynolds, Alexopoulos and Bruce2006). Mild depression may occur independently of a lifetime history of depressive disorder (Rapaport et al. Reference Rapaport, Judd, Schettler, Yonkers, Thase, Kupfer, Frank, Plewes, Tollefson and Rush2002). Our findings support the necessity of having specific treatment guidelines for mild depressive episodes. The only guidelines that make specific recommendations for mild depressive episodes are the National Institute for Health and Clinical Excellence (NICE) Guidelines (NCCMH, 2004) for treatment of depression in primary and secondary care settings, which are an example of a union of categorical and dimensional approaches. They use a stepped care approach that recognizes the different treatment requirements for different levels of severity of depression as defined in the ICD-10.
Our findings show that, in terms of QoL, the ICD-10 classification of depressive episodes into three levels (mild, moderate and severe) is only validated for the two extremes. We found significant differences between controls and mild depression, scant differences between mild and severe, and almost no difference between mild and moderate and between moderate and severe episodes of depression.
The classification system used to diagnose depressive disorders is very important for determining the epidemiology of the disorders and planning treatment management strategies in health resourcing; and if the classification does not have a proper validation, it is doomed to failure. Current ICD-10 classification of depression severity has only been validated in clinical samples, including in-patients (Kessing, Reference Kessing2004).
In the context of the current revision of classification systems such as DSM-IV and ICD-10, the issues around a dimensional versus a categorical approach towards affective disorders are being increasingly addressed (Judd & Akiskal, Reference Judd and Akiskal2000; Andrews et al. Reference Andrews, Brugha, Thase, Duffy, Rucci and Slade2007; Kessing, Reference Kessing2007). The results of the present work suggest that if a dimension could be assumed to be within the group of depressive disorders (although with a not very steep slope), then there is a point of rarity from no depression to the less severe forms of depression. The discontinuity in QoL between mild depression and not having depression, and then the continuity across severity of depression, indicates that the minimum presentations of depression should be included in diagnostic systems and should merit attention from the health services. Nevertheless, it is not clear whether the threshold established by current systems is capturing the exact point of the discontinuity of impact. Given the potential clinical relevance of identifying persons at risk of depression, research should try to sharpen the distinction between relevant and not-relevant depressive symptoms.
Factors affecting QoL
The data from the MIMIC model also suggest that other factors are related to QoL when they are added to the presence of depression in the model. Specifically, apart from the effect of depression, being widowed, the presence of disability, being older, and being a woman are related to a decreased QoL. Therefore, those characteristics could have a relevant impact on the QoL of the patient, they could be mediating or moderating the effect of depressive symptoms on QoL and would have an impact on patient care. Thus, these results and the adequate fit of the model highlight the idea that depression (versus not depression) is relevant to QoL even when relevant covariates are taken into account, and that a relevant change on impact occurs from normality to depression.
Limitations
Our sample comes from a multi-centre study across five countries, so some results might have been explained by country differences rather than by severity or type of depression; for this reason we controlled by country on all the analyses, together with potential effects on demographic characteristics across samples.
The number of subjects with ‘severe depression with psychotic features’ (n=6) was so small that we were unable to analyse them as a different group and test the hypothesis that the presence of psychotic symptoms could add an aggravating factor to the depressive episode. This is the only weighted symptom in the current ICD classification, and when present the level of depression is automatically severe.
Conclusions
The results of this study support the relationship between level of depression and QoL, but provide indirect evidence against the three thresholds suggested by the ICD-10 for differentiating among different levels of depression. Only the threshold between ‘normal’ and ‘depression’ is clearly established, and among levels of depression, only the extreme poles were clearly distinguished in terms of QoL. We consider that in the re-emergence of this nosology, an expert consensus is an important element for establishing diagnostic guidelines. However, the guidelines need to be empirically validated before introducing major changes in the current classification system.
Acknowledgements
This study was partially supported by the Instituto de Salud Carlos III, Centro de Investigación Biomédica en Red de Salud Mental, CIBERSAM, Spain.
Declaration of Interest
None.