Implications
Methane production by ruminants is becoming an increasing concern due to its contribution to greenhouse gas emissions. Dietary strategies to reduce methane production in terms of supplying dietary supplements can result in pollution swapping, and are therefore not desirable. Researchers examine the effect of changing the ratio of grass and maize silage in addition to changing the amount of starch and fibre in the concentrate. The results obtained are related to national greenhouse gas inventories and potential effects of cropping systems on greenhouse gas emissions along with animal performance.
Introduction
Globally, agriculture, forestry and land use change account for 56% of non CO2 anthropogenic greenhouse gas emissions, with methane (CH4) from enteric fermentation accounting for 36% of this (Smith et al., Reference Smith, Bustamante, Ahammad, Clark, Dong, Elsiddig, Haberl, Harper, House, Jafari, Masera, Mbow, Ravindranath, Rice, Robledo Abad, Romanovskaya, Sperling and Tubiello2014). Production of enteric CH4 by dairy cattle has received considerable attention in recent years because of it having a global warming potential 25 times that of CO2 (Soloman et al., Reference Solomon, Qin, Manning, Alley, Berntsen, Bindoff, Chen, Chidthaisong, Gregory, Hegerl, Heimann, Hewitson, Hoskins, Joos, Jouzel, Kattsov, Lohmann, Matsuno, Molina, Nicholls, Overpeck, Raga, Ramaswamy, Ren, Rusticucci, Somerville, Stocker, Whetton, Wood and Wratt2007). In addition, CH4 represents a loss of ingested gross energy of between 2% and 12% (Johnson et al., Reference Johnson, Huyler, Westburg, Lamb and Zimmerman1994). A recent review by Eckard et al. (Reference Eckard, Grainger and de Klein2010) identified three main approaches to reducing enteric CH4 production by ruminants: (1) animal manipulation, (2) diet manipulation and (3) rumen manipulation. Saetnam et al. (Reference Saetnan, Veneman and Newbold2012) conducted a meta-analysis of dietary additives fed to ruminants and determined that the largest effect on reducing enteric CH4 production was by utilization of electron acceptors, such as nitrate, which form an alternative pathway for hydrogen capture.
In terms of practical solutions, economics and legislative constraints, the simplistic approach to reducing enteric CH4 production is to modify dietary composition. This can be accomplished by altering the proportion of structural (e.g. NDF) to non-structural (e.g. starch) carbohydrates in order to lower rumen pH and promote a more propionic-based fermentation (Russell, Reference Russell1998). Beauchamin et al. (Reference Beauchemin, Kreuzer, O’Mara and Mc Allister2008) suggested that changing from C4 to C3 grasses could lower CH4 production due to the increase in starch and reduction in fibre. Silages can successfully be produced from both C4 and C3 plants – for example, grass (Lolium perenne) and maize (Zea mays), respectively. O’Mara et al. (Reference O’Mara, Fitzgerald, Murphy and Rath1998) reported that substituting maize silage for grass silage can have a concentrate-sparing effect and improve animal performance, although the effect on CH4 production is less well-documented.
In forage-based feeding systems, it is necessary to supplement dairy cows with straights and/or concentrates in order to meet the nutritional requirements of higher genetic merit dairy animals for milk production (AFRC, 1993). Consequently, another method for shifting rumen fermentation to produce a higher proportion of propionate is via altering the composition or amount of the supplementary feed offered, particularly by altering the starch-to-fibre ratio. The aim of the present study was to evaluate the effects of altering the grass silage-to-maize silage ratio and the ratio of starch to fibre in the concentrate on CH4 production, intake, performance and milk composition of lactating dairy cows.
Material and methods
Animals, housing and husbandry
All the animals included in this study were used under license in accordance with the UK legislation (HMSO, 1986). Animals had free access to fresh clean drinking water at all times during the study. Twenty pregnant, multiparous Holstein–Friesian dairy cows yielding 38.4 kg milk/day (s.d. 4.20) and with live weight of 646 kg (s.d. 70.2) were used in a 4×4 Latin square design with four periods of 28 days. Cows were blocked by milk yield, days in milk (mean 129 days, s.d. 17.8) and milk fat content (mean 44.0 g/kg, s.d. 4.68), and were randomly allocated to one of the four dietary treatments in a 2×2 factorial design run as a 4×4 Latin square. Cows were housed in a shed with access to 30 free stalls, four out-of-parlour feeders (OPF) and 18 computerized roughage intake control (RIC; Insentec, Marknesse, the Netherlands) bins, and were bedded on a mixture of lime and recycled paper waste, topped up twice weekly. Free stalls and feed passageways were scraped four times daily using automatic scrapers. Cows were milked twice daily at approximately 0530 and 1630 h through a 40-point internal rotary parlour, with the milk yield automatically recorded at each milking. Cows were identified by the RIC bins and OPF via a transponder, which was re-programmed at the beginning of each experimental period. Cows were weighed and condition scored weekly after the Wednesday pm milking.
Diets
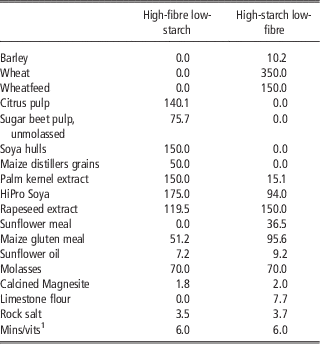
Experimental diets were formulated to meet the dietary requirements of a 700 kg pregnant dairy cow yielding 35 kg milk/day, gaining 0.5 kg/day and consuming 21.3 kg DM/day (Thomas, Reference Thomas2004). Dietary treatments examined the effect of two grass silage (G)-to-maize silage (M) ratios (DM basis) and the effect of two concentrates, one high in NDF and low in starch (F; 385 and 60 g/kg DM, respectively) and the other low in NDF and high in starch (S; 190 and 390 g/kg DM, respectively (Table 1), resulting in four dietary treatments:
G : M (70 : 30)+6.1 kg DM/day F concentrate (GF)
G : M (70 : 30)+6.1 kg DM/day S concentrate (GS)
G : M (30 : 70)+6.1 kg DM/day F concentrate (MF)
G : M (30 : 70)+6.1 kg DM/day S concentrate (MS)
Raw material composition (g DM/kg DM) of the two dietary concentrates

1 Supplies 220 g/kg Ca, 50 g/kg P, 50 g/kg Mg, 70 g/kg Na, 6.5 g/kg Zn, 2.5 g/kg Cu, 4.2 g/kg Mn, 35 mg/kg Se, 60 mg/kg Co, 4010 mg/kg I, 5 00 000 IU Vitamin A, 1 00 000 IU Vitamin D and 3 g/kg Vitamin E as-fed.
The grass silage was harvested on 28 May 2010 from a predominantly perennial ryegrass (Lolium perenne) sward, following an 8-week re-growth period, wilted for 24 h, precision-chopped with a self-propelled forage harvester and ensiled without an additive in a concrete walled, roofed clamp and was ensiled for 60 day before use. The maize silage (Zea mays) was harvested directly with a self-propelled forage harvester and ensiled without an additive in a concrete walled, roofed clamp during September 2009. The silages were covered with a single layer of plastic (Silostop; Bruno Rimini Corp, London, UK) over which were placed tarpaulins weighed down with gravel bags. Both silages were precision-chopped to 3 cm.
In order to balance the dietary supply of CP in the forage mixes, the G was mixed with 22 g/kg DM soya bean meal and 22 g/kg DM molassed sugar beet pulp, and M was mixed with 44 g/kg DM soya bean meal. A mineral premix, supplying; 8 g/kg Ca, 5 g/kg P, 4 g/kg Mg, 2 g/kg Na, 140 mg/kg Zn, 45 mg/kg Cu, 130 mg/kg Mn, 0.6 mg/kg Se, 0.3 mg/kg Co, 5 mg/kg I, 10 000 IU Vitamin A, 2000 IU Vitamin D and 55 mg/kg Vitamin E, was included at the rate of 12 g/kg DM in the forage mixes. The two forage mixes were prepared daily at approximately 0800 h in a mixer wagon (Compact 70; Richard Keenan (UK) Ltd., Stoneleigh Park) and fed through RIC bins that only allowed cows on that forage mix diet to feed. Refusals were collected twice weekly and the feed rate was adjusted to ensure 1.10× previous recorded intake. Sub-samples of the forages were taken twice weekly and dried at 105°C to a constant weight in order to maintain the DM ratio of the forages. The allocation of 7 kg (6.1 kg DM) concentrate/cow per day was fed over three meals a day, via the OPF, with each meal spaced at least 6 h apart.
Experimental routine
The first 21 days of each period allowed the cows to adapt to the diets, and was followed by a 7-day sampling period. During the first 4 days of each period, the concentrates were changed, where appropriate, by a 1.75 kg daily substitution from one concentrate to the other, whereas forage mixes were changed, where appropriate, overnight by re-programming the transponders. On day 8 of the first experimental period, each cow received a previously calibrated permeation tube releasing sulfur hexafluoride (SF6; mean release rate 4.74 mg/day, s.d. 0.47, range 3.97 to 5.76 mg/day) orally, as described by Johnson et al. (Reference Johnson, Huyler, Westburg, Lamb and Zimmerman1994). The permeation tubes (supplied by Agri-Food and Biosciences Institute, Hillsborough) were calibrated at 39°C by recording the weight of the tubes three times weekly for a period of 12 weeks and fitting a regression line to determine daily release of SF6. Tubes that had a r 2 coefficient of <0.995 were not used. On day 1 of each sampling period, cows were fitted with a backpack, which held an evacuated canister (~2000 ml volume), and a head collar to which a calibrated (0.500±0.005 ml/min) flow-restriction capillary tube was attached that connected to the canister. Sub-samples of exhaled and eructed gases were collected over 24 h, with the canisters being changed daily. Four identical sets of collection apparatus were placed throughout the barn in order to determine background concentrations of SF6 and CH4. Once removed, canisters had their remaining vacuum determined and were then over-pressurized with N2 before a being analysed by GLC. Canisters were then flushed with N2 and re-evacuated before use the following day. After 5 days of consecutive gas sampling, the backpacks and head collars were removed.
Sub-samples of silages, straights and concentrates were collected daily throughout the sampling period and stored at −20°C before subsequent analysis. Milk samples were collected from each cow during the Monday pm, Tuesday am, Thursday pm and Friday am milking sessions during the sampling week. Sub-samples of the first two milking sessions were combined proportionally according to yield, the fat content was removed by centrifugation (1000×g at 4°C) and stored at −20°C before subsequent fatty acid (FA) analysis. Individual milk samples were stored at 4°C without a preservative and analysed within 24 h.
Chemical analysis
Samples of forages, straights and concentrates were bulked within each period. Sub-samples of the fresh forages were analysed for pH using a pH meter, ammonia N (NH3-N: MAFF, 1986) and volatile FAs, lactate and ethanol by NIR (Eurofins, Wolverhampton, UK). Feeds were dried to a constant weight at 65°C, and milled to pass through a one-mm screen using a cyclone mill (Cyclotec; FOSS, Warrington, UK). Nitrogen content was determined by the Dumas method (990.03; AOAC, 1995) using an FP 528 analyser (LECO Instruments, Stockport, UK) and was multiplied by 6.25 to determine CP. The NDF and ADF were determined sequentially according to Van Soest et al. (Reference Van Soest, Robertson and Lewis1991), with the use of a heat-stable α-amylase (Sigma, Gillingham, UK) with the omission of sodium sulphite. Feeds were analysed for ash (MAFF, 1986), water-soluble carbohydrates (WSC; MAFF, 1986), starch (Faithfull, Reference Faithfull1990), neutral cellulase digestibility (Alderman, Reference Alderman1985) and gross energy (GE) by adiabatic bomb calorimetry (Parr Instrument Company, Moline, USA). Ether extract was determined using the Soxtex apparatus (Foss, Warrington, UK) and light petroleum ether. Milk samples were analysed for fat, protein and lactose concentrations as well as for total solids (Milkoscan Minor, Foss, Warrington, UK).
Gas samples were analysed for CH4 and SF6 using a GLC (7890 A; Agilent, Wokingham, UK), fitted with a purged packed inlet with a column flow of 30 ml N2/min split 2 : 1 to a micro electron capture detector (1.8 m×3.2 mm molecular sieve 5 A; Grace, Carnforth, UK), for determining SF6, and to a flame ionization detector (1.2 m×3.2 mm Porapak N; Grace), for determinaing CH4. The GLC was calibrated daily with known mixed gas standards (Scott Marrin, Riverside, CA, USA). FA methyl esters in hexane were prepared from milk fat and feeds and were identified by GLC (6890; HP, Wokingham, UK), fitted with a CP-Sil 88 column (100 m×0.25 mm i.d.×0.2 μm film), against reference standards (Sigma), as described previously by Lock et al. (Reference Lock, Teles, Perfield, Bauman and Sinclair2006).
Calculations
Estimated metabolizable energy (ME) was calculated for the grass silage and maize silage using measured NCGD values as described by AFRC (1993). Metabolic live weight was defined as W0.75. Daily CH4 production was calculated using the following equation: CH4 (g/day)=SF6 release rate (g/day)∙(CH4 (μg/m3))/(SF6 (μg/m3)) (Johnson et al., Reference Johnson, Huyler, Westburg, Lamb and Zimmerman1994), after correction for concentrations of ambient gases. Mean daily CH4 production for each animal, within each period, was used as a single value for resultant statistical analysis.
Statistical analysis
Data were analysed using the MIXED procedure of SAS (SAS, 2004) with Satterthwaites correction for degrees of freedom. Data were omitted from one animal due to a predisposition to bloat. Data were fitted to the following model:
 $$Y\,{=}\,\mu {\rm {\plus}FR}_{i} {\rm {\plus}C}_{j} {\rm {\plus}FR\, \bullet\, C}_{{ij}} {\rm {\plus}P}_{k} {\rm {\plus}A}_{l} {\rm {\plus}}{\varepsilon}_{{ijkl}} $$
where Y is the observation, μ the overall mean, FR the effect of forage ratio (i=1 to 2), C the effect of concentrate (j=1 to 2), FR∙C the interaction between forage ratio and concentrate, P the fixed effect of period (k=1 to 4), A the random effect of animal (l=1 to 20), ε the associated error. Treatments were separated using Fisher’s least significant difference, and statistical differences were declared at P⩽0.05.
Results
Feed composition
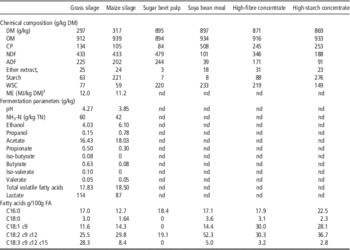
The mean chemical compositions of the forages, straights and concentrates are presented in Table 2. The grass and maize silages had similar DM, NDF, EE, acetate, valerate, total short-chain FA, C18:1 c9 and C18:2 c9 c12 contents. The grass silage had a higher pH and higher concentrations of CP, ADF, WSC, estimated ME, NH3-N propionate, butyrate, lactate, C16:0, C18:0 and C18:3 c9 c12 c15 compared with maize silage. In contrast, maize silage had higher concentrations of OM, starch, ethanol and propanol. The F and S concentrates were similar in DM, CP and EE. In contrast, F had higher NDF (increase of 158 g/kg), ADF, WSC, C18:0, C18:1 c9 and C18:3 c9 c12 c15 concentrations compared with S, whereas S had higher concentrations of OM, starch (increase of 188 g/kg), C16:0 and C18:2 c9 c12 compared with F.
Chemical composition, fermentation parameters and fatty acid composition of the forages, straights and concentrates offered during the experiment

DM=dry matter; OM=organic matter; WSC=water-soluble carbohydrates; ME=metabolizable energy.
1 Estimated ME.
Animal performance
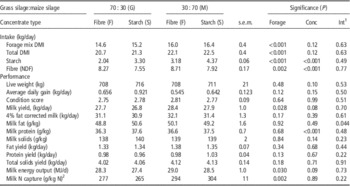
The mean effects of forage ratio and concentrate type on intake and performance are presented in Table 3. Only one interaction was observed with cows offered GF tending to have a lower (P=0.059) milk fat concentration than those offered GS, but no difference was observed between cows offered MF or MS. The DMI intakes, both forage and total, of cows when offered M was higher (P<0.001) compared with G, with no effect of concentrate type. Starch intake was also higher (P<0.001) in cows when offered M than when offered G, and higher (P<0.001) in those receiving S compared with F. Daily NDF intake was higher (P=0.002) for cows when offered M than when offered G and in those offered F compared with S (P<0.001). There was no effect (P>0.05) of dietary treatment on live weight, average daily gain, condition score, 4% fat-corrected milk yield, milk solids concentration, fat yield, protein yield or milk solids yield. Cows offered M yielded an extra (P=0.028) 0.9 kg milk/day compared with G, and there was a tendency (P=0.08) for those offered F to have an increased milk yield compared with S. Milk protein concentration was unaffected by forage mix; however, when cows were offered S, they had a higher (P<0.001) protein concentration than when offered F. Milk energy output was higher (P=0.030) in cows when offered M compared with G, with a tendency (P=0.09) for cows offered F to have a higher milk energy output compared with S. The efficiency of N capture into milk was higher (P=0.002) in cows when offered M compared with G, with no effect of concentrate type.
Mean effects of grass silage-to-maize silage ratio (Forage) and concentrate type (Conc) on intake and performance of dairy cows

1 Int: interaction between forage and concentrate.
2 proportion of dietary nitrogen captured in milk protein.
Methane production
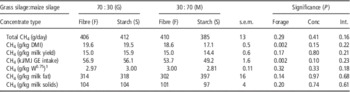
There was no effect (P>0.05) of dietary treatment on total CH4 production, CH4 per kg milk yield, per kg W0.75, per kg milk fat or per kg milk solids (Table 4). However, when CH4 was expressed relative to DMI, CH4 production was 1.7 g/kg DMI lower in cows offered M than G, with no effect of concentrate type. In addition, when CH4 production was expressed relative to total GE intake, cows offered M had a 4 kJ/MJ lower (P=0.002) CH4 production compared with cows offered G, with no effect of concentrate type.
Mean effects of grass silage-to-maize silage ratio and concentrate type on CH4 production of dairy cows

1 Metabolic liveweight.
Milk FAs
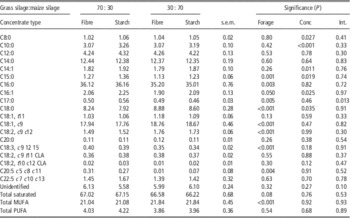
The effects of forage ratio and concentrate type on milk FA profiles are presented in Table 5. There was an interaction observed for C17:0, with cows offered GS having a higher concentration compared with GF (P=0.025), MF (P=0.016) or MS (P<0.001). There was no effect (P>0.05) of dietary treatment on the milk fat concentrations of C12:0, C14:0, C18:1 t11, C20:0, C18:2 c9 tll, C18:2 t10 c12, C22:5 c7 c10 c13 c16 c19, unidentified FA or total poly unsaturated FA (PUFA). Cows offered G had a higher milk concentrations of C15:0 (P=0.001), C16:0 (P=0.003), C16:1 (P=0.050), C17:0 (P=0.005), C18:3 c9 c12 c15 (P<0.001) and C20:5 c5 c8 c11 c14 c17 (P=0.004) compared with those offered M, with a tendency (P=0.08) for a higher concentration of total saturated FA. In contrast, cows offered M had a higher C18:0 (P=0.001), C18:1 c9 (P<0.001), C18:2 c9 c12 (P<0.001) and total monounsaturated FA (MUFA: P<0.001). Cows offered S had a higher milk fat concentrations of C8:0 (P=0.027), C10:0 (P<0.001), C14:1 (P=0.011), C15:0 (P=0.019) and C16:1 (P=0.025) than those offered F, with the converse being observed for C18:0 (P=0.035).
Mean effects of grass silage-to-maize silage ratio and concentrate (conc) type on milk fatty acid composition (g/kg fatty acids) of dairy cows

MUFA=monounsaturated fatty acids; PUFA=polyunsaturated fatty acids.
Discussion
Feed composition
This study examines the effects of changing grass silage-to-maize silage ratio on CH4 production in lactating cattle. The main differences in the concentrates were their starch-to-NDF ratios, although other differences between the concentrates such as WSC, EE and ADF concentrations may have also influenced the results obtained.
The grass silage used in the present study was deemed to be of good quality, because of the moderate NDF and CP concentration, as well as a high ME of 12.0 MJ/kg DM. In contrast, the maize silage had a lower than expected concentration of starch (221 g/kg DM) and increased CP concentration (105 g/kg DM) compared with target values (Sinclair et al., Reference Sinclair, Jackson, Huntington and Readman2005). However, the maize silage utilized here had DM and ME concentrations of 317 g/kg and 11.2 MJ/kg DM, respectively, which were in line with target values.
Animal performance
It has been shown by O’Mara et al. (Reference O’Mara, Fitzgerald, Murphy and Rath1998), Mulligan et al. (Reference Mulligan, Quirke, Rath, Caffrey and O’Mara2002) and Kliem et al. (Reference Kliem, Morgan, Humphries, Shingfield and Givens2008) under similar production systems to those reported here that increasing the proportion of maize silage at the expense of grass silage increases the DMI of lactating cattle. This increased DMI generally results in an increased milk yield, although in the study of Mulligan et al. (Reference Mulligan, Quirke, Rath, Caffrey and O’Mara2002) this was not observed. In addition, O’Mara et al. (Reference O’Mara, Fitzgerald, Murphy and Rath1998) and Mulligan et al. (Reference Mulligan, Quirke, Rath, Caffrey and O’Mara2002) reported an increase in milk protein concentration when maize silage was introduced into the diet, whereas O’Mara et al. (Reference O’Mara, Fitzgerald, Murphy and Rath1998) and Kliem et al. (Reference Kliem, Morgan, Humphries, Shingfield and Givens2008) reported increased milk protein yields. In the present study, an increase in milk yield was also observed when grass silage was replaced by maize silage, principally due to an increase in DMI. In general, cows fed a high-fibre diet have an increased milk fat yield compared with those fed a low-fibre ration (Sutton, Reference Sutton1986); however, in the present study, there was no effect of dietary treatment on daily milk fat yield. Milk fat concentration in the present study was, however, high across all dietary treatments, (mean of 49.7 g/kg) which may be attributed to the late stage of lactation of the cows and to the reduced sensitivity of milk fat synthesis to dietary changes.
In the present study, milk protein concentration increased in cows when offered the higher starch concentrate, an effect that may be attributed to a more propionate-based rumen fermentation (Rook and Balch, Reference Rook and Balch1961). Cattle offered maize silage-based diets were more efficient in terms of N utilization for milk production compared with those offered grass silage. This may be explained by a more efficient use of rumen-degradable proteins in cows when fed the maize silage-based rations or the greater rumen bypass protein content in these diets due to the inclusion of higher concentrations of soya bean meal (AFRC, 1993).
Methane production
Despite there being no treatment differences in total CH4 production reported in this study, it is important to consider other factors such as intake and production as a proxy for efficiency. In this study, increasing the proportion of maize silage decreased CH4 emissions when expressed on a DM or energy intake basis, a finding in agreement with Mills et al. (Reference Mills, Dijkstra, Bannink, Cammell, Kebreab and France2001) and Beuchemin et al. (Reference Beauchemin, Kreuzer, O’Mara and Mc Allister2008), who predicted that increasing the proportion of maize silage, at the expense of grass silage, in the ration of dairy cows would lead to a theoretical reduction in CH4 emissions due to increased performance efficiency.
Benefits from a higher inclusion of maize silage formed part of the basis for the design of the present study, along with the assumption that modifying the ration by changing the dietary constituents, instead of utilizing additives, would be perceived as being better by consumers (Creamer et al., Reference Creamer, Pearce, Hill and Boland2002). It has been shown by Benchaar et al. (Reference Benchaar, Hassabat, Gervais, Chouinard, Petit and Masse2014) and Hassanat et al. (Reference Hassanant, Gervais, Julien, Masse, Lettat, Chouinard, Petit and Benchaar2013) that increasing the proportion of maize silage at the expense of alfalfa and barley silage, respectively, in lactating dairy cows, reduces CH4 emissions on both a DM and GE basis. In both studies, dietary NDF was similar across treatments with an increase in starch due to the increased proportion of maize silage. Hassanat et al. (Reference Hassanant, Gervais, Julien, Masse, Lettat, Chouinard, Petit and Benchaar2013) reported a lower CH4 output per kg milk yield of cows offered 100% maize silage compared with those offered 100 : 0 and 50 : 50 alfalfa:maize silage. The work summarized by DEFRA, (2010) shows that dairy cattle offered maize silage/grass silage at 75 : 25 had lower CH4 emissions per kg DMI; however, milk yield was the same as those cows fed 25 : 75. It is important to note that maize starch is inherently more rumen-resistant than cereal starches, with up to 30% being rumen bypass (Orskov, Reference Orskov1986); this again may have limited the effect of forage treatment on CH4 emissions. It is plausible to suggest that differences were not observed due to the choice of measurement methodology used in this experiment. It has been reported by Lassey and Ulyatt (Reference Lassey and Ulyatt2000) that both inter- and intra-animal variation in CH4 production using the SF6 technique can be high mainly due to the effect of permeation tube release rate. The use of a Latin square design in the present study reduces this effect of permeation tube release rate as all animals received all diets. Boadi et al. (Reference Boadi, Wittenberg and Kennedy2002) and Muñoz et al. (Reference Muñoz, Yan, Wills, Murray and Gordon2012) reported that using the SF6 technique resulted in a larger variation around the mean compared with chamber measurements, although measurements were not conducted simultaneously. However, it must be remembered that, despite its limitations, the SF6 technique is still the only methodology that allows individual animal measurements under normal production systems (Lassey and Ulyatt, Reference Lassey and Ulyatt2000).
The evidence from the literature on the effects of changing the starch-to-fibre ratio on CH4 production is also equivocal. It was reported by Moe and Tyrell (Reference Moe and Tyrrell1979) that CH4 production from dairy cows was dependent on the digestibility of the total carbohydrate content, with less CH4 produced per kg digestible starch than per kg digestible NDF. Similarly, it has been predicted using mechanistic models by Mills et al. (Reference Mills, Dijkstra, Bannink, Cammell, Kebreab and France2001) that the replacement of a fibrous with a starchy concentrate would reduce CH4 emissions. In the present study, there was no effect of concentrate type (high-fibre, low-starch v. low-fibre, high-starch) on CH4 production, a finding in agreement with that of McGinn et al. (Reference McGinn, Chung, Beauchamin, Iwassa and Grainger2009), who reported that feedlot cattle fed ad libitum and supplemented with maize distillers dried grains with soluble instead of steam-rolled barley grain had reduced CH4 emissions, despite having a higher dietary NDF and lower dietary starch concentration. However, it was noted that the distillers grains contained 2.5-fold more ether extract than barley, and this along with other nutrient changes between dietary ingredients apart from starch may explain the reduction in CH4.
In this present study, it was calculated that the MF and GF has an EE content of 26 g/kg DMI, whereas cows offered MS and GS had an EE content of 24 g/kg DMI. It is unlikely that these small differences in EE would have had any significant impact on CH4 production. Martin et al. (Reference Martin, Morgavi and Doreau2010) reported that for every increase of 10 g EE/kg DMI, CH4/kg DMI production was reduced by 3.8%; however, there were again confounding effects of alterations in the chemical composition of the basal ration. In principle, changing the starch-to-fibre ratio should shift rumen fermentation in favour of propionate, which utilizes hydrogen, and thus making it unavailable for methanogenesis (Russell, Reference Russell1998). However, in practice, it is difficult to evaluate this scientifically, as no two feed ingredients are identical in all constituents bar starch and fibre. In the present study, there were also numerical differences in OM, ADF, ether extract and WSC between the two concentrate sources, all of which could alter rumen fermentation pathways within the rumen (Latham et al., Reference Latham, Sharpe and Sutton1971) and alter the ruminal microbial diversity (Flint et al., Reference Flint, Bayer, Rincon, Lamed and White2008).
With respect to rumen fermentation, it has been shown by McGeough et al. (Reference McGeough, O’Kiely, Hart, Moloney, Boland and Kenny2010) that steers offered whole-crop wheat silages produced at different stages of maturity, which resulted in differing starch-to-fibre ratios, had decreased CH4 emissions, with increasing maturity coupled with decreased acetate-to-propionate ratio. Unfortunately, rumen samples were not obtained in this experiment; therefore, any effect on rumen fermentation is unclear and speculative.
It is also important to consider other influential factors, such as substituting one feedstuff for another, which may lead to differences in the carbon footprint of the enterprise. Rotz et al. (Reference Rotz, Montes and Chianese2010) reported that, under a US production system, maize silage produces 5 kg CO2/tonne DM less than production of grass silage, which further enhances the potential environmental benefit of feeding maize silage over grass silage. In terms of the design of this study, assuming all other feed CO2 emissions are the same and using the mean intakes, changing the grass-to-maize silage ratio from 70 : 30 to 30 : 70 would result in similar forage-related emissions of 428 g CO2/cow per day for M and 422 g CO2/cow day for G, despite the increased intake of cows offered M. However, Vellinga and Hoving (Reference Vellinga and Hoving2011) have reported that converting land from permanent pasture to maize production for silage results in higher modelled greenhouse gas emissions than the trade-off from feeding a higher proportion of maize silage.
Milk FAs
In a review by Chilliard et al. (Reference Chilliard, Ferlay, Mansbridge and Doreau2000), it was suggested that the inclusion of either maize or grass silage would not increase the milk conjugated linoleic acid (CLA) concentration above 0.8 g/100 g FA, which is in agreement with our observations, with a mean milk CLA concentration of 0.39 g/100 g FA. A more detailed review on the effects of forage source by Chilliard et al. (Reference Chilliard, Ferlay and Doreau2001) reported that cows fed maize silage-based diets would have a higher C6 to C12, C16:1 and C18:2 c9 c12 at the expense of C16:0, C18:0 and C18:3 c9 c12 c15 when compared with grass silage-based diets, because of the higher concentration of C18:2 c9 c12 found in maize silage. However, in the present study, there was no difference in milk C8 to C12 due to forage ratio, whereas the M diets had higher milk C18:0 and C18:2 c9 c12 with a lower milk C16:0, C16:1 and C18:3 c9 c12 c15 compared with the G diets. The numerically small effects of concentrate type on milk C8:0, C10:0, C14:1, C15:0, C16:1 and C18:0 were not considered to be practically significant. In the present study, a higher inclusion of maize silage also increased the proportion of MUFA and tended to decrease the proportion of saturated FA, both of which are associated with an improvement in the health properties of milk (Givens, Reference Givens2010).
In conclusion, altering the grass silage-to-maize silage ratio from 70 : 30 to 30 : 70 had a beneficial effect, increasing intake, milk yield and milk MUFA concentrations. Total daily CH4 production and per unit milk production was unaffected by the forage ratio; however, when expressed relative to DMI and as a proportion of GE, it was lower for the higher maize-based diet. Altering the concentrate starch-to-fibre ratio within the range used in the present study had little effect on performance or CH4 production.
Acknowledgments
This study was jointly funded by Harper Adams University and Mole Valley Farmers. The authors would like to thank Mr G Vince, Mr D Ferguson, Mr K Jones and Mr A Ali for their technical assistance during this experiment.