Introduction
Titanium (Ti) is a silver colored transition metal with characteristics that make it attractive for widespread use in automotive, chemical, medical, and aerospace applications; characteristics such as high corrosion resistance, high strength-to-weight ratio, excellent fatigue resistance, and a relatively high melting point (>1650 °C) [Reference Dai, Zhu, Chen and Weng1, Reference Huda and Edi2, Reference Zhou, Zhang, Liu, Cui, Mo and Wang3, Reference Wang, Liao, Liu and Liu4, Reference Peters, Kumpfert, Ward and Leyens5]. Specifically, for elevated temperature applications, Ti’s low thermal conductivity, high specific strength, and low thermal expansion [8.6 µm/(m K)] are key features. Additionally, Ti always has an outer oxide layer, titanium dioxide (TiO2), which is typically 4–5 nm in thickness [Reference Aniołek6]. The continuous and dense TiO2 passivation layer restricts the diffusion of oxygen into the bulk material. In this case, parabolic oxidation kinetics are observed up to 600 °C [Reference Kanjer, Lavisse, Optasanu, Berger, Gorny, Peyre, Herbst, Heintz, Geoffroy, Montesin and Marco de Lucas7]. The assumption with parabolic oxidation kinetics is that diffusion of oxygen through the coherent oxide layer is the rate limiting step [Reference Kofstad, Hauffe, Kjöllesdal, Siekevitz, Ernster and Diczfalusy8]. At higher temperatures (>600 °C), deterioration of the passivation layer occurs resulting in linear oxidation kinetics with continued and uncontrolled reaction or absorption of oxygen. Linear oxidation kinetics are a direct result of a cracked or porous oxide layer where transport of ions occurs faster than the chemical reaction [Reference Kofstad, Hauffe, Kjöllesdal, Siekevitz, Ernster and Diczfalusy8].
Several surface treatment techniques have been implemented to increase Ti’s oxidation resistance. Such techniques can be based on either chemical or mechanical modifications. Examples of chemical modifications comprise cementation coatings [Reference Das and Trivedi9], physical vapor deposition of ceramic coatings [Reference Ebach-Stahl, Eilers, Laska and Braun10], and ion implantation [Reference Lal, Sinha, Barhai, Nair, Kalavathy and Kothari11]. Mechanical modifications include shot-peening to increase oxidation resistance and fatigue performance of metals [Reference Raceanu, Optasanu, Montesin, Montay and Francois12, Reference Optasanu, Jacquinot and Montesin13]. Addition of ceramic particles into a metal matrix to form a metal-matrix composite (MMC) has also been reported to improve oxidation resistance. Examples of some of the MMCs produced by LENS™ include vanadium carbide reinforced stainless steel [Reference Gualtieri and Bandyopadhyay14], niobium carbide reinforced stainless steel [Reference Gualtieri and Bandyopadhyay15], and calcium phosphate reinforced Ti6Al4V [Reference Stenberg, Dittrick, Bose and Bandyopadhyay16]. Improvements in mechanical properties and oxidation resistance of LENS™ fabricated MMCs have also been achieved through in situ ZrB2 formation in Zr matrix [Reference Sahasrabudhe and Bandyopadhyay17] and TiB reinforcement in Ti matrix [Reference Hu, Ning, Wang, Cong and Zhao18]. Previous work has shown that small reinforcements improve the mechanical and thermal stability of Ti-MMCs [Reference Zadra and Girardini19]. In general, it was reported that the reason for improved mechanical properties and oxidation resistance was due to impregnation or in situ formation of harder ceramic particles in the bulk material, which exhibited higher thermal stability and sound metallurgical bonding between the matrix and the reinforcement materials [Reference Gualtieri and Bandyopadhyay14, Reference Gualtieri and Bandyopadhyay15, Reference Stenberg, Dittrick, Bose and Bandyopadhyay16, Reference Sahasrabudhe and Bandyopadhyay17, Reference Hu, Ning, Wang, Cong and Zhao18].
Boron nitride (BN) by itself exhibits poor oxidation resistance, low hardness, and poor mechanical strength [Reference Ding, Ding, Yao, Qiu, Bai, Guo, Xue, Wang, Zhou and Su20]. However, its reaction with Cp-Ti is postulated to form TiN, TiB, and TiB2, which are refractory materials and exhibit excellent mechanical as well as thermal stability. When BN and Cp-Ti react at 927 °C in an oxidizing environment, the following reactions would result [Reference Dai, Zhu, Chen and Weng1]:
 $${\rm{Ti}}\left( {\rm{s}} \right) + {{\rm{O}}_2}\left( {\rm{g}} \right) \to {\rm{Ti}}{{\rm{O}}_2}\left( {\rm{s}} \right)\quad ,$$
with the introduction of BN [Reference Okamoto and Baker21],
 $$2{\rm{Ti}}\left( {\rm{s}} \right) + {\rm{BN}}\left( {\rm{s}} \right) \to {\rm{TiN}}\left( {\rm{s}} \right) + {\rm{TiB}}\left( {\rm{s}} \right)\quad ,$$
 $$3{\rm{Ti}}\left( {\rm{s}} \right) + 2{\rm{BN}}\left( {\rm{s}} \right) \to 2{\rm{TiN}}\left( {\rm{s}} \right) + {\rm{Ti}}{{\rm{B}}_2}\left( {\rm{s}} \right)\quad ,$$
with the formed products having heats of formation of −70.1 for TiN, −28.0 for TiB, −53.0 for TiB2, and −211.0 kcal/mol for TiO2 [Reference Barin and Knacke22]. It should be noted that the order of products formation during reaction of Ti and BN thermochemically favors the formation of TiB2; this is due to heat of formation of TiB2 being more negative than the heat of formation for TiB. However, the presence of TiB2 in high Ti concentration will favor Reaction (4) due to the small heat of formation [Reference Panda and Ravi Chandran23]; more specifically, TiB formation will occur if the concentration of B is <18–18.5% in the reaction zone [Reference Bhuiyan, Li, Wang, Hodgson and Chen24]. To reiterate, in low Ti and high BN concentrations, TiB2 should be expected [Reference Ceramics, Gordienko and Evtushok25] as is the case with initial reaction of B with Ti around BN particles. However, in the case of high concentration of Ti, formation of TiB is more favorable than TiB2 following Reaction (4) [Reference Chandran and Panda26]:
 $${\rm{Ti}}\left( {\rm{s}} \right) + {\rm{Ti}}{{\rm{B}}_2}\left( {\rm{s}} \right) \to 2{\rm{TiB}}\left( {\rm{s}} \right)\quad .$$
To finalize, even if initially TiB2 is formed due to initial abundance of BN, only TiB formation should be expected via solid–state reaction in post-oxidation samples as diffusion will occur in the elevated temperature environment and subsequently reduce B concentration in the localized reaction zone [Reference Heer, Sahasrabudhe, Khanra and Bandyopadhyay27].
In the present study, it was hypothesized that addition of BN to Cp-Ti would form in situ TiN, TiB, and enhance the oxidation resistance of the composite. The aim of this work was to understand how BN introduction into Ti influences oxidation resistance, microstructure, and hardness of the formed Ti-MMC as a function of increased BN concentration and oxidation time. Ti-MMC samples were prepared for oxidation studies at elevated temperatures where oxide layer adhesion was not expected but the oxidation kinetics were reduced due to modified chemical composition of the bulk material. In this work, Cp-Ti and BN powders were used as starting material for LENS™-based additive manufacturing. The objective of this research was to increase Cp-Ti’s oxidation resistance by single-process shape fabrication and in situ reinforcement formation using LENS™.
Results
Oxidation
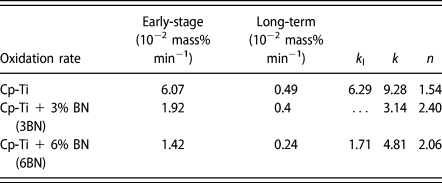
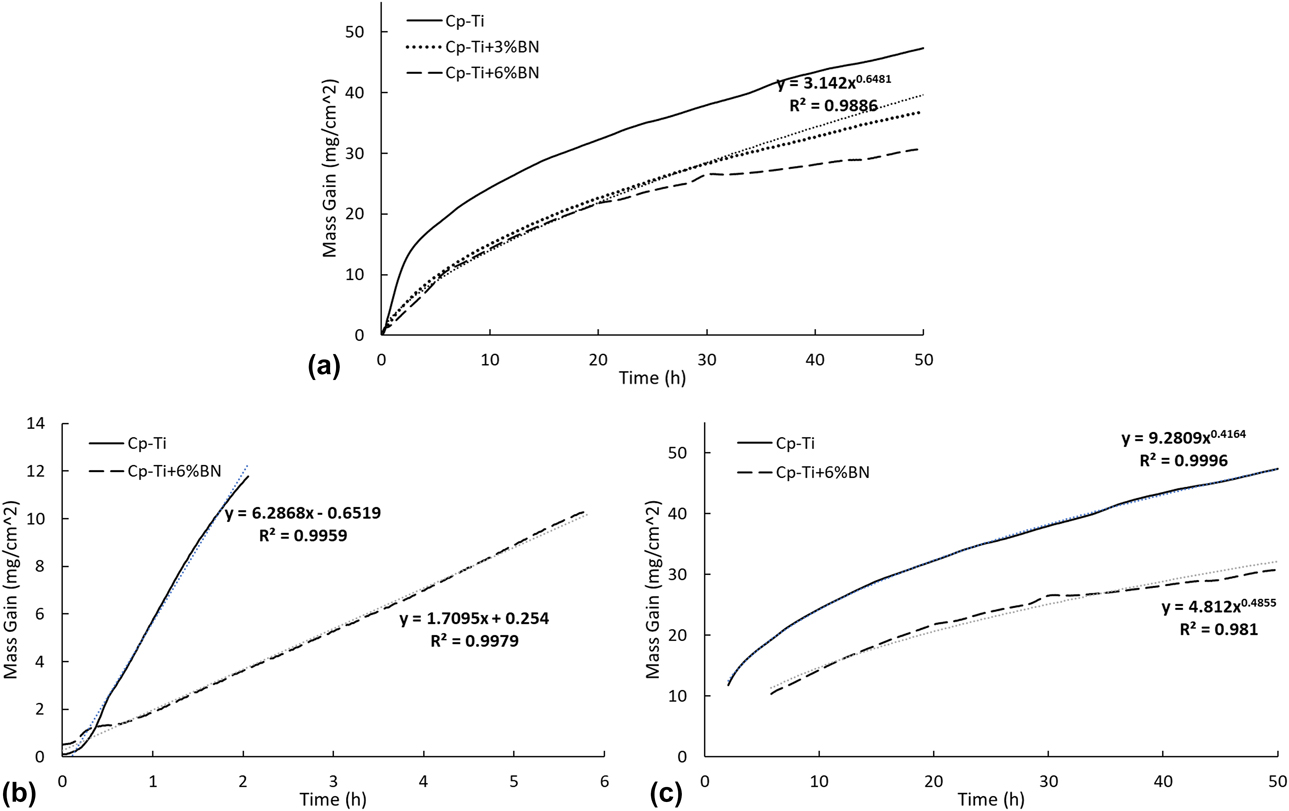
Early-stage and steady-state oxidation rates were compared for Cp-Ti, 3BN, and 6BN from the mass percent change curves with respect to time. The following time intervals were used: early-stage (1.6–3.2 h) and steady-state (25–50 h). Isothermal temperature was attained after 1.6 h; therefore, early-stage characterization began at this time with the obtained results shown in Table I. Linear and nonlinear regressions were performed to attain a coefficient of determination (R 2) close to ‘1’ from experimentally collected data. For this work, modeling with respect to traditionally known and established oxidation laws was also done, typically performed using mass gain over surface area with respect to time curves, as shown in Fig. 1. The following general oxidation laws were used. Specifically, for nonlinear oxidation kinetics, the equation is [Reference Zhang, Sahasrabudhe and Bandyopadhyay28]
 $${{\Delta m} \over S} = {\left( {kt} \right)^{{1 \over n}}}\quad ,$$
where Δm is the mass change due to oxidation, S is the exposed surface area, k is the diffusion rate constant, n is the degree index of the oxidation law, and t is time in hours. A value of n = 2 in this equation would account for parabolic kinetics, which is indicative of a protective barrier [Reference Albina29]. For linear oxidation kinetics, the equation is [Reference Roberge30]
 $${{\Delta m} \over S} = {k_{\rm{l}}}t\quad ,$$
where k l is a linear oxidization constant as discussed by the two aforementioned Refs. Reference Albina29 and Reference Roberge30.

Mass gain curves over area with respect to oxidation time for three samples compositions. (a) complete curves from 0 to 50 h, 3BN only acceptable power fit R 2 value, (b) early-stage linear model fit using Eq. (6) for Cp-Ti, and (c) steady-state power model fit using Eq. (5) for Cp-Ti and 6BN.

To further understand, the evolution of the oxidation rate modeling under differentiated parabolic condition is done, as discussed in [Reference Pérez, González-Carrasco and Adeva31, Reference Brumm and Grabke32]. In this approach, the instantaneous parabolic constant (k p) value gives a better representation of the evolution of the oxidation rate for the entirety of the test. To achieve this, a value of 2 is used for n and Eq. (5) can be rewritten as
 $${\left( {{{\Delta m} \over S}} \right)^2} = \left( {{k_{\rm{p}}}t} \right)\quad .$$
In this form, parabolic kinetics are assumed. Following with differentiation of Eq. (7) with respect to time, k p may be isolated and Eq. (7) may be rewritten as
 $${{{\rm{d}}{{\left( {{{\Delta m} \over S}} \right)}^2}} \over {{\rm{d}}t}} = {k_{\rm{p}}}\quad .$$
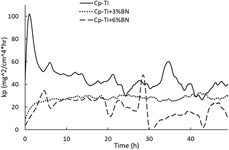
Early-stage and long-term relative mass% oxidation rates were calculated for Cp-Ti, 3BN, and 6BN from thermogravimetric analysis (TGA) samples and were presented in Table I. Cp-Ti displayed early-stage oxidation rate of 6.07 × 10⁻² mass%/min. Oxidation rate for 3BN and 6BN compositions decreased to 1.92 × 10⁻² and 1.42 × 10⁻² mass%/min, respectively. No significant difference is observed in the long-term oxidation rates for Cp-Ti and 3BN compositions, but a decrease of ∼50% is observed for the 6BN composition. To further analyze the thermogravimetric (TG) data for the oxidized samples, traditionally reported oxidation models using Eqs. (5) and (6) were done. Figure 1 displays the TG curves for the three compositions in the mass gain with respect to time format. A power fit curve is displayed in Fig. 1(a) following Eq. (5), for the 3BN composition. The remaining two TG curves presented R 2 values below 0.98, and therefore, power regression of data as a whole was not implemented. Instead, TG curves for Cp-Ti and 6BN compositions were segregated into two regions: linear [Fig. 1(b)] and nonlinear [Fig. 1(c)] using Eqs. (6) and (5), respectively. Linear constant (k l), diffusion rate constant (k), and index of oxidation law (n) are presented in Table I. The general trend is a reduction in k l and k, with the exception of 3BN, which was not segregated. To further analyze the evolution of k during testing, instantaneous parabolic constant (k p) curves were derived using Eq. (8) and presented in Fig. 2. More fluctuation in Cp-Ti’s k p value is observed when compared to 6BN composition, with Cp-Ti having a higher k p value throughout testing, while composition 3BN displaying the least fluctuation. The average k p values for Cp-Ti, 3BN, and 6BN from 10 to 50 h are approximately 41.2 ± 12.0, 28.6 ± 2.8, and 18.2 ± 9.2 mg2/(cm4 h), respectively. Correlating to change in mass, 3BN and 6BN displayed a reduction of 22.3% and 35.3% when compared to Cp-Ti, respectively. To generalize, a decrease in k p value is consistent with increased BN concentration in the samples.
Instantaneous parabolic constant (k p) derived by use of Eq. (8) with respect to time for three TGA sample compositions for 50 h.

Phase analysis
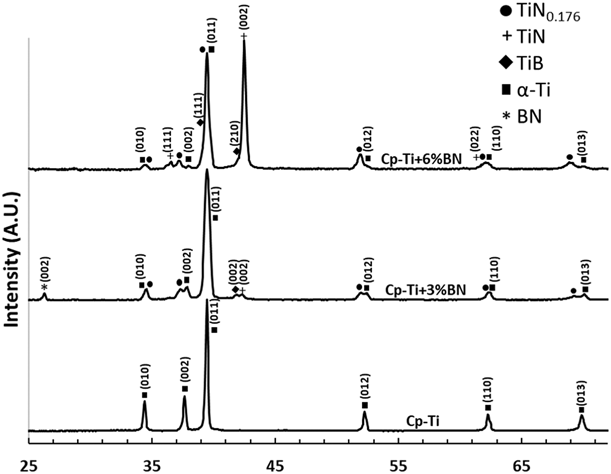
Figure 3 displays the X-ray diffraction (XRD) spectrums for LENS™ processed Cp-Ti, 3BN, and 6BN samples. Cp-Ti displays only α-Ti phase. With the addition of BN, composition 3BN displays the formation of osbornite (TiN), metastable TiN0.176, TiB, and unreacted BN. Composition 6BN exhibits a similar spectrum to that of 3BN, but with a significant increase in the TiN peaks.
XRD spectrums for LENS™ processed Cp-Ti, 3BN, and 6BN compositions.

Microstructure
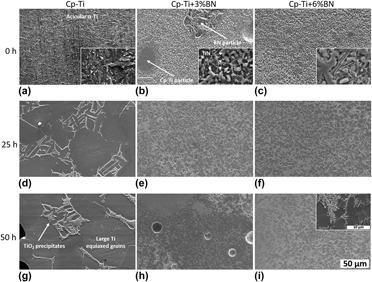
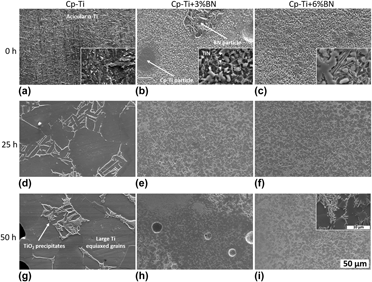
LENS™ processed pre-TGA Cp-Ti composition displayed typical acicular α-Ti or also referred to as α′-Ti microstructure as shown in Fig. 4(a). After oxidation, the needle-like microstructure was changed and larger equiaxed grains were observed as shown in Fig. 4(d). Along with the increased grain size, precipitates along the grain boundaries were observed and grew in size with oxidation time, Fig. 4(g).
SEM micrographs of sample cube cores at (a–c) 0 h, (d–f) 25 h, and (g–i) 50 h TGA for varying BN concentrations. Note: larger images follow 50-µm scale bar while insets follow 10-µm scale bar, as displayed.

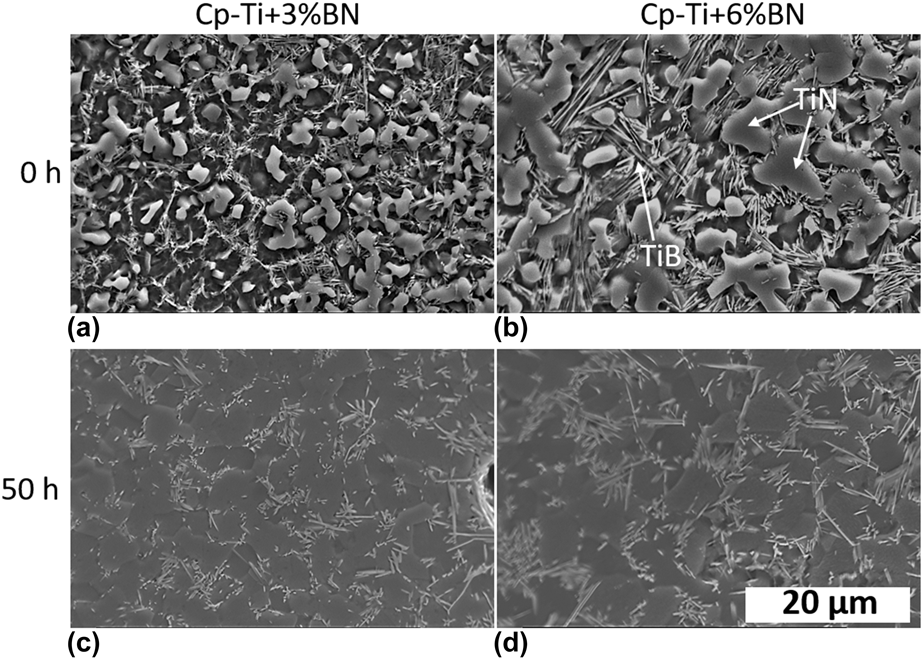
LENS™ processed pre-TGA 3BN’s microstructure was not of α′-Ti but involved two different morphologies of secondary phases as shown in the inset of Fig. 4(b) inset and Fig. 5(a). The small needle-like structures are TiB needles, while the plate-like regions are TiN within the Ti matrix. A similar microstructure is observed in the 6BN composition; however, TiB needle-like microstructure and TiN regions are larger as shown in Fig. 4(c) inset and Fig. 5(b). After 50 h TGA, TiB in the 3BN composition is observed to evolve into coarser needle-like microstructure. For both 3BN and 6BN after 50 h TGA, TiN plate-like microstructure is absent as can be seen in Fig. 4(h) and inset in 4i or at higher magnification in Figs. 5(c) and 5(d).
High magnification SEM micrograph of 3BN and 6BN samples at (a, b) 0 h and (c, d) 50 h TGA testing showing needle-like precipitate formation and lack of plate-like TiN microstructure at 50 h. Note: all images follow 20-µm scale bar.

Hardness
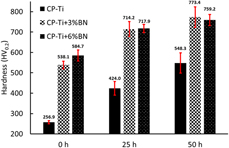
Vickers hardness values for Cp-Ti, 3BN, and 6BN at varying oxidation times are shown in Fig. 6. As processed LENS™ Cp-Ti sample had the lowest hardness at 256.9 ± 7.7 HV0.2, which increased with oxidation time to 424.0 ± 33.6 HV0.2 and 548.3 ± 49.7 HV0.2 for 25 and 50 h testing, respectively. As processed 3BN and 6BN LENS™ samples hardness were 538.1 ± 19.1 HV0.2 and 584.7 ± 27.0 HV0.2, respectively, after 25 h TGA, 3BN and 6BN samples hardness increased to 714.2 ± 36.6 HV0.2 and 717.9 ± 20.0 HV0.2, respectively. No significant increase in hardness amongst 50 h TGA 3BN and 6BN samples was observed—where 3BN and 6BN samples exhibited a hardness of 773.4 ± 50.9 HV0.2 and 759.2 ± 27.6 HV0.2, respectively.
Vickers hardness of three compositions and three time points—LENS™ processed (0 h), 25 h TGA at 1000 °C and 50 h TGA at 1000 °C (n = 6).

Discussion
Oxidation
The reported literature on Ti’s oxidation mechanisms has shown that four rate laws can be applied within the temperature range of 300–1000 °C. The reported rate laws are logarithmic, cubic, parabolic, and parabolic + linear [Reference Kofstad, Hauffe, Kjöllesdal, Siekevitz, Ernster and Diczfalusy8]. A logarithmic rate law is indicative of oxide film formation and is reported to follow a Mott-type mechanism. A cubic rate law is associated with the diffusion of oxygen into titanium. A parabolic rate law follows the assumption that diffusion of oxygen through the oxide layer is the rate limiting step and follows the Wagner high-temperature mechanism. Finally, a linear rate law results when cracks in the oxide layer occur, and the rate-limiting step is a phase-boundary reaction [Reference Kanjer, Lavisse, Optasanu, Berger, Gorny, Peyre, Herbst, Heintz, Geoffroy, Montesin and Marco de Lucas7, Reference Kofstad, Hauffe, Kjöllesdal, Siekevitz, Ernster and Diczfalusy8]. In the process of rendering an oxidation kinetic law for collected data, parameters that can add to the complexity of properly modeling the data are testing temperature, oxygen concentration, oxygen pressure, residual stresses in the material, sample composition, and gas composition; however, the current literature has shown that the most significant contributor on oxidation kinetics is temperature [Reference Aniołek6]. To decrease complexity, segregating experimental curves into more than one- or two-time interval is not uncommon and allows for improved modeling of the oxidation kinetic stages. For example, LENS™ processed 50 h TGA Cp-Ti and 6BN collected data had to be segregated into a linear region and a power law region as shown in Figs. 1(b) and 1(c). Segregating the collected data allowed for improved modeling as a coefficient of determination value closer to ‘1’ was achieved.
Oxidation rates in the units of mass%/min were calculated to understand compositional variation effects on oxidation resistance. The values are as presented in Table I. When 3BN and 6BN samples are compared to Cp-Ti, a reduction in oxidation rate can be seen by a factor of 3 and 4, respectively. Long-term or steady-state oxidation rate difference is undisguisable for Cp-Ti and 3BN compositions, but a reduction of 50% is observed for 6BN; the reason for similar steady-state oxidation rate for Cp-Ti and 3BN is due to lower BN presence and oxygen saturated Ti matrix. The reduction in oxidation rate for 6BN sample is due to higher BN content.
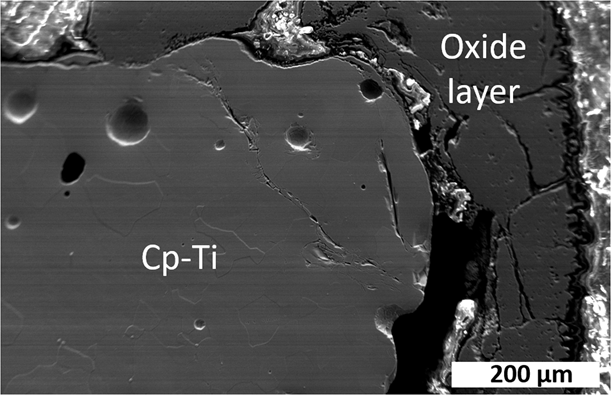
Using Eq. (5), LENS™ processed 50 h TGA 3BN sample was the only composition to produce an acceptable R2 value for the entirety of the test. Table I shows the oxidation constants and degree index values of the oxidation laws. The linear oxidation law was used for LENS™ processed 50 h TGA Cp-Ti and 6BN samples at early-stages of oxidation and produced constant values of 6.29 and 1.7. Linear oxidation behavior occurs due to nonrestrictive diffusion of oxygen and uncontrolled oxidation kinetics. The oxidation reactions are exothermic and cause an increase in surface temperature and an increase in the reaction kinetics [Reference Albina29]. Self-propagating high-temperature synthesis has been reported for such exothermic reactions, which can add further to the observed linear kinetics [Reference Ceramics, Gordienko and Evtushok25]. In the case of Cp-Ti, the abundance of Ti and spallation of the TiO2 passive layer, as observed in Fig. 7, can account for the linear oxidation kinetics. In the case of 6BN unreacted BN with Ti, as seen in Fig. 4(b), it accounts for the linear kinetics; this is due to BN’s poor oxidation resistance at elevated temperature and initial self-propagating characteristics.
Low magnification SEM micrograph of Cp-Ti sample after isothermal TGA testing at 1000 °C, and complete spallation of oxide layer is observed.

In modeling nonlinear oxidation kinetics with Eq. (5), diffusion oxidation rates are 9.28, 3.14, and 4.81 for Cp-Ti, 3BN, and 6BN, respectively, as shown in Table I. The trend is a decrease in oxidation rate as BN percent is increased. The exception is 3BN, but this is the accepted variation for having the general oxidation power law fit the entirety of the collected data. In discussing the degree index of the oxidation law (n), it was previously stated that a value of ‘2’ accounts for parabolic oxidation rate kinetics and is indicative of a protective barrier. 6BN gives a degree index value closest to ‘2’ and therefore exhibits such protective barrier kinetics.
Figure 2 shows k p values for Cp-Ti, 3BN, and 6BN during the 50 h TGA test. Presenting the data in this fashion, it can be easily seen why only 3BN produced an R 2 value of over 0.98 for the power law; 3BN’s k p value remained consistent throughout testing. Cp-Ti displayed the greatest instantaneous k p value at early- and long-term testing. This can be due to oxygen saturating the Ti matrix, as is the case in temperatures exceeding 800 °C [Reference Kofstad, Hauffe, Kjöllesdal, Siekevitz, Ernster and Diczfalusy8]. Also, fluctuations can be interpreted as barrier formation and subsequent cracking and spallation. Upon the addition of BN, 3BN displayed a drop in the k p value. For the 6BN, fluctuation was greater, but after 30 h, it remained below 3BN. The reactions occurring are exothermic. The combination of small specific heat and large heat of formation classifies the reactions as self-propagating high-temperature synthesis [Reference Binnewies and Milke33].
Phase analysis
For as processed 3BN and 6BN samples, TiN0.176, TiN, and TiB formations were observed, as shown in Fig. 3. TiB2 could not be detected due to low percent of BN, favoring Reaction (2) over Reaction (3). Observed amongst 3BN and 6BN is metastable TiN0.176. The high energy density combined with the fast cooling rates possible with LENS™ processing appeared to have ‘locked-in’ this metastable N rich phase. Proximity of this phase can be argued to exist at the TiN plate-like microstructure observed in Fig. 5(a). The fast cooling rates can also account for the incomplete reaction of BN particles, and similar results have been reported for Ti64 related work [Reference Sahasrabudhe, Harrison, Carpenter and Bandyopadhyay34, Reference Balla, Xue, Bose and Bandyopadhyay35].
Microstructure: microstructure as a function of oxidation time
Acid etched SEM micrographs of LENS™ processed Cp-Ti sample [Fig. 4(a)] revealed acicular α-Ti microstructure. Fast cooling rates arise from low laser residence time, quenching by the substrate, and laser scan speed when producing samples via any directed-energy laser-processing method [Reference Zhang, Sahasrabudhe and Bandyopadhyay28, Reference Das, Bhattacharya, Dittrick, Mandal, Balla, Sampath Kumar, Bandyopadhyay and Manna36, Reference Chikarakara, Naher and Brabazon37]. LENS™ fabrication has been reported to exhibit cooling rates in the order of 103–105 K/s [Reference Sahasrabudhe, Soderlind and Bandyopadhyay38]. Fast cooling rates favor finer needle-like microstructure, i.e., analogous to the martensitic microstructure of many metals when quenched [Reference Zhang, Sahasrabudhe and Bandyopadhyay28, Reference Chikarakara, Naher and Brabazon37, Reference Xiang, Xuliang, Xinlin, Lihua and Mingjia39, Reference Matache, Stefanescu, Puscasu and Alexandrescu40, Reference Attar, Ehtemam-Haghighi, Kent, Wu and Dargusch41]. This occurs because high cooling rates increase the nucleation rate of crystals, which in turn result in a finer dendritic structure. With respect to oxidation time, following the order of Fig. 4(a) → 4(d) → 4(g), precipitates are observed in Cp-Ti with increasing testing time when isothermally held at 1000 °C. These TiO2 precipitates formed at the grain boundaries due to oxygen-rich environment [Reference Kofstad, Hauffe, Kjöllesdal, Siekevitz, Ernster and Diczfalusy8]. Moreover, β-Ti is the phase present at the 1000 °C testing temperature and would thus allow for the ease of oxygen diffusion. An additional reason for unrestricted oxygen diffusion into the bulk material is the lack of a continuous passive TiO2 layer at the surface, as shown in Fig. 7. Additionally, Ti grain size is observed to increase for Cp-Ti as testing time is increased; an expected observation as the elevated temperature is held isothermally for an extended amount of time and would allow grain growth to occur.
Microstructure as a function of BN concentration
With respect to increasing BN wt% [Figs. 4(a)–4(c)], the near complete loss of visible acicular α-Ti is observed. It can be argued that the lack of observable acicular α-Ti can be due to the change in Ti matrix composition such as B or N diffusion into the matrix. It may also be stated that the lack of acicular α-Ti microstructure is due to decreased cooling rates. Decreased cooling rates can occur due to the presence of BN and the formation of secondary phases of TiN and TiB, observed in Figs. 4(b) and 4(c) or in Figs. 5(a) and 5(b). The three refractory materials have higher melting points and retain heat energy more readily when compared to Ti. Also, considering that TiN and TiB formation reactions are exothermic, heat energy would be of abundance and allow for overall heat retention in the material. Figure 4(b) of the 3BN composition displays a random oriented needle-like structure and plate-like microstructure morphology. The small needle-like structures are of TiB, and have been reported in previous work [Reference Bhuiyan, Li, Wang, Hodgson and Chen24, Reference Das, Bhattacharya, Dittrick, Mandal, Balla, Sampath Kumar, Bandyopadhyay and Manna36, Reference Das, Balla, Basu, Sampath Kumar and Bandyopadhyay42]. TiB needles can be fine and coarse, where it has been reported that coarse needles can either be hollow [Reference Feng, Zhou, Jia, Meng and Rao43] or be of a Ti core [Reference Kooi, Pei and De Hosson44]. The needle-like growth is in the [010] direction, which occurs because it is the fastest growth direction [Reference Bhuiyan, Li, Wang, Hodgson and Chen24]; this combined with being bound by slower growing transverse planes [Reference Ravi Chandran, Panda and Sahay45] allows the TiB to grow as needles. It has also been reported that stacking disorder in the needle axis direction occurs and accounts for their lamellar structure [Reference Kooi, Pei and De Hosson44]. The larger plate-like regions are TiN [Reference Das, Bhattacharya, Dittrick, Mandal, Balla, Sampath Kumar, Bandyopadhyay and Manna36, Reference Das, Balla, Basu, Sampath Kumar and Bandyopadhyay42], which was further verified by XRD analysis. An increase in plate size and coarsening of TiB needles are observed with increased BN wt%, as seen from Figs. 4(b) to 4(c) and Figs. 5(a) to 5(b). The reason for increased geometric size with increased BN presence is due to the peak melt pool temperature increasing and allowing for increased diffusion, reaction and formation of larger TiN plates and coarser TiB needles [Reference Das, Bhattacharya, Dittrick, Mandal, Balla, Sampath Kumar, Bandyopadhyay and Manna36]. Peak melt pool temperature increase with increased BN presence because BN has higher laser absorption coefficient than Ti [Reference Das, Balla, Basu, Sampath Kumar and Bandyopadhyay42]. TiB needles are seen to form around the TiN plate-like microstructure, as seen in Fig. 5(a). The reason for this networked microstructure is due to the diffusion of nitrogen into Ti during the interaction of BN and Ti. Boron having a higher atomic radius will exhibit a lower relative diffusivity in Ti matrix when compared to N, hence would increase the B concentration in the surrounding area while N diffuses away from the BN particles and nucleates as TiN in the core region. Similar TiB networked structure has also been reported in Ti–6Al–4V/TiB2 composites after hot pressing treatment [Reference Huang, Geng, Li, Yang and Peng46]. The increased laser absorption coefficient pertinent to BN allowed for increased heat retention upon LENS™ processing. Thus, allowing for the increased exothermic reactions of BN with Ti to occur and further increasing overall material heat retention. As a result, available Ti to react with oxygen was reduced.
Microstructure as a function of oxidation time and BN presence
As oxidation time was increased for 3BN sample, the fine needle-like TiB structure was observed to coarsen. This can be observed in the following Fig. 4(b) → 4(e) → 4(h) and additionally in Fig. 5(a) → 5(c), which can be due to the decomposition of unreacted BN. The 6BN composition [Fig. 5(b)] of the needle-like TiB structure appears to have remained the same in size, i.e., Fig. 5(b) → 5(d). This could indicate a maximum needle size was achieved within the 6BN composition. Apparent across both TGA tested BN samples is the visible loss of the TiN plate-like phase. Reported literature has discussed that N in TiN can escape into the gas phase when exposed to 650 °C for 16 h [Reference Ceramics, Gordienko and Evtushok25]. Favored formation of TiO2 and N2 occurs–the reaction would be as follows [Reference Saha and Tompkins47]:
 $${\rm{TiN}}\left( {\rm{s}} \right) + {{\rm{O}}_2}\left( {\rm{g}} \right) \to {\rm{Ti}}{{\rm{O}}_2}\left( {\rm{s}} \right) + {1 \over 2}{{\rm{N}}_2}\left( {\rm{g}} \right)\quad .$$
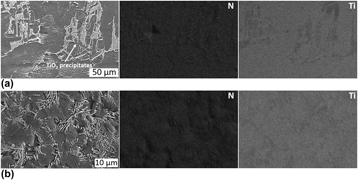
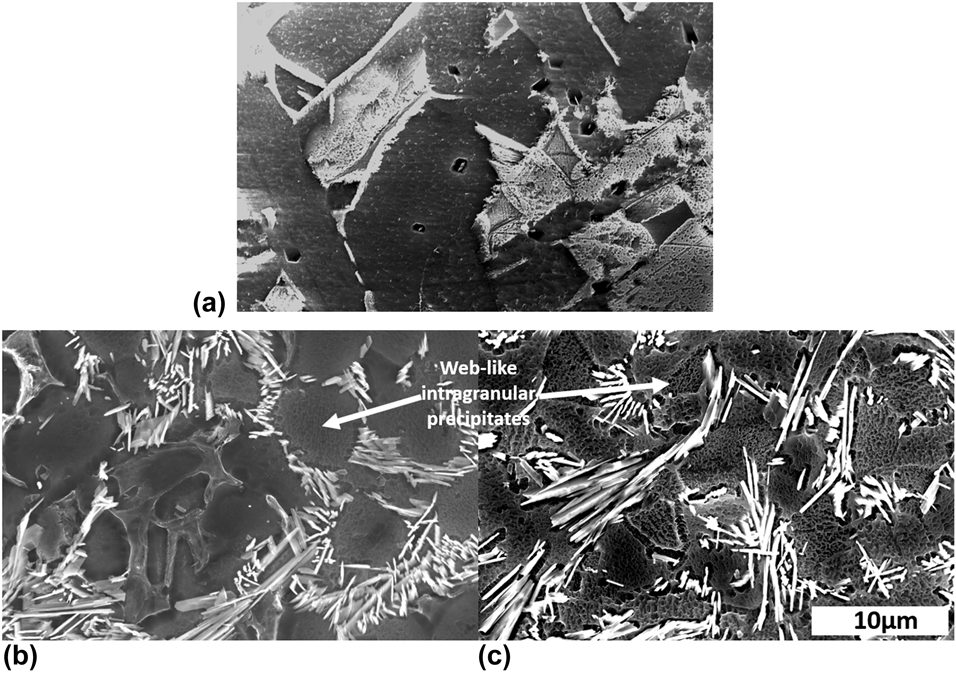
But Reaction (9) is limited to occurring at elevated temperatures (>600 °C), which is not the case for the formation of TiO2. Considering that it is a well-known fact that even at room temperature Ti self-passivates. Ultra-high resolution (UHR) through lens detector (TLD) SEM micrographs of 25 h TGA tested samples are shown in Fig. 9. A web-like intragranular microstructure is evident in the Ti matrix. It is believed that this secondary phase is of TiO2 formation, Eq. (9). By further evaluation of Fig. 8—N mapping, no apparent difference is observed in Cp-Ti and 6BN compositions, confirming no difference in N presence among the samples. N did indeed escape to the gas phase as the 6BN composition does not show an increase in N presence; this phenomenon is analogous with the TiB2 and TiB reaction order. Initial formation of TiN occurs due to the thermal energy associated with LENS™ processing and inert or oxygen-deprived controlled environment. But during TGA testing under an oxidative environment, TiN degraded to TiO2 and N2, as per Eq. (9).
Elemental dot mapping of nitrogen (N) and titanium (Ti) for 25 h TGA samples, (a) Cp-Ti, (b) 6BN. N pixel intensity variation nondistinguishable between the two samples.

To finalize, smaller grain size is observed in the 50 h TGA 3BN [Fig. 4(h)] and 6BN [Fig. 4(i)] when compared to Cp-Ti [Fig. 4(g)]. A proposed reason for this is due to the insolubility of TiB into the Ti matrix, allowing for a higher concentration at grain boundaries that prevent grain growth via Zener pinning. In addition, grain refinement can also be due to implementation of elements into the Ti matrix with high growth restriction factors (GRFs). For comparison, elements such as vanadium and aluminum, in Ti6Al4V alloy, have been given a GRF value of ‘0’, or no significant influence on grain restriction, while silicon’s GRF is 18.7 and B’s GRF is reported to be 60 [Reference Bermingham, McDonald, Dargusch and StJohn48, Reference Bermingham, McDonald, Dargusch and StJohn49]. The reported GRF associated with B could have had an influence in the observed smaller grains of Ti in 50 h TGA 3BN and 6BN samples.
Hardness
Hardness for Cp-Ti was observed to increase with oxidation time, as shown in Fig. 6. Oxygen is highly soluble in Ti and faster diffusion is reported to occur in β-Ti. Observed increase in hardness for Cp-Ti can be primarily due to the oxygen enriched Ti matrix. The oxygen saturated Ti is referred to as α-case Ti and is a direct result of interstitial diffusion of oxygen into the Ti lattice producing lattice distortion [Reference Kanjer, Lavisse, Optasanu, Berger, Gorny, Peyre, Herbst, Heintz, Geoffroy, Montesin and Marco de Lucas7] and resulting in increased hardness. The enriched oxygen in Ti also allows for decreased oxidation kinetics, as observed in Fig. 2 after 10 h. Both 3BN and 6BN compositions hardness increased due to the formation of TiN and TiB. With increased oxidation time, an increase in hardness was observed for both BN samples. It can be argued that the noticeable increase in hardness for LENS™ processed 3BN from 0-h to the 25-h oxidation is due to coarsening of TiB needles, while small grain size and intragranular precipitation, Fig. 9, are also the reasons for increase in hardness for both 3BN and 6BN samples.
Ultra-high resolution through lens detector (UHR-TLD) SEM micrographs of TGA sample cube cores after 25 h testing. (a) Cp-Ti, (b) 3BN, and (c) 6BN. Note: all images follow 10-µm scale bar.

Conclusions
The objective of this research was to increase Cp-Ti’s oxidation resistance by addition of BN and processing via LENS™-based additive manufacturing. Feedstock powders of 3 and 6 wt% BN in titanium matrix were prepared by roller mill. It was found that the oxidation resistance increased as the parabolic constant decreased by 55.8%, and the hardness increased by ∼2.2-fold due to the addition of BN in Cp-Ti. Additionally, TiN and TiB formed in situ during LENS™ processing. After TGA, it was found that hardness increased across all three compositions. Hardness for the Cp-Ti increased due the formation of α-case Ti and TiO2 nucleation at the grain boundary. Hardness increased for TGA tested 3BN and 6BN samples due to TiB needle-like microstructure coarsening and finer grain size because of Zener pinning. Overall, small addition of BN into Cp-Ti increased the oxidation resistance through microstructural modification and in situ hard ceramic phase formation.
Materials and methods
Sample fabrication
Gas atomized Cp-Ti powder (Crucible Research, Pittsburgh, PA, titanium purity 99.998%) and hexagonal BN [99.99% pure, particle size: −200 mesh (<74 µm), Momentive Performance Materials] powders were sieved to a particle size distribution of 49–145 µm. BN powder was the exception as its particle size range was of 49–74 µm. Powders were then mixed to attain two-powder mixtures of Cp-Ti + 3 wt% BN and Cp-Ti + 6 wt% BN. A maximum of 6 wt% of BN was chosen for the study to show the proof of concept as previous LENS™ work showed desirable flowability at 5 wt% BN in SS316 [Reference Heer, Sahasrabudhe, Khanra and Bandyopadhyay27]. Feedstock powders of 3 wt% BN and 6 wt% BN were mixed using a roller mill at 40 rpm for 1 h in Nalgene plastic bottle having a diameter of ∼63.5 mm to ensure a homogeneous mixture. During milling process, no milling balls, binders, or other additives were used. The prepared mixtures initialisms are designated as Cp-Ti, 3BN, and 6BN corresponding to pure Cp-Ti powder, Cp-Ti + 3 wt% BN, and Cp-Ti + 6 wt% BN, respectively. Following the milling process, samples of Cp-Ti, 3BN, and 6BN were processed on a 4 mm thick Cp-Ti substrate using a commercial LENS™ 750 system (Optomec Inc., Albuquerque, New Mexico) equipped with a 500 W continuous wave Nd:YAG laser beam [Reference Zhang, Sahasrabudhe and Bandyopadhyay28], with argon as the delivery gas. Processing parameters for Cp-Ti were laser power (LP): 427 W, powder feed rate (PFR): 200 mg/s, hatch scan velocity (HSV): 12.7 mm/s, and contour scan velocity (CSV): 12.7 mm/s. Parameters for 3BN were LP: 475 W, PFR: 233 mg/s, HSV: 12.7 mm/s, and CSV: 10.6 mm/s. Parameters for 6BN were LP: 500 W, PFR: 233 mg/s, HSV: 12.7 mm/s, and CSV: 10.6 mm/s. Closed-lid crucibles used for the integrated scale could only accommodate at most a sample size of 2 mm. Therefore, fabricated samples were cut into 2 mm cubes by waterjet. Cut samples were ultrasonically cleaned with 200 proof ethanol and allowed to dry before testing.
TGA
TGA measurements for the LENS™ processed samples were performed using a Netsch STA 409 PC Luxx unit (Burlington, MA). For TGA measurement, the sample was loaded in an alumina crucible and covered with the lid having a hole at its center, with the sample weighed by internal unit scale under gas delivery; this was followed by heating the sample from room temperature to 1000 °C at 10 °C/min and isothermally held for 25 and 50 h, while weight change was measured with respect to time. TG measurement was completed by cooling to room temperature at 40 °C/min. During measurement, compressed air at flow rate of 40 mL/min was supplied. The measurements were performed for Cp-Ti, 3BN, and 6BN LENS™ processed samples with the obtained thermograms being used to establish oxidation kinetics.
Phase analysis
Phase analysis for the LENS™ processed samples was performed using a PANalytical X’pert Pro MPD XRD setup (Royston, U.K.) with a Cu Kα radiation (1.54 Å) at 45 keV and 40 mA, scanning from 2θ values of 30–80° at a step size of 0.05° and a dwell time of 6 s. Obtained diffraction peaks for α-Ti, cubic-TiN, orthorhombic-TiB, and hexagonal-BN for LENS™ produced samples were matched using reference cards from The International Centre for Diffraction Data (ICDD). Alpha-Ti, cubic-TiN, orthorhombic-TiB, and hexagonal-BN phases were referenced to ICDD cards: 98-004-3416, 98-018-3415, 98-002-4701, and 98-003-5538, respectively.
Hardness and microstructure
LENS™ processed and oxidized samples were mounted in phenolic thermoset resin with the top surface exposed. This plane was grounded 1 mm exposing the core region of the cube sample. The sample surface was then mechanically polished with a SiC paper of grit size 2000 and was further polished with alumina-DI water suspension at 1, 0.3, and 0.05 µm particle size. Samples were then ultrasonically cleaned for 15 min in 200-proof ethanol for removal of polishing media, followed by drying in air. Microhardness measurements were performed using a Phase II Plus, Micro Vickers hardness tester (Model# 900-391, Upper Saddle River, New Jersey), with a loading of 200 g and a dwell time of 15 s. Six indentations were in the proximity of the core. Etching was done using Kroll’s Reagent (46 mL DI water, 3 mL nitric acid, 1 mL hydrofluoric acid) by submersion for 15 s under agitation. Once etched, samples were rinsed in DI water, ultrasonically cleaned in 200-proof ethanol, and allowed to dry in air. Samples were then imaged using a field emission scanning electron microscope (FESEM; FEI-SIRION, Portland, Oregon) at an acceleration voltage of 20 kV and a working distance of 5 mm.
Acknowledgments
Authors would like to acknowledge financial support from the National Science Foundation under the grant number NSF-CMMI 1538851 (PI—Bandyopadhyay) and the National Institute of Arthritis and Musculoskeletal and Skin Diseases of the National Institutes of Health under Award Number R01 AR067306-01A1. The content is solely the responsibility of the authors and does not necessarily represent the official views of the National Institutes of Health.