Implications
Conformation and degree of fatness are potential tools for classifying and predicting foal carcass quality. These tools could be helpful to reduce the heterogeneity among foals’ carcasses and develop better grading guides for foal carcasses standardization. Use of a body conformation and fat cover classification scheme, as is common in other livestock production systems, could enable producers to change their husbandry practices in order to improve the value of foal carcasses.
Introduction
There is increasing interest in studying the quality of foal meat because of its nutritional properties comprising a positive fatty acid profile, low levels of fat, and high haem iron and protein content (Lorenzo et al., Reference Martin-Rosset2014). Robelin et al. (Reference Sarriés and Beriain1984) stated that slaughter age (12 v. 30 months) in French horse breeds affected carcass weight (313 v. 442 kg) and true yield (69.3% v. 71.2%). More recent studies also confirm that slaughter age affects carcass yield and quality (Franco and Lorenzo, Reference Horcada2014; Domínguez et al., Reference Espejo, García, López, Izquierdo, Robles and Costela2015) and suggest an influence of dietary supplementation on these parameters. Sarriés and Beriain (Reference Sarriés, Lorenzo, Crecente, Díaz, Ruiz, Franco, Beriain, Dominguez, Insausti, Agregán and Purroy2005) studied the effect of slaughter age on carcass quality by comparing foals slaughtered at 16 months and 24 months, as these have different husbandry practices. Other studies (Franco et al., Reference Franco and Lorenzo2013) have described the effect of the amount of supplementary concentrates and found that finishing with 3 kg for 4 months quadrupled intramuscular fat content and improved colour characteristics (in comparison with unsupplemented controls or those given only 1.5 kg of supplementary feeding). However, there are no studies where the diet of finishing foals has been supplemented with linseed, despite its use in other livestock: broilers (Alzueta et al., Reference Alzueta, Ortiz, Rebolé, Rodriguez, Centeno and Treviño2002), cattle (Alberti et al., Reference Alberti, Sañudo, Olleta, Campo, Panea, Franco and Lahoz2014) and lamb (Urrutia et al., Reference De Boer, Dumont, Pomeroy and Weniger2015). Therefore, the study reported here monitored the effect of linseed supplementation on foal carcasses.
Few standard grading systems for foal carcass quality have been established. The simple French system (Office National Interprofessionnel du Bétail et des Viandes (ONIBEV), Reference Polidori, Vincenzetti, Cavallucci and Beghelli1979) classifies carcass conformation using a three-point scoring system: E-Extra, B-Bon and M-Moyen (from better to worse). This classification was used by Sarriés and Beriain (Reference Sarriés, Lorenzo, Crecente, Díaz, Ruiz, Franco, Beriain, Dominguez, Insausti, Agregán and Purroy2005) who found that most foals studied were classified as ‘Bon’ in conformation grading and as ‘Covered’ in degree of fatness grading. Systems for red meats such as SEUROP (CEE Regulation No. 1208/81) in the European Union and United States Department of Agriculture (Reference Urrutia, Mendizabal, Insausti, Soret, Purroy and Arana1997) in the United States have a descriptive classification, whereas the Meat Standards Australia (Anonymous, 2008) system aims to predict an individual quality guarantee based on carcass measurements. Taking account of these considerations, the aim of this work is to study the effect of slaughter age and finishing diet on the foal carcass traits and prime cuts, and its relationship to the grading of foal carcass quality.
Material and methods
Animal treatment
For this study, 46 foals obtained from crossing Galician Mountain mares with Burguete stallion, were used. The foals came from an experimental herd of the Agricultural Research Centre of Mabegondo (Marco da Curra, A Coruña, Spain).
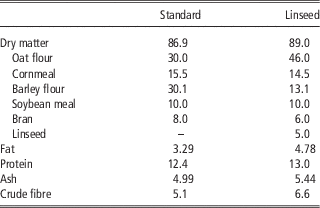
Animals were reared in an extensive production system and had water ad libitum in troughs. During this period, foals were kept with their mothers and allowed to suck freely at pasture. After weaning period (7 months), foals were fed alone on pasture following a rotational grazing. The herd was changed from a plot to another when the height of pasture was ~10 cm in the spring and 5 cm in the winter. The vegetation was composed by seeded (Lolium perenne and Trifolium repens) and natural fields (Agrostis spp., Lotus corniculatus, Holcus lanatus, Bromus mollis, Pseudoarrenatherum longifolium, etc.). In total, 22 foals were slaughtered at 13 months of age (13M) and 24 foals were slaughtered at 26 months of age (26M). Before slaughtering, all foals were supplemented during the fattening period which took around 104 days. At the beginning, there was an adaptation term of 10 days for foals. Supplementary feed was introduced gradually, increasing from 0.3 to 2 kg/foal per day, keeping this amount until the end of the fattening period. On the one hand, 11 foals from 13M group and 12 foals from 26M group, were randomly chosen and supplemented on pasture with a standard feed (SF) (2 kg/foal per day) and pasture. The rest of animals (11 from 13M and 12 from 26M) were supplemented on pasture with a linseed-rich feed (5%) (LF) (2 kg/foal per day) and pasture. Both SF and LF, described in Table 1, were isoproteic (12.7% CP) and isoenergetic (3.08 Mcal dry matter/kg). The live weight was recorded at the start and at the end of fattening period and average daily weight gain was calculated over this period.
Chemical composition percentages of the diets allocated to the foals during fattening period

Both finishing diets: glycerol (4.0%); vitamins+salt+calcium carbonate+calcium phosphate (2.5%).
Once the fattening period was over, foals were transported for 50 km to the abattoir the day before slaughter in compliance with current European regulations (Council Regulation 1/2005EC, 2005), without mixing groups, and aiming to minimize stress as described by Franco et al. (Reference Franco and Lorenzo2013). The animals were stunned with a captive bolt, slaughtered and dressed according to the specifications outlined in the European legislation (Council Directive 93/119/EC, 1993).
Carcass measurements
Immediately after slaughter, hot carcass weight was determined and the carcasses were then chilled for 24 h at 4±1°C. Subsequently, cold carcass weight (kg) and dressing percentage (%) were determined. At this point, the left-half carcasses were moved in refrigeration to the research centre pilot plant at 4±1°C. The following carcass measurements were collected: carcass length, loin length, leg length, leg width, the internal depth of chest and fat thickness in the 9th rib as described by De Boer et al. (Reference Domínguez, Crecente, Borrajo, Agregán and Lorenzo1974); the external depth of chest and leg circumference were obtained using the methods of Carballo et al. (Reference Carballo, Monserrat and Sánchez2000). These variables were determined to assess carcass morphology. Also, carcass compactness index (CCI)=(cold carcass weight/carcass length) and hind limb compactness index (LTI)=(leg length/leg width) were calculated according to Espejo et al. (Reference Fàbregas and Such2000). Lean thickness was measured at three different points. A knitting needle was inserted on the serratus ventralis and cutaneous omo-brachialis between the 4th and 5th ribs for the first measurement (1). The second measurement was obtained from the chuck 11 cm to the left in the Pectoralis superficialis and profundus (2) and the third measurement (3) was 11 cm to the right of the first measurement (1) in the loin (cutaneous trunci, intercostalis internus and externus).
Instrumental colour values were determined at 24 h postmortem. Meat and fat colour were measured with a MINOLTA colorimeter (Konica Minolta CM-600d, Osaka, Japan) (k: 400 to 700 nm, Dk: 10 nm, D65, 10°) calibrated with black and white standard patterns provided by the supplier. To determine meat colour in the CIELAB space: lightness (L*); redness (a*); yellowness (b*) (Commission Internationale de l’Èclairage, 1976) were assessed. The colour was measured at five random points of each sample. According to Sarriés and Beriain (Reference Sarriés, Lorenzo, Crecente, Díaz, Ruiz, Franco, Beriain, Dominguez, Insausti, Agregán and Purroy2005), the meat colour parameters were determined on the intact m. latissimus dorsi (LTD) at the height of 8th thoracic rib (Horcada, Reference Lorenzo, Sarriés, Tateo, Polidori, Franco and Lanza2000). They were also determined on the rectus abdominis (RA) on the external part of the muscle after temporarily peeling back the covering fascia, which was replaced after measurement to prevent dehydration of the RA muscle (American Meat Science Association, 2001). Instrumental colour coordinates over the subcutaneous fat (SCF) were measured in the lumbar region (Alberti et al., Reference Alberti, Beriain, Ripoll, Sarriés, Panea, Mendizábal, Purroy, Olleta and Sañudo1999).
Carcasses were classified at 24 h postmortem following the ‘Catalogue de Classement des Équidés’ carcass classification from the ONIBEV (Reference Polidori, Vincenzetti, Cavallucci and Beghelli1979). The scores have a three-point scale (E-Extra, M-Moyen, B-Bon). The degree of fatness followed the scale for the fat cover classification of carcasses of adult bovines (CEE Regulation No. 1208/81, 1981). Fat cover scores range from 1 to 5 (1-low, 2-slight, 3-average, 4-high, 5-very high). Regarding SCF colour evaluation, the scores have a five-point scale (1-white, 2-ivory white, 3-yellowish-white, 4-yellow, 5-strong yellow) (Horcada, Reference Lorenzo, Sarriés, Tateo, Polidori, Franco and Lanza2000). Using the methods of Carballo et al. (Reference Carballo, Monserrat and Sánchez2000), left–half carcasses were divided into front-quarter and hindquarter and 19 prime cuts were obtained (%). Meat, fat and bone percentage were calculated (%). These percentages were all referred to the total carcass weight (kg).
Statistical analysis
An ANOVA using the GLM procedure of the IBM Statistical Package for the Social Sciences (SPSS) Statistics 23.0 (Reference Tateo, De Palo, Ceci and Centoducati2014) was performed for all variables considered in the study. Fixed effect of slaughter age and finishing feed were included in the model. The model used was:
 $$Y_{{ij}} \,{\equals}\,\mu {\plus}SA_{i} {\plus}FF_{j} {\plus}\left( {SA{\times}FF} \right)_{{ij}} {\plus}{\varepsilon}_{{ij}} $$
where Y ij is the observation of dependent variables, μ the overall mean, SA i the effect of slaughter age, FF j the effect of finishing feed, SA×FF is the effect of interaction of the ith slaughter age and the jth finishing feed and ε ij the residual random error associated with the observation. Fixed effect of slaughter age and finishing feed was included in the model, only when significance was showed.
Principal component analysis (PCA) was applied to study the relationship between colour coordinates, tissue composition, the degree of fatness, SCF colour and conformation categories. Principal component analysis determines linear combinations of the original variables to summarize the data with minimal loss of information. The factors obtained were used to create plots for 13- and 26-month-old foals on the bi-dimensional space formed by factors 1 and 2.
Colour values taken on the LTD muscle and fatty carcass surface and tissue composition (carcass percentages) were introduced as independent variables into a lineal regression model (by steps) to estimate the degree of fatness (dependant variable) where carcasses were classified. The same parameters were introduced into one second lineal regression model to estimate the conformation (dependant variable) where carcasses were classified. When models were not useful, those quantitative variables were expressed as mean±SD belonging to each classification category.
Results
Production variables, carcass measurements and prime cuts
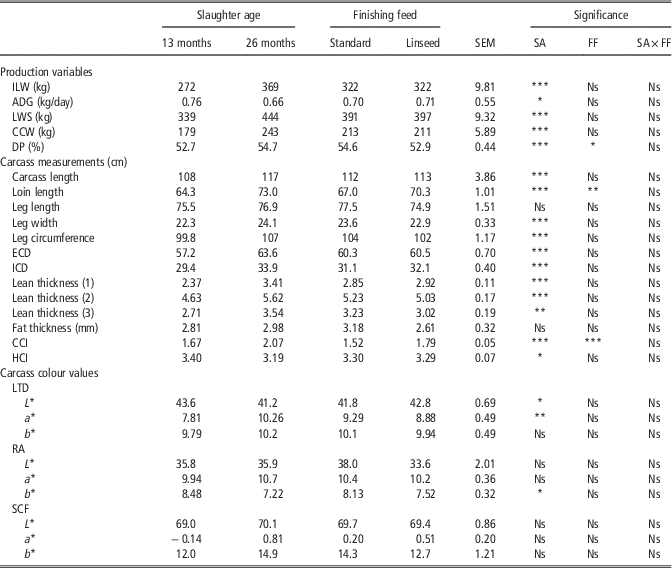
Table 2 shows the results of ANOVA on production variables, carcass measurements and carcass colour coordinates. Any significant interactions between the main categories (slaughter age×finishing feed) (SA×FF) were found. According to slaughter age, 26M foals had an initial live weight at the start of the fattening period higher than 13M foals (P<0.001). The average daily gain was higher for 13M than 26M foals as well (P<0.05). Unsurprisingly, 26M had a higher live weight at slaughter than 13M foals, which was also reflected in their cold carcass weights and dressing percentage (P<0.001). Regarding FF, only the dressing percentage was lower (P<0.05) in LF than in SF group.
Effect of slaughter age (SA) (13 v. 26 months) and finishing feed (FF) (standard v. linseed) on production variables, carcass measurements and carcass colour (L*, a*, b* values) from Galician Mountain×Burguete crossbred foals (mean and SEM)

ILW=initial live weight at the beginning of finishing period; ADG=average daily gain during finishing period; LWS=live weight at slaughter age; CCW=cold carcass weight; DP=dressing percentage; ECD=external chest depth; ICD=internal chest depth; CCI=carcass compactness index; HCI=hind limb compactness index; LTD=Latissimus dorsi; RA=Rectus abdominis; SCF=subcutaneous fat.
*P<0.05, **P<0.01, ***P<0.001, Ns=non significant (P>0.05).
All the carcass measurements increased with SA (P<0.001) except the leg length and the fat thickness which were not statistically different. Carcass compactness index was higher in 26M than in 13M foals (P<0.001) as well. The HCI was however higher (P<0.05) in 13M foals. According to FF, loin length and CCI were higher (P<0.01) in LF than in SF whereas fat thickness was not statistically different.
Slaughter age only showed significant effect over L* (P<0.05) and a* (P<0.01) from LTD and b* (P<0.05) from RA (Table 2). Lightness (L*) was lower in 26M than in 13M foals and redness (a*) was higher in 26M than in 13M foals. On the other hand, FF did not show any significant effect on carcass colour values.
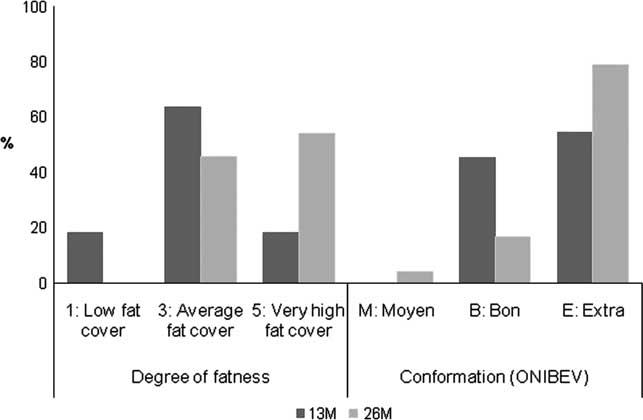
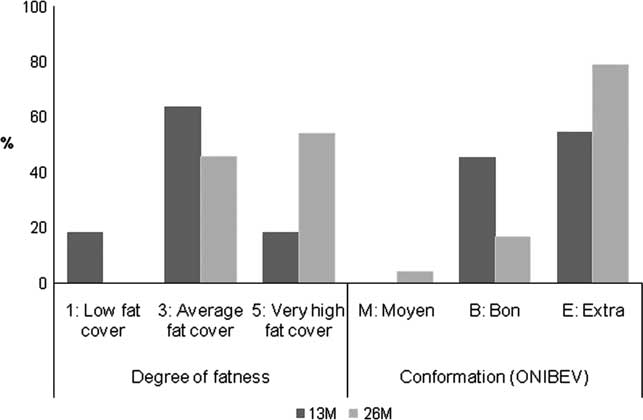
Figure 1 depicts the percentage distribution of the carcasses in each category of degree of fatness and conformation according to foals’ age. Most (64%) of 13M foals were scored in category 3 (average fat cover) whereas just over half (54%) of 26M foals were over-finished and scored in category 5 (very high fat cover). Concurrently, 54% of 13M and 79% of 26M foals were scored in category E (Extra) for conformation. Thus, the oldest animals reached the highest score using the ONIBEV classification. Regarding SCF colour, the majority of carcasses, 64% of 13M and 91% of 26M foals, were scored in category 3 (yellowish-white subcutaneous fat), and 18% of 26M and 32% of 13M foals were scored in category 5 (strong yellow subcutaneous fat). Just 5% of 13M foals were classified in category 1 (white subcutaneous fat).
Percentage distribution of the degree of fatness and conformation of foals slaughtered at the age of 13 and 26 months (13M and 26M).
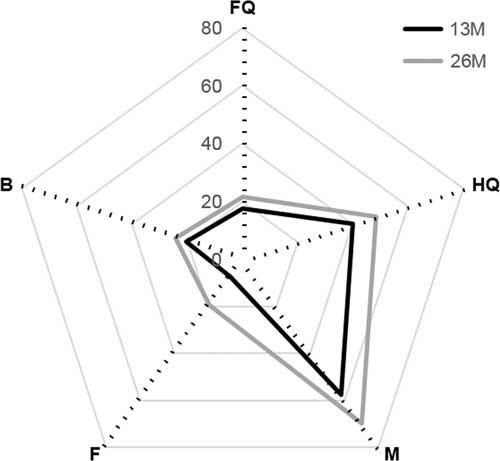
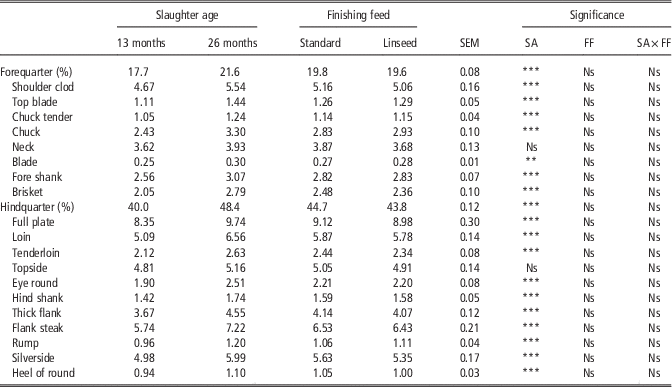
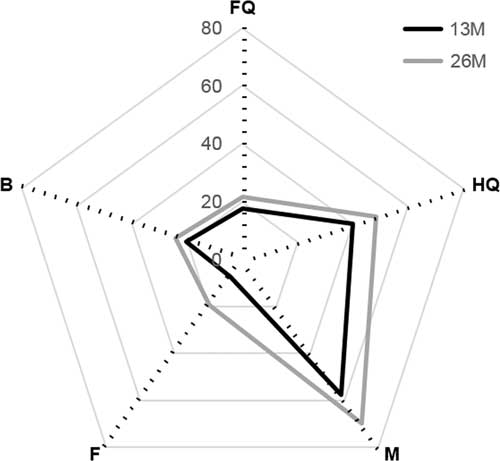
The prime fore- and hindquarter cuts are shown in Table 3. Fore- and hindquarters and meat, fat and bone percentages of 26M against 13M foals are shown in Figure 2. The larger carcasses from 26M had bigger prime cuts than 13M foals, both in the lean part of the forequarter (shoulder clod and chuck) and of the hindquarter (loin, tenderloin, topside, eye round thick flack and silverside) (P<0.001). Meat, fat and bone percentage were lower in 13M than in 26M (57.7 v. 70.1; 7.2 v. 19.5; 20.2 v. 24.1 for meat, fat and bone, respectively) (%) (P<0.01). Nevertheless, 13M foals showed meat : bone ratio slightly lower than 26M foals (2.8 v. 2.9). Finishing feed did not affected prime cuts nor tissue composition.
Percentage distribution of the tissue composition of foals slaughtered at the age of 13 and 26 months (13M and 26M). Values of meat, fat and bone percentages obtained from Carballo et al. (Reference Carballo, Monserrat and Sánchez2000) methodology. FQ=forequarter; HQ=hindquarter; M=meat; B=bone; F=fat.
Effect of slaughter age (SA) (13 v. 26 months) and finishing feed (FF) (standard v. linseed) on the main commercial meat cuts from Galician Mountain×Burguete crossbred foals (mean and SEM)

**P<0.01, ***P<0.001, Ns=non significant (P>0.05).
Relationship between quantitative and qualitative variables
Regression equations to predict degree of fatness, conformation and SCF colour grading were determined. Instrumental colour parameters (L*, a*, b*) and tissue composition were included in each model. Colour values were not useful to predict any category. Nevertheless, fore- and hindquarter (FQ, HQ), fat (F) and meat (M) could estimate the degree of fatness (degree of fatness=−3.46+0.04FQ+0.06HQ+ 0.06F+0.05M) and conformation (conformation=−10.23+ 0.01FQ+0.11HQ−0.03F+0.11M) but not the SCF colour category. Coefficient values (R 2) indicated that tissue composition could explain 33% (P<0.01) and 36% (P<0.001) of the variability for degree of fatness and conformation scores, respectively.
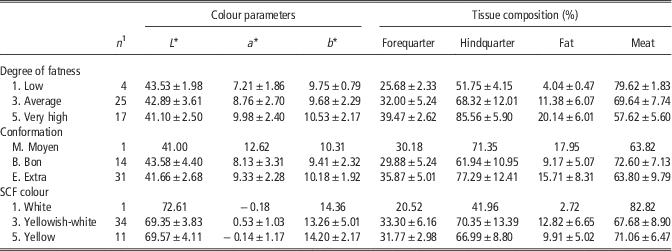
Table 4 shows the LTD colour parameters (L*, a*, b*) and tissue composition for the degree of fatness and conformation categories, and subcutaneous fat colour values (L*, a*, b*) and tissue composition for SCF colour category. With regard to degree of fatness, those carcasses classified in category 1 (low fat colour) had the highest L* and the lowest a* values, opposite to those classified in category 5 (very high fat colour) which showed the lowest L* and the highest a* values. Yellowness (b*) presented similar values for the three levels of degree of fatness although it was higher in category 5 (very high fat colour). According to conformation and SCF colour categories, colour values did not reveal a clear trend. In SCF colour grading, only fat brightness values (L*) were higher in those carcasses classified in category 1 (white subcutaneous fat) than those classified in category 5 (strong yellow subcutaneous fat). Similar results were shown for tissue composition. Regarding degree of fatness and conformation, carcasses classified in the best categories (very high fat cover and Extra) presented higher forequarter, hindquarter and fat values.
Classification of colour and tissue composition according to the degree of fatness, conformation and subcutaneous fat colour categories where carcasses from Galician Mountain×Burguete crossbred foals were assigned (Mean±SD)

SCF=subcutaneous fat.
1 n=number of samples classified in each grading category.
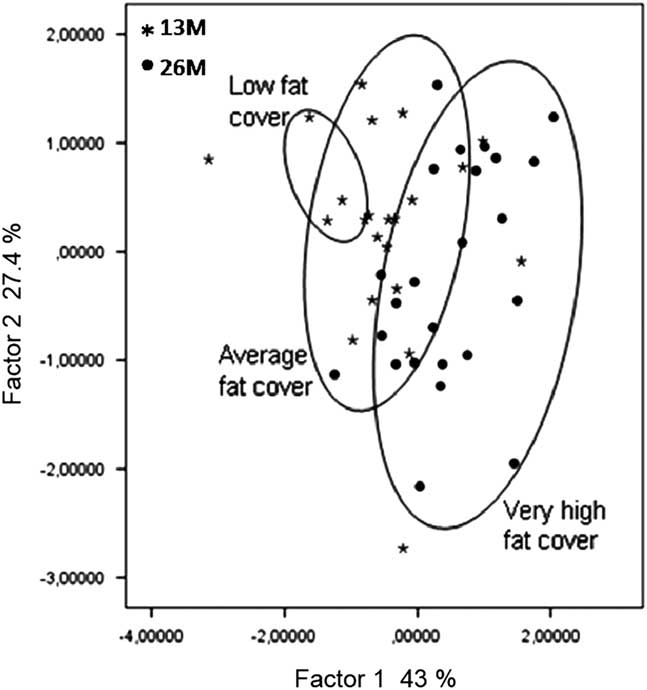
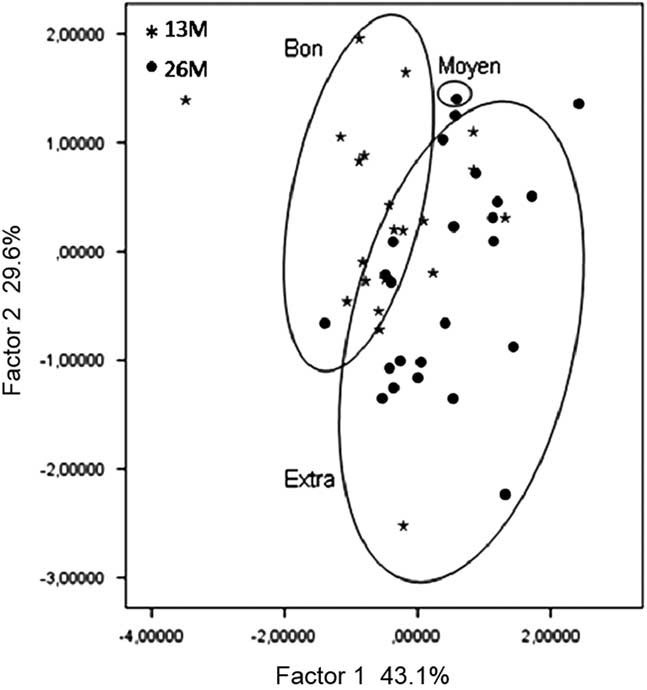
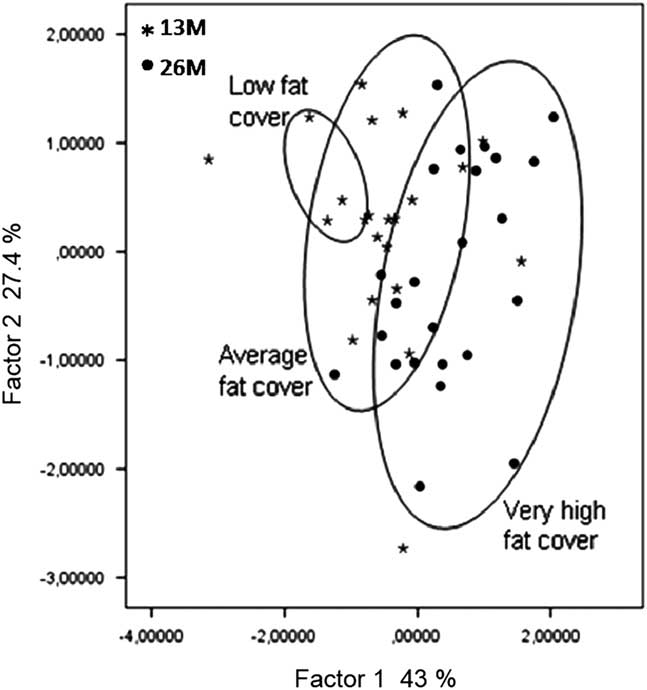
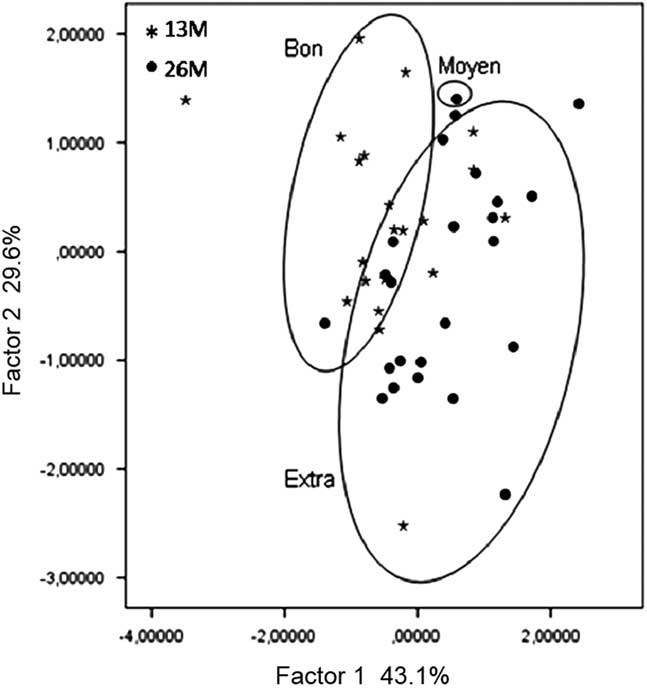
Colour and tisular composition values were introduced in the PCA and were useful to classify the samples. Figures 3 and 4 showed three different groups belonging to the three categories of degree of fatness (Figure 3) and conformation (Figure 4). Both Figures 3 and 4 show results of the plot of 26M and 13M foals in the bi-dimensional space employing the most suitable components (factors 1 and 2). The factor 1 accounted for 43.01% (Figure 3) and 43.07% (Figure 4) whereas the factor 2 explained 27.37% (Figure 3) and 29.60% (Figure 4) of the total variability. Most of the 26M foals showed very high fat cover (category 5) and were classified as Extra in ONIBEV classification, whereas carcasses from 13M foals seemed to range from ‘low fat cover’ to ‘average’ and were classified as Moyen or Bon.
Distribution of foals slaughtered at the age of 13 and 26 months (13M and 26M) according to degrees of fatness categories.
Distribution of foals slaughtered at the age of 13 and 26 months (13M and 26M) according to conformation categories.
Discussion
Productive parameters, carcass measurements and prime cuts
Slaughter age and finishing feed were studied as independent factors due to the absence of interaction between the main factors. According to production variables (Table 2), the most important difference found between the 26M and 13M foals was the life weight at slaughter. It could be explained because the 26M foals were already close to the final adult weight, and the average daily gain increase was much lower than the first year of animals’ growth.
Regarding life weight, several authors reported lower mean values in comparison with this study. These are Juárez et al. (Reference Juárez, Polvillo, Gómez, Alcalde, Romero and Valera2009) (400 respectively) in Burguete foals aged 24 months, Franco and Lorenzo (Reference Horcada2014) (256 kg, Galician Mountain foals breed; 312 kg, Galicain Mountain×Hispano Bretón crossbreed) and Polidori et al. (Reference Robelin, Boccard, Martin-Rosset, Jussiaux, Trillaud-Geyl, Jarrige and Martin-Rosset2008) (181 kg) in donkey foals slaughtered at 15 months. On the other hand, the mean live weight at slaughter of 26M foals was slightly lower than the 500.7 kg reported by Martin-Rosset et al. (Reference Martin-Rosset, Vernet, Dubroeucq, Picard and Vermorel2008) in older foals. According to carcass weight, higher values as 260.9 kg (Sarriés and Beriain, Reference Sarriés, Lorenzo, Crecente, Díaz, Ruiz, Franco, Beriain, Dominguez, Insausti, Agregán and Purroy2005) and 258.9 kg (Juárez et al., Reference Juárez, Polvillo, Gómez, Alcalde, Romero and Valera2009) were showed in comparison with this study. On the other hand, Franco et al. (Reference Franco and Lorenzo2013) reported lower values for than the ones mentioned (128.5 kg). Sarriés and Beriain (Reference Sarriés, Lorenzo, Crecente, Díaz, Ruiz, Franco, Beriain, Dominguez, Insausti, Agregán and Purroy2005) have already stated the differences found in the dressing percentage due to the slaughter age between 16- and 24-month-old foals (63.55% v. 67.15%, respectively). In addition, higher values were reported by Juárez et al. (Reference Juárez, Polvillo, Gómez, Alcalde, Romero and Valera2009) (65.7%) and lower by Franco et al. (Reference Franco and Lorenzo2013) (50.3%) in comparison with this study. Carcass length values in 26M was higher than in 13M foals as Sarriés and Beriain (Reference Sarriés, Lorenzo, Crecente, Díaz, Ruiz, Franco, Beriain, Dominguez, Insausti, Agregán and Purroy2005) showed on Burguete foals slaughtered at 24 and 16 months of age (170.08 v. 124.60 cm, respectively). These outcomes were different from those reported by Franco et al. (Reference Franco, Crecente, Vázquez, Gómez and Lorenzo2011) in Galician Mountain (82.50 to 95.02 cm). The values of the variables related to leg in 13M foals were higher than those obtained by Franco et al. (Reference Franco and Lorenzo2013) (75.39>72.23; 22.27>18.82 and 99.71>86.29 cm for leg length, leg width and leg circumference, respectively) in Galician Mountain foals slaughtered at 15 months old. On the other hand, CCI values in 26M foals were similar to those noticed by Sarriés and Beriain (Reference Sarriés, Lorenzo, Crecente, Díaz, Ruiz, Franco, Beriain, Dominguez, Insausti, Agregán and Purroy2005) for Burguete foals slaughtered at 24 months of age (2.10). Nevertheless, CCI values in 13M foals were higher than other studies (Franco et al., Reference Franco, Crecente, Vázquez, Gómez and Lorenzo2011 and Reference Franco and Lorenzo2013) with Galician Mountain foals slaughtered at 15 and 12 months of age (1.25 v. 1.24, respectively). In this study, ICC values in 13M foals were similar to those obtained in Burguete slaughtered at 16-month-old foals (1.63) (Sarriés and Beriain, Reference Sarriés, Lorenzo, Crecente, Díaz, Ruiz, Franco, Beriain, Dominguez, Insausti, Agregán and Purroy2005).
According to colour coordinates (L*, a*, b*), they all are lower in both LTD and subcutaneous fat compared with data reported by Sarriés and Beriain (Reference Sarriés, Lorenzo, Crecente, Díaz, Ruiz, Franco, Beriain, Dominguez, Insausti, Agregán and Purroy2005) and Juárez et al. (Reference Juárez, Polvillo, Gómez, Alcalde, Romero and Valera2009). In this context, a* values in LTD were lower than those observed by Sarriés and Beriain (Reference Sarriés, Lorenzo, Crecente, Díaz, Ruiz, Franco, Beriain, Dominguez, Insausti, Agregán and Purroy2005) in foals slaughtered at 16 and 24 months (11.27 v. 13.03, respectively), and by Juárez et al. (Reference Juárez, Polvillo, Gómez, Alcalde, Romero and Valera2009) in Burguete (24.2) and Hispano-Bretón (19.8) foals slaughtered at 24 months. This fact could mean that muscle and fat of the foal carcasses studied are darker (low L* values), less red (low a* values) and less yellow (low b* values) than other breeds as Hispano-Bretón and Burguete breeds. Sarriés et al. (2016) have already reported degree of fatness and conformation results for 13M foals. According to degree of fatness, conformation and SCF colour grading, our findings are in agreement with those reported by Sarriés and Beriain (Reference Sarriés, Lorenzo, Crecente, Díaz, Ruiz, Franco, Beriain, Dominguez, Insausti, Agregán and Purroy2005), Fàbregas and Such (Reference Franco, Rodríguez, Purriños, Crecente, Bermúdez and Lorenzo2001) who observed that the oldest foals showed higher degrees on fatness. On the other hand, the results obtained for conformation are in disagreement with data from Fàbregas and Such (Reference Franco, Rodríguez, Purriños, Crecente, Bermúdez and Lorenzo2001) and Sarriés and Beriain (Reference Sarriés, Lorenzo, Crecente, Díaz, Ruiz, Franco, Beriain, Dominguez, Insausti, Agregán and Purroy2005). They showed the greatest population percentage in category B (Bon), whereas in our study they are in category E (Extra). This study supports the statements of Fàbregas and Such (Reference Franco, Rodríguez, Purriños, Crecente, Bermúdez and Lorenzo2001) confirming that conformation improves with increased fat cover.
Regarding main commercial cuts, almost all the prime forequarter cuts had similar percentages to those obtained by Franco et al. (Reference Franco, Crecente, Vázquez, Gómez and Lorenzo2011 and Reference Franco and Lorenzo2013) in Galician Mountain foals slaughtered at 12 and 15 months. In the hindquarters, hind shank and rump values were lower and flank steak and silverside percentages were higher than values observed by Franco et al. (Reference Franco and Lorenzo2013) in Galician Mountain and Galician Mountain×Hispano Bretón foals. In the present study, bone percentages from 13M foals were slightly lower than those obtained by Franco et al. (Reference Franco and Lorenzo2013) in foals slaughtered at 15 months aged (23.87%) and similar to those reported by Franco et al. (Reference Franco, Crecente, Vázquez, Gómez and Lorenzo2011) in foals slaughtered at 10 months aged (20.30%). Fat values in 13M foals were also similar to those noticed by Franco et al. (Reference Franco and Lorenzo2013) in foals slaughtered at 15 months of age (6.43%).
Take into account all results, fat was a clear parameter for 26M foals to be classified in category 5 as ‘high’ for the degree of fatness and as ‘Extra’ in the ONIBEV classification. In addition, according to the use of metabolic energy changes with age, young foals tend to convert energy into muscle, whereas older animals transfer energy into adipose tissue (Sarriés and Beriain, Reference Sarriés, Lorenzo, Crecente, Díaz, Ruiz, Franco, Beriain, Dominguez, Insausti, Agregán and Purroy2005; Tateo et al., 2008; Franco et al., Reference Franco, Crecente, Vázquez, Gómez and Lorenzo2011). Regarding meat : bone ratio, the results obtained for both 13M and 26M foals were similar to the data reported by Franco et al. (Reference Franco and Lorenzo2013) in foals slaughtered at 15 months (2.9 to 3.1). The results obtained for 26M foals (2.9) were highly lower than those noticed by Martin-Rosset et al. (Reference Martin-Rosset, Boccard, Jussiaux, Robelin and Trillaud1980) (4.7) in foals slaughtered at the age of 24 months. Therefore, to improve prime cuts and carcass percentages, it could be advisable to increase the age at slaughter. Nevertheless, the increase of fat percentage made the meat percentage not increase enough to obtain better meat : bone ratio. From the productive and commercial point of view, these results are important as carcass value depends on meat, fat and bone percentage (Carballo et al., Reference Carballo, Monserrat and Sánchez2000). In addition, the meat : bone ratio indicates the aptitude for meat production. Our results are more similar to those obtained from foals of native breeds and early slaughtered (Lorenzo et al., Reference Martin-Rosset2014). The meat : bone ratio obtained had not been improved with increasing slaughter age.
If further studies of tissue composition in foal carcasses were developed, it would be possible predict the optimal body condition scores of animals to be slaughtered following the standardized method performed in France (Institut National de la Recherche Agronomique et al., 1997; Martin-Rosset, 2015).
Linear regression models to estimate degree of fatness and conformation, showed positive values for fore-, hindquarter and meat indicating a positive relationship with higher classification category scores, which in turn increased with age. Most of the animals classified in the highest categories, 5 (high fat cover) and E (Extra) were 26M foals, and they showed higher tissue composition values than those from 13M foals. Thus, slaughter age could be the most important factor determining carcass quality (see also Figures 3 and 4). Rather than being slaughtered at 13 months of age, foals should be possibly be kept longer on pasture or have an extended finishing period to improve the carcass fat cover and conformation. The relation between colour values (L*, a* and b*) and tissue composition according to degree of fatness, conformation, and SCF colour grading showed that carcasses classified ‘Extra’ presented similar L*, a*, b* values to those obtained from ‘high fat cover’. Finally, the present results state that conformation is only based on tissue composition and not on colour values. Concerning SCF colour evaluation, it is showed that there was not any relationship with the variables measured. It might be due to the low sample’s dispersion. Thus, further studies are required to develop more accurate results in SCF colour of foal carcasses.
Conclusions
From these results, we can conclude that slaughter age had a strong effect on all productivity or carcass characteristics. Carcass measurements, prime cuts and tissue composition and hence grading were improved in older animals. In addition, grading results show that a quality classification system could benefit the foal meat sector. Foals slaughtered at 13 months of age did not achieve optimal fat cover and conformation. Carcasses from foals slaughtered at 26 months of age did not reached better meat : bone ratio value than the youngers. Further studies would be necessary to find the ideal slaughter age between 13 and 26 months, in which, the best carcass quality classification and the optimal meat : bone ratio for an adequate aptitude of foals for meat production are balanced. With regard to finishing feeding, it had little or no effect on any productivity or carcass characteristics. It is evident that the amount of linseed provided (5%) was not enough to show differences against standard finishing feed. However, it would be interesting to develop further studies increasing the linseed concentration as a positive influence has been demonstrated in other species.
Acknowledgement
This work was supported by INIA (project RTA 2012-00090-C03-01).