The incidence of depressive symptoms rises sharply during the early to midadolescent phase (Lewinsohn, Hops, Roberts, Seeley, & Andrews, Reference Lewinsohn, Hops, Roberts, Seeley and Andrews1993; Lewinsohn, Rohde, & Seeley, Reference Lewinsohn, Rohde and Seeley1998). The point prevalence of adolescent unipolar depressive disorders has been estimated to be between 0.4% and 8%, with 28% of adolescents experiencing a diagnosable depressive episode by age 19 (Birmaher et al., Reference Birmaher, Ryan, Williamson, Brent, Kaufman and Dahl1996; Lewinsohn et al., Reference Lewinsohn, Rohde and Seeley1998). Increasing evidence suggests that depression in adolescence is associated with increased risk of later depressive episodes (Birmaher et al., Reference Birmaher, Ryan, Williamson, Brent, Kaufman and Dahl1996; Fergusson, Boden, & Horwood, Reference Fergusson, Boden and Horwood2007; Harrington & Vostanis, Reference Harrington, Vostanis and Goodyer1995), anxiety, and suicidal behaviors (Fergusson et al., Reference Fergusson, Boden and Horwood2007). In addition, rates of diagnosable depressive disorders underestimate the extent of the problem that adolescents face as a consequence of depressive conditions. A substantial proportion of adolescents experience elevated levels of depressive symptoms, although subdiagnostic (Hops, Lewinsohn, Andrews, & Roberts, Reference Hops, Lewinsohn, Andrews and Roberts1990). These adolescents are at increased risk of developing depressive disorders during adolescence and adulthood (Gotlib, Lewinsohn, & Seeley, Reference Gotlib, Lewinsohn and Seeley1995; Pine, Cohen, Cohen, & Brook, Reference Pine, Cohen, Cohen and Brook1999; Weissman, Fendrich, Warner, & Wickramaratne, Reference Weissman, Fendrich, Warner and Wickramaratne1992) and, moreover, present with many of the same social, clinical, and behavioral problems as do youth who meet diagnostic criteria (Gotlib et al., Reference Gotlib, Lewinsohn and Seeley1995).
These facts underscore the importance of understanding vulnerability factors for depression that may be operating during the adolescent phase of life. A strong evidentiary base has been established regarding the role of family processes in child and adolescent depression (Herring & Kaslow, Reference Herring and Kaslow2002; Sheeber, Hops, & Davis, Reference Sheeber, Hops and Davis2001). Family processes have actually been shown to predict adolescent depression more strongly than the peer environment (Stice, Ragan, & Randall, Reference Stice, Ragan and Randall2004). In particular, several dimensions of parenting behavior have been associated with depressive symptoms and disorders. These include the affective quality of parent–child interactions and parental socialization of (i.e., responses to) adolescent emotional behavior (Sheeber et al., Reference Sheeber, Hops and Davis2001). Substantial evidence suggests that adolescents are at risk for depressive symptoms or disorders as a function of ongoing exposure to adverse family environments characterized by the absence of supportive and warm interactions and by elevated levels of harsh and conflictual interactions (Garber, Robinson, & Valentiner, Reference Garber, Robinson and Valentiner1997; Ge, Conger, Lorenz, & Simons, Reference Ge, Conger, Lorenz and Simons1994; Park, Garber, Ciesla, & Ellis, Reference Park, Garber, Ciesla and Ellis2008; Pavlidis & McCauley, Reference Pavlidis and McCauley2001; Sheeber, Davis, Leve, Hops, & Tildesley, Reference Sheeber, Davis, Leve, Hops and Tildesley2007; Vazsonyi & Belliston, Reference Vazsonyi and Belliston2006). Research on community and clinical samples, moreover, indicates that the quality of parent–child interactions predicts the course of depressive symptoms over time (Asarnow, Goldstein, Tompson, & Guthrie, Reference Asarnow, Goldstein, Tompson and Guthrie1993; Rueter, Scaramella, Wallace, & Conger, Reference Rueter, Scaramella, Wallace and Conger1999; Sanford et al., Reference Sanford, Szatmari, Spinner, Munroe-Blum, Jamieson and Walsh1995) and response to treatment (Birmaher et al., Reference Birmaher, Brent, Kolko, Baugher, Bridge and Holder2000). These findings are consistent with evidence regarding the detrimental effect of chronic interpersonal stress on children's emotional well-being (Compas, Grant, & Ey, Reference Compas, Grant, Ey, Reynolds and Johnston1994; Rudolph et al., Reference Rudolph, Hammen, Burge, Lindberg, Herzberg and Daley2000). However, despite these consistent findings, it is also evident that not all adolescents are equally sensitive to the depressogenic effects of adverse family environments. Establishing the determinants of these individual differences in sensitivity to family contexts remains a critical issue for further research (Allen & Sheeber, Reference Allen, Sheeber, Allen and Sheeber2008; Belsky, Bakermans-Kranenburg, & van IJzendoorn, Reference Belsky, Bakermans-Kranenburg and van IJzendoorn2007; Boyce & Ellis, Reference Boyce and Ellis2005).
Many scientists contend that it is the interaction between biological and environmental factors that alter risk for psychiatric disorders and symptoms (Caspi & Moffitt, Reference Caspi and Moffitt2006; Moffitt, Caspi, & Rutter, Reference Moffitt, Caspi and Rutter2005; Rutter, Moffitt, & Caspi, Reference Rutter, Moffitt and Caspi2006), including adolescent-onset disorders (Cadoret et al., Reference Cadoret, Winokur, Langbehn, Troughton, Yates and Stewart1996; Yap et al., Reference Yap, Whittle, Yücel, Sheeber, Pantelis and Simmons2008). Diathesis–stress models have been prominent in suggesting that genetic and other biological vulnerabilities or predispositions (diathesis) interact with the environment to trigger psychological disorders (Zuckerman, Reference Zuckerman1999). Note that recent research has provided evidence that “vulnerable” individuals identified by diathesis–stress models might be more accurately described as “sensitive,” because they might actually be more likely to reap the most benefit from supportive and enriching environments relative to less “sensitive” individuals (Belsky & Pluess, in press). Based on such research and supported by evolutionary theory, Boyce and Ellis' (Reference Boyce and Ellis2005) biological sensitivity to context theory and Belsky and colleagues' (Reference Belsky, Bakermans-Kranenburg and van IJzendoorn2007) differential susceptibility theory both contend that the effects of biobehavioral reactivity to the environment on psychiatric outcomes are bivalent, giving rise to negative outcomes under adverse conditions and positive outcomes under low stress conditions. The accompanying papers in this special issue provide support for these theories.
To date, “sensitivity” or “susceptibility” factors identified in the literature have included behavioral characteristics (e.g., temperament), candidate genes, or other biological characteristics such as physiological, immunologic, or adrenocortical reactivity (see Belsky & Pluess, in press; Obradovic & Boyce, Reference Obradovic and Boyce2009). Boyce and Ellis (Reference Boyce and Ellis2005) suggest that biologically rooted individual differences in stress–response systems may serve as a useful measure of sensitivity. Such individual differences influence the way in which individuals behave within, and react to, important environmental contexts, and have been suggested to mediate the associations between genetic risk and psychopathology (Boyce & Ellis, Reference Boyce and Ellis2005). Using brain structure as a measure of sensitivity may be an advantageous means of operationalizing the stress response system given that it is more temporally stable than other indices of biological reactivity and may provide integrative representations of cumulative biological perturbations over time. Thus, brain structure may represent a useful and complementary measure to help inform current knowledge of the mechanisms underlying individual differences in sensitivity to context.
Notably, maturation of the adolescent brain is proposed to contribute a specific vulnerability for adolescent depressive disorder (Andersen, Reference Andersen2003). The brain undergoes significant structural change during adolescence (Paus, Reference Paus2005; Shaw et al., Reference Shaw, Greenstein, Lerch, Clasen, Lenroot and Gogtay2006), particularly in brain regions associated with social cognition, emotional experience, emotion regulation, and cognitive control (Nelson, Leibenluft, McClure, & Pine, Reference Nelson, Leibenluft, McClure and Pine2005). Research in both adults and adolescents shows that structural abnormalities associated with depression are predominantly observed in those brain regions that undergo most rapid and dynamic change during adolescence (Davey, Yucel, & Allen, Reference Davey, Yucel and Allen2008). Specifically, these abnormalities may underlie relevant deficits in affective processing and regulation (Drevets, Reference Drevets2001). Thus, the structural properties of these brain regions may be critical determinants of sensitivity to environmental contexts during adolescence given that these regions (a) are undergoing dramatic remodeling and therefore may be more plastic (i.e., more likely to be shaped by environmental contingencies; Andersen & Teicher, Reference Andersen and Teicher2008) and (b) are particularly involved in responding to affective signals from the environment and/or regulating behavior as a consequence of this initial processing (Phillips, Drevets, Rauch, & Lane, Reference Phillips, Drevets, Rauch and Lane2003).
The structure of the hippocampus, a region whose key functions include contextual learning and memory formation (Holland & Bouton, Reference Holland and Bouton1999), may be particularly important in determining sensitivity to the depressogenic effects of environments. Research shows that the hippocampus develops both structurally and functionally across childhood and adolescence (Giedd et al., Reference Giedd, Vaituzis, Hamburger, Lange, Rajapakse and Kaysen1996; Paz-Alonso, Ghetti, Donohue, Goodman, & Bunge, Reference Paz-Alonso, Ghetti, Donohue, Goodman and Bunge2008), and it is highly sensitive to environmental contexts. Rodent studies show that stress exposure can alter hippocampal volume and function (Bagot et al., Reference Bagot, van Hasselt, Champagne, Meaney, Krugers and Joels2009; McEwen, Reference McEwen1999). Animal research also provides evidence that prolonged exposure to stress can result in dendritic atrophy of hippocampal cells and deficits in memory formation (Brunson et al., Reference Brunson, Kramar, Lin, Chen, Colgin and Yanagihara2005). It has actually been suggested that stress effects on the hippocampus may have the most prominent functional impact if occurring during the adolescent phase (Tottenham & Sheridan, Reference Tottenham and Sheridan2010). Other research with both animals and humans shows that positive stress and learning experiences can have opposite effects on hippocampal structure (i.e., increased volume) and function (Leuner & Gould, Reference Leuner and Gould2010).
The hippocampus has received considerable attention in the depression literature. A large body of neuropsychological and neuroimaging studies shows that the hippocampus is involved in learning and memory deficits that often accompany depression. For example, depressed patients show marked deficiencies in episodic memory (Sweeney, Kmiec, & Kupfer, Reference Sweeney, Kmiec and Kupfer2000), a key function of the hippocampus. Rodent lesion studies also show that the hippocampus is important for approach behaviors, including those relevant to social interaction (see Bannerman et al., Reference Bannerman, Rawlins, McHugh, Deacon, Yee and Bast2004), which are compromised in depressed individuals (Davey et al., Reference Davey, Yucel and Allen2008).
Findings regarding hippocampal volume in major depressive disorder (MDD), however, are inconsistent. Adult patients show either no volumetric differences or smaller volumes compared to controls, with some evidence that smaller volumes might be associated with illness-related processes (e.g., medication effects or stress-related neurotoxicity) and clinical symptoms (McKinnon, Yucel, Nazarov, & MacQueen, Reference McKinnon, Yucel, Nazarov and MacQueen2009; Vakili et al., Reference Vakili, Pillay, Lafer, Fava, Renshaw and Bondello-Cintron2000; Videbech & Ravnkilde, Reference Videbech and Ravnkilde2004). In younger populations the results are also inconsistent. For example, there are reports of either no volumetric differences (Rosso et al., Reference Rosso, Cintron, Steingard, Renshaw, Young and Yurgelun-Todd2005) or smaller volumes (MacMaster et al., Reference MacMaster, Mirza, Szeszko, Kmiecik, Easter and Taormina2008) in adolescent samples. In both of these studies, there was no association between hippocampal volume and depressive symptoms; however, in the latter study, larger hippocampal volumes were associated with longer illness duration. There have also been reports of a substantial left greater than right reduction in hippocampal volume (MacMaster & Kusumakar, Reference MacMaster and Kusumakar2004) and greater amygdala/hippocampal ratio (MacMillan et al., Reference MacMillan, Szeszko, Moore, Madden, Lorch and Ivey2003) in adolescent depressed samples, although the authors suggested that this latter finding might be more directly associated with the degree of comorbid anxiety. Further, some research suggests that smaller hippocampal volume may represent a risk factor for MDD. For example, smaller volumes have been found in individuals with genetic risk for MDD (Zobel et al., Reference Zobel, Jessen, von Widdern, Schuhmacher, Hofels and Metten2008), although an earlier study found no volumetric differences (Rosso et al., Reference Rosso, Cintron, Steingard, Renshaw, Young and Yurgelun-Todd2005).
However, a recent meta-analysis of hippocampal volumetric findings in MDD suggests that volumetric change is likely to occur after illness onset, rather than represent a vulnerability factor (McKinnon et al., Reference McKinnon, Yucel, Nazarov and MacQueen2009).
Thus, although abnormalities in brain structure, particularly hippocampal volume, have been associated with depressive disorders in both adolescents and adults, with some (albeit less consistent) evidence that these abnormalities may represent a vulnerability factor, the findings have not been consistent. It is also unclear whether volumetric abnormalities are associated with depressive symptoms. These inconsistencies may be due to differences between study samples in length and onset of illness, medication, and comorbid psychopathology. To our knowledge, no study has investigated the relationship between depressive symptoms and hippocampal volume in healthy individuals without a depressive disorder diagnosis. Further, inconsistencies may also have arisen because studies failed to take into account potential moderating effects of salient environmental factors. That is, evidence for lesser volume in one depressed sample but no evidence for volumetric differences in another depressed sample might be reconciled if key environmental factors are found to operate differently in each group. Thus, investigating the moderating effects of salient environmental factors in adolescence on the relationship between hippocampal volume and adolescent depressive symptoms may be particularly informative.
We have recently provided cross-sectional evidence that individual differences in the volume of limbic regions involved in affective reactivity and regulation (including the amygdala and the anterior cingulate cortex) may confer sensitivity to the depressogenic effects of the family environment, particularly with respect to the protective effects of low levels of maternal aggressive behavior (Yap et al., Reference Yap, Whittle, Yücel, Sheeber, Pantelis and Simmons2008). “Aggressive” behavior in this study (and in the present study, described below) refers to speech or nonverbal behaviors with contemptuous, angry, or belligerent affect, as well as disapproving, threatening, or argumentative verbal content. Although there were no significant effects for the hippocampus in this previous work, given the role of the hippocampus in environmental processing and links between hippocampal volume and depression, further investigation of this structure is warranted. In particular, prospective investigation of these relationships may reveal different (and more causally important) patterns of association than those observed in cross-sectional analyses. For example, recent analyses of individual differences in amygdala volume have revealed that these variations interact with the aggressiveness of maternal behavior to predict changes in depressive symptoms over time (Allen et al., Reference Friedrich2010), further suggesting that more detailed analysis of the prospective relationship between hippocampal volume and sensitivity to environmental contingencies is warranted.
Thus, the present study aimed to build on our previous work by examining the prospective relationship between hippocampal volume, maternal aggressive behavior, and changes in depressive symptoms. The sample is a subsample of that described in Yap et al. (Reference Yap, Whittle, Yücel, Sheeber, Pantelis and Simmons2008). We aimed to investigate whether individual differences in hippocampal volume might determine sensitivity to environmental context with respect to vulnerability for the emergence of depressive symptoms during early to midadolescence. We adopted a measure of observed aggressive maternal behavior directed at the adolescent based on the literature described above, as well as our own previous work (Yap et al., Reference Yap, Whittle, Yücel, Sheeber, Pantelis and Simmons2008). As mentioned, we have previously reported evidence for the protective effects of low levels of aggressive maternal behavior in biologically sensitive individuals (Yap et al., Reference Yap, Whittle, Yücel, Sheeber, Pantelis and Simmons2008). In this study, we predicted a main effect of aggressive maternal behavior on the prospective prediction of adolescent depressive symptoms, when controlling for baseline symptom levels. We also predicted that there would be no main effect of hippocampal volume, but there would be an interaction between hippocampal volume and aggressive maternal behavior in the prediction of change in depressive symptoms, such that the predictive effect of hippocampal volume on depressive symptoms will vary according to the level of maternal aggressive behavior. That is, we predicted that individuals with “vulnerable” smaller hippocampal volumes (based on the limited literature) would experience an exacerbation of depressive symptoms in the context of higher levels of maternal aggressive behavior, whereas lower levels of maternal aggressive behavior would alleviate depressive symptoms. We examined depressive symptoms rather than case-level disorder in this age group because of the well-established relationship between increasing symptoms and later disorder (Shankman et al., Reference Shankman, Lewinsohn, Klein, Small, Seeley and Altman2009). Furthermore, a sole focus on the onset of case-level disorder may be insensitive to clinically important trajectories of symptom change occurring during this age range (Dekker et al., Reference Dekker, Ferdinand, van Lang, Bongers, van der Ende and Verhulst2007).
Methods
Participants
We conducted participant screening in a large community sample of 2,479 Grade 6 students from 97 schools in metropolitan Melbourne, Australia. This involved administering the Early Adolescent Temperament Questionnaire—Revised (EATQ-R; Ellis & Rothbart, Reference Ellis and Rothbart2001) to groups of students in classrooms. The EATQ-R is an instrument designed to assess affective temperament in adolescents. The scale is used to derive 10 subscales, which load onto four higher order factors (negative affectivity, effortful control, surgency, and affiliation). Confirmatory factor analysis performed on item data from the large school screening sample provided good fit for a factor structure consistent with the a priori scales described by Rothbart and colleagues (Putnam, Ellis, & Rothbart, Reference Putnam, Ellis, Rothbart, Eliasz and Angleitner2001). The aim of the selection procedure was to maximize the range of risk and resiliency for later onset of psychopathology in recruited participants. To this end, we tried to ascertain a sample of adolescents who were representative of the range of scores across each higher order temperament dimension measured by the EATQ-R. We recruited equal numbers of male and female adolescents across the following ranges of scores on each of the four higher order factors of the EATQ-R: 0–1 SD, 1–2 SD, 2–2.5 SD, and >2.5 SD above and below the mean. This resulted in the selection of 425 (16%) adolescents showing even variation across each of the higher order traits of interest, with some emphasis in the distribution at the tails (temperament scores in the selected sample were still normally distributed).
Of the selected adolescents, 245 (58%) agreed to participate in further research. Trained research assistants screened participants for Axis I disorders using the Schedule for Affective Disorder and Schizophrenia for School-Aged Children: Epidemiologic Version (K-SADS-E; Orvaschel & Puig-Antich, Reference Orvaschel and Puig-Antich1994). Any adolescent meeting criteria for past or current MDD was excluded from further participation as per the broader aims of the study. Twenty-five participants met lifetime criteria for a psychiatric diagnosis (separation anxiety disorder [SAD], n = 3; social phobia, n = 1; attention-deficit/hyperactivity disorder [ADHD], n = 4; simple phobia, n = 4; obsessive–compulsive disorder, n = 1; oppositional defiant disorder [ODD], n = 10; conduct disorder [CD], n = 2). Informed consent was obtained from all participants (adolescent and parent), in accordance with the guidelines of the Human Research Ethics Committee of the University of Melbourne, Australia.
Two hundred forty-five, 157, and 167 participants completed the baseline diagnostic interview and questionnaires, magnetic resonance imaging (MRI), and family interaction assessments, respectively. Mean age at diagnostic interview was 12.42 years (SD = 0.45). Mean time between interview and MRI was 2.02 months (SD = 1.57), and mean time between interview and family interactions was 1.96 months (SD = 1.41).
Two hundred eleven of the participants (105 males) completed a follow-up assessment approximately 2 years after baseline assessments (mean follow-up period = 2.53 years, SD = 0.24). K-SADS-E data indicated that 21 participants met criteria for a psychiatric diagnosis with onset between baseline and follow-up (posttraumatic stress disorder, n = 3; simple phobia, n = 11; SAD, n = 1; social phobia, n = 10; generalized anxiety disorder, n = 6; depressive disorder, n = 23; substance use disorder, n = 5; ODD, n = 6; CD, n = 6; ADHD, n = 6; other, n = 9).
Note that for the final sample of 114 (56 females, mean age = 12.62, SD = 0.45) used in analyses (see Treatment of Missing Data section below), 14 participants met criteria for a past or current psychiatric disorder at baseline (simple phobia, n = 2; obsessive–compulsive disorder = 1; social phobia, n = 1; SAD, n = 1; ODD, n = 5; CD, n = 1; ADHD, n = 2), and 33 participants met criteria for a psychiatric diagnosis between baseline and follow-up (depressive disorder, n = 7; simple phobia, n = 5; generalized anxiety disorder, n = 2; social phobia, n = 4; SAD, n = 1; substance use disorder, n = 3; CD, n = 3; ODD, n = 3; ADHD, n = 5).
Baseline procedure
Neuroimaging
Image acquisition
One hundred thirteen participants (58 males) underwent MRI scans using a 3-Tesla GE scanner, using a gradient echo volumetric acquisition sequence (repetition time = 36 ms, echo time = 9 ms, flip angle = 35 degrees, field of view = 20 cm2, pixel matrix = 410 × 410) to obtain 124 T1-weighted contiguous 1.5 mm thick slices (voxel dimensions = 0.4883 × 0.4883 × 1.5 mm).
Image preprocessing
Images were transferred to a SGI Linux workstation for morphometric analysis. Image preprocessing was carried out using tools from the FMRIB software library (http://www.frmib.ox.ac.uk/fsl). Each three-dimensional scan was stripped of all nonbrain tissue (Smith, Reference Smith2002) and aligned to the MNI 152 average template (six-parameter rigid body transform with trilinear interpolation) using FLIRT (Jenkinson & Smith, Reference Jenkinson and Smith2001). This registration served to align each image axially along the anterior commissure–posterior commissure plane and sagittally along the interhemispheric fissure without any deformation. Images were resampled to 1 mm3.
Volumetric analysis
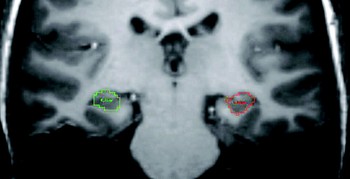
We defined and quantified the hippocampus using the software package ANALYZE (Mayo Clinic, Rochester, NY; http://www.mayo.edu/bir/). The guidelines for tracing the hippocampus were adapted from those described by Velakoulis and colleagues (Reference Velakoulis, Pantelis, McGorry, Dudgeon, Brewer and Cook1999, Reference Velakoulis, Wood, Wong, McGorry, Yung and Phillips2006). Hippocampal tracings included the hippocampus proper, the dendate gyrus, the subiculum, and part of the fimbria and alveus. Boundaries were defined as posterior, section with the greatest length of continuous fornix; lateral, temporal horn; medial, open end of the hippocampal fissure posteriorly and the uncal fissure anteriorly; and superior, fimbria and alveus posteriorly and amygdala anteriorly. Watson et al.'s (Reference Watson, Andermann, Gloor, Jonesgotman, Peters and Evans1992) protocol was used to assist in the separation of the amygdala from the hippocampus (to maximize reliability for the current dataset). Hippocampal estimates were based on total voxels within the defined region. See Figure 1 for an example delineation.
An example delineation of the left and right hippocampus on a coronal section of a Time 1 weighted image. [A color version of this figure can be viewed online at journals.cambridge.org/dpp]

Brain tissue was segmented into gray matter, white matter, and cerebrospinal fluid using an automated algorithm implemented in FAST (Zhang, Brady, & Smith, Reference Zhang, Brady and Smith2001). An estimate of whole brain volume was obtained by summing gray and white matter pixel counts (i.e., whole-brain volume included cerebral gray and white matter, the cerebellum, and brain stem, but not the ventricles, cisterns, or cerebrospinal fluid).
Family interactions
Procedure
One hundred sixty-seven adolescents and their mothers participated in a 20-min problem-solving interaction (PSI), which was videotaped for coding purposes.Footnote 1 Topics for the PSI were identified based on parent and adolescent responses to the Issues Checklist (Prinz, Foster, Kent, & O'Leary, Reference Prinz, Foster, Kent and O'Leary1979), which comprises 44 topics about which adolescents and parents may disagree, such as “[adolescent] lying” and “[adolescent] talking back to parents.” Up to five Issues Checklist issues, rated as conflictual (and recent) by parent and adolescent were chosen for dyads to discuss and resolve during the PSI.
Observational coding
The affective and verbal content of the interactions were coded using the Living in Family Environments (LIFE; Hops, Davis, & Longoria, Reference Hops, Davis and Longoria1995) coding system. The LIFE is an event-based coding system in which new codes are entered each time the affect or verbal content of the participant changes. The LIFE consists of 10 affect and 27 verbal content codes. The index of aggressive parenting was rate per minute of a composite construct of maternal aggressive behavior, which includes all events with contemptuous, angry, and belligerent affect, as well as disapproving, threatening, or argumentative verbal content with neutral affect. A list of all component codes is provided in Appendix A. The validity of the LIFE system has been established in numerous studies of adolescent depression (e.g., Katz & Hunter, Reference Katz and Hunter2007; Sheeber et al., Reference Sheeber, Davis, Leve, Hops and Tildesley2007).
Two specially trained research assistants who were blind to participant characteristics (e.g., symptom levels) and study hypotheses coded the video recordings. A second observer coded approximately 20% of the interactions to provide an estimate of observer agreement. The κ coefficient for the aggressive composite code was 0.77, which reflects good to excellent agreement (Fleiss, Reference Fleiss1981).
Diagnostic interview and questionnaires
In addition to the K-SADS-E interview, adolescents reported on their current depressive symptoms using the Center for Epidemiological Studies—Depression Scale (CES-D; Radloff, Reference Radloff1977). The CES-D has been found to be valid and reliable for adolescents (Radloff, Reference Radloff1991). In the current sample, the Cronbach α value was 0.89.
Follow-up procedure
Diagnostic interview and questionnaires
We administered the K-SADS-E to 211 participants at the 2-year follow-up to assess onset of psychopathology since baseline assessments. The CES-D was also readministered.
Treatment of missing data
Listwise deletion because of missing data would have resulted in only 97 cases remaining in the analysis. It has been well established that this approach to dealing with missing data will only be correct under the restrictive assumption of missing completely at random holding (Schafer & Graham, Reference Schafer and Graham2002); otherwise, parameter estimates will be biased. There were 114 cases for whom complete data was available on the three primary independent variables (i.e., mothers aggressiveness, sex, and MRI volumes).
We therefore treated any missing data on CES-D scores at Time 1 and Time 2 by imputing all missing observations using the multiple imputation procedure in Stata version 11 (Stata Corp, 2009). The imputation model, in addition, contained scores on the 10 subscales of the EATQ at screening and at baseline, given the central role played by the EATQ in sample ascertainment, together with the age of the child and whole brain volume. The imputation model adopted von Hippel's (Reference Von Hippel2009) recommendations for a “transform-then-impute” imputation strategy for the planned two-way and three-way interaction scores among mothers' aggressiveness, sex, and hippocampal volumes. This approach avoids bias in multiply imputed parameter estimates arising from the more commonly used “impute-them-transform” approach (for details of these two approaches, see von Hippel, section 3). All continuous independent variables were centered around their observed sample mean values in the imputation model and m = 25 imputed data sets were generated for analyzing the data.Footnote 2
Statistical analysis
We calculated intra- and interrater reliabilities for raw left and right hippocampal volumes. We deemed intraclass correlation coefficients (all >.90) acceptable. We corrected hippocampal volumes for whole-brain size using a covariance adjustment method (Jack et al., Reference Jack, Twomey, Zinsmeister, Sharborough, Petersen and Cascino1989).
We analyzed the 25 imputed data sets using two linear regressions models for left and right hippocampal volumes using Stata version 11.0 (StataCorp, 2009). The follow-up CES-D score was the dependent variable in each regression model. We entered the baseline CES-D score, sex, frequency of maternal aggressive behavior (left or right), hippocampal volume, and all two-way interactions and the three-way interaction among the three independent variables. We determined the statistical significance of all model parameters from the unstandardized estimates calculated on the mean-centered continuous independent variables. To obtain standardized regression coefficients to report in tables, we reran the imputation and regression models using z scores of all continuous independent variables, including interaction terms calculated from the z scores. We used the latter approach for reporting standardized regression coefficients because the β coefficients of interaction terms obtained from unstandardized coefficients are incorrect (i.e., the z scores of product terms is not equal to the product of z scores; for details, see Friedrich, Reference Friedrich1982).
We subsequently investigated significant highest order interactions post hoc among the independent variables by computing simple slopes for hippocampal volumes against maternal aggressiveness separately within boys and girls using the test transform command within Stata's Multiple Imputation procedure. We also used the testtransform command to also test differences in simple slopes.Footnote 3 We deemed any simple slope, and any difference in simple slopes, found to be significant at the 5% level to be of importance to the moderating effect being investigated.
Results
Table 1 shows the means and standard deviations of variables used in the regression analyses for both the observed scores (i.e., those measured on participants) and the imputed scores across all 25 imputed data sets for males and females and for the total sample.
Means (standard deviations) of all variables

Note: For hippocampal volumes, observed N = 113; for maternal aggressive frequency, observed N = 114; for baseline CES-D symptom scores, observed N = 107; and for follow-up CES-D symptom scores, observed N = 1.
aEstimates corrected for whole brain volume.
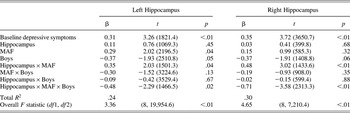
The lower sections of Table 2 report the main findings from the separate hierarchical regression models for left and right hippocampus. For both models, the overall estimated R 2 values of .24 (for left hippocampus) and .39 (for right hippocampus) were substantial in size. Analysis of the 25 multiply imputed data sets in Stata provides an omnibus F test for the overall model that all regression coefficients (excluding the intercept) are zero. For both the left hippocampus, F (8, 19954.6) = 3.59, p < .01, and right hippocampus, F (8, 7210.4) = 4.65, p < .01, the result provided strong evidence to reject the null hypothesized assumption of zero effects.Footnote 4
Standardized regression coefficients (β), obtained t statistics, and p values for predicting CES-D depressive symptoms at 2-year follow-up using separate left and right hippocampus, sex, and frequency of maternal aggressive behaviors (N = 114)

Note: CES-D, Center for Epidemiological Studies—Depression Scale; MAF, maternal aggressive behaviors frequency; boys coded 1 = male, 0 = female. Parameter estimates and degrees of freedom for F and t statistics were calculated using Rubin's (1987) rules for statistical inference for multiply imputed data sets. The overall F statistic is an omnibus test that all regression parameters equal zero. The R 2 estimate is averaged across individual R 2 estimates from regression models for the m = 25 imputed data sets.
Table 2 also reports the standardized regression coefficients for all partial regression coefficients for the two moderating models, together with observed t statistic values obtained p values. For the three-way interactions involving the left and right hippocampus models, the estimates of the β coefficients were −0.48, t (1734.8) = −2.11, p < .01, and −0.71, t (843.5) = −3.31, p < .01, respectively, thereby indicating evidence for a significant three-way interaction for Sex × Hippocampus × Maternal Aggressive Frequency in each instance. The results also showed a significant two-way interaction for Hippocampus × Maternal Aggressive Frequency for the left hippocampus (β = 0.35), t (1501.3) = 2.03, p = .04, and for the right hippocampus (β = 0.48), t (1433.6) = 3.02, p < .01.
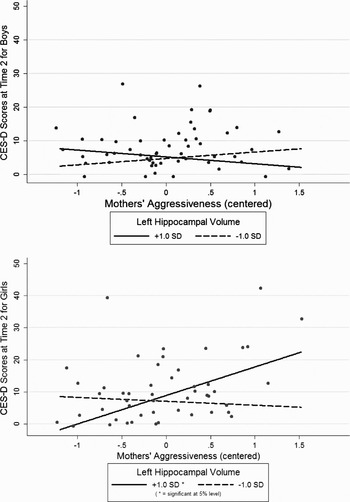
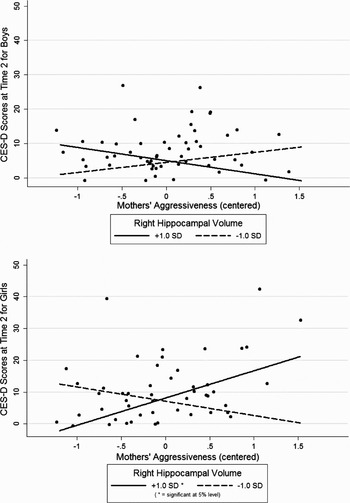
We interpreted the significant Sex × Hippocampus × Maternal Aggressive Frequency interactions in each regression model by calculating and testing simple slopes separately for left and right hippocampus at 1.0 SD above and below the mean of the centered volumes. These plots are displayed separately for boys and girls in Figure 2 and Figure 3.
A plot of simple slopes of the centered left hippocampal volume in its three-way interaction with maternal aggressive behavior and sex in prediction of self-reported Center for Epidemiological Studies—Depression Scale scores at 2-year follow-up (boys above, girls below).

A plot of simple slopes of the centered right hippocampal volume in its three-way interaction with maternal aggressive behavior and sex in prediction of self-reported Center for Epidemiological Studies—Depression Scale scores at 2-year follow-up (boys above, girls below).

For left hippocampus and maternal aggressiveness (Figure 2), none of the simple slopes were significant at the 5% level for boys (upper graph), whereas a significant positive simple slope (β = 0.63), t (77) = 2.89, p < .01, was found for girls (lower graph) at +1.0 SD above the left hippocampal mean.
The simple slopes analysis for the three-way interaction involving sex, the right hippocampus, and maternal aggressiveness revealed no significant simple slopes for boys at either 1.0 SD above or below the right hippocampal mean. For girls, however, a significant positive simple slope (β = 0.64), t (97.6) = 3.89, p < .01, was again obtained at 1 SD above the right hippocampal mean.
Testing of differences in simple slopes revealed the following. For left hippocampal volume, (a) boys' slope at +1 SD was smaller than girls' at +1 SD (Δb = –10.92), F (1, 77.8) = 7.14, p < .01; and (b) girls' slope at +1 SD was larger than girls' at –1 SD (Δb = 10.11), F (1, 84.9) = 4.13, p = .04. For right hippocampal volume, (c) boys' slope at +1 SD was smaller than girls' at +1 SD (Δb = –12.42), F (1, 85.2) = 12.71, p < .01; and (d) girls' slope at +1 SD was larger than the girls' slope at –1 SD (Δb = 13.07), F (1, 84.4) = 9.12, p < .01.
Hence, girls with larger left and right hippocampus were more sensitive to the depressogenic effects of high levels of maternal aggressive behavior. For these individuals, although high levels of aggressive maternal behavior were associated with an exacerbation of depressive symptoms over time, low levels of maternal aggressive behavior were associated with relatively lower severity of depressive symptoms at follow-up.
Discussion
The results of the present study provide support for the hypothesis that the interaction between key biological and environmental factors may be more important in predicting exacerbation of depressive symptoms during adolescence than either factor alone. We found that the interaction between hippocampal volume (bilaterally) and maternal aggressive behavior was significant in the prospective prediction of depressive symptoms. It is interesting that this was only true for girls; that is, girls with larger bilateral hippocampus volumes appear to be more sensitive to the depressogenic effects of maternal aggressive behavior. Only in these individuals did high levels of maternal aggressive behavior appear to influence change in depressive symptoms over time.
The absence of main effects for hippocampal volume is consistent with previous null findings in the literature with regard to hippocampal volume and depression, depressive symptoms, or risk for depression (Rosso et al., Reference Rosso, Cintron, Steingard, Renshaw, Young and Yurgelun-Todd2005). Our results suggest that although hippocampus volumetric abnormalities may represent a vulnerability factor for depressive symptoms, the environmental context influences whether this vulnerability is manifested or inhibited. This finding is consistent with animal research showing that hippocampus abnormalities may lead to depressive symptoms in the contexts of environmental stress (Bergstrom, Jayatissa, Thykjaer, & Wiborg, Reference Bergstrom, Jayatissa, Thykjaer and Wiborg2007; Marais, Van Rensburg, Van Zyl, Stein, & Daniels, Reference Marais, Van Rensburg, Van Zyl, Stein and Daniels2008).
It is important that our findings suggest that, although individual differences in hippocampal volume might be related to vulnerability in adverse environmental contexts, the same volumetric characteristics may also predict positive outcomes in the context of favorable environments. Our results suggest that “sensitive” individuals might do better than their “nonsensitive” peers (i.e., experience greater alleviation of depressive symptoms) in favorable environments. These findings are consistent with the biological sensitivity and differential susceptibility models proposed by Boyce and Ellis (Reference Boyce and Ellis2005) and Belsky et al. (Reference Belsky, Bakermans-Kranenburg and van IJzendoorn2007), respectively, which propose that for temperamental, genetic, or other biological reasons some individuals are more susceptible to both the adverse effects of unfavorable environments and the beneficial effects of favorable environments. Our findings support these models, and the argument that the traditional research focus on vulnerable (as opposed to sensitive) individual characteristics may lead to a mischaracterization of some environmental influences and individual attributes (Belsky & Pluess, in press).
With regard to depression outcomes, although there is evidence that biologically based factors may interact with the environment to increase vulnerability for depression, far less research has investigated factors that interact with the environment to promote resilience (see Belsky & Pluess, in press). Evidence suggests that allelic variation in some common genetic polymorphisms may interact with environmental variables to produce both favorable and unfavorable depression outcomes. For example, in a number of studies, individuals carrying the short allelic variant of the linked polymorphic region of the serotonin transporter gene (5-HTTLPR) were found to function most poorly when exposed to many stressors, but best (showing least problems) when encountering few or none (Wilhelm et al., Reference Wilhelm, Mitchell, Niven, Finch, Wedgwood and Scimone2006; Zalsman et al., Reference Zalsman, Huang, Oquendo, Burke, Hu and Brent2006). There has also been some work showing that individual differences in temperament or personality may reflect biological sensitivity to depressive and other internalizing outcomes (see Belsky & Pluess, in press). For example, Aron, Aron, and Davies (Reference Aron, Aron and Davies2005) found that children high on sensory processing sensitivity (sensitive nervous system, awareness of subtleties in surroundings, and a tendency to be more easily overwhelmed in stimulating environments) developed greater trait negative affectivity in adulthood under conditions of high environmental negativity, but low levels of symptoms under conditions of low environmental negativity. Finally, there is limited evidence for physiological reactivity sensitivity factors, showing that individuals with high skin-conductance response (Cummings, El-Sheikh, Kouros, & Keller, Reference Cummings, El-Sheikh, Kouros and Keller2007) or respiratory sinus arrhythmia reactivity (El-Sheikh, Reference El-Sheikh2005) have less favorable depression-related outcomes (e.g., more internalizing symptoms) only under conditions of high adversity relative to children with low reactivity. There is some evidence to suggest that such reactivity might also lead to favorable depression-related outcomes in the context of low adversity (Obradovic, Bush, Stemperdahl, Adler, & Boyce, in press).
These findings, together with our previous work (Yap et al., Reference Yap, Whittle, Yücel, Sheeber, Pantelis and Simmons2008), are to our knowledge the first to provide evidence that individual differences in regional brain structure might represent a susceptibility factor for depressive outcomes in humans, conferring sensitivity for both positive and negative outcomes. The idea that brain structure, in particular, hippocampal volume, might represent a biological substrate for environmental sensitivity is consistent with evidence that the hippocampus is a key structure involved in processing and integrating information from the environment with learning and memory processes, and using that information to influence subsequent behavior. There is evidence, for example, that the hippocampus is involved in the regulation of the hormonal response to stress or psychological challenge (Buchanan, Tranel, & Kirschbaum, Reference Buchanan, Tranel and Kirschbaum2009; Pruessner, Pruessner, Hellhammer, Pike, & Lupien, Reference Pruessner, Pruessner, Hellhammer, Pike and Lupien2007). Studies also show that the hippocampus plays a key role in contextual learning, both with regard to the acquisition of responses to conditioned aggressive (Bannerman et al., Reference Bannerman, Rawlins, McHugh, Deacon, Yee and Bast2004), and appetitive stimuli (Ito, Everitt, & Robbins, Reference Ito, Everitt and Robbins2005). Note that the hippocampal volume has been associated with other measures of sensitivity or susceptibility to context that have been found to influence depression outcomes, as described above. For example, hippocampal volume has been associated with allelic variation in the 5-HTTPLR gene (Frodl et al., Reference Frodl, Koutsouleris, Bottlender, Born, Jager and Morgenthaler2008), cortisol reactivity (Pruessner et al., Reference Pruessner, Pruessner, Hellhammer, Pike and Lupien2007), and behavioral inhibition sensitivity (akin to the personality trait of sensory processing sensitivity; Aron & Aron, Reference Aron and Aron1997; Barros-Loscertales et al., Reference Barros-Loscertales, Meseguer, Sanjuan, Belloch, Parcet and Torrubia2006).
The exact mechanism by which hippocampal volume may influence depressive symptoms is unknown. We suggest that a region's volume is a reflection of genetic and hormonal factors combined with experience-based function (i.e., activity) over a relatively long period of time. There is some evidence that the link between the hippocampus and depression lies in the functional role of the hippocampus in behavioral inhibition (Gray, Reference Gray1982; Gray & McNaughton, Reference Gray and McNaughton2000). It has been suggested that when there is conflict between the tendency to approach cues associated with reward and the tendency to avoid cues associated with negative affect, the hippocampus outputs a signal that increases the weight or valence of affectively negative information, therefore decreasing the tendency to approach a goal. It is possible, therefore, that depressive outcomes may be influenced by the degree of hippocampal-mediated suppression of approach-related actions and cognitions (Gray & McNaughton, Reference Gray and McNaughton2000). Further, animal research has provided evidence that the connections between the hippocampus and other limbic and prefrontal regions may underlie this process (Bannerman et al., Reference Bannerman, Rawlins, McHugh, Deacon, Yee and Bast2004). For example, animal studies have provided evidence that hippocampal dopaminergic projections to the prefrontal cortex mediate the expression of freezing behavior (Pezze, Bast, & Feldon, Reference Pezze, Bast and Feldon2003), which has been likened to human depressive symptoms (Shumake, Barrett, & Gonzalez-Lima, Reference Shumake, Barrett and Gonzalez-Lima2005).
Note that in our previous work, in which we provided cross-sectional evidence that individual differences in the volume of limbic regions (including the amygdala and the anterior cingulate cortex) may confer sensitivity to the depressogenic effects of maternal aggressive behavior, we did not find evidence for an interaction between hippocampal volume and maternal aggressive behavior in the cross-sectional prediction of depressive symptoms (Yap et al., Reference Yap, Whittle, Yücel, Sheeber, Pantelis and Simmons2008). It is possible that depressive symptoms at this age (M = 12.5) did not yet reflect the effects of hippocampal function. It has been suggested that environmental effects on hippocampal function may induce an incubator effect, whereby behavioral effects present only after a period of time (Andersen & Teicher, Reference Andersen and Teicher2008; Lupien, McEwen, Gunnar, & Heim, Reference Lupien, McEwen, Gunnar and Heim2009).
The sex differences in our results were striking; only in females were larger hippocampal volumes associated with greater sensitivity to the effects of aggressive maternal behavior. This finding for females is consistent with previous literature showing a positive relationship between hippocampal volume and other susceptibility factors such as behavioral inhibition sensitivity (Barros-Loscertales et al., Reference Barros-Loscertales, Meseguer, Sanjuan, Belloch, Parcet and Torrubia2006; Cherbuin et al., Reference Cherbuin, Windsor, Anstey, Maller, Meslin and Sachdev2008), and cortisol reactivity (Pruessner et al., Reference Pruessner, Pruessner, Hellhammer, Pike and Lupien2007). Together, these findings suggest that larger hippocampal volume during adolescence may be associated with sensitivity to depression-based outcomes. It is possible that relatively small hippocampal volumes observed in adult depression samples may occur as a result of stress and other illness-related factors.
The mechanisms underlying the observed sex differences in our findings are not clear; however, we offer a number of possibilities for examination in future research. Findings may be associated with sex differences in the rate of hippocampus development over adolescence. Maturation proceeds earlier in females, possibly because of the stimulating effects of estrogen on neuron proliferation (Tanapat, Hastings, Reeves, & Gould, Reference Tanapat, Hastings, Reeves and Gould1999), dendritic spine increases (Gould, Woolley, Frankfurt, & McEwen, Reference Gould, Woolley, Frankfurt and McEwen1990) and synaptogenesis (Woolley, Wenzel, & Schwartzkroin, Reference Woolley, Wenzel and Schwartzkroin1996) in the hippocampus. For example, a postmortem study revealed that myelination in the hippocampus occurred earlier in females than in males during childhood and adolescence (Benes, Turtle, Khan, & Farol, Reference Benes, Turtle, Khan and Farol1994). MRI studies have demonstrated predominant female hippocampal volume increases from childhood to adolescence (Giedd, Castellanos, Rajapakse, Vaituzis, & Rapoport, Reference Giedd, Castellanos, Rajapakse, Vaituzis and Rapoport1997) and predominant male hippocampal volume increases later in adolescence (Suzuki et al., Reference Suzuki, Hagino, Nohara, Zhou, Kawasaki and Takahashi2005). Thus, it is possible that larger hippocampal volumes in our female participants may be associated with more active maturational processes in this region and subsequently greater sensitivity to environmental input (Suzuki et al., Reference Suzuki, Hagino, Nohara, Zhou, Kawasaki and Takahashi2005). It is possible that a larger hippocampal volume in males may be associated with greater sensitivity later in adolescence when maturational processes are more active.
Another interpretation of the sex difference is that there may be sex differences both in the maturation of depressive symptoms and the course of hippocampal changes with depressive symptoms over time. Although findings from adult studies have suggested decreased volume as a result of ongoing depressive disorder, one study with children and adolescence (McMaster & Kusumaker, 2004) reported a positive association between hippocampal volume and duration of illness, despite lesser volume in patients relative to controls. Thus, if females are further along the course of experiencing depressive symptoms (which is suggested by findings that depressive symptoms increase more rapidly for females during early adolescence (Zahn-Waxler, Crick, Shirtcliff, & Woods, Reference Zahn-Waxler, Crick, Shirtcliff, Woods, Cicchetti and Cohen2006), then those with larger hippocampal volumes may be more likely to experience depressive symptoms.
Limitations and Strengths
There are a number of study limitations that must be borne in mind when evaluating these results. It is possible that the predictors tested in our model (i.e., hippocampal volume and frequency of mother aggressive behavior) were not independent; the adolescent's hippocampal volume may have influenced maternal behavior (indirectly through their own behavior), or the maternal aggressive behavior may have influenced the adolescent's hippocampal volume. However, there was no significant correlation between these predictors, suggesting that the observed results do represent differential susceptibility as described in the theoretical models (Belsky et al., Reference Belsky, Bakermans-Kranenburg and van IJzendoorn2007). The mechanisms contributing to individual differences in hippocampal volume in our sample, however, are not clear. Mechanisms likely comprise both genetic (Zobel et al., Reference Zobel, Jessen, von Widdern, Schuhmacher, Hofels and Metten2008) and environmental factors (Andersen & Teicher, Reference Andersen and Teicher2008). With regard to the former, hippocampal volume shows moderate heritability estimates of 40% to 69% (Peper, Brouwer, Boomsma, Kahn, & Poll, Reference Peper, Brouwer, Boomsma, Kahn and Poll2007). With regard to the latter, it has been suggested that infancy and childhood may represent the most sensitive period for environmental influence on the developing hippocampus (Lupien et al., Reference Lupien, McEwen, Gunnar and Heim2009). For example, there is evidence that early trauma and stressful experience may lead to hippocampus volume change (Bremner et al., Reference Bremner, Vythilingam, Vermetten, Southwick, McGlashan and Nazeer2003; Tupler & De Bellis, Reference Tupler and De Bellis2006). Therefore, it may be insightful for future work using adolescent samples to investigate the effects of early childhood experiences on hippocampal volumes and their interaction with environmental factors in the prediction of depression.
We recognize that the hippocampus does not function in isolation, and it is likely that the interaction between the hippocampus and connected regions may be an important. Future work utilizing measures of hippocampal connectivity may be useful in more thoroughly characterizing the role of the hippocampus in a network of regions underlying biological sensitivity.
Finally, this study included only mothers of adolescents. Hence, it remains to be seen whether paternal parenting has similar main and moderating (with adolescent neuroanatomy and other biological factors) effects on adolescent depressive symptoms, and our findings should not be taken to infer that fathers have a less significant role in risk and protective factors for adolescent depression. Paternal and maternal parenting may have synergistic and/or buffering effects on adolescent outcomes (Asarnow, Tompson, Woo, & Cantwell, Reference Asarnow, Tompson, Woo and Cantwell2001; Jacobvitz, Hazen, Curran, & Hitchens, Reference Jacobvitz, Hazen, Curran and Hitchens2004; Phares & Compas, Reference Phares and Compas1992), especially when the differential sensitivity of adolescents to the family environment is taken into account. Thus, future research involving the examination of triadic (parents and adolescent together) and dyadic (adolescent with each parent separately) interactions will be highly informative.
Despite these limitations, the study has a number of strengths that warrant mention. First, the prospective study design allows scope for investigating emerging depressive symptoms during a critical period of adolescence, and enables more confidence than does a cross-sectional design in making inferences of causality. Second, the sample was selected to encompass a wide range of vulnerability for depression (based on affective temperament), including an oversampling of individuals thought to be at both the risk and resilient ends of the continuum. This strategy offered us power to investigate sensitivity or susceptibility, rather than solely vulnerability. Third, our observed measure of aggressive parenting may be preferable to self-report measures, as they may provide a more objective measure of family processes. These laboratory-based family interactions have good predictive and convergent validity with other measures of these processes as well as with depressive syndromes, suggesting that they capture valid and important information regarding family interactions (Sheeber & Sorensen, Reference Sheeber and Sorensen1998).
Conclusions
In this investigation, we found evidence that the interaction between hippocampal volume and aggressive maternal behavior prospectively predicts adolescent depressive symptoms among girls over a 2.5-year period. Supportive of the models proposed by Boyce and Ellis (Reference Boyce and Ellis2005) and Belsky et al. (Reference Belsky, Bakermans-Kranenburg and van IJzendoorn2007), our findings suggest that individual variation in hippocampal volume may reflect biological sensitivity to context, whereby some individuals may be at risk for exacerbated depressive symptoms in the context of high levels of aggressive parenting, but also may experience a reduction in depressive symptoms in the context of low levels of aggressive parenting. Although investigation of these effects will benefit from further work elucidating the mechanisms underlying these associations, as well as the striking sex differences observed, it marks an important step toward better understanding the complex role of biological and environmental factors in both risk and resilience to depressive symptoms in adolescence. Given that adolescents with increased depressive symptoms are at increased risk of developing depressive disorders during later adolescence and adulthood, these findings may have implications for prevention and early intervention strategies for depressive disorders in adolescence. For example, they indicate that good parenting practices may be particularly influential in reducing risk (as well as promoting adaptive behavior) in sensitive individuals. Given that family context risk factors are modifiable, our findings suggest the potential utility of targeted parenting interventions for the prevention and treatment of adolescent depression (Restifo & Bogels, Reference Restifo and Bogels2009).
Appendix A
Components of aggressive construct

Note: Aggressive construct, affect codes 0, 1, or 9 + any content code odds ratio; affect code 5 + content codes 23, 25, or 26.