Introduction
Human ovarian tissue cryopreservation (OTC) has been introduced as an efficient approach to female fertility preservation, especially in young and pre-pubertal girls who are at risk of ovarian failure due to exerting therapeutic options for cancer or some autoimmune diseases (Kim et al., Reference Kim, Youm, Lee, Suh, Nagy, Varghese and Agarwal2017; Gumus et al., Reference Gumus, Kaloglu, Sari, Yilmaz and Cetin2018; Rivas Leonel et al., Reference Leonel, Corral, Risco, Camboni, Taboga, Kilbride, Vazquez, Morris, Dolmans and Amorim2019; Dolmans and Donnez, Reference Dolmans and Donnez2021). The two most frequent methods of OTC include vitrification and slow-freezing techniques (Kometas et al., Reference Kometas, Christman, Kramer and Rhoton-Vlasak2021). Vitrification is a quicker and more cost-effective cryopreservation approach compared with slow-freezing methods, which reduce the possible formation of ice crystals (Shi et al., Reference Shi, Xie, Wang and Li2017). After vitrification, the optimum method for thawing the frozen cells needs to be chosen. The use of standard thawing procedures leads to the recovery of a great number of viable cells and a reduction in ice recrystallization. (Yong et al., Reference Yong, Choi, Wan Safwani, Karimi-Busheri and Weinfeld2016). Some advantages and disadvantages have been stated regarding human ovarian vitrification. One of the main benefits is the preservation of large amounts of primordial follicles considered ovarian reserves (Silber, Reference Silber2016; Leonel et al., Reference Leonel, Corral, Risco, Camboni, Taboga, Kilbride, Vazquez, Morris, Dolmans and Amorim2019). In contrast, one of the main negative points of this method is metabolic damage during the dehydration, vitrification, and thawing processes. These injuries can result in an imbalance between the function of the antioxidant defence system and reactive oxygen species (ROS) production (Rocha et al., Reference Rocha, Soares, de Cássia Antonino, Júnior, Freitas Mohallem, Ribeiro Rodrigues, Figueiredo, Beletti, Jacomini, Alves and Alves2018; Taghizabet et al., Reference Taghizabet, Khalili, Anbari, Agha-Rahimi, Nottola, Macchiarelli and Palmerini2018; Gualtieri et al., Reference Gualtieri, Kalthur, Barbato, Di Nardo, Adiga and Talevi2021).
Excessive formation of ROS can give rise to ovarian follicle loss through apoptosis induction, DNA fragmentation, and oxidation of proteins, carbohydrates, and lipids (Dos Santos Morais et al., Reference Dos Santos Morais, de Brito, Pinto, Mascena Silva, Montano Vizcarra, Silva, Weber Santos Cibin, Cabral Campello, Alves, Rocha Araújo, da Chagas Pinto, Pessoa, Figueiredo and Ribeiro Rodrigues2019; Xiang et al., Reference Xiang, Jia, Fu, Guo, Hong, Quan and Wu2021). In contrast, it has been demonstrated that antioxidant agents can decrease ovarian follicle loss and elevate the number of primordial and primary follicles and oocyte maturation (Liang et al., Reference Liang, Qi, Xian, Huang, Sun and Wang2017; Lim et al., Reference Lim, Ali, Liao, Nguyen, Ortiz, Reshel and Luderer2020; Yang et al., Reference Yang, Chen, Liu, Xing, Miao, Zhao, Chang and Zhang2020).
Kisspeptin is described as an antioxidant factor whose gene (KISS1) is located on chromosome 1q32.11 (Kotani et al., Reference Kotani, Detheux, Vandenbogaerde, Communi, Vanderwinden, Le Poul, Brézillon, Tyldesley, Suarez-Huerta, Vandeput, Blanpain, Schiffmann, Vassart and Parmentier2001). This neuropeptide, whose neurons are mainly detected in anteroventral periventricular and hypothalamic arcuate nuclei, plays a key role in female and male puberty and fertility (Skorupskaite et al., Reference Skorupskaite, George and Anderson2014; Pineda et al., Reference Pineda, Plaisier, Millar and Ludwig2017; Hu et al., Reference Hu, Zhao, Chang, Yu and Qiao2017). In addition, studies have shown that kisspeptin regulates the hypothalamic–pituitary–gonadal (HPG) axis, which has a role in gametogenesis through the secretion of follicle-stimulating hormone and luteinizing hormone (Aslan et al., Reference Aslan, Erkanli Senturk, Akkaya, Sahin and Yılmaz2017; MacManes et al., Reference MacManes, Austin, Lang, Booth, Farrar and Calisi2017). Therefore, this study aimed to investigate the protective effects of kisspeptin against the detrimental effects of the vitrification and thawing processes on human ovarian tissue by monitoring histological, apoptotic, and oxidative features.
Materials and methods
Sample obtaining
This investigation was approved by the Ethics Committee of Arak University of Medical Sciences (approval code: IR.ARAKMU.REC.1399.305). In total, 20 women in the age range 20–35 years, and who required ovarian or partial ovarian removal for various reasons, participated voluntarily in the study. Consent forms were obtained from patients, and the study process was explained to them. Inclusion criteria were women with normal levels of anti-Müllerian hormone (AMH; 1.66 ng/ml) and a normal body mass index (BMI; <27 kg/m2; Diamanti-Kandarakis and Bergiele, Reference Diamanti-Kandarakis and Bergiele2001). Also, exclusion criteria were injured ovaries because of surgery and other interventions, ovaries without normal follicles, polycystic and cancerous ovaries, ovaries of subjects who had received corticosteroids, persons undergoing hormone therapy or chemotherapy, and people with addictions (Hardy, Reference Hardy2018). By exerting the inclusion and exclusion criteria, 12 ovaries were collected. The health of the ovarian tissues was confirmed by the obstetrician, and H&E staining was performed to confirm the presence of normal follicles in the tissues of the ovarian cortex. The ovarian cortex tissues were taken by an obstetrician. Ovarian tissues at −4°C were transferred to the laboratory within 1 h in Ham’s tissue culture medium mixed with 10% human serum albumin. The tissues were washed in phosphate-buffered saline (PBS), then ovarian tissues were cut into 2 × 2 × 1 mm pieces and divided randomly into four groups, including: (1) the control group (fresh ovarian tissue), (2) the vitrification group, (3) the vitrification with 1 μM kisspeptin group, and (4) vitrification with 10 μM kisspeptin group. In total, 36 samples from each of the 12 ovaries were taken and allocated to each group. All chemical materials were obtained from Sigma–Aldrich Chemie, Steinheim, Germany.
Vitrification
All ovarian cortex samples (except the control group) were exposed to Equilibration solution (ES) medium containing 7.5% ethylene glycol, 7.5% dimethyl sulphoxide (DMSO), and 10% Ham’s tissue culture medium for 25 min. Then, the samples were immersed in vitrification solution (VS) containing 20% ethylene glycol, 20% DMSO, 0.5 mol/l sucrose, and 10% Ham’s tissue culture medium containing 4-(2-hydroxyethyl)-1-piperazineethanesulfonic acid (HEPES) for 15 min (Kagawa et al., Reference Kagawa, Silber and Kuwayama2009). Finally, 1 μM kisspeptin was added to the VS in the third group, and 10 μM kisspeptin was added to the fourth group.
Thawing
The thawing process was carried out by removing parts of the ovarian cortex from the nitrogen tank, subsequently placing them at 37°C for a few seconds and immersing them in thawing solution. Ovarian samples were first immersed in 1 mol/l sucrose and Ham’s tissue culture medium containing 10% HEPES as the base medium for 1 min and then for 5 min in 10% HEPES and 0.5 mol/l sucrose, followed by placing them in 0.25 mol/l sucrose and 10% HEPES for 10 min (Mofarahe et al., Reference Mofarahe, Salehnia, Novin, Ghorbanmehr and Fesharaki2017).
Tissue culture
After the thawing process, the ovarian cortex tissue samples were cultured for 7 days. The samples were incubated in Dulbecco’s modified Eagle’s medium (DMEM)-ready basal culture medium. In the next step, 10% fetal bovine serum and 5% penicillin and streptomycin antibiotics were added to this medium. The culture medium was changed every 48 h.
Histological analysis
Ovarian cortex samples of all groups were fixed in formalin 10%. Tissue samples were immersed in increasing percentages (70–100%) of ethanol alcohol for dehydration and xylene solution for clarification. Next, tissue samples were embedded in molten paraffin and cut into 5-μm sections using a microtome (Leica, Germany). After that, hydration with decreasing concentrations of ethanol alcohol and clarification with xylene solution was performed. Then, H&E staining (Merck, Germany) was carried out. Eventually, tissue sections were observed under a light microscope (Olympus, Tokyo, Japan).
Terminal deoxynucleotidyl transferase dUTP nick end labelling (TUNEL) assay
In this study, a Roche kit (In Situ Cell Death Kit, POD, Germany) was used, and the related steps were performed according to the kit instructions. For deparaffinization, ovarian tissue samples were immersed in xylol for 10 min, and then the slides were immersed in 90, 80, or 70% alcohol, respectively, for 3 min. After washing with PBS (three times), samples were incubated in proteinase K for 20 min at 37°C. After 10 min incubation with permeability solution, they were washed again with PBS. TUNEL dye solution was poured onto the samples, which were incubated at 37°C for 1 h. Finally, samples were observed under a fluorescence microscope (Olympus, Tokyo, Japan).
Biochemical evaluation
Malondialdehyde (MDA)
The amount of tissue MDA from the reaction between MDA and thiobarbituric acid was assessed using the relevant kit (Zellbio, Biocore, Germany) based on its instructions. Reagents were equilibrated with room temperature (RT) and 100 μl standard solution. The samples were placed in the relevant test tubes; then, 100 μl Reagent 4 was added. Next, 200 μl of chromogenic solution was added and placed in a boiling water bath (95°C) for 1 h to form a pink colour. The test tubes were then cooled in an ice bath and centrifuged at 10,000 rpm for 10 min. Next, 200 μl aliquots were removed from the top section of the solution, and the absorbance was read at 535 nm. Then, MDA concentration was calculated based on an absorption standard curve.
Superoxide dismutase (SOD)
To evaluate SOD function, the homogenized ovarian tissues were washed with 1 ml PBS buffer and centrifuged at 4000 rpm for 20 min, and then the fluid collected on the surface was removed. An SOD assay kit (ZellBio GmbH, Ulm, Germany) was used according to the kit instructions. Finally, absorbance was read at 0 and 2 min at 420 nm.
Ferric reducing ability of plasma (FRAP)
To determine the antioxidant total capacity, a FRAP assay was performed based on Benzie and Strain’s work (Benzie and Strain, Reference Benzie and Strain1996). For the first step, a FRAP working solution was prepared as follows: the homogenized ovarian tissues were centrifuged for 10 min at 4000 rpm. Next, 10 ml acetate buffer (pH = 3.6, 300 mmol/l) was mixed with 1 ml hydrochloric acid soluble TPTZ (40 mmol/l); then, 1 ml ferric chloride solution (20 mmol/l) was added to the above solution. In the latter step, 1.5 ml of the above solution was poured into a cuvette at 37°C, and its absorption was measured at 593 nm. Then, 50 μl of the homogenized tissues were added to the above solution. Absorption changes were measured at 593 nm at 37°C for 4 min, and a standard curve was drawn. Finally, the ferrous rate was obtained.
Statistical analyses
Statistical analyses were performed using GraphPad Prism (version 8.4.3) software. Collected data were analyzed using one-way analysis of variance (ANOVA) and Tukey’s test. The one-way ANOVA test was used to investigate the differences between more than two groups, and Tukey’s test was utilized to analyze the differences between groups. Findings were presented as mean ± standard deviation (SD), and statistically significant levels were considered at P < 0.05.
Results
H&E staining
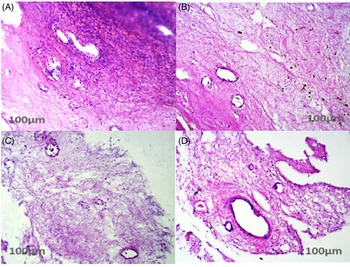
Tissue morphology of the control group (A), vitrification group (B), vitrification group with 1 μM kisspeptin (C), and vitrification group with 10 μM kisspeptin (D) can be seen in Figure 1. There was more tissue cohesion in the control group compared with other groups, especially the vitrified group. However, there was no significant difference in the morphology of stromal cells and follicles in these groups (Figure 1).
H&E staining in all groups. H&E staining can be seen in different groups. In all groups, primordial and primary follicles are shown in the A–D images. Stroma cells are also well visible. In the control group (image A), more tissue cohesion was observed. Due to the process of cryopreservation, thawing, and culture, damage was observed in tissue cohesion (images B–D). Also, some follicles had lost their nucleus and became atretic in the vitrification groups (images C and D).

Apoptosis rate
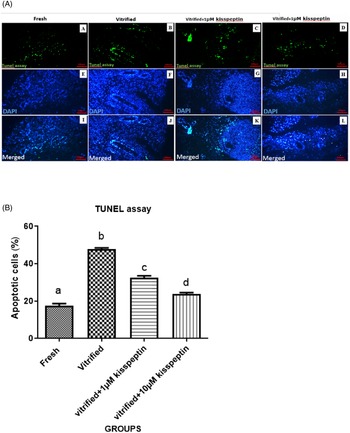
TUNEL assay results indicated that the apoptosis rate in the vitrified group was significantly increased compared with other groups (P < 0.05). The apoptosis rate in the vitrified groups treated with 1 µM and 10 µM kisspeptin was dramatically decreased compared with the vitrified group (P < 0.05). Also, the percentage of apoptotic cells in the vitrified groups treated with 1 µM and 10 µM kisspeptin was considerably elevated compared with the control group (P < 0.05). In addition, the rate of apoptotic cells was reduced in the vitrification step in the 10 μM kisspeptin group than in another group treated with 1 μM kisspeptin (P < 0.05; Figure 2).
(A) TUNEL assay. TUNEL and 4′,6-diamidino-2-phenylindole (DAPI) staining of human stromal cells and ovarian follicles after 7 days of the vitrification and then 7 days of culture in DMEM medium to evaluate the extent of apoptosis in different groups. In panels (A, B, C, and D), the nuclei of apoptotic cells are visible as green fluorescence, and in panels (E, F, G, and H), all positive DAPI nuclei were visible in blue, and Figures I, J, K, and L were overlapped the images of the previous two rows. (B) Amounts of apoptosis in all groups. Evaluation of the average percentage of apoptotic cells in different groups after 7 days and then 7 days of culture in DMEM medium. Data are shown as means ± SD (one-way ANOVA, Tukey’s test, P < 0.05).

Biochemical assay
SOD
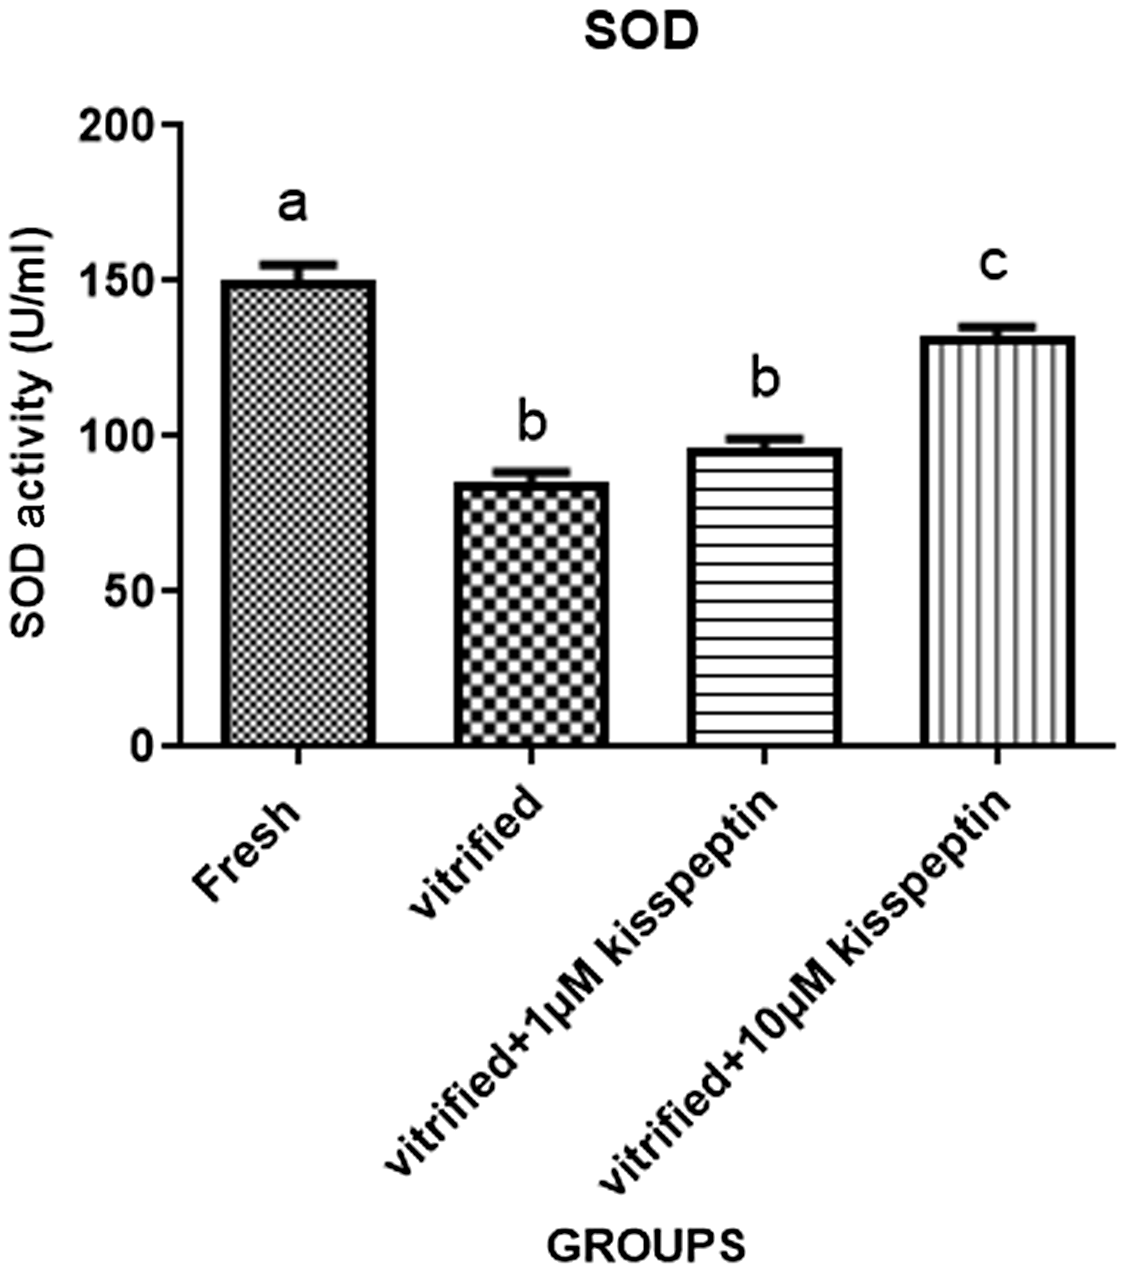
Superoxide dismutases (SOD) are key enzymes that remove superoxide radicals (O2 •), therefore protecting cells from free radical-induced damage (Huang et al., Reference Huang, Feng, Oldham, Keating and Plunkett2000). SOD activity in the vitrified group was significantly diminished compared with other groups (P < 0.05). SOD function in the vitrified groups treated with 1 µM and 10 µM kisspeptin was increased compared with the vitrified group (P < 0.05). Also, the activity of this enzyme was decreased in the vitrified groups treated with kisspeptin (1 µM and 10 µM) compared with the control group (P < 0.05). Moreover, the function of SOD was increased during vitrification with the 10 μM kisspeptin group compared with another group treated with 1 μM kisspeptin (P < 0.05; Figure 3).
Amounts of SOD in all groups. Graph of SOD activity in different groups after 7 days of vitrification and then 7 days culture in DMEM. The mean of each group is shown on top of the columns. The difference between the four groups is meaningful. Data are shown as means ± SD (one-way ANOVA, Tukey’s test, P < 0.05).

MDA
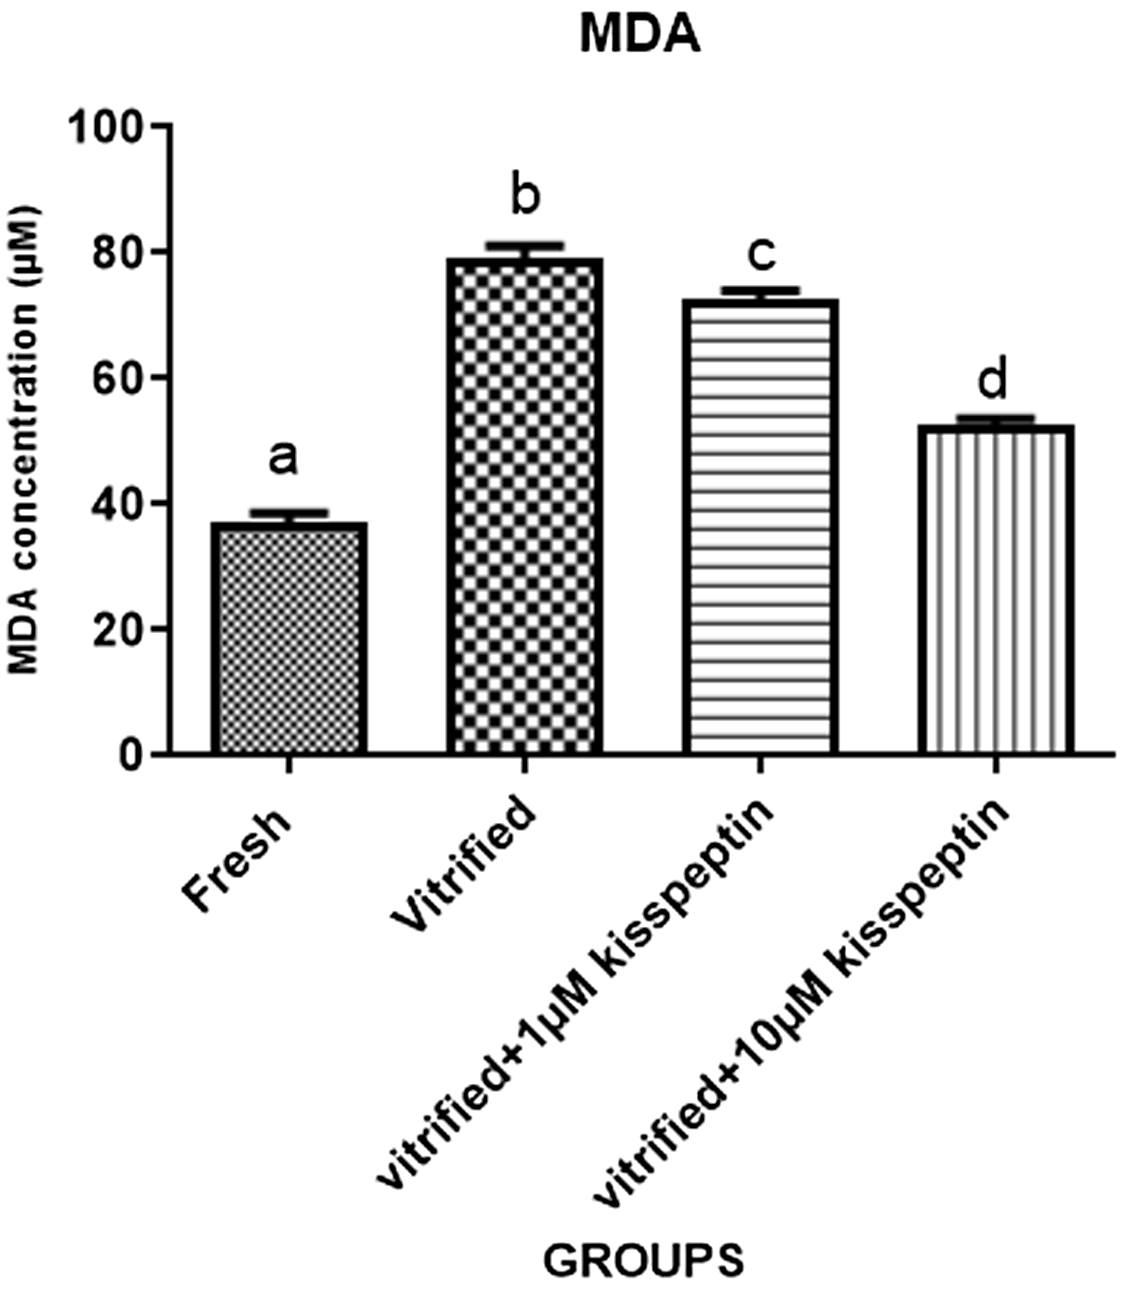
Malondialdehyde (MDA) is a final product of lipid peroxidation and is depicted as a landmark of cell oxidative stress (Hardiany et al., Reference Hardiany, Sucitra and Paramita2019). MDA concentration in the vitrified group was significantly elevated compared with other groups (P < 0.05). The amount of MDA in the vitrified groups treated with 1 µM and 10 µM kisspeptin was dramatically reduced compared with the vitrified group (P < 0.05). Also, the results of the oxidative stress index in the vitrified groups treated with kisspeptin (1 µM and 10 µM) were considerably elevated compared with the fresh group (P < 0.05). In addition, the value of this index was reduced by vitrification with in 10 μM kisspeptin group compared with another group treated with 1 μM kisspeptin (P < 0.05; Figure 4).
Amounts of MDA in all groups. Evaluation of MDA levels in human ovarian tissue after 7 days of vitrification and then 7 days culture in DMEM. The mean of each group is shown on top of the columns. The difference between the four groups is meaningful. Data are shown as means ± SD (one-way ANOVA, Tukey’s test, P < 0.05).

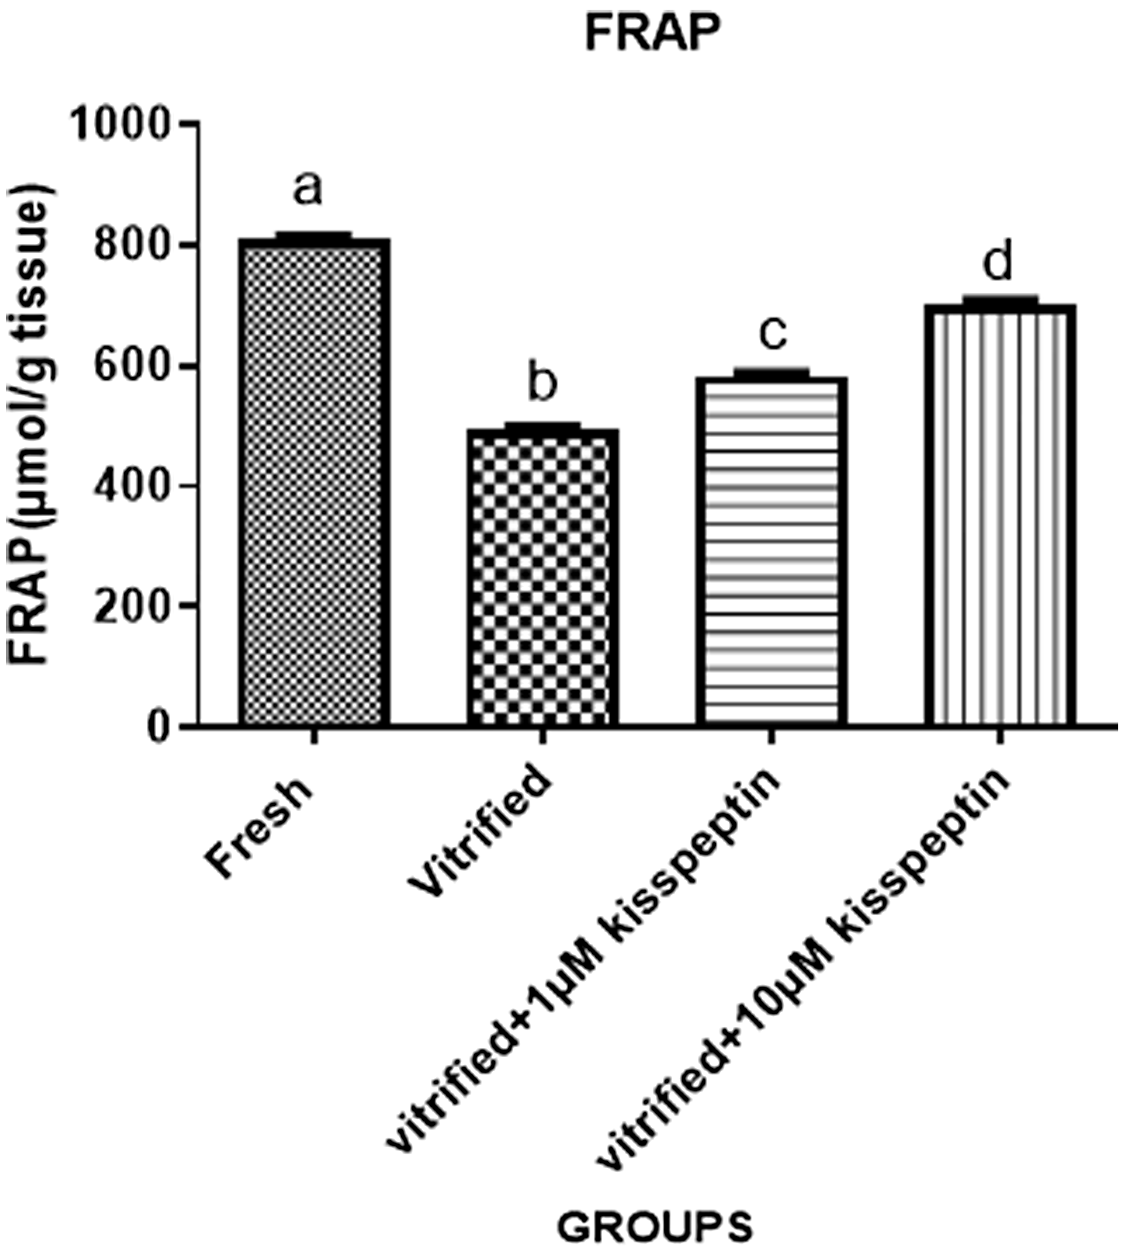
Evaluation of total antioxidant capacity (TAC) by FRAP test
TAC in the vitrified group was significantly decreased compared with other groups (P < 0.05). TAC in the vitrified groups treated with 1 µM and 10 µM kisspeptin was elevated compared with the vitrified group (P < 0.05). This index was reduced in the vitrified groups treated with kisspeptin (1 µM and 10 µM) compared with the control group (P < 0.05). Furthermore, TAC was increased by vitrification in the 10 μM kisspeptin group compared with another group treated with 1 μM kisspeptin (P < 0.05; Figure 5).
Amounts of total antioxidant capacity in all groups. Evaluation of total antioxidant capacity in different groups after 7 days of vitrification and then 7 days culture in DMEM. The mean of each group is shown on top of the columns. The difference between the four groups is meaningful. Data are shown as means ± SD (one-way ANOVA, Tukey’s test, P < 0.05).

Discussion
Vitrification–thawing processes are good choices for fertility preservation of women who need cancer treatment urgently or are at high risk of premature ovarian insufficiency. However, these approaches include oxidative stress damage and apoptosis stimulation, resulting in oocyte quality impairment (Nori-Garavand et al., Reference Nori-Garavand, Hormozi, Narimani, Beigi Boroujeni, Rajabzadeh, Zarei, Beigi Boroujeni and Beigi Boroujeni2020; Kometas et al., Reference Kometas, Christman, Kramer and Rhoton-Vlasak2021; Lin and Wang, Reference Lin and Wang2021). Therefore, in this work, the effectiveness of an antioxidant agent (kisspeptin) on the adverse effects of these fertility preservation-related techniques was investigated. Our histological findings revealed no significant differences in the morphology of stromal cells and follicles in the control group compared with the vitrification group. In this area, some published papers have demonstrated normal ovarian follicles after the vitrification (Youm et al., Reference Youm, Lee, Lee, Jee, Suh and Kim2014; Li et al., Reference Li, Ruan, Liebenthron, Montag, Zhou and Kong2019). However, Migishima et al. (Reference Migishima, Suzuki-Migishima, Song, Kuramochi, Azuma, Nishijima and Yokoyama2003) showed that frozen–thawed processes reduced the follicle number of ovarian tissues compared with fresh ovaries. Other results indicated increased apoptosis rate and MDA concentration and decreased SOD function and TAC in the vitrification group compared with the fresh group. Decreased SOD activity and increased MDA amount reflected an imbalance between ROS formation and elimination and subsequently the attenuation of antioxidant system capacity due to mitochondrial injuries (Long et al., Reference Long, Wang, Gao, Liu, Liu, Miao and Liu2006; Kashka et al., Reference Kashka, Zavareh and Lashkarbolouki2016). Increased ROS production after vitrification can lead to the stimulation of intrinsic apoptosis due to DNA damage (Zhang et al., Reference Zhang, Harashima, Moritani, Huang and Harada2015). Similar to our findings, Agarwal and colleagues (Reference Agarwal, Gupta and Sikka2006) reported elevated ROS production and apoptosis induction during freezing–thawing procedures. In addition, Kashka et al. (Reference Kashka, Zavareh and Lashkarbolouki2016) highlighted elevated MDA levels and reduced TAC and SOD activity in vitrified preantral follicles compared with a control group. These findings were supported by other research (Klocke et al., Reference Klocke, Tappehorn and Griesinger2014; Vilela et al., Reference Vilela, Dolmans, Maruhashi, Blackman, Sonveaux, Miranda-Vilela and Amorim2020). However, some evidence addressed no or minor effects of the vitrification technique on apoptosis induction in ovarian tissue (Mazoochi et al., Reference Mazoochi, Salehnia, Valojerdi and Mowla2008; Abdollahi et al., Reference Abdollahi, Salehnia, Salehpour and Ghorbanmehr2013). We also observed that adding 1 µM and 10 µM kisspeptin to the vitrified human ovarian tissue diminished apoptosis rate and MDA levels and increased TAC and SOD activity compared with the vitrified group. Also, these effects were enhanced by increasing kisspeptin concentration from 1 µM and 10 µM. Kisspeptin controls the mammalian reproductive system via the HPG axis and its antioxidant potential has been shown in many studies (Aydin et al., Reference Aydin, Oktar, Yonden, Ozturk and Yilmaz2010; Akkaya et al., Reference Akkaya, Kilic, Dinc and Yilmaz2014, Reference Akkaya, Eyuboglu, Erkanlı Senturk and Yilmaz2017; Aslan et al., Reference Aslan, Erkanli Senturk, Akkaya, Sahin and Yılmaz2017; Hou et al., Reference Hou, Wang, Ping, Lei, Gao, Ma, Jia, Zhang, Li, Jin, Li, Suo, Zhang and Su2017; Güvenç and Aksakal, Reference Güvenç and Aksakal2018; Abou Khalil and Mahmoud, Reference Abou Khalil and Mahmoud2020; Wang et al., Reference Wang, Zhang, Yuan and Zhang2021). Kisspeptin exerts its antioxidant effect by modulating intracellular calcium levels, and has a bilateral relationship with ROS production (Akkaya et al., Reference Akkaya, Kilic, Dinc and Yilmaz2014; Görlach et al., Reference Görlach, Bertram, Hudecova and Krizanova2015). Moreover, it was demonstrated that this neuropeptide triggers apoptotic events by modulating proapoptotic pathways, such as cytochrome c secretion and caspase activation (Perez et al., Reference Perez, Rubinstein and Dulac2016; Akkaya et al., Reference Akkaya, Eyuboglu, Erkanlı Senturk and Yilmaz2017). This antioxidant can ameliorate ovarian follicle maturation and development (Taniguchi et al., Reference Taniguchi, Kuwahara, Tachibana, Yano, Yano, Yamamoto, Yamasaki, Iwasa, Hinokio, Matsuzaki and Irahara2017; Magamage et al., Reference Magamage, Sathagopam, Avula, Madushanka and Velmurugan2021). Also, its capacity for promoting oocyte maturation in vitro fertilization has been documented (Kasum et al., Reference Kasum, Franulić, Čehić, Orešković, Lila and Ejubović2017). Despite these findings, in our histological results there were no considerable differences between the vitrification group and the vitrification and kisspeptin groups (1 µM and 10 µM) in terms of morphology of follicles and oocytes at different stages. These differences could be associated with differences in vitrification, thawing, and culture methods. There were some limitations to this study. Due to the observance of ethical protocols, the number of samples examined was small, and less than 10% of the patient’s tissue was removed, so we were not able to perform further tests. Therefore, more work is suggested for histological appraisal of kisspeptin effects on vitrified ovarian tissue.
Conclusion
It seems that adding kisspeptin to the human ovarian cryopreservation medium reduces the detrimental effects of vitrification through the reduction of oxidative stress indices and subsequently apoptosis induction. Therefore, it can be utilized as an effective agent in the maintenance of women’s infertility potential. However, more experimental and histological investigations are recommended to verify our findings.
Data availability statement
The datasets used and/or analyzed during the current study are available from the corresponding author upon reasonable request.
Acknowledgements
Not applicable.
Author contributions
This article was adopted from Anahita Tavakoli’s thesis. Fereshteh Aliakbari and Malek Soleimani Mehranjani participated in the conception and design of the study. Anahita Tavakoli wrote the manuscript and performed experiments. Malek Soleimani Mhehranjani and Freshteh Aliakbari assessed the quality of the included articles. All authors read and approved the final manuscript.
Competing interests
The authors declare that there is no conflict of interest that could be perceived as prejudicing the impartiality of this review.
Funding
This research did not receive any specific grant from funding agencies in the public, commercial, or not-for-profit sectors.