

It became obvious with the fourth report of the Intergovernmental Panel on Climate ChangeFootnote 1 in spring 2007 that the need to combat climate change and to deal with its consequences is one of the world's most pressing problems. Because the human contribution to climate change is related to a broad range of activities, such as energy use and production, transport, industrial and agrarian production, and tropical deforestation, combating it—through the reduction of greenhouse gas emissions—is not only costly but also requires profound behavioral changes. Moreover, the global nature of the climate problem underlines the need for international coordination and cooperation, despite the fact that nation-states remain the central actors for developing and implementing the respective policies. States react differently to the challenges of climate change. Some are rather active, such as most of the European Union (EU) member states, while others are more hesitant, such as the United States and China.
Transnational environmental problems are not new. They were acknowledged for the first time during the 1970s and triggered supranational and international action. Given the transboundary character of most environmental problems, the EU sought to harmonize environmental standards among its members. Although many international regimes dealing with environmental problems were established, they rarely obliged nation states to introduce the same environmental policies. Signing an international environmental agreement is a voluntary decision, and the provisions of such a treaty usually leave much leeway for national implementation—which is true even in the case of the EU.
In the first era of environmental policy, states reacted differently to the challenges, just as they do with climate change. While some countries progressively developed their own environmental policies, such as the United States, Japan, or Germany, others lagged behind. While some supra- and international measures contained legally binding requirements for their members to develop respective policy responses, other regimes induced countries to act by means of soft policy suggestions. Moreover, there seemed to be a “contagion” effect. Environmental policies diffused among the developed world. Regardless of the driving forces at work (problem pressure, political or normative pressure, or the incentive “to jump on the bandwagon”), countries observed each other's policies and mutual learning took place.
So far, however, we know neither to what degree the environmental policies of developed countries actually became more similar nor do we have systematic information on the direction in which the contagion effect led. Did environmental policies become more comprehensive and strict over the first thirty years? Or did they—in conjunction with the increasing integration of international markets—develop downward, as the theory of regulatory competition would suggest? Finally, we have limited knowledge about the causes and mechanisms that are responsible for these movements; that is, are they driven by international harmonization, mutual policy learning and communication, economic integration and competition, or are they merely responses to domestic factors, such as political demand and environmental movements? Knowledge about the mechanisms that drive the diffusion of policies can help us deal with the challenges of the next era of environmental policy.
Work on the diffusion of ideas, institutional and legal structures, organizations, and policies as well as the underlying causes of diffusion and potential convergence effects has recently become a major subject in political science.Footnote 2 The increased interest is evident, for example, in the recent symposium issue “Diffusion of Liberalism” of this journalFootnote 3 or the special issue “Cross-national Policy Convergence: Causes, Concepts and Empirical Findings” of the Journal of European Public Policy.Footnote 4
The diffusion of policies can be expected to result in an increase of policy homogeneity among countries. So far, however, there is no clear picture of the extent of convergence. While there are some indicators, these “trends are neither universal nor uniform. Variation occurs from issue-area to issue-area.”Footnote 5 Moreover, convergence as such is not the only or main subject of interest; it is also the direction of the parallel change that matters and is often highly debated. Using a database covering the world from 1972 to 1996, Brinks and Coppedge find that neighbor emulation plays a huge role in regime change.Footnote 6 The authors speak of the third wave of democratization to show that growing more similar may also mean that there is change in a certain direction—a common move toward more democracy in this case. However, the direction of change need not always be associated with “more” or “better” structures or policies, as suggested by the expectation and evidence of a downward spiral in tax competition or the downsizing of the public sector.Footnote 7
Apart from the effects of diffusion on convergence and the parallel development of countries, its causes are also of interest. Does the strong growth of economic and institutional linkages between nation-states lead to increasingly similar policy measures across countries? Or are national responses to global or European challenges primarily influenced by existing domestic structures and institutions?Footnote 8 Under which conditions can we expect domestic policies to converge or to diverge? What explains the adoption of similar policies across countries over time? If it exists, is the convergence of policies driven by economic processes, by the rise of regional and global political institutions, or by endogenous national policy choices? Although many factors have been suggested in the literature, there is still a lack of systematic theoretical and empirical investigation about their actual explanatory relevance.
In this article, we address this research deficit. In empirical terms, we ask whether the cross-national convergence of environmental policies can be observed. We analyze the development of forty environmental measures across twenty-four countries between 1970 and 2000. From a theoretical perspective, we are interested in the explanatory power of three international factors often mentioned as important causes of policy convergence, namely international harmonization, transnational communication, and regulatory competition. However, we also account for a number of domestic factors, such as income, the pressure of environmental problems, and political demand for environmental policy.
We define policy convergence as any increase in the similarity between one or more characteristics of a certain policy (for example, the exact policy settings) or in the similarity of the policy repertoire in a certain field (such as environmental policy) across a given set of political jurisdictions (such as states) over a given period of time. Policy convergence thus describes the end result of a process of policy change over time toward some common point.Footnote 9 In this contribution we use the concept of sigma-convergence focusing on the degree of similarity increases.
Theory and Hypotheses
In the literature, international factors play an important role in accounting for cross-national policy convergence.Footnote 10 On the one hand, these factors refer to the extent to which countries are institutionally interlinked. In this context, emphasis is placed not only on convergence effects emanating from the harmonization of national policies through international or supranational law, but also on the effects of transnational communication and information exchange within institutionalized networks. On the other hand, regulatory competition emerging from increasing economic integration was identified as an important factor that promotes the mutual adjustment of policies across countries. In focusing on the explanatory relevance of these international factors, we do not neglect the potential influence emerging from domestic factors. Similarity or convergence of national conditions might trigger similar political responses and hence policy convergence.Footnote 11
International Harmonization
International harmonization refers to a specific outcome of international cooperation, namely to constellations in which national governments are legally required to adopt policies that are in line with international legal requirements. International harmonization presupposes the existence of interdependencies or externalities that push governments to resolve common problems through cooperation within international institutions, and hence sacrifice some independence for the good of the community.Footnote 12 Once established, institutional arrangements constrain and shape domestic policy choices. This way, international institutions are not only the object of state choice, they also have consequences for subsequent governmental activities.Footnote 13 However, the existence of an international provision does not automatically imply similar provisions at the national level, because there is usually much leeway in international treaties as well as deficient implementation of supranational law.
In the case of international cooperation, it may be argued that it is not the international institution that shapes, via its obligations, the member states' policies and thus leads to convergence, but that countries with the same policy preferences join the same institutions. This would certainly not be true for international organizations that cover a broad range of policy areas, such as the EU, the UN, or the Organization for Economic Cooperation and Development (OECD). Countries would not join this organization just because they have similar environmental policy preferences. It might be true, however, for single-issue environmental treaties. The causal direction would thus be the other way around, implying that we might face a problem of endogeneity.
However, having the same policy preferences is not the same as having the same policies. As we have outlined, international environmental treaties are typically concluded in order to avoid spatial externalities and to provide global public goods. In undertaking international cooperation, members aim at binding themselves and others to a policy they all deem desirable but would otherwise probably not adopt because there are considerable incentives to a free ride. Having the same policy preference is hence not a sufficient condition for having the same policies. International harmonization has a distinctive causal role to play. For this reason the problem of endogeneity does not seem to pose a severe challenge.
To grasp the influence of international harmonization on policy convergence, we distinguish between two types of harmonization effects. On the one hand, these effects arise from accession: members ratify the treaty and have to comply with the respective requirements, implying that convergence effects occur only once. On the other hand, we can also conceive of harmonization effects through membership, if the institution in question has the competence and authority to produce regulatory output for its members, which leads to enduring and steadily renewed harmonization effects over time. In contrast to most international institutions, the particular character of the EU implies harmonization effects from membership, as the institutions of the EU continuously develop and decide upon new legislative proposals. For other international institutions, harmonization effects basically emerge from accession.
Moreover, international institutions crucially differ in their obligatory potential, that is, the extent to which compliance with legal obligations can actually be enforced. In the EU, such powers are comparatively well developed, given the direct effect and the supremacy of European law. International institutions, by contrast, not only lack these characteristics of enforcement power—they also reveal important differences in their obligatory potential and hence the extent to which they are able to enforce policy changes toward their members.
Finally, international harmonization usually comes in the form of minimum but not total harmonization. Even in the EU, total harmonization has so far been used for only some environmental product standards. The regulation of car exhaust emissions has followed this pattern since the introduction of the catalyst car in 1989.Footnote 14 In all but the car items in our sample (see the list in Table 2) it is therefore possible for states to introduce stricter standards than the international ones. In fact, as we will show later, car emission standards belong to the group of policies for which convergence is most pronounced. Minimum harmonization has been used for air and water quality standards, such as sulfur dioxide, but also for process standards, such as the standards for large combustion plants. A case in point is the German large combustion plant regulation that contains standards that are stricter than the requirements spelled out in the corresponding EU Directive.Footnote 15
In view of these considerations, we can formulate the following hypotheses on the impact of international harmonization on cross-national environmental policy convergence:
H1.1.
EU membership: If n countries are members of the EU in t0, their environmental policies converge in the following periods.
H1.2.
Accession to international institutions: The higher the score of common institutional accession to an institution (weighted by its obligatory potential) of n countries from t0 to t1, the more their environmental policies will converge during the same period.
Transnational Communication
Legally binding rules are not the only way that international institutions might cause cross-national policy convergence. This expectation follows from various theoretical arguments developed in organizational sociology and in theories on transfer and diffusion of policies by policy learning.
First, as DiMaggio and Powell emphasize, frequently interacting organizations (such as national bureaucracies) tend to develop similar structures and concepts over time. Policy convergence results from organizations striving to increase their social legitimacy by embracing forms and practices that are valued within the broader institutional environment. Thus states might emulate the successful policies of other states. Cross-national policy convergence is then driven by the demand for similarity of structure and functioning and social legitimacy, rather than the desire for increased efficiency.Footnote 16 In this context, the establishment of international institutions and networks plays an important role in facilitating the exchange of policy innovations across national borders.Footnote 17
Second, the role of international institutions for nonobligatory convergence can also be based on theories of rational policy learning. For example, the concept of lesson-drawing refers to constellations of policy transfer in which governments rationally use available experience elsewhere to solve domestic problems. According to Rose,Footnote 18 lesson-drawing is based on a voluntary process whereby government A learns from government B's solution to a common problem. This kind of learning will be enhanced when countries meet and communicate on a regular basis within international institutions.
Third, transnational problem solving typically occurs within transnational elite networks or epistemic communities who share common principled beliefs over ends, causal beliefs over means, common standards of accruing and testing new knowledge, and corresponding solutions to address these problems.Footnote 19 The diffusion of professional knowledge via transnational networks or “epistemic communities” plays an important role in facilitating the cross-national spread of policy concepts by deliberation and learning. The study by Chwieroth,Footnote 20 for instance, demonstrates the effects of neoliberal economic thinking on the diffusion of neoliberal capital account liberalization.
Under the term transnational communication, we therefore summarize a number of mechanisms including emulation, lesson-drawing, and transnational epistemic communities. So far, no established heading for these different, but closely related, mechanisms exists in the literature. One could certainly argue that each of the mechanisms we list under transnational communication can be considered as a mechanism in its own right.Footnote 21 However, they share an important characteristic that crucially distinguishes them from all other causal mechanisms; namely, they presuppose nothing but information exchange and communication with other countries. Moreover, the theoretical expectations with regard to their convergence effects are rather similar.Footnote 22
An example from our data set of convergence triggered by transnational communication refers to the limit values for industrial discharges of heavy metals into surface water. For these standards, legally binding requirements exist at neither the international nor supranational level. According to the theory of regulatory competition, we should expect a downward shift of standards in this case, as they constitute process regulations. However, our data reveal a clear trend of convergence and also an upward shift of standard levels. Case study evidence indicates that this development is, to a large extent, the result of information exchange and mutual learning. Especially within the EU, the preparation and discussion of common water policy approaches induced laggard countries to adopt the rather strict regulations of environmental leaders (Hungary, for instance, copied the standards of Germany), even in the absence of EU-wide harmonization.Footnote 23
Following these theories, we assume that convergence effects of transnational communication will not unfold immediately with accession but will increase with the duration of membership. Because there is no categorical difference between the EU and international institutions in this respect, there is no reason to differentiate between different types of institutions here. However, we have to take into account that—similar to their obligatory potential—international institutions also reveal important differences in what we refer to as their “communicative potential.” This potential varies with frequency and breadth of interaction.
H2.
Institutional membership: The higher the score of common institutional membership (weighted by communicative potential) of n countries in t0, the more their environmental policies will converge in the following periods.
Regulatory Competition
Theories of regulatory competition generally predict that countries adjust regulatory standards to cope with competitive pressures emerging from international economic integration. Regulatory competition presupposes economic integration among countries, that is, the existence of integrated markets and free trade. Especially with the increasing integration of European and global markets and the abolition of national trade barriers, the international mobility of goods and capital puts competitive pressure on nation-states to redesign domestic market regulations to avoid the regulatory burdens that restrict the competitiveness of industries. The pressure arises either from threats of economic actors shifting their activities elsewhere or from internal lobbying by industries, emphasizing the competitive disadvantages that domestic firms suffer through strict and costly environmental regulation. Strict standards, so the argument goes, demand filters or other tools, which raise production costs. Then the domestic steel industry, for example, would suffer from a competitive disadvantage against the steel producers abroad (given these need not apply similarly strict standards). This would in turn induce governments to adjust their regulatory standards. A government has thus two motives to lower its standards: either it competes for foreign investment or it protects its own industry.
The metaphor of regulatory competition and the “race to the bottom” implies a market analogy: producers compete for consumers and the price moves toward an equilibrium. Similarly, in the model of regulatory competition, the level of regulation moves toward an equilibrium (“the bottom”). In the short run, we should be able to observe divergent and convergent movements in a sequence. For example, one country lowers its standards compared to others (divergence), then the others follow up (convergence), some even overtake (divergence), and so on. However, in the long run, we should see a convergence of standards around an equilibrium, because it does not pay to lower standards further, or because more than a complete abolition of standards cannot be achieved.
There is a broad debate about the extent to which these adjustments coincide with an upward or downward shift of regulatory levels. While in general, a downward shift is expected, an upward shift of regulatory level is associated with product standards.Footnote 24 The classic example of a race to the top in product standards is car emission standards. When California raised its emission standards, most U.S. states followed quickly in order not to lose the market in California.Footnote 25 A similar process has been observed in the EU.Footnote 26 Given our focus on the degree of convergence, it is sufficient to consider that theories of regulatory competition predict convergence of environmental policies among countries exposed to competitive pressures, regardless of the regulatory level at which this convergence might occur.
In sum, the more exposed a country is to competitive pressures following from high economic integration, the more likely it is that its policies will converge to other states with international exposure. In this context, trade flows are usually referred to as a proxy for the economic interlinkage between countries.Footnote 27 However, economic openness can also be measured by looking at the institutions that regulate the openness of an economy, such as taxes on trade, regulatory trade barriers, or capital market controls. Both indicators measure the vulnerability of a country to regulatory competition.
H3.1.
Bilateral trade: The higher the trade flows between n countries in t0, the more their environmental policies will converge in the period between t0 and t1.
H3.2.
Economic openness: The higher the mutual openness of the economies of n countries in t0, the more their environmental policies will converge in the period between t0 and t1.
Two qualifications apply, however. First, even in constellations of high economic integration, no competitive pressures will emerge in and between nonmarket economies. Second, adjustments are expected for trade-related policies only, such as product or process standards. Typical examples of environmental product standards in our sample are car emission limit values (for example, for carbon monoxide or nitrogen oxide); limit values for the emissions of large combustion plants (for example, for sulfur dioxide or nitrogen oxides) are an example of process standards. No convergence will occur for policies that are not directly related to products or to production processes (for example, forest protection).
Domestic Factors
Policy convergence might not be caused by international factors only but may simply be the result of constellations in parallel domestic problems that trigger similar responses. In other words, countries that share a broad number of characteristics are more inclined to react independently to a problem in a similar way. With regard to the environmental field, several factors might be important.
First, we analyze factors that facilitate the transfer and emulation of policies that lead to increases in cross-national policy similarity over time, in particular cultural similarity between countries (for example, in terms of language, religion, or geographical proximity). These factors are expected to work even in the absence of strong international institutional integration between countries.Footnote 28
A second factor refers to the similarity between the level of economic development of a country and the comprehensiveness and strictness of its environmental policy, as expressed by the “Environmental Kuznets Curve”Footnote 29 that indicates that the level of environmental pollution grows with gross domestic product (GDP) up to a certain point, but then decreases again as a result of increasing political demand for environmental protection in rich countries.
Third, the convergence of domestic policies might be the result of similar demands for a comprehensive and stringent environmental policy, expressed, for instance, by the existence of green parties, a strong environmental movement, or high environmental awareness of the population.
Fourth, the confrontation with the pressure of similar environmental problems is expected to trigger similar policy responses. The “problem pressure” can be approximated with aggregated indicators of environmental stress, such as population density, energy use, or carbon dioxide (CO2) emissions.
Finally, the effects of pre-existing similarity of policies on convergence in later periods will be investigated. Theories of policy convergence through transnational communication and learning emphasize that the degree of existing similarity (or the number of earlier adopters of a policy) may positively influence the degree of convergence in the future. This effect, however, might be reduced by “saturation effects”: if a group of countries already has highly similar environmental policies, convergence toward each other will necessarily decrease over time.
On the basis of these considerations, the following general hypothesis can be formulated:
H4.
Domestic factors: The higher the similarity of n countries with regard to culture, income levels, demand for environmental protection, environmental problem pressure, as well as pre-existing environmental policies is in t0, the more their environmental policies will converge in the following periods.
Operationalization of Variables and Data
Dependent Variable
Selection of policies
To assess the degree of environmental policy convergence we rely on data on forty environmental policies that cover a broad variety of different environmental media, including, for instance, different measures to combat air, water, or soil pollution as well as the adoption of cross-cutting principles such as sustainable development or the precautionary approach (see Table 2). For these policies, data were collected for three dimensions: In the first, most general dimension, the focus is on the presence of a policy. Convergence occurs when countries adopt a respective policy, such as a program to reduce industrial emissions of carbon dioxide. The second dimension refers to the concrete policy instruments applied, with convergence requiring not only the adoption of respective policies, but also the use of similar policy instruments, such as air quality standards or emission taxes. In the third, most specific dimension we consider the precise settings of these instruments, such as limit values or tax rates. With regard to this dimension, the occurrence of policy convergence depends on the extent to which the actual setting levels of the countries under study became more similar over time. Of the forty policies under study, all possess the presence-of-policy dimension, whereas twenty-eight possess the instruments and twenty-one the settings dimension.
We apply a convergence perspective that is based on the analysis of policy outputs (the laws, decrees, or programs adopted by a government). We do not consider policy outcomes, that is, the actual effects of a policy in terms of goal achievement, such as improvements in environmental quality, because they are only indirectly related to the causal mechanisms of convergence. They are usually affected by many intervening variables.
In the most encompassing variable, all forty policies of the data set are included. In addition, the following subgroup variables are distinguished: First, we differentiate between trade-related (product and process) and nontrade-related policies. According to the theory of regulatory competition, convergence effects should be stronger for trade-related policies. Second, we distinguish obligatory and nonobligatory policies. Obligatory policies refer to those policies for which a binding international standard exists. For obligatory policies, the effects of international harmonization on convergence should be more pronounced than for nonobligatory policiesFootnote 30 (see Table 2 for details).
Selection of observation period and countries
We compare the degrees of cross-national policy similarity at four points in time (1970, 1980, 1990, and 2000). The year 1970 represents the starting point of national and international environmental policy. In 1980, the first wave of laws had been passed in the more environmentally advanced countries. Moreover, various international organizations had launched environmental programs for the first time. In 1990, more or less comprehensive environmental policies had been put in place in almost all industrialized countries. The year 2000, finally, represents the situation after the fall of the Berlin Wall, with growing trade relations between Western and Eastern European states, and with a number of Central and Eastern European (CEE) countries seeking membership in the EU. Therefore, according to the theories outlined here, over the past decade, an overall approximation of environmental policies in Europe can be expected.
The twenty-four countries under investigation include the member-states of the EU-15 (except Luxembourg), Norway, Switzerland, Poland, Slovakia, Hungary, Bulgaria, and Romania, as well as the United States, Mexico, and Japan. The country selection thus includes different groups of countries with regard to the influence of EU membership: the founding members of the EU, countries joining the EU in different enlargement rounds, countries that—by the end of our observation period—were negotiating EU accession, countries that are not members but closely affiliated (Norway and Switzerland), and three countries not affiliated with the EU at all.
The collection of the data was based on a questionnaire that had to be completed by environmental policy experts for each country. The information provided by the country experts was cross-checked in light of existing databases. The complete data set is available from the homepage of the ENVIPOLCON research project.Footnote 31
Independent Variables
International harmonization
Following our theoretical considerations, we distinguish between two variables to analyze the effects of international harmonization: eu membership, and accession to international institutions. For eu membership, we use a dummy variable. The second variable takes account of the effects of accession to other international institutions. To measure these effects, we collected data on the membership of countries in thirty-four international organizations and regimes. The membership score is weighted by the institutions' obligatory potential.Footnote 32
Transnational communication
This variable consists of membership data for thirty-five (including EU) international institutions. These data are weighted by the institutions' communicative potential and the length of a country's membership in the institution—assuming that effects of communication increase with membership duration and hence a country's embeddedness into a certain communication network. It is difficult to separate harmonization effects from effects of transnational communication. This variable, however, should clearly indicate the communication effects that go beyond pure harmonization: if the only changes in membership are in institutions that do not have the possibility of internal harmonization, institutional convergence effects cannot be the result of harmonization.
Regulatory competition
To measure the degree of economic interlinkage between countries we use data on bilateral trade. As for other indices of openness, the trade volume is weighted by the size of the national economy. We include trade flows between market economies only, since trade between nonmarket economies (CEE countries before 1989) is not expected to have the effects that theories of regulatory competition focus on. As a second indicator we use the fraser economic freedom index. It includes institutional data (for example, on regulatory trade barriers and taxes on trade) as indicators for the openness of an economy and hence its vulnerability to foreign competitors.
For several reasons, we do not use a measure of capital mobility, such as foreign direct investment (FDI). First, FDI would be a good measure if regulatory competition was a response to industry relocation in view of cost burdens emerging from environmental regulation. However, as previous research has shown, exits for reasons of environmental costs are highly unlikely.Footnote 33 The mechanism of regulatory competition is instead based on industry lobbying against strict environmental regulation, emphasizing competitive disadvantages in international trade. Second, trade flows and FDI are highly correlated anyway.Footnote 34
Domestic Factors
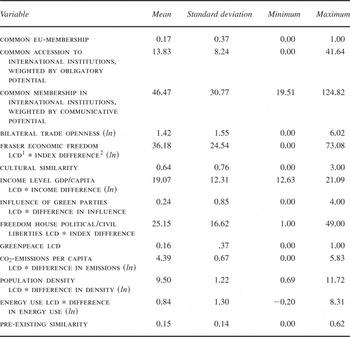
For the measurement of cultural similarity, an index was developed (including religion, language, and geographical proximity). To assess income levels, we use GDP per capita. Domestic political demand for a comprehensive and stringent environmental policy is covered by three variables. We start with the influence of green parties (measured as electoral success, membership in parliament, and participation in government). Depending on the nature of the national electoral systems, however, the election chances of green parties might vary across our country sample. We hence use two additional indicators of political demand: the existence of a national greenpeace bureau in a country as an indicator for the presence of an environmental movement; and the freedom house index of political rights and civil liberties as a measure of democratic freedom. We assume that countries in which democratic freedom is high experience more influence from green movements. pressure from environmental problems is tested with three variables: the level of co2-emssions per capita, population density, and energy use. Although these are rather rough indicators, they should serve as general proxies for problem pressure through environmental pollution. Finally, to measure the level of pre-existing similarity of policies, we use a variable that consists of the level of similarity in the previous period. The descriptive statistics of all independent variables are included in Table A1 in the Appendix.
Findings
Descriptive Data and Statistics
To answer the question whether and to what extent the environmental policies of the countries under study are actually converging, this section provides a brief overview of basic descriptive data and statistics.
To measure the degree of sigma-convergence (that is, the extent of changes in policy similarity over time), we start with two concepts that are commonly applied in the literature.Footnote 35 First, to analyze convergence with regard to the presence of policies, we rely on adoption rates. This approach, which is typically used in research on policy diffusion, gives us information on the spread of policies across countries. An increase in adoption rates implies growing policy similarity across countries. The second concept is suitable to measure convergence on policy settings only because it requires metrical data. According to this approach, a decrease in the coefficient of variation (CV) is equivalent with convergence.
Adoption rates
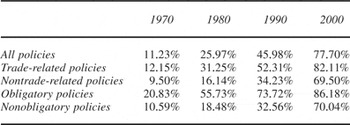
Adoption rates include information on the number of countries that have introduced a given policy. Looking at the development for the whole sample of the forty policies, we find a continuous spread of environmental policies across countries. Hence, the average adoption rate continuously grew over time, almost doubling during each decade under investigation. From a modest average adoption rate of 11 percent in 1970, the forty environmental policies under study had already been adopted in 46 percent of all countries in the sample by 1990. By 2000, the average adoption rate had further increased to 78 percent, including several policies with an adoption rate of 100 percent. The policy subgroups show a similar development, with higher adoption rates for trade-related and obligatory polices than for nontrade-related and nonobligatory ones.
Environmental policies: Average adoption rates

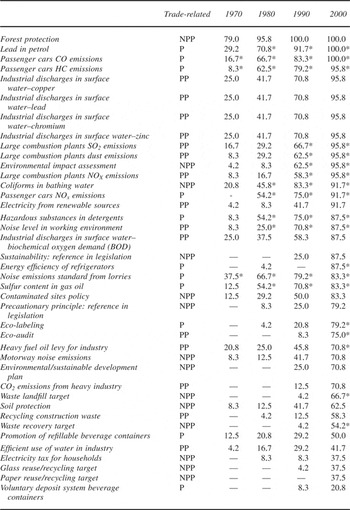
Table 2 presents a more detailed overview, covering adoption rates for all forty policies under investigation. According to their adoption rate level in the year 2000, the policies are divided into four subgroups, including policies that have been adopted in 90, 75, 50, and 25 percent of all countries under study by the year 2000. Moreover, the table gives information on the policy type. While the extent to which policies are trade-related does not change, the nature of the policies as nonobligatory or obligatory might vary over time, as a result of growing harmonization activities at the supranational or international level. This development is indicated by asterisks in the table.
Environmental policies: Adoption rates over time

Notes:
P = product standard. PP = process standard. NPP = nontrade-related policy.
* Obligatory items.
The data show that the extent to which policies are trade-related and obligatory has a positive influence on the level of the adoption rates. For the two groups with relatively high adoption rates in the year 2000, the numbers of policies that are trade-related and are or have become obligatory are considerably higher compared to the groups characterized by lower adoption rates. Moreover, those policies characterized by an early introduction generally reveal higher adoption rates than those measures introduced for the first time only during the 1980s or 1990s. However, there are also several “late-comers” in our sample that nevertheless had been adopted rather quickly across the countries under study. The most outstanding case refers to policies regarding the energy efficiency of refrigerators, for which the adoption rate increased from 0 percent to 87.5 percent between 1990 and 2000.
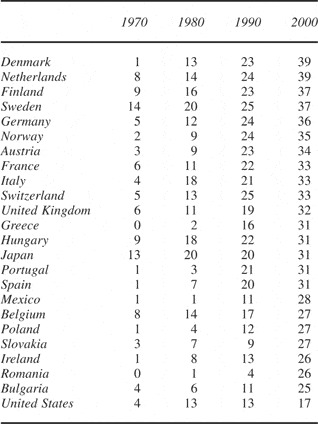
Table 3 offers an overview of the extent to which the twenty-four countries in our sample have adopted the forty policies over time (ranking the countries according to the number of policies adopted by the year 2000). While the table confirms the general findings of a rather broad policy spread, we find differences across the countries under study.
Policy adoptions over time by country (number of policies)

First, the data reveal a difference in adoption rates between countries typically known as environmental leaders (the Netherlands, the Scandinavian countries, and Germany) and environmental laggards (led by the United States, Bulgaria, Romania, and Ireland). Second, the data show that EU membership need not automatically imply that the respective countries adopt a high number of environmental policies. While many of the “top adopters” are members of the EU, there are also several countries that—in spite of EU membership—rank rather low (including the “old members” Spain and Ireland). This development can be traced to the fact that about half of the policies under investigation are still not subject to European harmonization.
Third, we observe different dynamics regarding the change of adoption rates over time. Hardly surprising in this context are the strong increases in policy adoptions during the 1990s in the CEE countries and Mexico, which reflect the overall processes of economic catching-up and political transformation taking place in these states. An exception to this pattern is Hungary, which already belonged to the group of “top adopters” during the first two decades of the observation period. However, we also find countries where policy adoption is characterized by rather low growth rates and even stagnation (examples are the United States and Japan for the periods of the 1980s and 1990s) or a rather linear increase in policy adoptions over time (Denmark, the Netherlands, Finland, Sweden, Germany).
Coefficient of variation
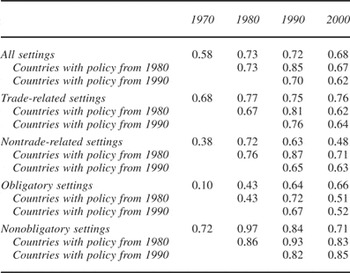
Of course, adoption rates can show only the spread of policies as such; they do not give much information on the similarity of individual policies. For policy settings, the change in similarity can be measured by the change in the variation of metrical values (for example, limit values) for a certain policy in the country sample over time. We therefore look at the changes of the CV for the whole group and different subgroups of the twenty-one setting items analyzed in our research project. The results are summarized in Table 4.
Coefficients of variation for setting items

To assess the convergence of setting items, two perspectives are distinguished. According to the first perspective, all available values are included for each point in time (implying that the number of countries might change over time): Regarding x countries in t i and y countries in t j, is there a decrease in variation? This way, it is possible to show how countries that introduced a policy in a certain period contributed to convergence or divergence—perspective (1). In the second perspective, by contrast, only those countries for which a value existed in t i are included in the analysis, that is, the number of countries is held constant throughout the observation period—perspective (2).
When looking at the average CV for all twenty-one setting items from perspective (1), the figures show that convergence occurred during the period from 1990 to 2000 only. Moreover, the similarity increase remains rather low, with the CV shifting from 0.72 to 0.68 only. Perspective (2) reveals that those countries having introduced a policy by 1980 further diverged during the following decade. Moreover, from perspective (2), the convergent development during the 1990s is more pronounced. Similar changes can be observed for the policy subgroups with the exception of nontrade-related and nonobligatory policies where we observe a decrease in the CV since 1980—perspective (1).
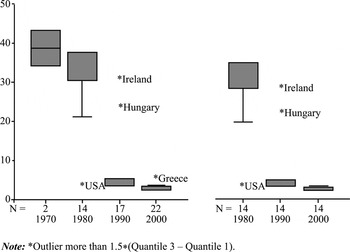
However, even if the number of countries is corrected for, the decrease in variation is not impressive. This contradicts the picture of the development of individual policies for all countries, as will be shown by an example. Figure 1 shows the development of CO emission standards for passenger cars, an environmental product standard for which international harmonization at the level of the EU existed since 1970. The development is similar for other car emissions and also for a number of industrial discharges into water. In this example, the development of the CV indicates sigma-divergence between 1980 and 1990 (0.30 to 1.03) but convergence between 1990 and 2000 (1.03 to 0.27).
CO emissions from passenger cars (g/km) box plots

However, Figure 1 gives a different picture. It analyzes the variation of settings on the basis of box-plots that display the distribution of values for each point in time. The length of the box represents the degree of variation: the longer the boxes, the less similar the values on this variable. In contrast to convergence analysis based on the CV, outliers and extreme values are displayed separately. Decrease in the length of a box over the decades can be interpreted as the occurrence of sigma-convergence.
Figure 1 displays changes in variation on the basis of both perspectives distinguished here. The figure on the left includes the data for all countries, implying that the number of countries varies over time. On the right side, by contrast, only those countries that had introduced a policy by the year 1980 are taken into account. For both perspectives, the box plots indicate strong decreases in variation throughout the whole observation period, including the period of the 1980s. Thus the phenomenon can be traced to the fact that sigma-divergence is basically triggered by outlier countries. Together with the pattern of broad diffusion of policies across countries (see Table 1), this finding points to certain shortcomings of convergence analysis based solely on changes in the CV.
Measuring Convergence: The Pair Approach
Pair approach
Given the limitations of the CV, our measurement of convergence is based on an approach in which the unit of analysis is a country-pair. Accordingly, convergence implies an increase of policy similarity between a given pair of countries over time. The pair approach offers several advantages for the purpose of our study and avoids the pitfalls just demonstrated above.Footnote 36 First, since it is not based on aggregate figures like the CV, it allows us to use a convergence variable as the explanandum in a quantitative model. Second, it includes every shift of convergence or divergence between countries. Third, it can be used for both categorical and metrical data. Finally, the hypotheses can be tested more directly with country-pairs than at the level of individual countries: the common membership of a pair (or group) of countries in an international institution is assumed to increase policy convergence among these countries via international harmonization or via transnational communication.
In emphasizing these advantages we do not overlook potential weaknesses of the pair approach, in particular the possibility of autocorrelation between different dyads: the score of a certain country-pair can be determined by the score of other country-pairs. However, this disadvantage also holds for other approaches to measure convergence, because the comparison to a point of reference that is defined by the composition of the sample is inherent to the concept of convergence.Footnote 37 Moreover, problems of autocorrelation should remain at a rather moderate level in the context of our study. While autocorrelation might be particularly pronounced with regard to the effects of EU membership, the problem becomes less severe with a closer look at our country sample which contains far fewer EU members than it might seem. In 1970, only ten, in 1980 only twenty-eight, in 1990 only fifty-five, and in 2000 only ninety-one of the 276 country-pairs in our sample were members of the EU. Although we cannot completely rule out a potential bias emerging from the fact that country-pairs lack independence, this bias should be limited. Weighing up strengths and weaknesses, the pair approach offers the opportunity of an innovative and direct access to the study of convergence, measuring the increase or decrease of policy similarity between countries on a bilateral level.Footnote 38
Calculation of policy convergence
To measure policy convergence, the data set is transformed from country level to dyad. The number of combinations is calculated by the binomial coefficient, with double pairs (countries A and B, countries B and A) eliminated so that each pair is unique.
The similarity scores as an interim step to the measurement of convergence are calculated as follows: the assessment of similarity is trivial for the presence-of-policy and the instrument dimensions. When comparing these dimensions, score “1” means that countries A and B have the same policy or instrument, whereas “0” means that they are dissimilar. If no policy exists so far for both countries, they are dissimilar by definition, such as when we observe an “empty set” that cannot be compared.Footnote 39 For the setting dimension, we apply a normalized metrical score from 0 to 1 based on differences between limit values of country A and B, which leads to a similarity scale between 1 (limit values are identical) and 0 (country-pair with the most dissimilar setting values). For all other values, gradual similarity is assessed by weighting the distance between two settings with the maximum distance for each item and for each point in time. The maximum distance is controlled for outliers by calculating the range between the 90 and the 10 percentile of the empirical distribution.
Summing up the similarity scores for all dimensions, we thus arrive at a similarity scale from “0 to 89” points (40 plus 28 plus 21). For better interpretation and for reasons of comparability, all scores are transformed to percentage scales, with the maximum of 89 points corresponding to 100 percent similarity of environmental policies.
The similarity scores can easily be transformed to convergence scores. Convergence is measured by changes in percentage points of absolute similarity between t i and t j. Those policy items that have already shown complete similarity in t i for country-pair AB are not included in the calculation of the convergence score of the following periods. This operation avoids the inclusion of saturation effects, that is, an underestimation of convergence.Footnote 40
Descriptive results of the pair approach
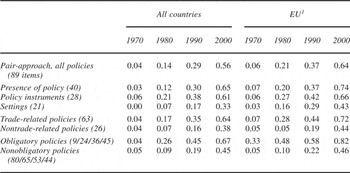
Table 5 provides an aggregate description of our empirical findings. It contains the results for the whole sample used in the pair approach and for all policy subgroups, including information on mean values of policy similarity for 276 country-pairs (in percent) with respect to four points of time. Moreover, in the right half of the table, the results for the EU member states are provided to get an impression of the potential difference EU membership implies for policy convergence.
Policy similarity: Mean values for country-pairs

Notes:
1. Number of member states (except Luxembourg) are the following for each decade: 1970 = 5; 1980 = 8; 1990 = 11; 2000 = 14.
First of all, the results show that, in general, similarity grows considerably from 1970 to 2000 (from 0.04 to 0.56), a finding that holds also for all subgroups of items under investigation. Second, in 2000 similarity effects are most pronounced with regard to the presence-of-policy dimension (0.65), followed by instruments (0.61), with settings being least developed (0.33). Third, when looking at policy types, it becomes apparent that similarity increases for trade-related policies (0.64) are more pronounced than for policies not related to trade (0.38). The same applies for the distinction between obligatory (0.67) and nonobligatory items (0.45).
Looking at EU member states alone, the general picture is the same although the level of similarity is higher. This is true with respect to almost each individual figure; that is, for all policy subgroups and for all decades. The difference is particularly pronounced for trade-related policies (0.72 in 2000) and for obligatory policies (0.82 in 2000). This does not come as a surprise because the environmental policy of the EU was concerned with market harmonization from the beginning and has thus concentrated on regulation of trade-related environmental policies. In the following, we will investigate in more detail these results in light of our independent variables.
Method of Analysis
The models we apply refer to a pooled data set of three cross-sectional assessments of convergence for the 1970s, the 1980s, and the 1990s. Each of the three cross-sectional models includes observations on 276 country dyads. In all models the dependent variable measures convergence as the change rate of policy similarity from the beginning of a decade to its end, indicated in percentage points. The use of this type of data typically poses several problems for the statistical analysis. This holds for country-based analyses as well as for dyadic approaches.Footnote 41 The literature suggests a broad range of options to respond to these difficulties.Footnote 42
First, considering that our observations vary across time and space, error terms cannot be expected to be independent over time.Footnote 43 Moreover, heteroskedasticity might exaggerate the statistical significance of the results. The Durbin-Watson tests indeed show that the null hypothesis on the nonexistence of autocorrelation cannot be rejected; a White test indicates the existence of heteroskedasticity. To eliminate serial correlation of errors, we calculate Huber/White heteroskedasticity-consistent semi-robust standard errors and combine them with a Prais-Winsten transformation.
Second, time-period specific effects may affect all countries simultaneously—a scenario that seems quite realistic for our study in view of the global rise of environmentalism during the 1970s. We therefore specify these effects in three dummy variables for each decade. However, we do not include dummy variables for dyads and also deviate from the Beck and Katz standard because we do not specify a true lagged dependent variable. This would reduce the number of cases significantly, since convergence scores for t i-1 (the 1960s) are not available. For theoretical reasons, we instead use a variable for the absolute level of pre-existing similarity (see the section on domestic factors above).
Third, although for theoretical reasons we do not expect problems of endogeneity with regard to the linkage between international harmonization and policy convergence (see the section on the dependent variable above), we introduce further technical controls by relying on time lags: while the dependent variable refers to the ongoing changes during one decade, independent variables generally refer to the level in the beginning of each decade.
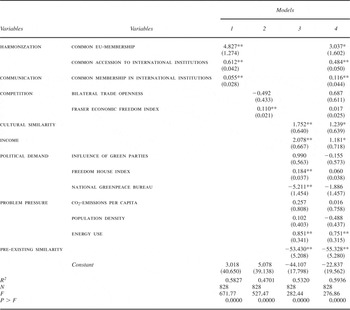
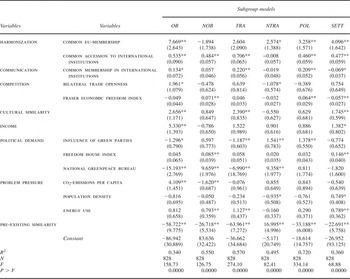
We start with a regression model that shows the explanatory potential of the variables for international harmonization (eu membership, accession to international institutions) and transnational communication (membership in international institutions) (Model 1). In Model 2, we include effects of regulatory competition (bilateral trade, fraser index), while Model 3 demonstrates the explanatory potential for the selection of domestic variables. Finally, all variables are included in Model 4 (see Table 6). In addition, we analyze the explanatory potential of all variables for different subgroups of policies (see Table 7).
Multiple regression models (eighty-nine policy items)

Multiple regression models (policy subgroups)

Notes:
The dependent variable is convergence scores in percent. A variation of Huber/White sandwich estimator (H3) was used; semi-robust standard errors are reported in parentheses. Prais-Winsten regressions were performed using Stata 9.1, corrected for first-order (AR1) autocorrelation. Each regression is run with dummy variables for every decade (observation) covered by the data.
** p < .05;
* p < .10.
Discussion of Results
Based on the theoretical considerations above we developed three main hypotheses: we expect positive effects of international harmonization, transnational communication, and regulatory competition on cross-national policy convergence. With respect to policy subgroups, international harmonization is expected to have a positive effect on obligatory policies, but not on nonobligatory policies, while regulatory competition should have a positive effect on trade-related policies, but not on nontrade-related policies. Beyond that, the subgroup models serve as a test for robustness that might provide us with additional empirical and theoretical insights.
International harmonization
Our findings indicate a positive correlation between eu membership and cross-national policy convergence, basically confirming our theoretical expectations. Coefficients are highly significant in Models 1 and 4 (see Table 6). This finding is consistent with the general development of EU environmental policy from the early 1970s onward and the strong focus on harmonizing domestic policies by adopting measures that are legally binding for the member states.Footnote 44
Despite this general pattern, the impact of eu membership varies across the different subgroups distinguished in Table 7. Considering that EU environmental policy strongly relies on legally binding measures, the different effects for convergence on obligatory (significant positive relationship) and nonobligatory policies (nonsignificant negative relationship) are hardly surprising. Moreover, as harmonization of national policies to avoid distortions of the Common Market has always been a major rationale of EU environmental policy, convergence effects should be similarly pronounced for different policy dimensions (policy presence and policy settings), where we indeed observe significant and positive correlations. Also for trade-related and nontrade-related policies, our results indicate a positive convergent effect of eu membership. At first glance, it seems striking that effects for trade-related policies are not significant, since a great deal of EU harmonization is trade-related. However, this can be explained by the fact that a large part of trade-related policies in our sample are nonobligatory and not covered by policies of the EU (see Table 2). Our theoretical expectation that international harmonization can also be effective through accession to international institutions other than the EU are confirmed by our results. Models 1 and 4 reveal positive and significant coefficients. The same finding holds for most of the subgroups distinguished in Table 7. It is only for nontrade-related measures that we observe insignificant effects.
In sum, our results reveal that international harmonization constitutes a major driver of cross-national policy convergence in the environmental field. In this regard, not only eu membership, but also accession to international institutions is significant. These findings hold not only for our general models, but also—with some minor exceptions—for the different policy subgroups. In addition, our results show that despite the high number of European countries in the sample, eu membership does not emerge as the single most dominant explanatory factor. This can be traced to the fact that, given our observation period, EU member states formed only a small, albeit increasing part of the country sample. Moreover, effects of eu membership might be weakened as nonmember countries, such as Norway or Switzerland, also oriented their policy toward EU legislation.
Transnational communication
Our regression results also provide support for the expected convergence effects of communication and information exchange in transnational networks. The positive and significant effect of common membership in international institutions on policy convergence in Models 1 and 4 is a result of international interlinkage that cannot be linked to international law. This statement also holds for different policy subgroups.
While effects are significant for obligatory and trade-related policies, an interesting difference appears when comparing different policy dimensions. While we find a significant positive effect for convergence on the presence of policies, transnational communication has a negative, albeit weak influence on the convergence of policy settings. These findings suggest that imitation and learning generally take place at more general levels of policy ideas or concepts, while communication effects are less pronounced when it comes to the specification of concrete policy characteristics (that is, settings). In this context, the considerable effect on the convergence of obligatory items need not constitute a contradictory finding. It is rather plausible that obligatory policies adopted at the EU level receive broader international attention and spread across countries that are not (yet) EU member states.
Regulatory competition
In contrast with the other variables analyzed so far, our findings provide no clear support for the hypothesis that a high degree of economic interlinkage between countries leads to increasing similarity of their environmental policies (Models 2 and 4). bilateral trade openness has no significant influence on convergence. This finding is consistent with the results of other studies.Footnote 45 In particular, there are no significant effects of bilateral trade openness on the convergence of trade-related policies. It is only for nontrade-related policies that we find a significant coefficient, but with a negative sign (see Table 7). In contrast, we observe a positive and significant correlation for obligatory policies. This suggests that the variables for economic and institutional integration are to some extent characterized by an endogenous relationship. This holds true for the EU in particular. Institutional integration leads to increased trade flows, while the existence of economic interlinkage constitutes a strong incentive for institutional cooperation. Our results suggest that the influence of competition is less important and overridden by institutional integration. It seems plausible that potential competition effects were anticipated by the involved countries and subsequently reduced by international harmonization.
Our models reveal quite similar results for our second economic variable, an aggregate index of institutional economic openness, the fraser economic freedom index. While weakly positive in Model 2, its effect is marginalized in the general Model 4. This picture also holds for the different subgroups. Again, and in contrast to theoretical expectations, there are no significant positive effects for trade-related policies.
Domestic factors
Turning to the explanatory relevance of domestic factors, our findings reveal strong differences between the variables under study. While some turn out to be strong predictors of cross-national convergence, the effects of others remain negligible.
cultural similarity, to begin with, belongs to the former category. We find a positive and significant effect on cross-national policy convergence in Models 3 and 4. Consistent with the literature on policy diffusion, countries that share a common language, common borders, and common traditions are more likely to adopt similar policies.Footnote 46 Turning to subgroups, cultural similarity effects are strong for obligatory and trade-relevant policies. Since this cannot be completely attributed to EU effects, the explanation might again be found in the cultural emulation of EU policies by culturally similar countries that were not yet EU member states.
Our results also provide some support for the popular hypothesis that a high and similar level of income of a country-pair leads to converging policy responses to problems of environmental pollution, with effects being positive and significant in Models 3 and 4. The pattern is less clear for the subgroups, however. While coefficients show positive signs for all models except nonobligatory policies, significant effects exist for obligatory policies and for policy settings only. The influence on settings indicates that countries with similar and high levels of income tend to adopt environmental policies of similar strictness, that is with similar standard levels.
Our results provide very limited support for the expected influence of political demand on cross-national policy convergence. A significant positive influence of green parties and the freedom house index observed in Model 3 is not confirmed when international factors are added to the equation (Model 4). national greenpeace bureau effects are negative, and also not significant in model 4. Moreover, the expectation of positive effects is confirmed only for the subgroups of nonobligatory and nontrade-related policies. We therefore find some convergence effects for policies that are not very strongly linked to international interdependence and economically motivated harmonization. In general, however, political demand does not seem to be a decisive factor to account for environmental policy convergence. The lack of constant and stronger effects reveals a rather limited influence compared to international pressures.
A similar conclusion can be drawn for the three variables measuring environmental problem pressure: co2emissions, population density, and energy use. Models 3 and 4 show only weak explanatory power for the first two variables, with significant positive effects at the subgroup level being restricted to obligatory policies (co2emissions) and settings (population density). The intensity of energy use, by contrast, seems to be a rather good predictor for policy convergence. Positive and significant effects can be found not only in Models 3 and 4, but also for three subgroups (nonobligatory and trade-related policies, policy settings). This suggests that energy use seems to be a proxy of environmental pressure that fits with our approach to cover large parts of the field of environmental policy. Similar to income levels, the relatively strong effects on settings are noteworthy, indicating that similar and high environmental problem pressure compels countries to adopt similar levels of environmental standards.
For pre-existing policy similarity Models 3 and 4 indicate a negative and significant correlation with convergence. This result can be interpreted as a consequence of saturation effects. Because some countries had developed similar policies already very early, there was not much potential for further convergence in the following periods. By contrast, those countries that started from a highly dissimilar position (if they had no or few policies in place) show much higher convergence rates during later periods, in particular during the 1990s where convergence tendencies have been most pronounced (see Table 1). This pattern is basically confirmed for the policy subgroups.
Conclusions
Our analysis of the convergence of environmental policies indicates several new and rather surprising insights. These findings are based on the collection and comprehensive analysis of data on environmental policy outputs for a broad range of industrialized countries over a period of thirty years.
First, our data reveal impressive and accelerating increases over time in the similarity of environmental policies of the countries under study during the observed period (1970 to 2000). The degree of convergence varies across policy types. It is more pronounced for obligatory and trade-related policies than for nonobligatory and nontrade-related policies.
Second, environmental policy convergence has a clear direction: the environmental policies of the twenty-four countries under scrutiny became much stricter over the observed period. This includes the introduction of more and more environmental policies by frontrunner countries, the gradual adoption of these by their followers, and the steady strengthening of particular policy goals or limit values. Overall, the development of environmental policies in the industrialized countries can be called a success story.
Third, these developments can be explained in particular by the effects of international harmonization and transnational communication. With regard to harmonization, convergence is driven not only by EU membership, but also—and to a similar degree—by the accession to international institutions other than the EU. While the strong effects of harmonization seem rather plausible from the outset, the explanatory power of transnational communication is striking. The effects of transnational communication on environmental policy convergence are as important as those of international harmonization. Communicative interaction within international organizations obviously has strong effects on the convergence of environmental policies.
Fourth, compared to the institutional variables, there is surprisingly little support for effects of regulatory competition on cross-national policy convergence. Neither can we find any hints that environmental policy “moved downward” over time, nor does the trade variable explain the overall movement of convergence. These results, however, may mirror the particulars of environmental policy as a field that started from scratch in the 1970s. One should therefore be careful about drawing general conclusions for other policy areas from these results. For example, SwankFootnote 47 shows that in the case of the diffusion of neoliberal tax policies, competition is the driving factor. As Lee and StrangFootnote 48 have demonstrated, public-sector downsizing happens in states that are geographically proximate and trade intensively. They argue, however, that the dominance of neoliberal discourses explains why downsizing is contagious and upsizing is not. Hence, the communication of ideas also seems to play a role in these areas.
Fifth, the explanatory power of domestic variables is generally rather limited. While certain effects can be observed for income and cultural similarity, political demand and environmental problem pressure are of minor relevance. The effects vary depending on the models applied.
Our findings show that increasing international interlinkage has driven environmental policies of industrialized countries toward greater similarity, comprehensiveness, and strictness. However, international harmonization and communication in international institutions play a much greater role for the convergence of environmental policies than regulatory competition does. For this reason, the further development and strengthening of international environmental regimes, as well as the encouragement of international organizations to engage in information exchange and benchmarking procedures, seem to constitute promising approaches to respond to current environmental challenges.
These findings point to three central areas for fruitful future research. First, there is a need to investigate the reasons for the surprisingly weak effects of regulatory competition. A factor that might help to resolve this puzzle is the fact that countries anticipate potential effects of regulatory competition by establishing a level playing field through international harmonization. To avoid races to the bottom and problems inherent in collective action, countries engage in international cooperation. Viewed from this perspective, regulatory competition could be interpreted as driving international cooperation toward environmental protection.
Second, the high relevance of transnational communication indicates a further issue that deserves particular attention in future research. In this regard, the focus should be on a more detailed analysis of the concrete processes through which transnational communication has its convergent effects. Our research design allows for a profound statement on the relevance of only transnational communication as such, rather than an in-depth analysis of the different communication mechanisms we have identified in the theoretical part of this article.
Finally, it is important to watch the implementation of environmental standards. While laggards in the context of growing economic and institutional interdependencies have a strong interest in enhancing their international environmental reputation by adopting stricter standards, they have at the same time an incentive to cheat with regard to the implementation of these standards. This is mainly due to reasons of economic competitiveness. Although regulatory competition and a race to the bottom do not exist in terms of environmental laws, they may exist in terms of the actual implementation of standards.
Descriptive statistics of independent variables

Notes:
1. LCD least common denominator of a dyad.
2. Difference between countries in a dyad.