1. Introduction
Fluid injection activities are important in many geophysical, environmental and industrial applications, such as geological
 $\textrm {CO}_2$
sequestration, waste water disposal, enhanced oil recovery and groundwater management. The process, especially the injection of viscous fluids into porous layers, intersects various disciplines, including fluid mechanics (e.g. Huppert & Woods Reference Huppert and Woods1995; Neufeld, Vella & Huppert Reference Neufeld, Vella and Huppert2009; Pegler, Huppert & Neufeld Reference Pegler, Huppert and Neufeld2014; Zheng et al. Reference Zheng, Guo, Christov, Celia and Stone2015b
; Hinton & Woods Reference Hinton and Woods2018), geomechanics (e.g. Spence & Sharp Reference Spence and Sharp1985; Lister Reference Lister1990; Savitski & Detournay Reference Savitski and Detournay2002; Lai et al. Reference Lai, Zheng, Dressaire, Wexler and Stone2015; OKeeffe, Huppert & Linden Reference OKeeffe, Huppert and Linden2018; Zheng Reference Zheng2025) and earth and environmental sciences (e.g. Nordbotten et al. Reference Nordbotten, Kavetski, Celia and Bachu2009; Woods & Farcas Reference Woods and Farcas2009; Juanes, MacMinn & Szulczewski Reference Juanes, MacMinn and Szulczewski2010; Neufeld et al. Reference Neufeld, Hesse, Riaz, Hallworth, Tchelepi and Huppert2010; Boait et al. Reference Boait, White, Bickle, Chadwick, Neufeld and Huppert2012; Guo et al. Reference Guo, Zheng, Bandilla, Celia and Stone2016a
; Zheng & Neufeld Reference Zheng and Neufeld2019a
). Understanding the pressure evolution and fluid migration scenarios could be useful for optimising operational strategies and mitigating environmental risks for these activities. The extent of pressure building up is also used to assess the injectivity of a porous reservoir, an important feature to characterise fluid injection activities in practical applications (e.g. IPCC 2005; Grude, Landro & Dvorkin Reference Grude, Landro and Dvorkin2014).
For example, the technology of geological
 $\textrm {CO}_2$
sequestration has gained serious attention during the past several decades as a strategic option for global climate change mitigation by reducing atmospheric
 $\textrm {CO}_2$
levels (e.g. Pacala & Socolow Reference Pacala and Socolow2004). This technology typically involves injecting
 $\textrm {CO}_2$
, often in the supercritical state, into deep saline aquifers or depleted oil and gas reservoirs. The success of these technologies depends significantly on how the injecting
 $\textrm {CO}_2$
displaces native brine and interacts with the porous medium, which is closely related to the pressure evolution (e.g. Huppert & Woods Reference Huppert and Woods1995; Hesse et al. Reference Hesse, Tchelepi, Cantwell and Orr2007; MacMinn, Szulczewski & Juanes Reference MacMinn, Szulczewski and Juanes2010; Pegler et al. Reference Pegler, Huppert and Neufeld2014; Zheng et al. Reference Zheng, Guo, Christov, Celia and Stone2015b
; Guo et al. Reference Guo, Zheng, Celia and Stone2016b
; Hinton & Woods Reference Hinton and Woods2018). The injection procedures must avoid issues such as aquifer contamination (e.g. Brusseau Reference Brusseau1995; Hesse, Orr & Tchelepi Reference Hesse, Orr and Tchelepi2008; Hinton & Woods Reference Hinton and Woods2019), unintended fluid migration and leakage (e.g. Pritchard, Woods & Hogg Reference Pritchard, Woods and Hogg2001; Neufeld et al. Reference Neufeld, Vella and Huppert2009; Nordbotten et al. Reference Nordbotten, Kavetski, Celia and Bachu2009; Woods & Farcas Reference Woods and Farcas2009; Juanes et al. Reference Juanes, MacMinn and Szulczewski2010; Zheng et al. Reference Zheng, Soh, Huppert and Stone2013; Dudfield & Woods Reference Dudfield and Woods2014), surface uplift (e.g. Pihler-Puzovic et al. Reference Pihler-Puzovic, Illien, Heil and Juel2012; Lister, Peng & Neufeld Reference Lister, Peng and Neufeld2013; Zheng et al. Reference Zheng, Griffiths and Stone2015a
; Hewitt, Neufeld & Balmforth Reference Hewitt, Neufeld and Balmforth2015) and caprock fracturing (e.g. Spence & Sharp Reference Spence and Sharp1985; Lister Reference Lister1990; Savitski & Detournay Reference Savitski and Detournay2002; Gor, Stone & Prevost Reference Gor, Stone and Prevost2013; Lai et al. Reference Lai, Zheng, Dressaire, Wexler and Stone2015, Reference Lai, Zheng, Dressaire and Stone2016; OKeeffe et al. Reference OKeeffe, Huppert and Linden2018), common concerns in groundwater replenishment and waste disposal as well. Real-world scenarios may also display complexities that could make use of different simulation techniques and empirical investigations (e.g. Lenormand, Touboul & Zarcone Reference Lenormand, Touboul and Zarcone1988; Hallez & Magnaudet Reference Hallez and Magnaudet2009).
Monitoring pressure evolution and assessing reservoir injectivity when fluid 1 is injected to displace fluid 2 at a constant rate
 $q$
within a porous layer of infinite length. The porous layer’s thickness, permeability and porosity are denoted by
 $h_0$
,
 $k$
and
 $\phi$
, respectively. The density and viscosity of the fluids are denoted by
 $\rho _1$
,
 $\rho _2$
,
 $\mu _1$
and
 $\mu _2$
, respectively. And we also assume that
 $\rho _1 \gt \rho _2$
for this sketch. The interface shape between fluids 1 and 2 is denoted by
 $h(x,t)$
. The positions of the interface’s leading and trailing fronts are denoted by
 $x_{\!f}(t)$
and
 $x_s(t)$
, respectively. The pressure and velocity are denoted by
 $p(x,y,t)$
and
 $u(x,t)$
, and, in particular, the background pressure at the base
 $(y=0)$
is denoted by
 $p_0(x,t) \equiv p(x,0,t)$
.
 $\boldsymbol g$
is gravitational acceleration.

Despite extensive research activities, there remain phenomena and mechanisms related to fluid injections that current models do not fully explain. For example, field data reveal discrepancies in pressure behaviours, distribution patterns and rates of fluid exchange between different rock layers, highlighting gaps in both theoretical and practical understandings of these processes regarding fluid injections (e.g. Boait et al. Reference Boait, White, Bickle, Chadwick, Neufeld and Huppert2012; Chadwick et al. Reference Chadwick, Williams, Williams and Noy2012; Grude et al. Reference Grude, Landro and Dvorkin2014; Cowton et al. Reference Cowton, Neufeld, White, Bickle, White and Chardwick2016). Obtaining more insights on pressure evolution could be useful. The evolution of the pressure field during fluid injection is an important measure with regard to reservoir injectivity, in addition to the evolution of the frontal location and profile shape of the injecting fluid, all of which impact whether a fluid injection operation can be considered successful. It could also be of use in inverse problems to distil the permeability distribution of sedimentary porous rocks (e.g. Dudfield & Woods Reference Dudfield and Woods2013; Cowton et al. Reference Cowton, Neufeld, White, Bickle, White and Chardwick2016). In this sense, this is similar to the role of pressure monitoring during internal wave propagation (e.g. Linden Reference Linden1975; Grayson, Dalziel & Lawrie Reference Grayson, Dalziel and Lawrie2022) and in acoustic-based sensing and applications (e.g. Peake & Crighton Reference Peake and Crighton1991; Kashinath, Li & Juniper Reference Kashinath, Li and Juniper2018).
In this work, we focus on the pressure evolution within a porous layer and assessing the injectivity during fluid injection into a porous reservoir in the canonic configuration of one-dimensional Cartesian flow (e.g. Huppert & Woods Reference Huppert and Woods1995; Pegler et al. Reference Pegler, Huppert and Neufeld2014; Zheng et al. Reference Zheng, Guo, Christov, Celia and Stone2015b
; Zheng & Neufeld Reference Zheng and Neufeld2019b
), as shown in figure 1. The pressure could be under the influence of many factors, including the fluids’ density and viscosity, the rate of fluid injection, the geometry of the injection site, and the physical properties of the target porous formation. Advancing the understanding of pressure evolution is important for enhancing the effectiveness of the monitoring techniques in practical applications such as geological
 $\textrm {CO}_2$
sequestration and waste disposal. This seems particularly plausible, considering that there exist many abandoned wells in the petroleum industry following the initial exploration stage (e.g. Nordbotten et al. Reference Nordbotten, Kavetski, Celia and Bachu2009; Kang et al. Reference Kang, Christian, Celia, Mauzerall, Bill, Miller, Chen, Conrad, Darrah and Jackson2016). Field measurements could hence address not only the profile shape evolution of the injecting fluids using seismic-based technologies, but also the pressure evolution by allocating pressure sensors at existing or newly drilled well bores.
In terms of modelling concepts, exploring self-similar solutions for appropriately simplified governing systems could possibly provide scalable and consistent descriptions of the pressure field over time and space (e.g. Barenblatt Reference Barenblatt1996; Zheng & Stone Reference Zheng and Stone2022). Such solutions have the potential to simplify the analytical process of a model problem that mimics practical scenarios and better highlight the dominant physical mechanisms that govern the flow behaviour at leading order, which we highlight in the present work.
This paper is structured as follows. In § 2, we introduce a theoretical model to describe the pressure evolution on the basis of a nonlinear partial differential equation that describes the interface shape evolution, and another one that relates pressure and the profile shape. Two dimensionless parameters are identified for the model problem: the viscosity ratio
 $M$
between the injecting and the displaced fluids, which characterises the interface shape, and the relative density difference
 $G$
, which further affects the pressure distribution. We also examine the pressure evolution across four different self-similar regimes at both the early and late times, deriving asymptotic solutions for all regimes. Then in § 3, we describe a series of laboratory experiments that keep track of the time evolution of the profile shape and the fluid pressure at two specific locations during the injection of a gravity current. The experimental measurements are also compared with theoretical predictions, which validates the self-similar solutions obtained for pressure in the unconfined regime. To demonstrate the potential implications, we also provide a comparison between the model predictions and field measurements of the bottom-hole-pressure (BHP) for a geological
 $\textrm {CO}_2$
sequestration project. This work is closed in § 4 with a brief summary and final remarks on reservoir injectivity and potential influence of the hydrodynamic instabilities.
2. Theoretical model
2.1. The governing equation
We consider the displacement process of two viscous fluids upon the injection of one of them into a horizontal and homogeneous porous layer with permeability
 $k$
, porosity
 $\phi$
and finite depth
 $h_0$
, as shown in figure 1. In particular, fluid 1 is being injected to displace ambient fluid 2 at a constant area rate
 $q$
, which initially fills up the pore space of the porous layer. The density and viscosity of the fluids are denoted by
 $\rho _1,\rho _2,\mu _1$
and
 $\mu _2$
, respectively. Assuming that fluids 1 and 2 are immiscible, the interface shape between them is denoted by
 $h(x,t)$
, and the pressure distribution is denoted by
 $p(x,y,t)$
. We also neglect the influence of wetting and interfacial tension within the length and time scales of the model problem. This is the classic model set-up of a series of previous studies with the focus on the interface shape evolution (e.g. Huppert & Woods Reference Huppert and Woods1995; Pegler et al. Reference Pegler, Huppert and Neufeld2014; Zheng et al. Reference Zheng, Guo, Christov, Celia and Stone2015b
), and our discussion on pressure evolution in the present work is based on these previous efforts.
When the length of the current is much greater than its thickness, the theory of lubricating flow indicates that the vertical velocity
 $v$
of the current is much smaller than the horizontal velocity
 $u$
, and hence the flow in the porous layer is one-dimensional at leading order. In this case, the pressure takes the hydrostatic distribution within the domain. If we denote the background pressure along the base
 $(y=0)$
of the horizontal porous layer as
 $p_0(x,t)$
, hydrostatic pressure distribution then indicates that pressure
 $p(x,y,t)$
is given by
 \begin{equation} p(x,y,t) = \begin{cases} p_0(x,t)-\rho _1 gy, &0\leqslant x \lt x_s(t),\ 0 \leqslant y \lt h_0,\\ p_0(x,t)-\rho _1 gy, &x_s(t)\leqslant x \lt x_{\!f}(t),\ 0\leqslant y \lt h,\\ p_0(x,t)-\rho _1 gh-\rho _2 g(y-h), &x_s(t)\leqslant x \lt x_{\!f}(t), \ h\leqslant y \leqslant h_0,\\ p_0(x,t)-\rho _2 gy, &x \geqslant x_{\!f}(t),\ 0\leqslant y \leqslant h_0, \end{cases} \end{equation}
where
 $x_{\!f}(t)$
and
 $x_s(t)$
denote the leading and (possibly) trailing fronts of the fluid–fluid interface
 $h(x,t)$
, respectively, as defined by
 $h(x_{\!f}(t),t)=0$
and
 $h(x_s(t),t)=h_0$
.
Previous studies indicate that the background pressure gradient
 $\partial p_0/\partial x$
is under the influence of both fluid injection and buoyancy, as given by
 \begin{equation} \frac {\partial p_0}{\partial x} = -\frac {\mu _1 \mu _2 q}{\mu _2 kh + \mu _1 k(h_0-h)} + \frac {\mu _1 \Delta \rho gk (h_0-h)}{\mu _2 kh + \mu _1 k(h_0-h)} \frac {\partial h}{\partial x}, \end{equation}
where
 $\Delta \rho \equiv \rho _1-\rho _2\gt 0$
. The first term on the right-hand side of (2.2) represents the influence of fluid injection and is proportional to the injection rate
 $q$
, while the second term on the right-hand side of (2.2) represents the influence of buoyancy-driven flow and is proportional to the density difference
 $\Delta \rho$
and the local slope of the fluid–fluid interface
 $\partial h/\partial x$
. Upon integration of solution (2.2) in
 $x$
, we arrive at an expression for the evolution of the background pressure
 $p_0(x,t)$
at any downstream location
 $x$
of interest:
 \begin{equation} p_0(x,t) = p_0(0,t) -\int _0^x \left [\frac {\mu _1 \mu _2 q}{\mu _2 kh + \mu _1 k(h_0-h)} - \frac {\mu _1 \Delta \rho gk (h_0-h)}{\mu _2 kh + \mu _1 k(h_0-h)} \frac {\partial h}{\partial \hat {x}}\right ] \mathrm{d} \hat {x}, \end{equation}
where
 $p_0(0,t)$
denotes pressure evolution at the source
 $(x=0)$
, the location of the well bore. The value of
 $p_0(0,t)$
is typically related to the weight of the fluid in the pore space between its location and the ground surface, and hence
 $p_0(0,t)$
could be time independent at leading order. In fact, it is more convenient to discuss the background pressure drop measured from its source value, defined as
 $\Delta p_0(x,t) \equiv p_0(0,t)-p_0(x,t)$
, which we employ later in the present work. In particular, it is seen that solution (2.3) for
 $p_0(x,t)$
depends explicitly on the profile shape evolution
 $h(x,t)$
, which has been studied before and we review briefly in Appendix A for completeness of the description.
2.2. Non-dimensionlisation
It is standard to study the model problem in the dimensionless space. Choosing
 $t_c \equiv \Delta \rho gk \phi h_0^3 / (\mu _1 q^2)$
and
 $x_c \equiv \Delta \rho gkh_0^2 / (\mu _1 q)$
as the characteristic time and length scales, respectively, we define dimensionless time
 $T \equiv t/t_c$
, length
 $X \equiv x/x_c$
and thickness
 $H \equiv h/h_0$
. Physically,
 $t_c$
and
 $x_c$
arise due to the competition between buoyancy and injection forces, and
 $h_0$
is simply the thickness of the porous layer. The scales are chosen such that at
 $t = t_c$
the front locates at
 $x_{\!f} \approx x_c$
for moderate values of
 $M$
, and with this specific set of scales, the prefactors of the dimensionless partial differential equations (PDEs) and initial and boundary conditions (IBCs) become one (see also Appendix A).
Notice again that the focus of the present work is on pressure. If we choose
 $p_c \equiv \Delta \rho gh_0$
, a hydrostatic pressure head, as the characteristic pressure, the dimensionless background pressure drop
 $\Delta P_0(X,T)$
along the base of the porous layer can be obtained as
 \begin{align} \Delta P_0(X,T)\equiv P_0(0,T)-P_0(X,T) = \int _0^X \left [\frac {M}{1 + (M-1) H} - \frac {1-H}{1 + (M-1) H} \frac {\partial H}{\partial \hat {X}} \right ]\mathrm{d}\hat {X}. \end{align}
Since fluids always move in the direction of pressure decrease for pressure-driven flows, the definition
 $\Delta P_0(X,T) \equiv P_0(0,T)-P(X,T)$
ensures that
 $\Delta P_0(X,T)$
is non-negative. We can also define dimensionless pressure drop
 $\Delta P(X,Y,T) \equiv P_0(0,T)-P(X,Y,T) \geqslant 0$
and obtain
 \begin{equation} \Delta P(X,Y,T) \equiv P_0(0,T)-P(X,Y,T) = \Delta P_0(X,T)+\frac {Y}{G}+(H-Y)\mathcal{H}(Y-H), \end{equation}
for
 $X\geqslant 0$
and
 $0\leqslant Y\leqslant 1$
, where the Heaviside step function in solution (2.5) is defined as
 \begin{equation} \mathcal{H}(z) =\left \{ \begin{aligned} &0,&z\lt 0,\\ &1,&z\geqslant 0. \end{aligned} \right . \end{equation}
A second dimensionless parameter
 $G \equiv \Delta \rho /\rho _1$
is recognised in (2.5) for the distribution of pressure, which measures the relative strength of buoyancy compared with the density of the injecting fluid 1. The definition and physical meaning of the dimensionless parameters
 $M$
and
 $G$
are summarised also in table 1.
Definition and physical meaning of the two dimensionless parameters
 $M$
and
 $G$
that impact the pressure distribution within a porous layer of finite depth during fluid injections.

Early-time self-similar behaviour of the background pressure drop
 $\Delta P_0(X,T)$
at different times and at different monitoring locations when
 $T \ll 1$
, with
 $M=2$
as an example: (a) numerical solutions of (2.4) at
 $T=\{0.2,0.4,0.6,0.8,1\}\times 10^{-6}$
; (b) numerical solutions of (2.4) at specified monitoring locations
 $X=\{0.3,0.6,0.9,1.2,1.5\}\times 10^{-4}$
to assess reservoir injectivity; (c) the rescaled numerical solutions for pressure in (a) and (b) collapse onto the self-similar solution (2.7). The circles ‘
 $\circ$
’ in the figure represent the leading front of the injecting fluid.

We are then ready to explore solutions for the interface evolution
 $H(X,T)$
based on PDE (A3), and hence the pressure evolution
 $\Delta P_0(X,T)$
and
 $\Delta P(X,Y,T)$
based on solutions (2.4) and (2.5), respectively. Representative numerical solutions for the evolution of the background pressure drop
 $\Delta P_0(X,T)$
are shown in figure 2 at early times and figures 3, 4 and 5 at late times, imposing
 $M=\{1/2,1,2\}$
to illustrate three branches of different late-time behaviours. These solutions are based on numerical solutions of PDE (A3) for the profile shape evolution
 $H(X,T)$
, which feed into the integral (2.4) for the background pressure drop
 $\Delta P_0(X,T)$
. Here we employ the same finite-volume scheme used in our previous studies dealing with the same or similar advective–diffusive systems (e.g. Zheng et al. Reference Zheng, Guo, Christov, Celia and Stone2015b
). Once
 $\Delta P_0(X,T)$
becomes available, we can also obtain the pressure distribution
 $\Delta P(X,Y,T)$
within the entire two-dimensional domain based on (2.5), as shown in figures 6 and 7. Later in § 2.3, we further explore self-similar behaviours of the background pressure drop
 $\Delta P_0(X,T)$
based on different self-similar branches of the interface shape evolution
 $H(X,T)$
, as governed by (A3) subject to (A4).
Late-time self-similar behaviour of the background pressure drop
 $\Delta P_0(X,T)$
at different times and monitoring locations, with
 $M=2$
as an example: (a) Numerical solutions of (2.4) at
 $T=\{20,40,60,80,100\}$
; (b) Numerical solutions of (2.4) at specified monitoring locations at
 $X=\{40,80\}$
to assess reservoir injectivity; (c) The rescaled numerical solutions for pressure in (a) and (b) collapse onto the self-similar solution (2.9). The symbols ‘
 $\circ$
’ and ‘
 $\times$
’ in (a) and (b) represent the leading and the trailing fronts of the injecting fluid, respectively.

Late-time self-similar behaviour of the background pressure drop
 $\Delta P_0(X,T)$
at different times and monitoring locations when
 $M=1$
: (a) numerical solutions of (2.4) at
 $T=\{20,40,60,80,100\}$
; (b) numerical solutions of (2.4) at specified monitoring locations at
 $X=\{24, 48, 72, 96\}$
to assess reservoir injectivity; (c) the rescaled numerical solutions for pressure in (a) and (b) collapse onto the self-similar solution (2.11). The symbols ‘
 $\circ$
’ and ‘
 $\times$
’ in (a) and (b) represent the leading and trailing fronts of the injecting fluid, respectively. Here
 $\zeta_f \equiv X_f/T$
and
 $\zeta_s \equiv X_s/T$
represent the frontal locations in the similarity space.

Late-time self-similar behaviour of the background pressure drop
 $\Delta P_0(X,T)$
at different times and monitoring locations, with
 $M=1/2$
as an example: (a) numerical solutions of (2.4) at
 $T=\{20,40,60,80,100\}$
; (b) numerical solutions of (2.4) at specified monitoring locations at
 $X=\{24, 48, 72, 96\}$
to assess reservoir injectivity; (c) the rescaled numerical solutions in (a) and (b) collapse onto the self-similar solution (2.11). The symbols ‘
 $\circ$
’ and ‘
 $\times$
’ in (a) and (b) represent the leading and trailing front of the injecting fluid, respectively.

2.3. Asymptotic solutions
As mentioned before, four different self-similar regimes have been identified following a series of previous studies on the interface shape evolution during fluid injections (e.g. for consistency of notations, see Zheng et al. Reference Zheng, Guo, Christov, Celia and Stone2015b ). Exploring self-similar asymptotes is an interesting fundamental topic of fluid mechanics, which could also be used to validate numerical solutions in the corresponding asymptotic regimes (e.g. Barenblatt Reference Barenblatt1996).
In this section, we focus on describing the pressure evolution and assessing the reservoir injectivity within each of these self-similar regimes, and we find that the background pressure drop
 $\Delta P_0(X,T)$
along the base
 $Y=0$
also admits self-similar behaviours in each of these regime. Here we first derive the self-similar solution for
 $\Delta P_0(X,T)$
at early times (
 $T \ll 1$
), which is followed by the presentation of three different branches of self-similar solutions for
 $\Delta P_0(X,T)$
at late times (
 $T \gg 1$
), depending on the viscosity ratio
 $M$
. In all cases, the self-similar solutions obtained are verified based on a comparison with numerical solutions of the original time-dependent PDE system (A3). Analytical solutions for the pressure field
 $P(X,Y,T)$
are also presented in each of these regimes.
2.3.1. Early-time self-similar behaviour (
 $T \ll 1$
)

Substituting solution (A5) for the profile shape evolution into (2.4) allows us to determine the early-time background pressure drop
 $\Delta P_0(X,T)$
, along
 $Y=0$
, which can also be rearranged to provide a self-similar form:
 \begin{equation} \left (\Delta P_0-M X\right ) T^{-\frac {1}{3}} s_{\!f}^{-2} = \left \{ \begin{aligned} &\frac {25}{48} s+\frac {1}{16} s^2+\frac {1}{144} s^3, & 0 \leqslant s \lt 1, \\[3pt] &\frac {85}{144}, & s \geqslant 1. \end{aligned} \right . \end{equation}
where the similarity variable
 $s$
is defined as
 $s \equiv s_f^{-1} X T^{-2/3}$
, with a frontal parameter of
 $s_f = (192/59)^{1/3} \approx 1.48$
. Furthermore, by substituting solution (A5) into (2.5), we obtain the pressure distribution
 $\Delta P(X,Y,T)$
across the thickness of the porous layer:
 \begin{equation} \Delta P= \left \{ \begin{aligned} &MX + \frac {25 s_{\!f} X}{48 T^{\frac {1}{3}}} + \frac {X^2}{16 T} + \frac {X^3}{144 s_{\!f} T^{\frac {5}{3}}} + \frac {Y}{G}, & 0 \leqslant X \lt s_{\!f} T^{\frac {2}{3}},\ 0\leqslant Y \leqslant H, \\ &M X + \frac {85 s_{\!f}^2 T^{\frac {1}{3}}}{144} - Y + \frac {Y}{G}, & 0 \leqslant X \lt s_{\!f} T^{\frac {2}{3}},\ H\leqslant Y \leqslant 1, \\ &M X + \frac {85 s_{\!f}^2 T^{\frac {1}{3}}}{144} - Y + \frac {Y}{G}, & X \geqslant s_{\!f} T^{\frac {2}{3}},\ 0\leqslant Y \leqslant 1. \end{aligned} \right . \end{equation}
Figure 2 illustrates the evolution of the background pressure
 $\Delta P_0(X,T)$
at different times and/or monitoring locations, imposing
 $M=2$
as an example. In figure 2(a), the dashed curves, distinguished by their colour, represent the spatial distribution of
 $\Delta P_0(X,T)$
at five different times
 $T=\{0.2,0.4,0.6,0.8,1\}\times 10^{-6}$
. In all cases,
 $\Delta P_0(X,T)$
increases with
 $X$
, indicating pressure loss along the flow direction due to viscous forces. Also, in all cases
 $\Delta P_0(X,T)$
exhibits a much greater rate of increase for
 $X \lt X_{\!f}(T)$
(the left-hand side of the symbols ‘
 $\circ$
’), compared with that for
 $X \gt X_{\!f}(T)$
(the right-hand side of the symbols ‘
 $\circ$
’) where
 $X_f(T)$
represents the frontal location. In figure 2(b), the dashed curves, again distinguished by colour, illustrate the temporal evolution of
 $\Delta P_0(X,T)$
at five different monitoring locations
 $X=\{0.3,0.6,0.9,1.2,1.5\}\times 10^{-4}$
. Figure 2(b) also reveals an initial increase of
 $\Delta P_0(X,T)$
with time before the arrival of the injecting fluid’s front at the monitoring location (the left-hand side of the symbols ‘
 $\circ$
’), and in contrast,
 $\Delta P_0(X,T)$
starts to decrease once the front of the injecting fluid arrives at and passes through the monitoring location (right-hand side of the symbols ‘
 $\circ$
’). Finally, we note that the solution curves in figure 2(a,b) can be rescaled to collapse onto a universal curve, shown in figure 2(c), which is consistent with prediction of the early-time self-similar solution (2.7). In particular, the collapsed profile shapes also agree reasonably well with solution (2.7).
2.3.2. Late-time self-similar behaviours (
$T\gg 1$
)

We then discuss the three branches of self-similar behaviours for the pressure field evolution at late times, as defined by
 $T \gg 1$
, depending on the viscosity ratio
 $M$
between the injecting and the ambient fluids. These regimes correspond exactly to the three self-similar branches for the late-time profile shape evolution: (i) the rarefaction solution when the injecting fluid is less viscous than the ambient fluid (
 $M\gt 1$
); (ii) the self-similar solution when the injecting and ambient fluids are equally viscous (
 $M=1$
); and (iii) the self-similar solution when the injecting fluid is more viscous (
 $M\lt 1$
).
(i) When the injecting fluid is less viscous
 $(M\gt 1)$
By substituting the rarefaction solution (A6) for the profile shape into (2.4), we then arrive at a self-similar solution for the background pressure drop
 $\Delta P_0(X,T)$
as
 \begin{equation} (\Delta P_0-X)T^{-1}= \left \{ \begin{aligned} &0, & \xi \lt \xi _s, \\ &-\xi +\frac {1}{3M}+\frac {2}{3}\xi \sqrt {M\xi }, &\xi _s \leqslant \xi \lt \xi _{\!f}, \\ &(M-1)\xi - \frac {M^2}{3} + \frac {1}{3M}, &\xi \geqslant \xi _{\!f}, \end{aligned} \right . \end{equation}
at late times, where
 $\xi \equiv X/T$
is the similarity variable, and
 $\xi_f \equiv X_f/T$
and
 $\xi_s \equiv X_s/T$
represent the frontal locations in the similarity space. Furthermore, by substituting solution (2.9) into (2.5), we obtain an analytical solution for pressure
 $\Delta P(X,Y,T)$
:
 \begin{equation} \Delta P= \left \{ \begin{aligned} &X + \frac {Y}{G}, & X \lt \frac {T}{M},\ 0\leqslant Y \leqslant 1, \\ &\frac {T}{3M} + \frac {2X}{3}\sqrt {\frac {MX}{T}} + \frac {Y}{G}, &\frac {T}{M} \leqslant X \lt MT,\ 0\leqslant Y \leqslant H, \\ &\frac {T}{3M} + \frac {2X}{3}\sqrt {\frac {MX}{T}} + H - Y + \frac {Y}{G}, &\frac {T}{M} \leqslant X \lt MT,\ H \leqslant Y \leqslant 1,\\ &MX - \frac {M^2 T}{3} + \frac {T}{3M} - Y + \frac {Y}{G}, &X \geqslant MT,\ 0 \leqslant Y \leqslant 1, \end{aligned} \right . \end{equation}
covering the entire domain of the porous layer.
Figure 3 shows this branch of late-time self-similar behaviour for the background pressure drop
 $\Delta P_0(X,T)$
at different times and/or monitoring locations, imposing
 $M=2$
as an example. In particular, figure 3(a) depicts the spatial distribution of
 $\Delta P_0(X,T)$
at a series of times
 $T=\{20,40,60,80,100\}$
. It is shown that the background pressure drop
 $\Delta P_0(X,T)$
increases with
 $X$
, indicating pressure loss along the direction of viscous flow. In contrast,
 $\Delta P_0(X,T)$
decreases with time, indicating that the less viscous region of the injecting fluid covers a greater fraction of the domain. Furthermore, figure 3(b) illustrates the temporal evolution of
 $\Delta P_0(X,T)$
at two representative monitoring locations at
 $X=\{40,80\}$
to assess the reservoir injectivity. Here, it is observed that
 $\Delta P_0(X,T)$
decreases linearly with time at each monitoring location until the leading front
 $X_{\!f}(T)$
(denoted by the symbols ‘
 $\circ$
’) of the injecting fluid 1 arrives at the specific location of monitoring. Thereafter, the rate of increase of
 $\Delta P_0(X,T)$
slows down before the trailing front
 $X_s(T)$
(represented by the symbols ‘
 $\times$
’) arrives. Finally, once the trailing front
 $X_s(T)$
has arrived at the monitoring location,
 $\Delta P_0(X,T)$
becomes a constant, indicating no more variation of viscous pressure drop. The different solutions curves in figure 3(a,b) can also be rescaled to collapse onto a universal curve in the self-similar space
 $(\xi =X/T,(X-\Delta P_0)/T)$
, as shown in figure 3(c), which agrees also reasonably well with the self-similar solution (2.9).
(ii) Equal-viscosity displacement
 $(M=1)$
By substituting solution (A7) for the profile shape evolution into (2.4), we obtain also a self-similar solution for the background pressure drop
 $\Delta P_0(X,T)$
along the base (
 $Y=0$
) as
 \begin{equation} \Delta P_0-X= \left \{ \begin{aligned} &0, & \zeta \lt -1, \\ &\frac {1}{8}+\frac {1}{4}\zeta +\frac {1}{8}\zeta ^2, &-1 \leqslant \zeta \lt 1, \\ &\frac {1}{2}, &\zeta \geqslant 1. \end{aligned} \right . \end{equation}
where
 $\zeta \equiv (X-T)/T^{1/2}$
is the similarity variable. The pressure distribution
 $\Delta P(X,Y,T)$
can also be obtained by combining solution (2.5) and (2.11):
 \begin{equation} \Delta P= \!\left \{\! \begin{aligned} &X + \frac {Y}{G}, & 0 \leqslant X\! \lt T-\sqrt {T},0 \leqslant Y \leqslant 1, \\ &\frac {1}{8}+X+\frac {X-T}{4\sqrt {T}}+\frac {(X-T)^2}{8T}+\frac {Y}{G}, &T-\sqrt {T} \leqslant X\! \lt T+\sqrt {T}, 0\leqslant Y \lt H, \\ &\frac {5}{8}+X-\frac {X-T}{4\sqrt {T}}+\frac {(X-T)^2}{8T}-Y+\frac {Y}{G}, &T-\sqrt {T} \leqslant X\! \lt T+\sqrt {T}, H \leqslant Y \leqslant 1, \\ &\frac {1}{2} + X - Y +\frac {Y}{G}, &X \geqslant T+\sqrt {T}, 0\leqslant Y \leqslant 1, \end{aligned} \right . \end{equation}
which covers the entire domain of the porous layer.
This branch of late-time self-similar behaviour for the background pressure drop
 $\Delta P_0(X,T)$
is illustrated in figure 4, imposing
 $M = 1$
. In particular, in figure 4(a), the dashed curves represent the spatial evolution of
 $\Delta P_0(X,T)$
at five different times
 $T=\{20,40,60,80,100\}$
. We observe that
 $\Delta P_0(X,T)$
increases linearly except between the leading and training fronts (
 $X_s(T) \lt X\lt X_{\!f}(T)$
), where the shape of the pressure profiles can be described by quadratic functions. Figure 4(b) illustrates the temporal evolution of
 $\Delta P_0(X,T)$
at four different monitoring locations
 $X=\{24,48,72,96\}$
as a quantitative assessment of the reservoir injectivity. The pressure
 $\Delta P_0(X,T)$
remains constant before the arrival of the leading front
 $X_{\!f}(T)$
of the injecting fluid, which evolves towards another constant after the arrival of the trailing front
 $X_s(T)$
. Between the leading and the trailing fronts (
 $X_s(T) \lt X\lt X_{\!f}(T)$
),
 $\Delta P_0(X,T)$
experiences a modest decrease as highlighted in the inset. Finally, the different solution curves in figure 4(a,b) can be rescaled appropriately to collapse onto a universal curve in the self-similar space
 $(\zeta =(X-T)T^{-1/2},\Delta P_0-X)$
, as shown in figure 4(c), which also agrees well with the prediction of self-similar solution (2.11).
(iii) When the injecting fluid is more viscous
 $(M\lt 1)$
By substituting solution (A8) for the profile shape evolution into (2.4), we obtain a self-similar solution for the background pressure drop
 $\Delta P_0(X,T)$
along
 $Y=0$
as
 \begin{equation} X-\Delta P_0= \left \{ \begin{aligned} &0, & \eta \lt \eta _{\!f}, \\ &-\frac {1}{2}+(1-M)\eta , &\eta \geqslant \eta _{\!f}. \end{aligned} \right . \end{equation}
where
 $\eta \equiv X-T$
is the similarity variable, and
 $\eta_f \equiv X_f - T$
represents the frontal location in the similarity space. Furthermore, substituting solution (A8) into (2.5) leads to the pressure distribution
 $\Delta P(X,Y,T)$
within the entire domain as
 \begin{equation} \Delta P= \left \{ \begin{aligned} &X + \frac {Y}{G}, & 0\leqslant X \lt T-\eta _{\!f},\ 0\leqslant Y \leqslant 1, \\ &X + \frac {Y}{G}, &T-\eta _{\!f} \leqslant X \lt T+\eta _{\!f},\ 0\leqslant Y \lt H, \\ &\frac {1}{2} + X - (1-M)(X-T)-Y+\frac {Y}{G}, &T-\eta _{\!f} \leqslant X \lt T+\eta _{\!f},\ H \leqslant Y \leqslant 1, \\ &\frac {1}{2} + T + M(X-T) - Y +\frac {Y}{G}, &X \geqslant T+\eta _{\!f},\ 0\leqslant Y \leqslant 1. \end{aligned} \right . \end{equation}
Figure 5 illustrates the spatial and temporal evolution of the background pressure drop
 $\Delta P_0(X,T)$
in this regime, imposing
 $M=1/2$
as an example. In particular, figure 5(a) depicts the spatial profile of
 $\Delta P_0(X,T)$
at a series of times
 $T=\{20,40,60,80,100\}$
. It is observed that the background pressure drop
 $\Delta P_0(X,T)$
increases linearly at both sides of the leading front
 $X=X_{\!f}(T)$
, where the rate of increase changes. In figure 5(b), meanwhile, we show the temporal evolution of
 $\Delta P_0(X,T)$
at four monitoring locations
 $X=\{24,48,72,96\}$
to assess the injectivity. In particular,
 $\Delta P_0(X,T)$
increases linearly before the arrival of the leading front
 $X_{\!f}(T)$
of the injecting fluid, but once
 $X_{\!f}(T)$
passes through,
 $\Delta P_0(X,T)$
becomes a constant. Finally, the different curves in figure 5(a,b) can also be rescaled appropriately to collapse onto a universal curve in the self-similar space
 $(\eta \equiv X-T,X-\Delta P_0)$
, as shown in figure 5(c). It is of interest to note that here the self-similar solution for
 $\Delta P_0(X,T)$
is not under the influence of the arrival of the trailing front
 $X_s(T)$
, which is different from that in regimes (i) and (ii).
2.3.3. Pressure distribution and isobars
The discussions mainly focus on the background pressure drop
 $\Delta P_0(X,T)$
along the base
 $Y=0$
, for which we have identified an early-time unconfined self-similar solution, together with three different branches of late-time confined self-similar solutions, depending on the viscosity ratio
 $M$
. This is analogous to the interface shape evolution, as recognised before. These solutions provide good insights on the injectivity of the reservoirs subject to constant rate of fluid injection. Here we provide brief comments on the pressure distribution
 $\Delta P(X,Y,T)$
within the entire two-dimensional domain, based on the obtained solutions
 $\Delta P_0(X,T)$
along
 $Y=0$
.
The pressure distribution
 $\Delta P(X,Y,T)$
at two representative times based on the early- and late-time analytical solutions: (a,b) early-time analytical solution (2.8) for pressure at
 $T=\{3.5,6.5\}\times 10^{-4}$
with
 $M=2$
as an example; (c,d) late-time analytical solution (2.10) at
 $T=\{33,66\}$
with
 $M=2$
as an example; (e,f) late-time analytical solution (2.12) at
 $T=\{66,133\}$
when
 $M=1$
; (g,h) late-time analytical solution (2.4) at
 $T=\{66,133\}$
with
 $M=1/2$
as an example. The imposed parameter is
 $G=1/100$
and the black dashed curves represent the self-similar interface shapes
 $H(X,T)$
in each corresponding case.

As an example, we include an additional figure 6 for
 $\Delta P(X,Y,T)$
based on analytical solutions (2.8), (2.10), (2.12) and (2.14), which are further obtained based on the early-time and late-time analytical solutions for
 $\Delta P_0(X,T)$
along
 $Y=0$
. Unlike
 $\Delta P_0$
, which are self-similar in the corresponding time limits, it is reasonable to show
 $\Delta P$
at different representative times to illustrate its evolution. We also include the self-similar interface shapes
 $H(X,T)$
in each corresponding case in figure 6, shown as the black dashed curves. In particular, figure 6(a,b) demonstrate the distribution of
 $\Delta P$
at two representative early times, and it is seen that
 $\Delta P$
is almost hydrostatic and varies predominantly in the vertical direction. Figure 6(c–h) further show the distribution of
 $\Delta P$
for
 $M\gt 1$
,
 $M=1$
and
 $M\lt 1$
, respectively, at two representative late times when the interface attaches to both the top and bottom boundaries of the porous layer. It is seen that there exists significant horizontal variations now due to the influence of the background pressure from fluid injections, which is fundamentally different from the early-time solutions with primarily vertical variations in figure 6(a,b).
The isobars within the domain at two representative times based on the early- and late-time analytical solutions: (a,b) early-time analytical solution (2.8) for pressure at
 $T=5\times 10^{-4}$
with
 $M=2$
as an example; (c,d) late-time analytical solution (2.10) at
 $T=80$
with
 $M=2$
as an example; (e,f) late-time analytical solutions (2.12) at
 $T=100$
when
 $M=1$
; (g,h) late-time analytical solution (2.4) at
 $T=100$
with
 $M=1/2$
as an example. The dimensionless parameter
 $G$
is
 $1/1000$
in (a,c,e,g) and
 $1/10$
in (b,d,f,h). The coloured solid curves represent isobars
 $Y_i(X,T)$
and the black dashed curves represent the self-similar interface shapes
 $H(X,T)$
in each corresponding case.

Additional insights can also be obtained by studying the isobars within the domain, as shown in figure 7, based on analytical solutions (2.8), (2.10), (2.12) and (2.14). Again the profile shape of the fluid–fluid interface is also included as the dashed curves. One interesting feature of the isobar plots is that the influence of the fluid–fluid interface is clearly demonstrated: it can be seen that a sudden change in slope could appear in the isobars moving across a fluid–fluid interface. Such information could also be of use to explain key observations of pressure evolution from field measurements.
3. Experimental and field observations
3.1. Experimental observations
We have also performed laboratory experiments to obtain leading-order insights of the one-dimensional model, which applies when the aspect ratio of the current is a small parameter. Here we provide brief descriptions simply to demonstrate the typical phenomenon of fluid displacement processes in a porous layer and in particular its time evolution. Typical experimental observations are shown in figure 8 when we inject salt water at a constant volumetric rate
 $Q_{inj} \approx 200$
ml min−1 to displace fresh water in a vertically placed Hele-Shaw cell of length
 $L = 150$
cm, depth
 $h_0 = 10$
cm and width
 $w = 3.0$
cm. The Hele-Shaw cell is made from transparent acrylic plates and is also filled with spherical glass beads of radius
 $r \approx 1.0$
mm. We have tried to ensure close packing of the beads with the help of a vibrating table. For this set-up, the typical value of the porosity measured is
 $\phi \approx 0.39{-}0.40$
, which is slightly higher than the theoretical estimate of
 $\phi \approx 0.36$
for close packing. The permeability can also be estimated as
 $ k = r^2 \phi^{3}/ (45(1 - \phi)^2) \approx 3.5{-}4.0 \times 10^{-9}$
m
 $^2$
based on the Kozeny–Carman formula. The concentration of salt is 20 % by weight for the salt water, and its density is
 $\rho _1 \approx 1.15$
g ml−1 (measured). Its viscosity is approximately 1.5–1.6 times that of fresh water at room temperature, reading from standard tables for saline water. The fresh water is coloured with food-based green dye (McCormick) for visualisation use. For this experiment, we have also imposed
 $t_c \approx 94{-}110$
s and
 $x_c \approx 0.27{-}0.31$
m that correspond to
 $\phi = 0.39{-}0.40$
, imposing a viscosity of
 $\mu _1 \approx 0.83$
mPa s for fresh water and
 $\mu _2 \approx 1.33$
mPa s for salt water.
Typical experimental observations during fluid injection into a porous layer of finite depth. In this experiment, salt water is injected to displace fresh water that is coloured with green dye in a packed-bead Hele-Shaw cell of length
 $L = 150$
cm, depth
 $h_0 = 10$
cm and width
 $w = 3.0$
cm. The radius of the spherical glass beads is
 $r \approx 1.0$
mm. The volumetric rate of fluid injection is
 $Q_{{inj}} \approx 200$
ml min−1. Typical numerical simulation results at dimensionless time
 $T \approx 0.55\times \{1,3,5\}$
, imposing
 $M^{-1}=1.6$
are plotted as the dashed curves. Here we have imposed
 $x_c = 0.30$
m and
 $t_c = 100$
s for the theoretical predictions.

A digital camera (Nikon D850) is used to record the displacement process, which allows us to extract pictures for the interface shape of the fresh and salt water at different times of interest. This experiment illustrates that the propagation of the gravity current of salt water indeed evolves from unconfined to confined flow patterns as time progresses. Here fluid injection starts at
 $t = 0$
min, and we observe that at
 $t = 1$
min the interface attaches only to the bottom boundary, taking the shape of an unconfined gravity current, while at
 $t = \{3,5\}$
min the interface attaches to both the top and the bottom boundaries as approximately a straight line. These observations are consistent with the theoretical predictions from solving PDE (A3) subject to IBCs (A4), included also in figure 8 for dimensionless time
 $T \approx 0.55\times \{1,3,5\}$
, imposing
 $M^{-1}=1.6$
. But the agreement is less good than that reported in figure 13 of Pegler et al. (Reference Pegler, Huppert and Neufeld2014), using golden syrup (which is much more viscous than water) as the injecting fluid and fresh water as the ambient fluid. The under-prediction for the frontal location along the top boundary is possibly due to measurement uncertainties, local heterogeneity and boundary effects (e.g. there could be a high permeability channel along the ceiling of the Hele-Shaw cell). A major take-away message of this model experiment is that we should indeed consider the distinct early-time and late-time behaviours of the interface shape evolution and hence the pressure field evolution, as discussed in § 2.3.
We did not install any pressure sensors in this experiment to measure the pressure evolution at specific locations. Nevertheless, we next discuss in § 3.2 experimental observations in another Hele-Shaw cell of much smaller gap thickness (
 $d \approx 3.0$
mm) and without packed beads, where we were able to install a couple of pressure sensors at two distinct locations along the base of the Hele-Shaw cell. Time evolution of the measured pressure was then rescaled appropriately and compared with theoretical predictions of the model. Furthermore, we discuss in § 3.3 field observations of the BHP evolution at a specific monitoring location in a geological
 $\textrm {CO}_2$
sequestration project that injects more than half a million tons of
 $\textrm {CO}_2$
into a saline aquifer that is some 2.6 km underneath the ground surface. We also attempted a comparison between the field data and the theoretical predictions of the present model.
3.2. Pressure measurement
To track the pressure evolution during an experiment, we made another Hele-Shaw cell of much smaller gap thickness of
 $d \approx 3.0$
mm, height
 $h_0 \approx 5.0$
cm and length
 $L \approx 176$
cm, now without packed beads between the two transparent parallel plates. The cell is placed vertically, and we were able to install a couple of pressure sensors (TeMaiLong CEIP65, S/N 2025040141) at two distinct locations (
 $x_0 \approx \{58,118\}$
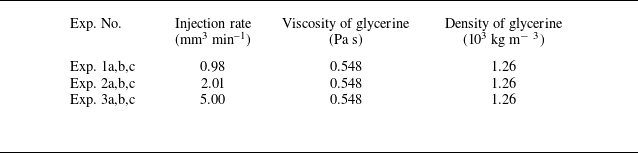
cm downstream of the injection point) along the horizontal substrate, as shown in figure 9. A series of gravity current injection experiments were then performed, using glycerine as the working fluid, coloured with food dye (McCormick Assorted), which was injected at different injection rates in a series of new experiments focusing on pressure measurements. In total we performed eight experiments in this set-up, and the experimental parameters are summarised in table 2, including the density, viscosity and injection rate of glycerine for each experiment. The viscosity is measured using a viscometer (SUNLEX, S/N 00000222) at room temperature, and the density of glycerine is also measured using a glass hydrometer. The injection rate is read directly from the pump. In addition, in all experiments, the viscosity and density of air are imposed as
 $\mu _2 = 1.8 \times 10^{-5}$
Pa s and
 $\rho _2 = 1.2$
kg m−3, respectively, based on standard tables at 20
 $^\circ$
C. We also use
 $g = 9.8$
m s−2 for gravitational acceleration.
Experimental parameters of gravity current injection into a vertically placed Hele-Shaw cell of gap thickness
 $d \approx 3.0$
mm. Glycerine was injected as the working fluid, which displaces air. Time evolution of the pressure was measured at two distinct locations along the substrate of the cell. The viscosity and density were measured for glycerine in each experiment, so as the injection rate.

The experimental set-up of viscous gravity current injection into a vertically-placed Hele-Shaw cell, with two pressure sensors installed along the substrate of the cell, locating at
 $x_0 \approx \{58,118\}$
cm away from the injection point.

(a) Time evolution of the measured pressure values at the pressure sensors located at
 $x_0 \approx \{58,118\}$
cm away from the injection point. Expt. 2a,b,cR indicate pressure data from the second sensor at
 $x_0 \approx 118$
cm, while the others indicate pressure data from the first sensor at
 $x_0 \approx 58$
cm. (b) The rescaled and collapsed data points of the measured pressure values in different experiments, along with a comparison with the theoretical prediction (2.7) in the unconfined regime.

(a) Time evolution of the frontal location as recorded in the experiments, and (b) the rescaled and collapsed data points, along with a comparison with the theoretical prediction
 $X_{\!f} \sim 1.48\, T^{2/3}$
in the unconfined regime, shown as the solid line.

During each experiment, we can read the pressure values at the monitoring locations directly from the pressure sensors. But we must also subtract the base values before the current’s front arrives at the location of the sensors to obtain the pressure values along the substrate of the Hele-Shaw cell that we are interested in. We then include the experimentally recorded time evolution of the pressure values by the first sensor, which is located at
 $x_0 \approx 58$
cm away from the injection point, in all performed experiments in figure 10(a). For experiment 2, we also include the pressure values from the second sensor which is located at
 $x_0 \approx 118$
cm away from the injection point. The measurement error for the pressure sensor is
 $\pm 4$
Pa and that for time is less than
 $\pm 1$
s. Both of them are well represented by the size of the symbols, so we did not include additional error bars here. The raw experimental data are also rescaled based on how the theoretical model is non-dimensionalised, and exhibits a very good collapse onto a universal curve, as shown in figure 10(b). The theoretical prediction (2.7) in the unconfined regime is then plotted in the same figure 10(b), and exhibits reasonable agreement with the rescaled experimental data at intermediate times. We must also note that we have imposed a hydrostatic pressure for
 $p_0(0,t) = \rho _1 g h(0,t)$
as the reference value for the theoretical result (2.7), since we did not install a pressure sensor at the inlet of the cell for technical reasons (there exists an injection channel at
 $x=0$
). It is self-consistent to use such a treatment to obtain a comparison between the experimental observations and the theoretical prediction.
As further verifications, we have also provided a comparison between the theoretically predicted and experimentally recorded frontal locations in figure 11(a,b), which shows that these experiments (as described in table 2) lie indeed in the unconfined current regime. Again, the error bars are smaller than the size of the symbols for the raw data, so we did not include them in the figure. There is very good agreement between the theory (i.e.
 $X_{\!f} \sim 1.48\, T^{2/3}$
) and experimental observations at intermediate times when the current is sufficiently long. The disagreement at very early times (e.g. when
 $x_{\!f} \leqslant 10$
cm) is likely due to the influence of wetting and interfacial tension, to our understanding, along with the influence of basal friction. This is also consistent with our discussions of the pressure data for the same experiments.
Overall, we consider that these additional experiments focusing on measuring the pressure evolution help demonstrate that the pressure calculations in the present work could indeed be used to make predictions. Regarding the underlying physics, in these experiments the pressure distribution is indeed hydrostatic at leading order, and its evolution depends on that of the fluid–fluid interface. We are able to make use of previous findings on the profile shape evolution, which leads to useful predictions for the pressure distribution. Otherwise, in the future it would be of interest to perform more experiments to explore the pressure behaviour in the confined regimes. In this case, the inlet pressure
 $p_0(0,t)$
is no longer the hydrostatic pressure head
 $\rho _1 g h_0$
, and it would be necessary to obtain this inlet value experimentally, e.g. by installing an additional pressure sensor at the origin.
3.3. Field observations
The model and solutions could possibly find applications in geophysical, environmental and industrial contexts with regard to fluid injection activities into porous reservoirs. In the field, it is typical to track the time evolution of the frontal location of the injecting fluid and the interface shape between the injecting and the ambient fluids based on seismic methods. For example, for geological
 $\textrm {CO}_2$
sequestration, field data typically well capture the time evolution of the frontal location of a
 $\textrm {CO}_2$
plume in an aquifer (e.g. Boait et al. Reference Boait, White, Bickle, Chadwick, Neufeld and Huppert2012; Chadwick et al. Reference Chadwick, Williams, Williams and Noy2012; Grude et al. Reference Grude, Landro and Dvorkin2014; Cowton et al. Reference Cowton, Neufeld, White, Bickle, White and Chardwick2016). Nevertheless, to measure the thickness profile of a
 $\textrm {CO}_2$
plume at higher resolutions, more advanced techniques are required. The present model provides an alternative way to monitor the fate of the injected
 $\textrm {CO}_2$
within a porous layer based on pressure signals at existing or newly drilled monitoring wells. This seems particularly plausible, considering that there exist many abandoned wells from the petroleum industry during the exploration stage, which often pose risks of greenhouse gas leakage (e.g. Nordbotten et al. Reference Nordbotten, Kavetski, Celia and Bachu2009; Kang et al. Reference Kang, Christian, Celia, Mauzerall, Bill, Miller, Chen, Conrad, Darrah and Jackson2016).
Field measurements of the BHP at a
 $\textrm {CO}_2$
sequestration project in the Tubaen Fm., the Snohvit Field, along with the rate of
 $\textrm {CO}_2$
injection for a period of approximately three years (Grude et al. Reference Grude, Landro and Dvorkin2014). We have observed significant decrease/increase of the BHP when
 $\textrm {CO}_2$
injection ceases/restarts during the four windows of shut in.

For example, figure 12 presents field data for the evolution of the BHP from a
 $\textrm {CO}_2$
sequestration project in the Tubaen Fm., the Snohvit Field, along with the rate of
 $\textrm {CO}_2$
injection (Grude et al. Reference Grude, Landro and Dvorkin2014). Over the period of April 2008–April 2011, more than 1.6 Mt
 $\textrm {CO}_2$
was injected at the Snohvit Field, which is some
 $D=2.6$
km (or
 $D \in [2.56, 2.67]$
km as reported by Grude et al. (Reference Grude, Landro and Dvorkin2014)) underneath the ground surface. While the
 $\textrm {CO}_2$
injection performance could also be under the influence of rock heterogeneity and salt precipitation (and the injection of chemicals to reduce its influence) for these operations, which are not considered in the present model, we note that there exhibits the general trend of BHP increase upon
 $\textrm {CO}_2$
injection and BHP decline during the four stages of shut in. In fact, a decline in BHP is typically observed to correlate with a decrease in injection rate (possibly for other reasons) based on these field data. We argue that such a correlation could be explained by the present model. Note that at leading order, the Cartesian configuration mimics the horizontal-well-injection activities such as those at the Sleipner site, while the radial configuration mimics vertical-well injection such as those at the Snohvit Field; see e.g. figure 1 of Eiken et al. (Reference Eiken, Ringrose, Hermanrud, Nazarian, Torp and Hoier2011) for the orientation of the injection wells at the two
 $\textrm {CO}_2$
sequestration sites. So now we make use of the profile shape
 $h(r,t)$
and pressure solutions in the radial configuration (e.g. Lyle et al. Reference Lyle, Huppert, Hallworth, Bickle and Chadwick2005; Nordbotten & Celia Reference Nordbotten and Celia2006; Guo et al. Reference Guo, Zheng, Celia and Stone2016b
). In particular, in the original space with dimensions, the background pressure distribution
 $p_0(r,t)$
along the base (
 $y=0$
) is given by
 \begin{equation} p(r,0,t) = p(r_i,0,t)- \int _{r_i}^{r} \left [ \frac {Q_{inj}}{2\unicode{x03C0} }\frac { \mu _1 \mu _2}{\hat r k [\mu _2 h + \mu _1 (h_0-h)]} - \frac {\Delta \rho g \mu _1 (h_0-h)}{\mu _2 h + \mu _1 (h_0-h)} \frac {\partial h}{\partial \hat r} \right ]\mathrm{d} \hat r \end{equation}
in a confined porous layer with finite thickness
 $h_0$
, see also Appendix B, which is used to make predictions in this section. Note that now
 $p_0(r_i,t)$
is the inlet pressure at the wall of the injection well
 $r=r_i$
rather than at the origin
 $r = 0$
. It is necessary to keep this length scale
 $r_i$
in the radial configuration due to the existence of a pressure singularity as
 $r \to 0$
.
Example calculations are presented in figure 13, where we consider a representative operation of constant fluid injection and shut in that occur alternately along a series of time periods that is consistent with the major trend of figure 12(b). The oscillations of the injection rate
 $Q_{inj}$
, e.g. due to salt precipitation (as noted by the authors) are neglected, and the imposed
 $Q_{inj}$
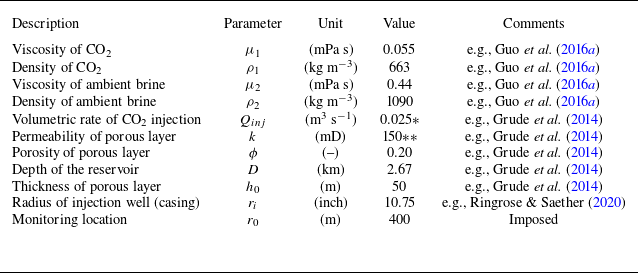
is shown in figure 13(b). We are then able to calculate the BHP evolution based on the present model, as shown in figure 13(a), and indeed we observe the building up of the background pressure upon fluid injection and its decline once injection ceases. Also, the order of magnitude of pressure increase/decrease is found to be consistent with the field data, using geophysical and operational parameters of this project, as summarised in table 3.
Geophysical and operational parameters imposed to obtain the theoretical predictions in figure 13. Gravitational acceleration is imposed as
 $g = 9.8$
m s−
 $^2$
. *The corresponding mass rate of injection is approximately 0.53 Mt/yr. **Such an effective permeability is within the range of
 $k \in [0.01,12\,000]$
mD, as reported by Grude et al. (Reference Grude, Landro and Dvorkin2014).


It may be of use to provide some further remarks. The thickness of the porous layer is set as
 $h_0 = 50$
m (e.g. base on figure 1 of Grude et al. Reference Grude, Landro and Dvorkin2014) and the monitoring location is imposed as
 $r_0 = 400$
m (note that we are not able to find this value from literature), both of which are considered to be reasonable values based on available field data. In the model, the BHP is defined as
 $\mbox{BHP}(t) \equiv p(r_0,t) = \Delta p(r_0,t) + p_0(0,t)$
, where
 $\Delta p(r_0,t)$
is the background pressure drop between the origin
 $r = 0$
and a monitoring location
 $r = r_0$
, as given by (3.1). The reference pressure
 $p_0(0,t)$
is defined as the pore pressure at the origin
 $(r,y)=(0,0)$
that is at depth
 $D = 2.67$
km underneath the ground surface. In the calculations here, we impose
 $p_0(0,t) = a\,t^{1/2} + b$
bar where
 $a = 0.0691$
bar h
 $^{-1/2}$
and
 $b = 262$
bar. The value of
 $b$
corresponds to the hydrostatic pressure of a column of water of length
 $D = 2.67$
km based on the depth of the reservoir. The additional component of
 $a\,t^{1/2}$
is imposed to obtain a good match with the field data of BHP evolution in figure 13. Physically, its appearance is likely due to the operation of the pump, but we do not fully understand its exact form.
Overall, these calculations show that it is self-consistent to employ the one-dimensional gravity current models to make estimates on the pressure evolution. In the future, it may be of interest to understand more about the evolution of the reference pressure
 $p_0(0,t)$
at the injection point under different fluid injection conditions. Once there is a thorough understanding of its evolution, the entire pressure evolution within the porous rock would be known reasonably well based on the present model of the lubrication type and without any fitting parameters. It may also be of interest to explain the observed pressure and injection-rate oscillations by modifying the model appropriately to address the influence of rock heterogeneity, salt precipitation and other related issues.
4. Summary and final remarks
4.1. Summary
The primary focus of this paper is on the pressure evolution during fluid injections into a horizontal and homogeneous porous layer with finite depth, following a series of previous studies on the interface shape evolution between immiscible fluids during one-dimensional fluid displacement. Understanding the pressure evolution is also useful to evaluate reservoir injectivity, which is important to the success of a subsurface fluid injection activity in practical applications. The model problem here is formulated in the Cartesian configuration and is particularly related to horizontal-well-injection activities, and can be of use to inform practical applications such as geological carbon dioxide sequestration, waste disposal and groundwater management.
For the canonic problem in the Cartesian configuration, previous studies arrived at a nonlinear advective–diffusive PDE to describe the interface shape evolution, while the present work builds upon these efforts to provide further insights into the pressure evolution and fluid injectivity. In particular, the role of two dimensionless parameters were clarified in the dimensionless system that could significantly impact the performance of fluid injections: the viscosity ratio
 $M \equiv \mu _2/\mu _1$
between the injecting and the ambient fluids, which affects the interface shape evolution (as recognised before), and the relative density difference
 $G \equiv (\rho _1-\rho _2)/\rho _2$
, which further influences the pressure field evolution within a reservoir (as clarified in this work).
Interestingly, we were also able to obtain self-similar solutions for the background pressure drop
 $\Delta p_0(x,t) \equiv p(0,t) - p(x,t)$
along the base of the porous layer (
 $y=0$
) in the four different self-similar regimes for the interface shape evolution. In particular, at early times, defined as
 $t \ll t_c \equiv \Delta \rho gk\phi h_0^3/(\mu _1 q^2)$
, the background pressure drop
 $\Delta p_0(x,t)$
along the base is very small compared with the hydrostatic pressure head across the thickness of the porous layer, and the pressure drop
 $\Delta p(x,y,t)$
within the domain varies predominantly in the vertical direction (see e.g. figure 6a
,b). At late times, defined as
 $t \gg t_c$
, horizontal variations of pressure
 $\Delta p(x,y,t)$
typically appear due to the influence of the background pressure drop
 $\Delta p_0(x,t)$
(see e.g. figure 6
c–h). The pressure evolution at specific monitoring locations is also provided at both the early and late times and for different values of
 $M$
and
 $G$
. Such information is also of particular use to assess the reservoir injectivity. Laboratory experiments were also performed in a vertically placed Hele-Shaw cell and the pressure data at two specific locations were recorded along the base during the propagation of a viscous gravity current. The pressure data were also rescaled appropriately to collapse onto a universal curve based on the theory, and the collapsed data points show reasonable agreement with the model prediction in the unconfined regime.
The model and solutions could possibly find applications in geophysical, environmental and industrial contexts with regard to fluid injections into porous formations, as we demonstrated in § 3.3 with an example calculation, considering geophysical and operational parameters of a
 $\textrm {CO}_2$
sequestration project for which field data are available for the BHP and injection-rate evolution. In the field, it is typical to look into the sharp fluid–fluid interface evolution based on seismic methods. The present model provides an alternative way for monitoring the evolution of the injected
 $\textrm {CO}_2$
plume within a porous layer based on pressure measurements at existing or newly drilled monitoring wells. The solutions and insights obtained for the temporal and spatial evolution of the pressure drop
 $\Delta p(x,y,t)$
and, in particular, the background pressure drop along the base
 $\Delta p_0(x,t)$
could be of use for the design of pressure-based monitoring technologies at a well bore. This concept seems particularly plausible, considering that there exist many abandoned wells from the petroleum industry during the exploration stage.
4.2. Assessing reservoir injectivity
The injectivity of a porous reservoir is closely related to the success of a subsurface injection project (e.g. IPCC 2005; Boait et al. Reference Boait, White, Bickle, Chadwick, Neufeld and Huppert2012; Grude et al. Reference Grude, Landro and Dvorkin2014). This could be quantified by the degree of pressure building up at a specific monitoring location and at a specific depth upon fluid injection. This was addressed by the present work in a canonic horizontal configuration in the sharp-interface limit. Our example calculations show that, initially, the background pressure drop
 $\Delta p_0(x_0,t)$
at a given monitoring location
 $x = x_0$
would increase with time during the early-time unconfined propagation regime before the arrival of the gravity current’s front (when
 $x_{\!f}(t) \leqslant x_0$
). Nevertheless, its evolution becomes non-trivial and depends then on the viscosity ratio
 $M$
when the propagation becomes confined at intermediate times and the motion of the displaced fluid has to be considered. Our calculations show that, eventually, the background pressure drop
 $\Delta p_0(x_0,t)$
could decrease with time when the injecting fluid is less viscous or equally viscous compared with the ambient fluid (when
 $M \geqslant 1$
), but quite in contrast,
 $\Delta p_0(x_0,t)$
will continue to increase with time when the injecting fluid is more viscous (when
 $M \lt 1$
) until it saturates at a constant value. These findings could also be used to appropriately assess the injectivity of a porous reservoir and also be compared with field measurements to understand the operation and performance.
4.3. The influence of hydrodynamic instabilities
We must note that more attention should be given to the late-time analytical solutions when the injecting fluid is less viscous than the ambient fluid (i.e. when
 $M\gt 1$
). This has been recognised indeed when studying the profile shape evolution, which provided a rarefaction solution that depends on the viscosity ratio
 $M$
(e.g. Zheng et al. Reference Zheng, Guo, Christov, Celia and Stone2015b
). However, for the unfavourable viscosity ratio of
 $M\gt 1$
, the classic viscous fingering instability (e.g. Saffman & Taylor Reference Saffman and Taylor1958) could possibly develop at intermediate times, and it was found typically that the rarefaction solution over-predicts the location of the propagating front of the injecting fluid, with some two-dimensional numerical evidence provided, e.g. in figure 4 of Nijjer, Hewitt & Neufeld (Reference Nijjer, Hewitt and Neufeld2022), in the regime when fluids mixing is allowed. This is particularly true when the influence of gravity/buoyancy is not significant enough to drive the injecting fluid to propagate along the bottom/top boundary as a gravity current. An interested reader could also refer to the experimental observations in figure 13 of Pegler et al. (Reference Pegler, Huppert and Neufeld2014) when fresh water invades an ambient of (more viscous) syrup solutions in a vertically placed packed-bead Hele-Shaw cell. Correspondingly, with regard to pressure distribution, it is suggested that, when possible (in particular when buoyancy segregation is not significant enough), one should compare the late-time analytical solutions (2.13) and (2.14) with, for example, two-dimensional numerical solutions at representative times, since the propagation could be under the influence of flow instabilities. Currently, we are working on the detailed influence of two-dimensional flow and fluids mixing in this regime.
Finally, quite on the other limit, the fluids can also be immiscible with significant influence of the wetting and capillary effects. Some insights can be obtained within the framework of the generalised Darcy description and under the assumption of vertical gravitational–capillary equilibrium. Previous work suggests that the propagation could also be slowed down when
 $M\gt 1$
, compared with the prediction of the rarefaction solution; see e.g. figure 3 of Zheng & Neufeld (Reference Zheng and Neufeld2019a
). In this case, the outer profile of the invading fluid develops gradually into a compound-wave shape, with a shock front inserted at
 $x_{\!f}(t)$
.
Funding
ZZ acknowledges partial support from an Eastern Scholar Distinguished Professorship (no. TP2020009) and NSFC (no. 12272235).
Declaration of interests
The authors report no conflict of interest.
Appendix A. Profile shape evolution
We note that solution (2.3) for
 $p_0(x,t)$
depends explicitly on the profile shape evolution
 $h(x,t)$
, which has been shown to be governed by a nonlinear advective–diffusive equation,
 \begin{equation} \phi \frac {\partial h}{\partial t} + \frac {\partial }{\partial x} \left [\frac {\mu _2 q h}{\mu _2 h + \mu _1 (h_0-h)} - \frac {\Delta \rho gk h(h_0-h)}{\mu _2 h + \mu _1 (h_0-h)} \frac {\partial h}{\partial x} \right ] = 0, \end{equation}
and PDE (A1) can be solved together with the appropriate initial and boundary conditions (IBCs):
 \begin{align} h(x,0) &= 0, \end{align}
 \begin{align} h(x_{\!f}(t),t) &= 0, \end{align}
 \begin{align} \left [\frac {\mu _2 q h}{\mu _2 h + \mu _1 (h_0-h)} - \frac {\Delta \rho gk h(h_0-h)}{\mu _2 h + \mu _1 (h_0-h)} \frac {\partial h}{\partial x} \right ]\Bigg |_{x=0} &= q. \end{align}
Physically, initial condition (A2a
) indicates that there is no injecting fluid 1 within the porous layer initially. Boundary condition (A2b
) is a frontal condition, which indicates that the thickness of fluid 1 is zero at the front of the fluid–fluid interface. Boundary condition (A2b
) is a flux condition imposed at the source, which indicates that fluid injection proceeds at a constant area rate
 $q$
as time progresses. The model could also be extended naturally to study the pressure evolution after injection ceases, as we note briefly in Appendix A.3.
Our understanding of the solution structure of similar systems of nonlinear advective–diffusive dynamics has evolved significantly over the past several years. Later we discuss in detail in § 2.3 based on the dimensionless form of (A1) and (A2) that self-similar solutions for the interface shape evolution
 $h(x,t)$
exist at both the early and late times, and the late-time solutions depend particularly on the viscosity ratio
 $M \equiv \mu _2/\mu _1$
. These findings allow us to explore further asymptotic solutions for the background pressure
 $p_0(x,t)$
along the base
 $y=0$
, and furthermore the pressure distribution
 $p(x,y,t)$
within the two-dimensional domain.
It is standard first to non-dimensionlise the governing PDE and IBCs before discussing the solutions. Choosing
 $x_c \equiv \Delta \rho gkh_0^2 / (\mu _1 q)$
and
 $t_c \equiv \Delta \rho gk \phi h_0^3 / (\mu _1 q^2)$
as the characteristic length and time scales, respectively, we define dimensionless time
 $T \equiv t/t_c$
, length
 $X \equiv x/x_c$
and thickness
 $H \equiv h/h_0$
. The scales are chosen such that at
 $t = t_c$
the front locates at
 $x_{\!f} \approx x_c$
for moderate values of
 $M$
(such that the prefactors are close to one in the dimensionless PDE and IBCs). We then non-dimensionalise the governing PDE (A1) and IBCs (A2), and arrive at their dimensionless form:
 \begin{equation} \frac {\partial H}{\partial T} + \frac {\partial }{\partial X}\left [ \frac {MH}{1 + (M-1)H} - \frac {H(1-H)}{1 + (M-1)H} \frac {\partial H}{\partial X} \right ] =0 \end{equation}
and
 \begin{align} H (X,0) &= 0, \end{align}
 \begin{align} H (X_{\!f}(T),T) &= 0, \end{align}
 \begin{align} \left [ \frac {MH}{1 + (M-1)H} - \frac {H(1-H)}{1 + (M-1)H} \frac {\partial H}{\partial X} \right ] \Bigg |_{X=0} &= 1. \end{align}
A dimensionless parameter
 $M$
is introduced as
 $M \equiv \mu _2 / \mu _1$
, which represents the viscosity ratio between the injecting and ambient fluids. Here, the choice of characteristic scales and the form of the dimensionless equations are consistent with a previous work of ours with a focus on the interface shape evolution (Zheng et al. Reference Zheng, Guo, Christov, Celia and Stone2015b
). The form of the solutions is hence consistent with this earlier work and is slightly different from that of Pegler et al. (Reference Pegler, Huppert and Neufeld2014) (where the viscosity ratio is defined differently).
For completeness of the presentation, we next provide the early-time and late-time asymptotic solutions for the profile shape evolution, which would be used in the main text to arrive at the pressure solutions.
A.1. Early-time self-similar solution
At early times, defined as
 $T \ll 1$
, the interface shape evolves according to a self-similar fashion based on PDE (A3), as pointed out in previous studies. Here we employ the following asymptotic form:
 \begin{equation} H(s) \sim s_{\!f}^2 T^{\frac {1}{3}}\left [\frac {2}{3}(1-s)-\frac {1}{12}(1-s)^2+\frac {1}{144}(1-s)^3\right ],\ \mathrm{as}\ s\to 1^{-}, \end{equation}
where the similarity variable
 $s$
is defined as
 $s \equiv s_{\!f}^{-1} X T^{-2/3}$
, with a frontal parameter of
 $s_{\!f}= (192/59)^{1/3} \approx 1.48$
, which agrees well with the previous reported numerical solution.
A.2. Late-time self-similar solutions
A.2.1.
$M \gt 1$

When the injecting fluid is less viscous than the ambient fluid (
 $M \gt 1$
), a self-similar rarefaction solution has been identified previously for the interface shape evolution at late times (
 $T \gg 1$
) based on PDE (A3):
 \begin{equation} H(\xi ) = \left \{ \begin{aligned} &1, & \xi \lt \xi _s, \\ &\frac {\sqrt {M/\xi }-1}{M-1}, &\xi _s \leqslant \xi \lt \xi _{\!f}, \\ &0, &\xi \geqslant \xi _{\!f}, \end{aligned} \right . \end{equation}
where the similarity variable is defined as
 $\xi \equiv X/T$
. The frontal parameters are also identified as
 $\xi _s \equiv 1/M$
and
 $\xi _{\!f} \equiv M$
, depending only on the viscosity ratio
 $M$
.
A.2.2.
$M = 1$

When the injecting and ambient fluids are equally viscous (
 $M = 1$
), another self-similar solution has been identified previously to describe the interface shape evolution at late times
 $(T\gg 1)$
from solving PDE (A3) as
 \begin{equation} H(\zeta ) = \left \{ \begin{aligned} &1, & \zeta \lt -1, \\ &\frac {1}{2}-\frac {\zeta }{2}, &-1 \leqslant \zeta \lt 1, \\ &0, &\zeta \geqslant 1, \end{aligned} \right . \end{equation}
where the similarity variable
 $\zeta$
is now defined as
 $\zeta \equiv (X-T)T^{-1/2}$
. In this case, the injecting fluid is confined between the porous layer and advects at a constant speed due to fluid injection. The influence of buoyancy impacts only the frontal structure of the interface between the leading and trailing fronts, corresponding to
 $\zeta = \pm 1$
.
A.2.3.
$M \lt 1$

When the injecting fluid is more viscous than the ambient fluid (
 $M \lt 1$
), a third self-similar solution has been obtained previously to describe the profile shape evolution at late times
 $(T\gg 1)$
based on the governing PDE (A3):
 \begin{equation} H(\eta ) = \left \{ \begin{aligned} &1, & \eta \lt -\eta _{\!f}, \\ &\frac {1}{2}-(1-M)\eta , &-\eta _{\!f} \leqslant \eta \lt \eta _{\!f}, \\ &0, &\eta \geqslant \eta _{\!f}, \end{aligned} \right . \end{equation}
where the self-similar variable
 $\eta$
is now defined as
 $\eta \equiv X-T$
. The frontal prefactor is also identified as
 $\eta _{\!f} = 1/[2(1-M)]$
, indicating the location of the leading and trailing fronts at
 $\eta = \pm \eta _{\!f}$
. In this case, the injecting fluid also advects primarily at a constant speed within the porous layer due to injection, while the interface shape between the leading and trailing fronts is under the influence buoyancy and depends on the viscosity ratio
 $M$
.
A.3. Post-injection pressure evolution
The model can be conveniently extended to study the pressure evolution when injection ceases, which we briefly note here. By imposing
 $q=0$
in (A1), we obtain that the profile shape evolution follows
 \begin{equation} \phi \frac {\partial h}{\partial t} - \frac {\partial }{\partial x} \left [\frac {\Delta \rho gk h(h_0-h)}{\mu _2 h + \mu _1 (h_0-h)} \frac {\partial h}{\partial x} \right ] = 0, \end{equation}
which is solved with a new set of appropriate IBCs:
 \begin{align} h(x,0) &= h_i(x), \end{align}
 \begin{align} h(x_{\!f}(t),t) &= 0, \end{align}
 \begin{align} - \frac {\Delta \rho gk h(h_0-h)}{\mu _2 h + \mu _1 (h_0-h)} \frac {\partial h}{\partial x} \Bigg |_{x=0} &= 0. \end{align}
The initial condition (A10a
) is provided by studying the original injection problem of (A1) subject to (A2) for a target time period of fluid injection
 $t \in [0,t_i]$
. The zero-flux (A10) condition reduces also to the symmetry condition
 $\partial h/\partial x = 0$
at the origin
 $x=0$
in this case. The background pressure evolution
 $p_0(x,t)$
at location
 $x$
can also be obtained according to
 \begin{equation} p_0(x,t) = p_0(0,t) + \int _0^x \frac {\mu _1 \Delta \rho gk (h_0-h)}{\mu _2 kh + \mu _1 k(h_0-h)} \frac {\partial h}{\partial \hat {x}} \mathrm{d} \hat {x}, \end{equation}
analogous to (2.3) for the period of fluid injection. The discussions here are used in the example calculations in § 3 to address field measurements of the BHP in a
 $\textrm {CO}_2$
sequestration project.
Appendix B. The radial configuration
We next focus on the pressure evolution in the radial configuration, as sketched in figure 14, which mimics fluid injection through vertical wells. We study the axisymmetric flow, as generated when fluid 1 is injected into a horizontal, homogeneous and isotropic porous layer, confined between two impermeable upper and lower boundaries. The thickness, porosity and permeability of the porous medium are denoted by
 $h_0$
,
 $\phi$
and
 $k$
, respectively. Before the injection of fluid 1, the porous layer is initially filled with fluid 2. The density and viscosity of fluids 1 and 2 are denoted by
 $\rho _1$
,
 $\rho _2$
,
 $\mu _1$
and
 $\mu _2$
, respectively, and we further assume that
 $\rho _1\lt \rho _2$
to be consistent with the application of geological
 $\textrm {CO}_2$
sequestration in saline aquifers. We deal with the sharp-interface limit in this work and neglect the influence of fluid mixing (e.g. Ruith & Meiburg Reference Ruith and Meiburg2000; Jha, Cueto-Felgueroso & Juanes Reference Jha, Cueto-Felgueroso and Juanes2011; Nijjer, Duncan & Neufeld Reference Nijjer, Duncan and Neufeld2018) and any effects of dispersion (e.g. Taylor Reference Taylor1953; Aris Reference Aris1956).
Fluid injection into a confined porous layer in the radial configuration. The profile shape is denoted by
 $h(r,t)$
, and the leading and trailing fronts are denoted by
 $r_{\!f}(t)$
and
 $r_{s}(t)$
. The volumetric injection rate is
 $Q_{inj}$
.

The profile shape of the fluid–fluid interface is denoted by
 $h(r,t)$
. The
 $r$
-axis is placed in the horizontal direction, and
 $y$
-axis is placed in the vertical direction (pointing downwards). Following standard steps (e.g. Nordbotten & Celia Reference Nordbotten and Celia2006; Guo et al. Reference Guo, Zheng, Celia and Stone2016b
), we arrive at the governing PDE for
 $h(r,t)$
as
 \begin{equation} \phi \frac {\partial h}{\partial t}+ \frac {1}{r} \frac {\partial }{\partial r} \left [ \frac {Q_{inj}}{2\unicode{x03C0} }\frac {\mu _2 h}{\mu _2 h + \mu _1 (h_0-h)} - \frac {\Delta \rho gkh(h_0-h)r}{\mu _2 h + \mu _1 (h_0-h)} \frac {\partial h}{\partial r} \right ] = 0, \end{equation}
which is to be solved subject to the initial and boundary conditions
 \begin{align} h(r,0) &=0, \end{align}
 \begin{align} h(r_{\!f}(t),t) &=0, \end{align}
 \begin{align} \left [\frac {Q_{inj}}{2\unicode{x03C0} }\frac {\mu _2 h}{\mu _2 h + \mu _1 (h_0-h)} - \frac {\Delta \rho gkh(h_0-h)r}{\mu _2 h + \mu _1 (h_0-h)} \frac {\partial h}{\partial r} \right ]\bigg |_{r=r_i} &=\frac {Q_{inj}}{2\unicode{x03C0}}, \\[9pt] \nonumber \end{align}
where
 $r_{\!f}(t)$
denotes the frontal location, and
 $r_i$
denotes the radius of the injection well. Once the profile shape
 $h(r,t)$
is known, the background pressure drop along
 $y=0$
can then be obtained as
 \begin{align} \Delta p_0(r,t) &\equiv p(r_i,0,t)-p(r,0,t)\nonumber \\ &= \int _{r_i}^{r} \left [ \frac {Q_{inj}}{2\unicode{x03C0} }\frac { \mu _1 \mu _2}{\hat r k [\mu _2 h + \mu _1 (h_0-h)]} - \frac {\Delta \rho g \mu _1 (h_0-h)}{\mu _2 h + \mu _1 (h_0-h)} \frac {\partial h}{\partial \hat r} \right ]\mathrm{d} \hat r. \end{align}
Note again that we have made the assumption that the pressure distribution
 $p(r,y,t)$
being hydrostatic, and the horizontal velocities being governed by the Darcy’s law. Note also that
 $Q_{inj}$
now denotes the volumetric injection rate in the radial configuration.
The model problem is rescaled based on the following characteristic length and time scales:
 \begin{equation} r_c \equiv h_0,\ h_c \equiv h_0\ \mathrm{and}\ t_c \equiv \frac {\phi \mu _1 h_0}{\Delta \rho gk}. \end{equation}
and we define
 $T \equiv t/t_c$
,
 $H \equiv h/h_c$
, and
 $R \equiv r/r_c$
. And we then arrive at the following dimensionless PDEs and IBCs:
 \begin{equation} \frac {\partial H}{\partial T}+ \frac {1}{R} \frac {\partial }{\partial R} \left [ \frac {\varLambda H}{1 + (M-1)H} - \frac {RH(1-H)}{1 + (M-1)H} \frac {\partial H}{\partial R} \right ]=0 \end{equation}
and
 \begin{align} H(R,0)&=0, \end{align}
 \begin{align} H(R_{\!f}(T),T)&=0, \end{align}
 \begin{align} \left [ \frac {\varLambda H}{1 + (M-1)H} - \frac {RH(1-H)}{1 + (M-1)H} \frac {\partial H}{\partial R} \right ]\bigg |_{R=R_i}&=\frac {\varLambda }{M}. \end{align}
where
 $R_i \equiv r_i/r_c$
is the dimensionless radius of the injection well and
 $R_f \equiv r_f/r_c$
is the dimensionless frontal location. We have also identified two dimensionless control parameters
 $M$
and
 $\varLambda$
, which are defined as
 \begin{equation} M \equiv \frac {\mu _2}{\mu _1}\ \mathrm{and}\ \varLambda =\frac {\mu _2 Q_{\textit{inj}}}{2\unicode{x03C0} \Delta \rho gk h_0^2}. \end{equation}
Physically,
 $M$
is the viscosity ratio of the two fluids, and
 $\varLambda$
is the dimensionless injection rate, as measured by the strength of buoyancy. The procedure is consistent with Guo et al. (Reference Guo, Zheng, Celia and Stone2016b
), but note that the role of
 $\varLambda$
is equivalent to the dimensionless buoyancy
 $\varGamma \equiv 1/\varLambda$
employed in the previous work, and we found that introducing
 $\varLambda$
makes it more convenient to study the pressure evolution. For the same reason, the time scale is chosen based on buoyancy-driven flow here rather than based on injection-driven flow (Guo et al. Reference Guo, Zheng, Celia and Stone2016b
). But overall, the dimensionless problem statement is consistent with these previous studies, and now we highlight the pressure signals.
Furthermore, the dimensionless pressure drop
 $\Delta P_0(R,T) \equiv P(R_i,0,T) - P(R,0,T)$
is now given by
 \begin{equation} \Delta P_0(R,T) = \int _{R_i}^{R} \left [ \frac {\varLambda }{\hat R [1 + (M-1)H]} - \frac {1-H}{1 + (M-1)H} \frac {\partial H}{\partial \hat R} \right ]\mathrm{d} \hat R, \end{equation}
which is affected by both
 $M$
and
 $\varLambda$
. The pressure drop can also be rewritten as
 \begin{equation} \Delta P_0 = \begin{cases} \begin{split}\frac {\Lambda}{M}\ln \frac {R}{R_i}, \quad \quad \quad \quad \quad \quad \quad \quad \quad \quad \,\,\,\,\, \mbox{when}\,\, R_i \leqslant R \leqslant R_s(T),\end{split}\\[8pt] \begin{split}\frac {\Lambda}{M}\ln \frac {R_s}{R_i} + \int _{R_s}^{R} \left [\frac {\varLambda }{\hat R [1+(M-1)H]} - \frac {1-H}{1+(M-1)H} \frac {\partial H}{\partial \hat R} \right ]\mathrm{d} \hat R,\\[6pt] \quad \quad \quad \mbox{when}\,\,\, R_s(T) \lt R \leqslant R_{\!f}(T), \end{split}\\[10pt] \begin{split}\frac {\Lambda}{M}\ln \frac {R_s}{R_i} + \Lambda \ln \frac {R}{R_{\!f}} + \int _{R_s}^{R_{\!f}} \left [\frac {\varLambda }{\hat R [1+(M-1)H]} - \frac {1-H}{1+(M-1)H} \frac {\partial H}{\partial \hat R} \right ]\mathrm{d} \hat R,\\[6pt] \mbox{when}\,\,\, R \geqslant R_{\!f}(T), \end{split} \end{cases} \end{equation}
and, by definition, the leading front locates at
 $R=R_{\!f}(T)$
with
 $H(R_{\!f},T) = 0$
, while the trailing front locates at
 $R=R_s(T)$
with
 $H(R_s,T) = 1$
. We next provide the late-time analytical solutions for the background pressure based on the three branches of self-similar solutions for the profile shape evolution
 $H(R,T)$
. The selection of the specific solution branch depends on the viscosity ratio
 $M$
.
B.1. Analytical solutions for pressure
Case (i). When the injecting fluid is less viscous than the ambient fluid, i.e. when
 $\mu _1\lt \mu _2$
(
 $M\gt 1$
), we neglect the influence of the second-order derivative at intermediate times. Introducing a similarity variable
 $\eta \equiv R^2/T$
, we then recover the self-similar solution for the profile shape (e.g. Nordbotten & Celia Reference Nordbotten and Celia2006) as
 \begin{equation} H(\eta ) = \frac {\sqrt {2\varLambda /\eta }-1}{M-1}, \end{equation}
for the region between the leading and trailing fronts at
 $\eta _{\!f} = 2\varLambda$
and
 $\eta _s = 2\varLambda /M^2$
. Substituting this self-similar solution
 $H(\eta )$
into (B8), we obtain the dimensionless pressure drop as
 \begin{equation} \Delta P_0 = \!\begin{cases} \!\begin{split}\frac {\varLambda }{M}\ln \frac {R}{R_i}, \,\mbox{when}\, R_i \leqslant R \leqslant R_{s},\end{split}\\[2ex] \begin{split}\frac {\varLambda }{M}\ln \frac {R_{s}}{R_i}\!+\!\frac {\varLambda }{R_{\!f}}(R-R_{s})-\frac {M-R_{\!f}/R}{(M-1)^2} \!+\! \frac {M}{(M-1)^2} \ln \frac {R}{R_s}, \,\mbox{when}\, R_{s} \leqslant R \leqslant R_{\!f}, \end{split}\\[2ex] \begin{split}\frac {\varLambda }{M}\ln \frac {R_{s}}{R_i}\!+\!\frac {\varLambda }{R_{\!f}}(R_{\!f}-R_{s})-\frac {1}{M-1} \!+\! \frac {M}{(M-1)^2} \ln \frac {R_{\!f}}{R_s}\!+\!\varLambda \ln \frac {R}{R_{\!f}},\, \mbox{when}\, R \geqslant R_{\!f}, \end{split} \end{cases} \end{equation}
where
 $R_{\!f}(T)=(2\varLambda T)^{1/2}$
and
 $R_s(T)=(2\varLambda T)^{1/2}/M$
in this case.
It is seen that at any specific monitoring location
 $R$
, the pressure drop
 $\Delta P_0$
evolves with time. This is consistent with the fact that the profile shape
 $H(R,T)$
of the fluid–fluid interface evolves with time. The two critical times
 $T = R^2/(2\varLambda )$
and
 $T = (MR)^2/(2\varLambda )$
correspond to the events when the leading and trailing fronts of the interface arrive at the monitoring location
 $R$
of interest, respectively. We also note that since the radius of the injection well
 $R_i$
provides an additional length scale of the problem, the pressure drop cannot be expressed in terms of the similarity variable
 $\eta$
only. This is particularly true in the radial configuration, since there exists an additional term that blows up as
 $R_i \to 0^+$
(
 $\propto \mbox{ln}\,R_i$
).
Case (ii). When the injecting and the ambient fluids are equally viscous, i.e. when
 $\mu _1=\mu _2$
(
 $M = 1$
), we introduce a similarity variable
 $\zeta = (R^2/T - 2\varLambda )/\varLambda ^{1/2}$
and recover a self-similar solution for the profile shape as
 \begin{equation} H(\zeta ) = -\frac {1}{4} \zeta + \frac {1}{2}, \end{equation}
in the limit of
 $\varLambda \gg 1$
when injection dominates, as obtained previously (Guo et al. Reference Guo, Zheng, Celia and Stone2016b
). The corresponding pressure drop can also be obtained as
 \begin{equation} \Delta P_0 = \begin{cases} \begin{split}\varLambda \ln \frac {R}{R_i}, \,\,\,\,\quad \quad \quad \quad \quad \quad \quad \quad \quad \quad \quad \quad \quad \quad \quad \quad \quad \kern2pt\mbox{when}\,\, R_i \leqslant R \leqslant R_{s},\end{split}\\[2ex] \begin{split}\varLambda \ln \frac {R}{R_i} +\frac {1}{2} - \frac {1}{32\varLambda T^2}(R_{\!f}^2-R^2)(R_{\!f}^2+R^2-2R_s^2), \,\,\mbox{when}\,\, R_{s} \leqslant R \leqslant R_{\!f}, \end{split}\\[2ex] \begin{split}\varLambda \ln \frac {R}{R_i}+\frac {1}{2}, \quad \quad \quad \quad \quad \quad \quad \quad \quad \quad \quad \quad \quad \quad \quad \quad \kern1pt\mbox{when}\,\, R \geqslant R_{\!f}, \end{split} \end{cases} \end{equation}
where
 $R_{\!f}(T)=[2(\varLambda +\varLambda ^{1/2})T]^{1/2}$
and
 $R_s(T)=[2(\varLambda -\varLambda ^{1/2})T]^{1/2}$
in this case. We see again that the solution depends on time, and, more specifically, the solution is affected by the two critical times
 $T=R^2/[2(\varLambda +\varLambda ^{1/2})]$
and
 $T=R^2/[2(\varLambda -\varLambda ^{1/2})]$
when the leading and trailing fronts arrive at the location of monitoring
 $R$
.
Case (iii). Finally, when the injecting fluid is more viscous than the ambient fluid, i.e. when
 $\mu _1\gt \mu _2$
(
 $M\lt 1$
), introducing another similarity variable
 $\xi = \eta - 2\varLambda /M$
, we then recover the self-similar solution
 \begin{equation} H(\xi ) = -\frac {1-M}{4}\xi +\frac {1}{2}, \end{equation}
neglecting the
 $\mathcal{O}(\xi )$
terms (Guo et al. Reference Guo, Zheng, Celia and Stone2016b
). After substituting this solution into the pressure integral (B8), we obtain the following expression for the pressure drop
 $\Delta P_0(R,T)$
:
 \begin{equation} \Delta P_0 = \begin{cases} \begin{split}&\frac {\varLambda }{M}\ln \frac {R}{R_i}, \,\,\mbox{when}\,\, R_i \leqslant R \leqslant R_{s},\end{split}\\[3ex] \begin{split}&\frac {\varLambda }{M}\ln \frac {R_{s}}{R_i} \!+\! \frac {\varLambda \xi _{\!f}^2}{2[\xi _{\!f}^2 \!-\! \xi _{\!f} \!-\!2\varLambda /M]}\ln \left [\frac {R^2}{R_s^2}\frac {\xi _{\!f}(R_{\!f}^2\!-\!R_s^2)\!-\!2(R_{\!f}^2\!-\!R_s^2)}{\xi _{\!f}(R_{\!f}^2\!-\!R_s^2)\!-\!2(R_{\!f}^2\!-\!R^2)}\right ] \!+\! \frac {\xi _{\!f}}{4} \\[3pt] &\!+\!\frac {\xi _{\!f}}{4} \frac {2R^2\!-\!R_{\!f}^2\!-\!R_s^2}{R_{\!f}^2\!-\!R_s^2} \!-\! \frac {M \xi _{\!f}^2}{4} \ln \left [\frac {M\!+\!1\!+\!2(2R^2\!-\!R_{\!f}^2\!-\!R_s^2)/[\xi _{\!f}(R_{\!f}^2 \!-\!R_s^2)]}{2M}\right ], \\ &\quad \quad \quad \quad \quad \quad \quad \quad \quad \quad \quad \quad \quad \quad \quad \quad \quad \quad \quad \quad \quad \mbox{when}\,\, R_{s} \leqslant R \leqslant R_{\!f},\end{split}\\[9ex] \begin{split}&\frac {\varLambda }{M}\ln \frac {R_{s}}{R_i} + \frac {\varLambda \xi _{\!f}^2}{2[\xi _{\!f}^2 \!-\! \xi _{\!f} \!-\!2\varLambda /M]}\ln \frac {M R_{\!f}^2}{R_s^2} + \frac {\xi _{\!f}}{2} + \frac {M \xi _{\!f}^2}{4} \ln M + \varLambda \ln \frac {R}{R_{\!f}}, \\ &\quad \quad \quad \quad \quad \quad \quad \quad \quad \quad \quad \quad \quad \quad \quad \quad \quad \quad \quad \quad \quad \quad \,\,\mbox{when}\,\, R \geqslant R_{\!f},\end{split} \end{cases} \end{equation}
where
 $\xi _s=-2/(1-M)$
,
 $\xi _{\!f}=2/(1-M)$
,
 $R_s(T)=[T(2\varLambda /M-2/(1-M))]^{1/2}$
and
 $R_{\!f}(T)=[T(2\varLambda /M+2/(1-M))]^{1/2}$
in this case. Again, it is seen that at any specific monitoring location
 $R$
of interest, the pressure drop varies with time. The two critical times
 $T=R^2/[2\varLambda /M-2/(1-M)]$
and
 $T=R^2/[2\varLambda /M+2/(1-M)]$
correspond to when the leading and trailing fronts arrive at the specific monitoring location, respectively.