1. Introduction
Growth accounting seeks to determine how much variation in income levels over time is attributable to differences in observed factor inputs, such as physical and human capital, and how much variation in incomes is explained by unobserved components, such as productivity changes (Hulten, Reference Hulten, Hall and Rosenberg2010). Within-country growth accounting analyses, as well as closely related cross-country development accounting analysesFootnote 1 (Caselli, Reference Caselli, Aghion and Durlauf2005; Hsieh and Klenow, Reference Hsieh and Klenow2010; Gallardo-Albarrán and Inklaar, Reference Gallardo-Albarrán and Inklaar2021), have largely ignored the contribution of land, minerals, fossil fuels, forests, and other natural resources – broadly referred to as natural capital – and instead have focused on physical and human capital as observable factors. However, recent analyses have shown evidence that the omission of natural capital biases the measurement of physical capital productivity (Monge-Naranjo et al., Reference Monge-Naranjo, Sánchez and Santaeulalia-Llopis2019) and the role of total factor productivity (TFP) in explaining cross-country differences in income levels (Freeman et al., Reference Freeman, Inklaar and Diewert2021).
Despite increasing recognition that natural capital is an important ‘missing factor’ that could potentially lead to biased outcomes in development and growth accounting, including natural resources in cross-country analyses has been shown to decrease the explanatory power of observed factor inputs (Sturgill, Reference Sturgill2014). This result suggests that TFP may play a larger role in economic growth than measured by conventional development accounting analyses. How this result holds in a growth accounting framework remains unclear. In this paper, we describe the theoretical conditions in which including natural capital improves growth explanations, focusing on within-country changes in factor inputs and total GDP.Footnote 2 To do this, we develop a growth accounting model to identify the conditions in which including natural capital allows observable factors to better explain changes in income over time. We also empirically identify the country-time periods that meet the conditions for improved growth explanations with natural capital.
Stringent data requirements on natural resource stocks and shares in GDP across countries and time often prevent the inclusion of natural capital when explaining variation in income across countries and/or time. We leverage a comprehensive dataset on key marketed natural resources over time from a range of sources to test if the conditions in which including natural capital increases explained changes in growth are empirically common. This approach, motivated by growth accounting analyses, examines the ability of an economy to produce income from capital stocks available in a country, and how changing capital stocks affect changes in aggregate income.
Our theoretical analysis shows that, for a country with increasing TFP over time, improvements in the explanation of growth occur when a country has a relative dependence on natural capital. The improvements increase in the natural capital factor share. This parallels the discovery in Brandt et al. (Reference Brandt, Schreyer and Zipperer2017) that TFP growth must be adjusted down when natural capital stocks grow faster than other capitals.
Our model also demonstrates that when TFP growth is negative, relatively higher physical capital growth increases the portion of growth explained by including natural capital in growth accounting exercises. Empirically, we find that 41 per cent of the 297 observationsFootnote 3 we consider meet the conditions in which including natural capital improves the explained changes in income over time, and that 59 per cent of these cases occur because TFP growth is negative while growth is relatively physical capital dependent. On the other hand, when physical capital grows faster than natural capital (and TFP growth is positive), omitting natural capital allows changes in physical and human capital to better explain changes in income. Yet, this occurs because the model overattributes growth to faster-growing physical capital, misses the role of natural capital, and underestimates the impact of changes in TFP (Brandt et al., Reference Brandt, Schreyer and Zipperer2017).
Including natural capital as an additional factor of production in growth analyses improves our understanding of the role of factor changes relative to TFP growth in contributing to income growth. For example, when TFP is increasing over time, factor changes explain only a portion of growth. But estimation of the contribution of TFP depends critically on whether natural capital is included and how fast it is growing relative to physical capital. If the share of physical capital is overestimated by omitting faster-growing natural capital, factor changes explain a smaller portion of growth and the importance of TFP is overestimated. In this case, by correcting the omission, factor changes explain a larger portion of changes in aggregate income. When physical capital stocks grow faster, including natural capital improves estimates of TFP while increasing the unexplained portion of growth.
Penn World Tables 10.0 (PWT) (Feenstra et al., Reference Feenstra, Inklaar and Timmer2015) provide data on labor shares, aggregate income (GDP), employment, and physical and human capital across countries and time. Following the World Bank (Hamilton, Reference Hamilton2006; Lange et al., Reference Lange, Wodon and Carey2018; World Bank, 2021) and Monge-Naranjo et al. (Reference Monge-Naranjo, Sánchez and Santaeulalia-Llopis2019), we include natural capital in the form of subsurface resources (minerals, coal, gas, and oil), timberland, cropland, and pastureland.Footnote 4 Combining existing sources with our own calculations, we obtain or generate annual data on each natural capital stock level and share in GDP across countries over the period spanning 2001–2015. With these data, we explain aggregate income growth based on capital accumulation with and without the inclusion of natural capital. Finally, comparing to observed changes in aggregate income reveals when inclusion of natural capital reduces the unexplained portion of GDP growth over time.
In the growth literature, Zuleta (Reference Zuleta2008) demonstrates that the factor share of land is significant across OECD countries from 1965 to 2000. Using the World Bank's measures of land, subsoil assets and forest resources, Sturgill (Reference Sturgill2012) estimates that the share of natural capital in income varies from 0.06 to 0.55 across 46 countries in the year 2000. Subsequently, Sturgill (Reference Sturgill2014) shows how failing to assess the separate contribution of natural capital to income can bias development accounting outcomes. After using time-invariant data on natural capital rents from the World Bank to separate the income share of natural capital from that of physical capital, he finds that including natural capital reduces the influence of physical capital and thus decreases the explained variation in income across countries.
Freeman et al. (Reference Freeman, Inklaar and Diewert2021) also show that excluding natural capital leads to biases in international comparisons of productivity, especially for resource-rich countries. Using existing measures of productivity that do not account for the contribution of subsoil natural resources, countries that have higher resource rent shares show up as more productive. But when natural capital is included, this is no longer the case.
While Brandt et al. (Reference Brandt, Schreyer and Zipperer2017) describe the TFP adjustments required after considering natural capital, they do not discuss the implications of this for our understanding of how factor changes contribute to income changes. We attempt to fill this gap by examining if and when within-country changes in aggregate income can be better explained by factor changes when including natural capital. Our work parallels the effort in the development accounting literature to account for human capital as a missing factor (Caselli, Reference Caselli, Aghion and Durlauf2005; Hsieh and Klenow, Reference Hsieh and Klenow2010; Schoellman, Reference Schoellman2012). Here, we demonstrate how the known impacts of natural capital on TFP estimates affect growth accounting.
Our approach also builds on existing literature that seeks to better explain the marginal product of physical capital over space and time (e.g., Caselli and Feyrer, Reference Caselli and Feyrer2007; Monge-Naranjo et al., Reference Monge-Naranjo, Sánchez and Santaeulalia-Llopis2019). Employing World Bank data on various capital stocks, Caselli and Feyrer (Reference Caselli and Feyrer2007) find that the share of income attributable to physical capital is reduced when land and other natural resources are introduced as a separate factor, effectively eliminating any gap in marginal capital returns between poor and rich countries. This occurs because many developing countries have a larger share of natural capital in total capital, which leads to an overestimate of the marginal productivity of physical capital when natural capital is omitted.
Extending the work of Caselli and Feyrer (Reference Caselli and Feyrer2007), Monge-Naranjo et al. (Reference Monge-Naranjo, Sánchez and Santaeulalia-Llopis2019) also demonstrate that failing to account for the value of natural capital produces misleading conclusions about the efficiency of cross-country physical capital allocation. For the same reason, Hsieh and Klenow (Reference Hsieh and Klenow2010) note that failure to account for natural resources could partly account for unexplained variation in cross-country measures of physical capital stocks, though more work is needed to confirm this. Like Caselli and Feyrer (Reference Caselli and Feyrer2007), Monge-Naranjo et al. (Reference Monge-Naranjo, Sánchez and Santaeulalia-Llopis2019) estimate natural capital shares in production before calculating the marginal product of physical capital across countries. Whereas Caselli and Feyrer (Reference Caselli and Feyrer2007) infer rent flows from stock values, Monge-Naranjo et al. (Reference Monge-Naranjo, Sánchez and Santaeulalia-Llopis2019) calculate natural capital shares using data on rent flows. Using the rent flow data, Monge-Naranjo et al. (Reference Monge-Naranjo, Sánchez and Santaeulalia-Llopis2019) show that even after accounting for natural capital, differences in the marginal product of capital persist, but become smaller, over time.
We make three contributions to the literature on development and growth accounting. First, we assemble a comprehensive dataset on key natural capital stocks and income shares in GDP for 99 countries from 2001–2015. While Monge-Naranjo et al. (Reference Monge-Naranjo, Sánchez and Santaeulalia-Llopis2019) require data on GDP shares, and Sturgill (Reference Sturgill2014) uses time-invariant data on natural capital stocks, we estimate factor shares over time together with physical measures of natural capital stock levels over time. Next, we theoretically describe the conditions in which including natural capital can improve explanation of within-country aggregate income growth and relate our result to Brandt et al. (Reference Brandt, Schreyer and Zipperer2017). Finally, we empirically demonstrate the prevalence of the conditions in which including natural capital improves explanation of growth in a growth accounting framework. In our analysis, factor shares vary across countries, and they can also vary within a country over different four-year time periods. This allows for non-constant factor shares across our analysis (Zuleta, Reference Zuleta2012), though we assume they remain constant within each time period.
Our results provide important insights for policymakers and economists interested in understanding the role of factor accumulation in facilitating growth in aggregate income. Importantly, the conditions in which natural capital changes improve growth explanations depend on the sign of TFP growth. Our theoretical results are consistent with results in Brandt et al. (Reference Brandt, Schreyer and Zipperer2017), but our model demonstrates the equivalence between adjustments to TFP and improved explanation of income growth using growth accounting. Natural capital dependent growth is better explained by factor changes when including natural capital if TFP growth is positive. If TFP growth is negative, countries with relatively large changes in physical capital better explain growth by including natural capital. Also, if natural capital stocks contribute to income generation, natural capital depletion may represent a drag on growth in the medium run as natural capital stocks become depleted (Barbier, Reference Barbier2017, Reference Barbier2019). Policies that focus on investments in physical and human capital while maintaining natural capital stocks may lead to faster economic growth over time. If this investment leads to physical capital dependent growth and increases TFP over time, then including natural capital in growth accounting leads to better estimates of TFP changes but causes observed factor changes to explain less of realized growth.
Section 2 describes our method for assessing the benefits of including natural capital when explaining changes in aggregate income over time. We derive the theoretical conditions in which including natural capital improves explanations of growth. This is followed by a description of our empirical approach for analyzing these conditions. Then, in section 3, we discuss our novel dataset of income levels, factor levels, and factor shares and present summary statistics for observed growth and the share of natural capital across countries. In section 4, we present the results of our empirical analysis and conclude in section 5 with a discussion of the lessons from our analysis.
2. Methods
Our goal is to determine the conditions in which including natural capital improves explanation of a country's change in aggregate income over time. In this section, we describe the theoretical model behind our analysis and how we derive a measure of improvement from including natural capital. Then, we derive the conditions in which we anticipate an improved explanation of growth by examining changes in the factors of production.
2.1 Theoretical model
Conventional growth accounting seeks to determine the relative importance of variation in capital (usually human and physical) and the efficiency with which they are used (Caselli, Reference Caselli, Aghion and Durlauf2005). To explore if including natural capital improves the explanation of economic growth, we follow Monge-Naranjo et al. (Reference Monge-Naranjo, Sánchez and Santaeulalia-Llopis2019) and assume that aggregate production in economy j and time period t, ${Y_{jt}}$ , can be expressed asFootnote 5, Footnote 6

Often, ${Y_{jt}}$ is measured by real gross domestic product. ${L_{jt}}$
 and ${K_{jt}}$
 are human capital and physical capital stocks respectively and are the factor inputs in the economy. Human capital depends on the quantity of labor in an economy and the mix of skills and experience that the labor force possesses. Physical capital represents the stock of buildings, plants, infrastructure, and other non-financial assets. $\alpha$
 represents the output elasticity with respect to human capital, and in an economy that maximizes net value from its factor inputs, this equates to the share of output value paid to human capital (see online appendix B). Similarly, $\delta$
 is the natural capital output elasticity, or share of total value paid to the owners of natural capital, and $1 - \alpha - \delta$
 is the output elasticity of (and share of output paid to) physical capital.
${N_{jt}}$ represents the natural capital stock in country j and year t. For simplicity, we express this as a single variable. In the empirical exercise, we include seven different forms of natural capital, each with its own share/elasticity parameter. That is, for these i = 1,…,7 resources in our empirical analysis, (1) becomes ${Y_{jt}} = {A_{jt}}L_{jt}^\alpha ({N_{1jt}^{{\delta_1}}\ldots N_{7jt}^{{\delta_7}}} )K_{jt}^{1 - \alpha - \mathop \sum \limits_i {\delta _i}}$
 . This production function specification assumes that the economy exhibits constant returns to scale.
Taking the natural log of both sides of equation (1) and differencing from $t = \tau$ to $t = T$
 yields the growth rate over the time period $\tau$
 to $T$
 :

The growth (and development) accounting literature asks how much of the changes (or cross-country variation) in income (or income per capita) can be explained by differences in factor inputs versus differences in ${A_{jt}}$ . Importantly, conventional development and growth accounting often ignores the role of natural capital as a productive input (Caselli and Feyrer, Reference Caselli and Feyrer2007; Zuleta, Reference Zuleta2008; Sturgill, Reference Sturgill2012, Reference Sturgill2014; Monge-Naranjo et al., Reference Monge-Naranjo, Sánchez and Santaeulalia-Llopis2019). Given imperfect correlation with changes in human and physical capital stocks, its value is likely attributed to both changes in TFP and to human and physical capital (though often, the physical capital share is calculated as a residual after estimating human capital shares; we follow this approach). This can mask the importance of natural capital in producing income and over- or under-attribute growth to changes in TFP. Also, as pointed out in Sturgill (Reference Sturgill2014), cross-country variability in physical capital stocks can dominate the explainable variation in income levels, which may obscure the true roles of human and natural capital.
While estimated labor shares are available from data sources such as PWT, the share of physical capital is often calculated as a residual. Therefore, when omitting ${N_{jt}}$ from equation (1), the portion of growth that remains unexplained is:

where $\alpha$ is obtained from data and the physical capital share is calculated as $1 - \alpha$
 , assuming constant returns to scale. Since this omits the contribution of natural capital, the share of physical capital is overestimated. The portion of growth that remains unexplained when including natural capital, equal to TFP growth, is equal to:

The unexplained growth becomes smaller when including natural capital if ${D_{\tau j}} \equiv |{{S_{j\tau }}} |- |{S_{j\tau }^N} |> 0$ .
${D_{j\tau }} > 0$ implies that the explained change in aggregate income is closer to the observed change when including natural capital in the aggregate production function. Therefore, we also refer to this variable as the ‘improvement’ in growth explanations when including natural capital. When the difference between observed and explained changes in income is the same sign for both cases, ${D_{j\tau }}$
 describes the decrease in income growth rate attributed to changes in TFP. We calculate ${D_{j\tau }}$
 for a range of time periods and countries to assess the empirical importance of natural capital in accounting for differences in income levels over time.
2.2 Conditions for a positive ${D_{j\tau }}$

Here, we explore the conditions in which ${D_{j\tau }} > 0$ . In our model, when TFP increases over time with or without the inclusion of natural capital, ${D_{j\tau }}$
 becomes:


Condition (5b) represents the two sources of bias when omitting natural capital from growth accounting exercises. Equivalently, these are the sources of bias that are removed when including natural capital. First, $\delta \ln ({{N_{jT}}/{N_{j\tau }}} )$ is the bias from ignoring the contribution of natural capital to growth. Next, $({1 - \alpha - \delta } )({\ln ({{K_{jT}}/{K_{j\tau }}} )} )- ({1 - \alpha } )({\ln ({{K_{jT}}/{K_{j\tau }}} )} )$
 is the bias from overestimating the shares of physical capital under the assumption that human capital shares are accurately measured. ${D_{j\tau }} > 0$
 if the bias from omitting natural capital's contribution exceeds the bias from overestimation of other shares.
Simplifying equation (5b),

Condition (6) states that, for a country that receives a positive contribution of natural capital to aggregate production $({\delta > 0} )$ , has positive TFP growth, and experiences a greater expansion in its use of natural capital relative to physical capital $({\ln ({{N_{jT}}/{N_{j\tau }}} )- \ln ({{K_{jT}}/{K_{j\tau }}} )> 0} )$
 , then ${D_{j\tau }} = \delta ({\ln ({{N_{jT}}/{N_{j\tau }}} )- \ln ({{K_{jT}}/{K_{j\tau }}} )} )> 0$
 . $\delta ({\ln ({{N_{jT}}/{N_{j\tau }}} )- \ln ({{K_{jT}}/{K_{j\tau }}} )} )$
 can be considered a measure of relative dependence on natural capital for an economy. This is equivalent to the benefit of including natural capital in explaining growth with factor changes when TFP growth is positive.Footnote 7
Following the same procedure, if TFP growth is negative with and without including natural capital, then ${D_{j\tau }} = - \delta \ln ({{N_{jT}}/{N_{j\tau }}} )- ({1 - \alpha - \delta } )({\ln ({{K_{jT}}/{K_{j\tau }}} )} )+ ({1 - \alpha } )({\ln ({{K_{jT}}/{K_{j\tau }}} )} )$ . Again, we can decompose the bias when excluding natural capital into the error from omitting the change in natural capital $({ - \delta \ln ({{N_{jT}}/{N_{j\tau }}} )} )$
 and the error from overestimating the physical capital share $( - ({1 - \alpha - \delta } )({\ln ({{K_{jT}}/{K_{j\tau }}} )} )+ ({1 - \alpha } )({\ln ({{K_{jT}}/{K_{j\tau }}} )} ) )$
 , where this second term is positive. As before, the sign of ${D_{j\tau }}$
 depends on the net effect of these two opposing errors that are eliminated when including natural capital.
Simplifying, ${D_{j\tau }} \!=\! \delta ({\ln ({{K_{jT}}/{K_{j\tau }}} )- \ln ({{N_{jT}}/{N_{j\tau }}} )} )={-} \delta (\ln ({{N_{jT}}/{N_{j\tau }}} )\!-\! \ln ({{K_{jT}}/{K_{j\tau }}} ) )$ . With negative TFP growth, $\delta ({\ln ({{N_{jT}}/{N_{j\tau }}} )- \ln ({{K_{jT}}/{K_{j\tau }}} )} )$
 is equal to $- {D_{j\tau }}$
 . Therefore, ${D_{j\tau }} > 0$
 implies that $\delta ({\ln ({{N_{jT}}/{N_{j\tau }}} )- \ln ({{K_{jT}}/{K_{j\tau }}} )} )< 0$
 , and the improvement in explaining growth by including natural capital decreases in relative natural capital dependence when TFP growth is negative. Equivalently, including natural capital better explains growth when TFP growth is negative and growth is relatively physical capital dependent. Taken together, equation (6) and the equivalent condition for when TFP growth is negative show the equivalence between the conditions for better explaining growth through factor changes and the result in Brandt et al. (Reference Brandt, Schreyer and Zipperer2017, equation (3)). The same factors that determine the adjustments needed to TFP growth because of natural capital equivalently influence the ability of natural capital to better explain income growth over time.
These theoretical results demonstrate that, while we hypothesize that the true production function includes natural capital, it is not always the case that including natural capital in a growth accounting exercise improves explanations of growth from factor changes.
Given that the true production function includes natural capital, omitting it from growth accounting leads to a biased share parameter for physical capital while also biasing estimates of TFP (and its changes). Omitting natural capital from growth accounting can improve the explained portion of growth (when $\ln ({{N_{jT}}/{N_{j\tau }}} )- \ln ({{K_{jT}}/{K_{j\tau }}} )< 0$ and TFP growth is positive), but given the biased estimates, it attributes growth to physical capital that is driven by a combination of natural capital and (unexplained) changes in TFP. Therefore, while growth is better explained by observable factor changes, the role of physical capital is biased upward. This theoretical result supports the result found by Sturgill (Reference Sturgill2014) that omitting natural capital led to an upward bias in the proportion of income level variation explained by physical capital.
Our model provides the conditions in which we expect the inclusion of natural capital to decrease the explanatory power of variation in factors. Given positive TFP growth, factor changes alone explain only a portion of growth. In this case, if physical capital grows faster than natural capital, then decreasing the share of output from physical capital by attributing it to natural capital leads to a smaller explained growth rate, and leaves TFP to explain more of the observed growth. Therefore, failing to include natural capital better explains growth through factor changes, but it underestimates the role of TFP changes.
The opposite is true when TFP growth is negative. In that case, factor changes account for more than observed growth. Leaving a higher share of physical capital by omitting natural capital allows the observed factors to better explain observed growth when physical capital grows slower than natural capital. Again, this better explains growth but underestimates the role of TFP decreases in explaining observed growth. These results connect to the bias in TFP described in Brandt et al. (Reference Brandt, Schreyer and Zipperer2017) and the development accounting literature result that including natural capital reduces the explanatory power of factor inputs because variation in physical capital across countries exceeds variation in natural capital (Sturgill, Reference Sturgill2014).
3. Data
For this analysis, we generate a novel dataset that describes income levels, factor levels, and factor shares for 99 countries from 2001 to 2015. Table A1 in the online appendix summarizes the variables used, describes their source, and notes how they are calculated, if relevant. We obtain real GDP by country and year from the PWT 10.0. To allow within-country comparisons over time, we follow the recommendation of Feenstra et al. (Reference Feenstra, Inklaar and Timmer2015) and use rgdpna, or real GDP at constant output national prices in millions of 2017 US$. PWT also provides information on labor (emp), human capital per worker (hc), labor share of GDP (labsh), and physical capital stock at current PPP in millions of 2017 US$ (cn).
In our analysis, 75 per cent of included countries were classified as developing in 2001. We define developing country status based on 2001 World Bank income classifications,Footnote 8 with ‘developed’ including high income countries and the remainder classified as ‘developing.’ Online appendix figure A1 (top panel) presents the total GDP of countries included in the analysis, separated into developing and developed status as of 2001. It includes only countries that report GDP in all years from 2001 to 2015.
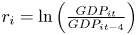
Using GDP from PWT, we calculate observed growth rates for all countries (as the difference in natural log of real GDP) for three time periods, 2001–2005, 2006–2010 and 2011–15. Over all three periods, most countries grew, with (unweighted) mean four-year growth rates of 0.18, 0.13, and 0.13 respectively (see online appendix figure A1, bottom 3 panels). Our goal is to examine if inclusion of natural capital in aggregate production functions improves the ability to explain these changes in income over time.
For this analysis, we need shares and stocks for all relevant types of capital for each time period. This includes human and physical capital as well as cropland, pastureland, timberland, and subsurface minerals. First, we describe the sources for all stock variables. Then, we present the calculation of shares.
3.1 Calculation of capital stocks
The real value of physical capital over time is included in the PWT 10.0 in millions of 2017 US$ as the variable rnna. Therefore, we use this variable to track physical stocks over time. Mankiw et al. (Reference Mankiw, Romer and Weil1992) point out the importance of proper measurement of human capital in development accounting. Therefore, we follow Monge-Naranjo et al. (Reference Monge-Naranjo, Sánchez and Santaeulalia-Llopis2019) and create a human capital measure, $L = emp\ast hc$ , where $emp$
 and $hc$
 are from the PWT 10.0. $emp$
 is a count of the number of workers and $hc$
 is an index of human capital per worker.
Natural capital variables are obtained from various sources. First, we use the area of cropland and plantation forest, expressed in square kilometers, available from FAOSTAT.Footnote 9 We use plantation forest instead of total forestland to capture land that is used for timber production. While this likely understates the total land in forest, it avoids including protected areas and other forest land that is not used for timber harvesting or other activities that contribute to aggregate production.Footnote 10 We calculate pastureland area using two methods. First, we take the area under pasture in square kilometers from FAOSTAT. Then, we multiply the percentage of land under pasture from World Development Indicators (WDI) by a country's total land area. Using the two methods allows us to include more countries in the analysis. When both methods produce an estimate for a given country and year, we take the average of the two measures of pastureland.
Subsurface stocks and production are provided by the World Bank,Footnote 11 and include coal (metric tons), mineralsFootnote 12 (metric tons), oil (barrels), and gas (terajoules). For minerals, the stock data are based on privately available mine-level information. We fill in missing years for stocks by subtracting production from the stock. Specifically, if the stock variable, ${s_t}$ , is missing in year t, but available in year $t - 1$
 , we calculate ${s_t} = {s_{t - 1}} - {e_{t - 1}}$
 where ${e_{t - 1}}$
 is extraction/production in year $t - 1$
 . While this assumption omits discoveries between stock observations, it allows us to account for changes over time driven by the extraction of nonrenewable resources.
These variables allow us to examine the change in capital stock levels for each country over time. Combining this with factor shares, described below, allows us to assess the improvement in our understanding of aggregate income growth after including natural capital in the aggregate production function.
3.2 Calculation of shares
Time-varying labor shares in GDP are provided by PWT 10.0. Therefore, we use this variable for all countries and years of our analysis.
The World Bank WDI provides natural resource shares for coal, oil, natural gas, subsurface minerals, and timber. To calculate the share of cropland in GDP, we first calculate the contribution of land rent in cropland production value as reported in Avila and Evenson (Reference Avila, Evenson, Pingali and Evenson2010), Coelli and Rao (Reference Coelli and Rao2005), and Nin-Pratt and Yu (Reference Nin-Pratt and Yu2008). If a country-level share is available, we use it. If not, we apply regional shares to each country within a region. We then multiply the cropland shares by total cropland production value from FAOSTAT, converted to 2017 US$ using the PWT GDP deflators, to estimate cropland rent in 2017 US$. Finally, we divide this rent by GDP (also in 2017 US$) to calculate the share of cropland rent in GDP. Since land rent shares in agricultural production vary across sources, we average the available calculated shares of GDP using each source.
Similarly for pastureland, we use regional shares of land in agricultural production value from the World Bank Wealth Accounts (World Bank, 2018), averaged across intensive and extensive shares. Multiplying these shares by livestock output value in 2017 US$, provided by FAOSTAT, produces an estimate of pastureland rent, which is divided by GDP (in 2017 US$) to obtain pastureland shares for the analysis.
In our data, natural capital shares are persistently higher in developing countries (defined based on 2001 development status; see online appendix figure A2). The average share for developing countries is 0.091 while for developed countries, it is 0.048. Sturgill (Reference Sturgill2012) also finds that natural capital shares in 2000 were approximately twice as large in developing countries (0.30) compared to high-income countries (0.16). Since the improvement from including natural capital depends on the natural capital share ($\delta$ in equation (6)), we expect the impact of including natural capital in our accounting exercise to be larger for poorer countries when TFP growth is positive. The second observation is that natural capital shares vary by less than 0.05 annually, with a drop associated with the 2008–9 Great Recession. The variability in natural capital share is smaller for developed countries.
Our data also demonstrate that countries in the Middle East and North Africa, where nonrenewable resource stocks are large and produce significant resource rent (e.g., oil shares average 0.23 compared to 0.04 overall), have the largest share of natural capital (see online appendix figure A3 for average natural capital shares across all countries for seven different regions over 2001–2015). Sub-Saharan Africa also shows a large average natural capital share, with an average that exceeds 0.1. The large natural capital share for Sub-Saharan Africa is driven by relatively large shares of forest land (0.05 compared to 0.01 overall), cropland (0.02 compared to 0.01 overall), and minerals (0.02 compared to 0.01 overall). North America has the smallest natural capital share. This suggests that, despite large natural capital stocks,Footnote 13 they remain a relatively small contributor to total income in the region.
Finally, we calculate physical capital shares by assuming constant returns to scale and subtracting the sum of human and natural capital shares from 1 (when ignoring natural capital, we subtract only the human capital share from 1 to obtain physical capital shares). The remaining capital share also includes returns to other assets including housing, government, and intellectual property (Vollrath, Reference Vollrath2024). As in Monge-Naranjo et al. (Reference Monge-Naranjo, Sánchez and Santaeulalia-Llopis2019), Sturgill (Reference Sturgill2014), Zuleta (Reference Zuleta2008), and Caselli and Feyrer (Reference Caselli and Feyrer2007), considering natural capital shares decreases the share of physical capital. The share of income paid to natural capital is also the change (i.e., decrease) in physical capital share after including natural capital. This suggests that regions/countries with large natural capital shares also experience a large decrease in the share of GDP attributable to physical capital. As a result, the role of physical capital decreases the most in the Middle East and North Africa as well as Sub-Saharan Africa when natural capital is included (see online appendix figure A3). This result also implies that the marginal product of physical capital decreases when considering natural capital.
In our analysis, we examine growth over discrete time periods. Therefore, while we have annual stock and share data over the study period, we average shares over each of the time periods. Our analysis holds these shares constant for each country within a time period. Then, over the next time period, factor shares can adjust based on biased growth that has taken place over the previous period, changing sectoral composition, or other reasons (Zuleta, Reference Zuleta2012). Evidence exists that factor shares are not constant across time and that this can bias estimates of factor contributions to growth, depending on the relative abundance of different factors (Zuleta, Reference Zuleta2012; Sturgill and Zuleta, Reference Sturgill and Zuleta2017). Therefore, we propose a method that holds shares constant for each country over each time period but allows technologies to change across countries and within each country across different time periods. This allows for factor-augmenting technological change across the periods but, unlike the method applied in Zuleta and Sturgill (Reference Zuleta and Sturgill2015), it assumes no factor-augmenting change within-period.
In our base analysis, we focus on three, non-overlapping periods between 2001 and 2005, 2006 and 2010, and 2011 and 2015. Choosing non-overlapping periods ensures that results across multiple time periods are not affected by one abnormal year. Our objective is to explain growth over each of those periods using the average capital shares over the periods and the observed change in capital stocks.
4. Results
In this section, we present the results of our parameterized analysis to identify the country and time periods in which including natural capital improves explanation of growth through factor changes. We consider $\tau = 2001,\; 2006,\; 2011$ , with $T = \tau + 4$
 . Our analysis reveals the role of TFP growth and relative natural capital dependence in explaining this improvement.
4.1 Importance of accounting for natural capital
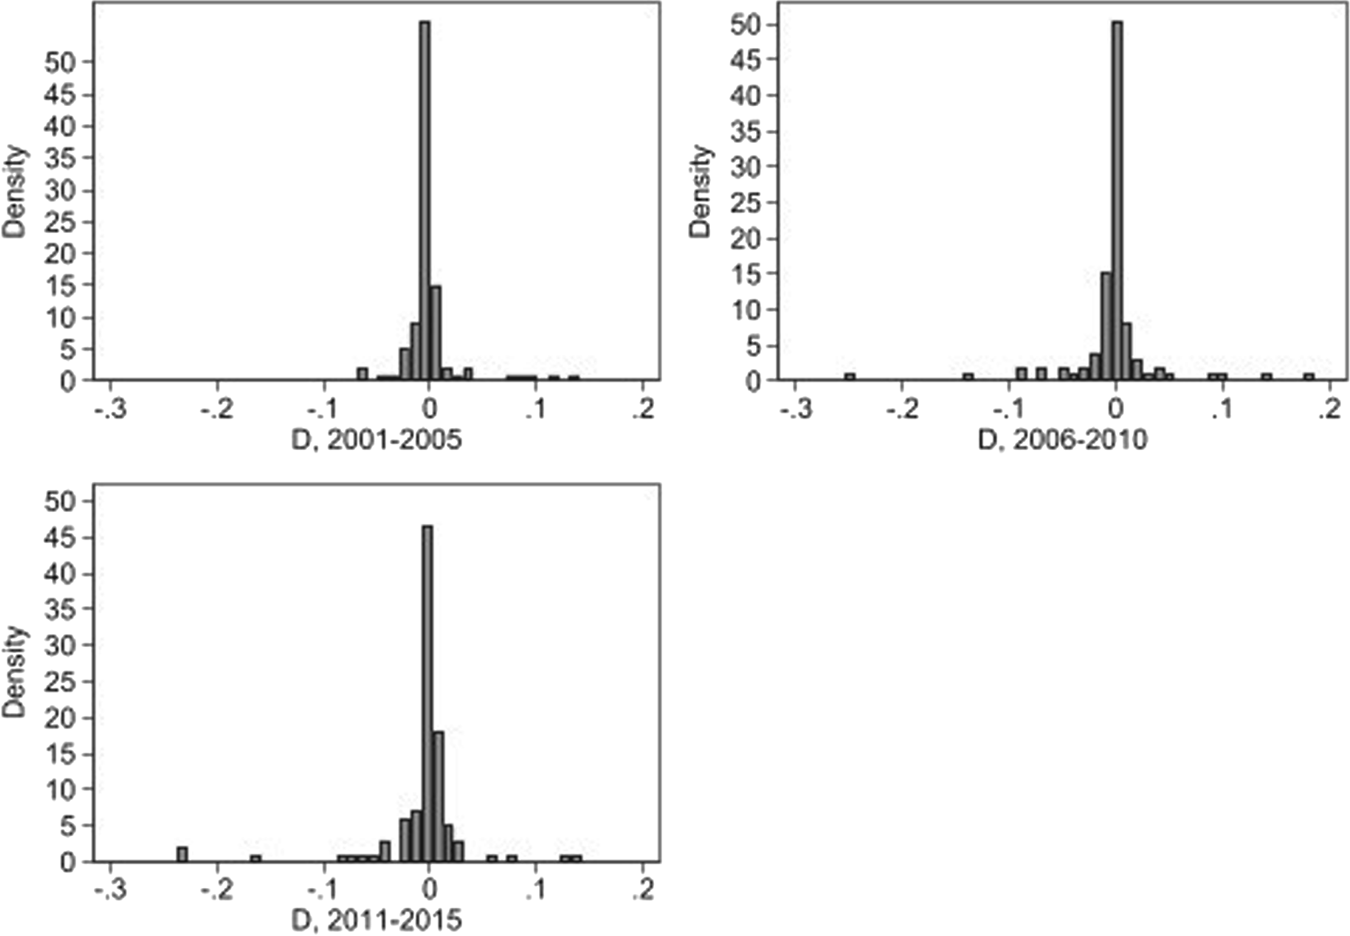
Figure 1 presents the distribution of ${D_{j\tau }}$ for each of the three time periods considered. ${D_{j\tau }} > 0$
 for many countries in all three time periods but there is considerable variation. The median ${D_{j\tau }}$
 is less than zero in all time periods, though the mean is positive from 2001–2005. Figure 1 demonstrates that most countries see small changes in explanations of growth with the inclusion of natural capital. In all time periods, however, a set of countries exists for which including natural capital improves the explanation of income growth, and sometimes by a substantial amount. See online appendix D for a list of each country and associated improvement in explanation in addition to income level, region, change in TFP, and relative natural capital dependence, defined as $\delta ({\ln ({{N_{jT}}/{N_{j\tau }}} )- \ln ({{K_{jT}}/{K_{j\tau }}} )} )$
 .
Empirical distributions of ${D_{j\tau }}$ for three time periods

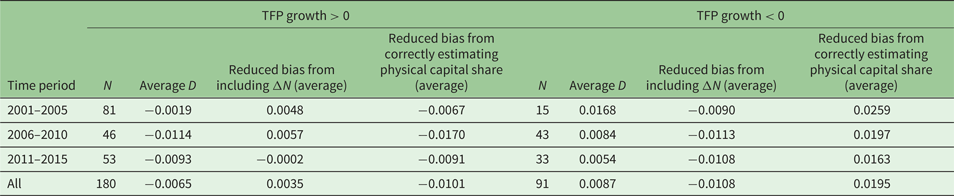
Our theoretical model allows us to decompose the total improvement in growth explanation by including natural capital, ${D_{j\tau }}$ , into reducing bias that comes from omitting the change in natural capital and reducing the bias that comes from overestimating the physical capital share. In table 1, we present the overall average ${D_{j\tau }}$
 for country-time periods in which TFP growth is positive and negative. ${D_{j\tau }}$
 is higher on average for countries and time periods experiencing negative TFP growth. When TFP grows over time, including natural capital decreases the portion of growth explained by observed factor changes on average. This occurs because the overestimation of the contribution of faster growing physical capital stocks dominates the effect of omitting slower-growing natural capital stocks, on average. Overestimating physical capital's contribution leads to an increased growth rate predicted from factor changes and diminishes the role of TFP. While this biases the distinction between factor changes and TFP, it leads to a predicted growth from factor changes that is closer to the observed rate. When TFP growth is negative, the effect of omitting natural capital changes is again smaller in magnitude than the effect of overstating the share of physical capital. As before, overstating the share of natural capital dominates the effect of omitting natural capital changes but in this case, it makes the improvement larger on average when including natural capital.
Decomposing the improvement in growth prediction by including natural capital

While figure 1 presents estimates of ${D_{j\tau }}$ , it is not clear if ${D_{j\tau }} > 0$
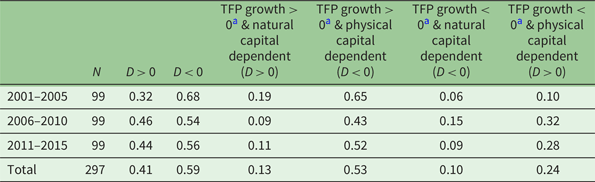
 occurs because a country is natural capital dependent with positive TFP growth or because a country is physical capital dependent with negative TFP growth. Table 2 summarizes the drivers of positive or negative ${D_{j\tau }}$
 in the data in terms of TFP growth and natural capital dependence. First, we see that ${D_{j\tau }} > 0$
 in 41 per cent of all country observations (N = 297) across the entire 2001–2015 period. However, there is considerable variation across the three time periods. From 2001–2005, less than one-third of countries experienced ${D_{j\tau }} > 0$
 . This is because a large share (65 per cent) of countries' growth in 2001–2005 was relatively dependent on physical capital and exhibited positive TFP growth (there were an additional 6 per cent with relative natural capital dependence and negative TFP growth that led to ${D_{j\tau }} < 0$
 ). In the subsequent two periods, a smaller share of countries relatively dependent on physical capital experienced positive TFP growth, whereas a larger share exhibited negative TFP growth. This was the main reason why there was a larger share of countries with ${D_{j\tau }} > 0$
 in the latter two time periods (46 per cent in 2006–2010 and 44 per cent in 2011–2015). Notably, in these two periods, the share of relatively natural capital dependent countries experiencing positive TFP growth declined compared to the 2001–2005 period, whereas the share with negative TFP growth increased slightly.
Proportion of observations in each category

a Considers TFP growth when the aggregate production function includes natural capital. The conditions described in the theoretical model are for when TFP growth has the same sign when including or excluding natural capital. Therefore, the sum of the scenarios does not necessarily add up to the total number of D > or < 0. Proportions are out of the number of observations indicated in the column labeled N such that the sum across the first 2 and final 4 columns of proportions is 1. Theoretical prediction for sign of D indicated in parentheses.
Overall, we found that growth in countries did not often switch from being relatively natural capital to physical capital dependent over 2001–2015. That is, the number of countries with relatively natural capital dependent growth does not change significantly across time. In contrast, many countries frequently displayed changes in TFP growth from period to period. The implication is that many countries switch from positive to negative ${D_{j\tau }}$ (and vice versa) as TFP growth changes signs. Therefore, it is possible that including natural capital may not currently appear to explain growth better in a country, even if it is relatively natural capital dependent, but this may change if the country's TFP growth switches from negative to positive.
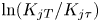
To further examine the implications of our results, figure 2 presents scatterplots of relative dependence on natural capital as opposed to physical capital for growth for all countries for each of the three time periods of our analysis. For each time period, we separate countries by positive and negative TFP growth. All subplots include the 45-degree line, above which a country's growth was relatively natural capital dependent and below which its growth was relatively physical capital dependent. The farther an observation is from the 45-degree line, the more relatively dependent the country's growth is on natural capital (above the line) as opposed to physical capital (below the line). When TFP growth is positive, relative natural capital dependence leads to ${D_{j\tau }} > 0$ . With negative TFP growth, ${D_{j\tau }} > 0$
 occurs when growth is relatively physical capital dependent. Countries with natural capital shares larger than 0.05 are presented as circles while squares represent countries with shares less than 0.05 (the median share across all countries and time periods is 0.04 while the mean is 0.09).
Proportional physical and natural capital growth by country and time period
Notes: Labeled points indicate countries for which D jτ > 0. 0.04 is the median natural capital share across countries and time periods. n = ln (N jT/N jτ) and k = ln (K jT / K jτ) are censored at 0.7 so that n = 0.7 if n ≥ 0.7. Similarly for k.

In all subplots of figure 2, the countries with positive improvements from including natural capital are labeled. When TFP growth is positive, countries that have relatively natural capital-dependent growth ($n > k$ where $n = \ln ({{N_{jT}}/{N_{j\tau }}} )$
 and $k = \ln ({{K_{jT}}/{K_{j\tau }}} )$
 ) benefit from the inclusion of natural capital and are thus labeled in the region above the 45-degree line. When TFP growth is negative, growth explanations improve when $k > n$
 . It is clear that large changes in ${D_{j\tau }}$
 are not necessarily associated with the largest natural capital shares. Large magnitudes of ${D_{j\tau }}$
 often result from large differences between $\ln ({{N_{jT}}/{N_{j\tau }}} )$
 and $\ln ({{K_{jT}}/{K_{j\tau }}} )$
 .
Examination of table 2 and figure 2 reveals the role of TFP growth and relative natural capital dependence in generating an improved growth explanation from including natural capital.Footnote 14 It becomes clear that positive ${D_{j\tau }}$ results from both positive TFP growth with relative natural capital dependence and from negative TFP growth with physical capital dependence. Of the 41 per cent of country observations that better explain growth with natural capital, 59 per cent (0.24/0.41) do so because TFP growth is negative and growth is relatively physical capital dependent. It is therefore empirically important to consider the improvement from including natural capital when TFP growth is negative.
Finally, examining the country-specific results in online appendix D reveals that the countries with large (or small) ${D_{j\tau }}$ do not come disproportionately from a specific region or income level. Also, countries from all income groups and regions can be found with both positive and negative ${D_{j\tau }}$
 .
5. Discussion and conclusion
This paper demonstrates the empirical importance of including natural capital when considering how changes in economy-wide factor inputs affect aggregate income generation. It is known that excluding natural capital overstates the role of physical capital and biases the estimated change in TFP (Brandt et al., Reference Brandt, Schreyer and Zipperer2017). At the same time, the development accounting literature has found that, across countries, including natural capital decreases the explained variation in incomes (Sturgill, Reference Sturgill2014). Our analysis bridges these two outcomes and provides the conditions in which including natural capital could better explain income changes within countries over time.
Our results suggest that considering changes in natural capital stocks over time within a country improves our explanation of changes in income for countries and time periods that have positive TFP growth and relative natural capital dependence. To explain growth through factor changes in resource-dependent countries and time periods with positive TFP growth, it is crucial to account for the contribution of natural capital stocks and how they evolve over time. Counterintuitively, if a country depletes natural capital while building physical capital, it is less likely to better explain growth by accounting for natural capital if TFP grows over time. For example, see Saudi Arabia in 2001–2005 in table A2 of the online appendix, where TFP growth is positive but natural capital dependence is negative (i.e., it is physical capital dependent). Saudi Arabia in 2001–2005 had the smallest ${D_{j\tau }}$ of the time period.
Alternatively, our results also show that when TFP growth is negative, accounting for the role of natural capital better explains changes in income for countries whose growth is relatively dependent on physical capital. For example, a country with a large share of income from natural resources but faster growth in physical capital stocks than natural capital stocks (e.g., because of increased investment in physical capital and/or rapid depletion of natural capital), could be experiencing negative TFP growth. In such a case, accounting for the contribution of changes in natural capital better explains growth for this country. This can be seen by looking at Qatar or Iraq in 2001–2005 in table A2 in the online appendix, where natural capital dependence and TFP growth are both negative (i.e., they are physical capital dependent). They have the two largest gains in explanation from including natural capital in that time period. It is important to recall that in all cases, including natural capital leads to more accurate explanation of the role of physical capital and TFP growth in determining income growth.
Overall, our results suggest that the conditions in which including natural capital better explains a country's growth in income are not as straightforward as previously thought. Conventional wisdom is that including natural capital should better explain growth for a country with natural capital that contributes a relatively large share to its national income. But as we have shown, this may not always be the case (see figure 2). While not intuitively obvious, what appears to matter more is the relative dependence of a country's growth on natural capital as opposed to physical capital, as well as whether a country is experiencing positive or negative TFP growth. As we have shown, including natural capital better explains growth when a country's growth is relatively natural capital dependent and displays positive TFP growth, and when a country is relatively dependent on physical capital growth and experiences negative TFP growth.
We also found that growth in countries did not often switch from being relatively natural capital to physical capital dependent, whereas many countries frequently displayed changes in the sign of TFP growth from period to period. Including natural capital may not currently appear to explain growth better in a country, even if it is relatively natural capital dependent, but this may change if the country's TFP growth switches from negative to positive.
Although we also explore the conditions in which including natural capital does not improve the explanation of growth from factor changes, even under such conditions excluding natural capital is problematic. For example, countries with growing TFP and physical capital dependence appear to better explain growth by omitting natural capital. However, this better explanation from factor changes occurs because it overemphasizes the importance of faster-growing physical capital. This bias in factor share leads to an underestimate of TFP changes. Therefore, including natural capital reveals that more economic growth is attributable to the total productivity of employed factors, and although explained growth is reduced as a result, the share of growth attributed to TFP as opposed to physical capital is more accurately measured. This provides the connection between efforts to better estimate TFP changes (Brandt et al., Reference Brandt, Schreyer and Zipperer2017) and the current interest in the empirical determinants of growth (Kremer et al., Reference Kremer, Willis and You2022), including the importance of factor accumulation.
While this analysis highlights the importance of accounting for natural capital in explaining changes in incomes, it does not include non-market natural capital such as fish stocks, water, and other ecosystems, which also contribute both directly and indirectly to economic well-being (Arrow et al., Reference Arrow, Dasgupta, Goulder, Mumford and Oleson2012; Barbier, Reference Barbier2019; Dasgupta et al., Reference Dasgupta, Managi and Kumar2022). Already, international efforts to measure inclusive or comprehensive wealth include measures of such non-market natural capital (Managi and Kumar, Reference Managi and Kumar2018). As measures of these stocks and their values over time improve, future work on growth accounting should include this additional natural capital. In many cases the rental flows generated by unpriced natural capital may be collected by priced inputs (Manning et al., Reference Manning, Taylor and Wilen2018), and thus affect the market value of priced factors. In this case, their value is captured in measures of income like GDP, but we fail to consider the role of their depletion when explaining income growth.
In this paper, we do not examine the distributional impacts of changes in aggregate incomes. Future work should consider how the accumulation of alternative forms of capital leads to more or less equal distributions of the income growth generated. It is plausible that an emphasis on physical capital accumulation could favor the relatively rich while the returns to natural and human capital spread more broadly. Testing these hypotheses represents productive areas for future work on the relationship between capital accumulation and income growth. It would also be useful to examine differences in aggregate income versus differences in income per capita when including natural capital.
Another lesson from this work is that the importance of natural capital when explaining aggregate income growth from factor changes is influenced by the share of natural capital in a country. Previous literature on natural resources and growth largely focuses on measures of resource abundance and/or dependence, defined as resource exports relative to GDP (van der Ploeg, Reference Van der Ploeg2011; Badeeb et al., Reference Badeeb, Lean and Clark2017). Evidence consistently shows that countries that are resource rich, in terms of a higher share of resource rents to GDP, have lower productivity and economic performance (Venables, Reference Venables2016; Freeman et al., Reference Freeman, Inklaar and Diewert2021; Lashitew et al., Reference Lashitew, Ross and Werker2021). Our work suggests that further investigation into the causal links between natural resource shares, relative dependence, and growth could be a productive avenue for future research, just as including human capital proved pivotal in explaining differences in cross-country income levels and growth (Mankiw et al., Reference Mankiw, Romer and Weil1992; Benhabib and Spiegel, Reference Benhabib and Spiegel1994; Hamilton and Monteagudo, Reference Hamilton and Monteagudo1998).
Overall, this work demonstrates that accounting for natural capital accumulation and depletion improves our understanding of the drivers of changes in aggregate income for some countries and time periods. An improved explanation of growth from factor changes occurs with positive TFP growth and relative natural capital dependence or with negative TFP growth and relative physical capital dependence. This perspective informs the recent interest in the empirical determinants of economic growth.
Supplementary material
The supplementary material for this article can be found at https://doi.org/10.1017/S1355770X24000330.
Competing interest
The authors declare none.