Introduction
Seeds age and eventually lose viability. Predicting survival time is difficult because we can neither detect early symptoms of ageing (before mortality) nor accurately predict the response of a seed lot to typical storage conditions (because it may take years to decades) (Hay et al., Reference Hay, Valdez, Lee, Cruz and Pompe2018). In this paper, we use classical stress–response concepts (Levitt, Reference Levitt1980) as a framework for simulating ageing responses, with the objectives of improving predictions of seed longevity and testing markers of ageing.
The ‘expiration date’ or life expectancy of an object predicts a future time when its functionality will be compromised. To make this prediction, various disciplines employ a strategy of measuring degradation under extreme conditions (often called ‘accelerated’ conditions) and inferring stability for the storage conditions of interest (referred to here as ‘target’ conditions) by extrapolating kinetic models (Conger and Randolph, Reference Conger and Randolph1968; Glenister and Lyon, Reference Glenister and Lyon1986; Threadgold and Brown, Reference Threadgold and Brown2003; Ferrio et al., Reference Ferrio, Alonso, Voltas and Araus2004; Harman, Reference Harman2006; Chang and Pikal, Reference Chang and Pikal2009; Menart et al., Reference Menart, De Bruin and Strlič2011; Fundo et al., Reference Fundo, Quintas and Silva2015). For seeds, high moisture and temperature constitute accelerated conditions and are often extrapolated to cold, dry conditions using the empirically based model of the viability equations (VEs) (Ellis and Roberts, Reference Ellis and Roberts1980; Hay et al., Reference Hay, Mead, Manger and Wilson2003; Pritchard and Dickie, Reference Pritchard, Dickie, Smith, Dickie, Linington, Pritchard and Probert2003; Rajjou et al., Reference Rajjou, Lovigny, Groot, Belghazi, Job and Job2008; Hay et al., Reference Hay, Valdez, Lee, Cruz and Pompe2018). Notably, there are only a few datasets from experiments initiated decades ago that can actually validate the accuracy of model predictions for refrigerated or freezer storage (Walters et al., Reference Walters, Wheeler and Stanwood2004, Reference Walters, Wheeler and Grotenhuis2005; Agacka et al., Reference Agacka, Laskowska, Doroszewska, Hay and Börner2014; Nagel et al., Reference Nagel, Kranner, Neumann, Rolletschek, Seal, Colville and Börner2015; Fleming et al., Reference Fleming, Richards and Walters2017, Reference Fleming, Patterson, Reeves, Richards, Gaines and Walters2018a,Reference Fleming, Hill and Waltersb). Accelerated conditions are also frequently used to compare longevity among seed lots or genetic lines, a practice that assumes that responses to high and low temperature and moisture are similar among diverse seeds (Clerkx et al., Reference Clerkx, El-Lithy, Vierling, Ruys, Blankestijn-De Vries, Groot, Vreugdenhil and Koornneef2004; Probert et al., Reference Probert, Daws and Hay2009; Schwember and Bradford, Reference Schwember and Bradford2010; Sano et al., Reference Sano, Rajjou, North, Debeaujon, Marion-Poll and Seo2016; Li et al., Reference Li, Shao, Wang, Wang, Mao, Wang and Zhang2017). Accelerated conditions might also involve increasing the abundance of compounds thought to participate in ageing reactions by, for example, irradiation or increased oxygen pressure (Conger and Randolph, Reference Conger and Randolph1968; Glenister and Lyon, Reference Glenister and Lyon1986; Ohlrogge and Kernan, Reference Ohlrogge and Kernan1982; Priestley et al., Reference Priestley, Werner and Leopold1985; Vertucci et al., Reference Vertucci, Roos and Crane1994; Khan et al., Reference Khan, Hendry, Atherton and Vertucci-Walters1996; Groot et al., Reference Groot, Surki, De Vos and Kodde2012, Reference Groot, de Groot, Kodde and van Treuren2015).
Target conditions for storing seeds call for low temperature and moisture, conditions under which cytoplasm is preserved through reversible solidification, that is, glass formation (Sun and Leopold, Reference Sun and Leopold1994; Buitink and Leprince, Reference Buitink and Leprince2008; Walters et al., Reference Walters, Ballesteros and Vertucci2010; Walters, Reference Walters2015). The chemical and structural stability of the solid matrix comes at a cost: as water is removed and temperature decreased, molecules compress together, entrapping neighbouring molecules through steric hindrance. Cell shrinkage and deformation is extreme and usually lethal (e.g. Meryman, Reference Meryman1974; Walters et al., Reference Walters, Farrant, Pammenter, Berjak, Black and Pritchard2002). Orthodox seeds, which are tolerant of desiccation, are among the few organisms that can survive reversible solidification (Walters, Reference Walters2015). Even though cytoplasm fluidity may be restored, functionality might not.
Solidification preserves by halting diffusive motion, which, in turn, profoundly slows most reactions and gives the impression of inertness. But limited mobility is not the same as immobility, and even in solids, molecules ‘relax’ into pores of the molecular matrix and ligands rotate and vibrate to inevitably contact and react with neighbouring molecules. Increased appression of molecules within solids may increase the driving force (i.e. chemical potential) of reactions that depend on localized concentration: these are the reactions believed to cause ageing in solid materials (Yoshioka and Aso, Reference Yoshioka and Aso2007; Bhattacharya and Suryanarayanan, Reference Bhattacharya and Suryanarayanan2009; Chang and Pikal, Reference Chang and Pikal2009). Shifts in structure and mobility properties of cytoplasm transitioning from fluid to solid and back to fluid are accompanied by changes in the mechanisms, as well as the rate, of chemical change. To reliably simulate ageing of dry seeds, accelerated conditions must reflect the structural context of solidified cytoplasm.
Mechanisms of chemical degradation have been reported in fluid and solid cells (Harman, Reference Harman2006; Kranner et al., Reference Kranner, Minibayeva, Beckett and Seal2010; Halliwell and Gutteridge, Reference Halliwell and Gutteridge2015; Sano et al., Reference Sano, Rajjou, North, Debeaujon, Marion-Poll and Seo2016), dried foods and pharmaceuticals (e.g. Chang and Pikal, Reference Chang and Pikal2009), paper and plastics (Kato and Cameron, Reference Kato and Cameron1999; Singh and Sharma, Reference Singh and Sharma2008) and ancient materials (Threadgold and Brown, Reference Threadgold and Brown2003). Cross-linking and fragmentation appear to be common features of degradation of organic molecules across these different materials and fluidity states. Therefore, in a compositionally complex material like cytoplasm, assays that broadly monitor these types of reactions may detect a stronger degradation signal than what can be detected by tracking a specific molecule (Halliwell and Chirico, Reference Halliwell and Chirico1993; Nyström, Reference Nyström2005; Mira et al., Reference Mira, González-Benito, Hill and Walters2010; Fleming et al., Reference Fleming, Richards and Walters2017, Reference Fleming, Patterson, Reeves, Richards, Gaines and Walters2018a,Reference Fleming, Hill and Waltersb). Applying that logic, we assayed loss of RNA integrity in seeds stored for decades (Fleming et al., Reference Fleming, Richards and Walters2017, Reference Fleming, Patterson, Reeves, Richards, Gaines and Walters2018a,Reference Fleming, Hill and Waltersb). In fluid cytoplasm, RNA is easily damaged; once damaged, it is degraded by RNAses and replaced by new transcripts (Wurtmann and Wolin, Reference Wurtmann and Wolin2009). However, in dry seeds, RNase activity appears low (Fleming et al., Reference Fleming, Patterson, Reeves, Richards, Gaines and Walters2018a). Instead, RNA molecules fragment at random during seed storage, and persist in a fragmented state. This can be detected by assaying total cellular RNA integrity using RIN values (RNA Integrity Number) or by using RNAseq methods to track the fate of specific RNA transcripts (Fleming et al., Reference Fleming, Richards and Walters2017, Reference Fleming, Patterson, Reeves, Richards, Gaines and Walters2018a,Reference Fleming, Hill and Waltersb). RIN appears to decrease linearly with seed storage time, which provides substantial advantages in assessing degradation kinetics (Fleming et al., Reference Fleming, Richards and Walters2017, Reference Fleming, Hill and Walters2018b).
The purpose of this study is to further probe RNA integrity as a seed ageing marker. Previous work demonstrated that, during seed ageing, RNA fragmentation occurs before viability declines and continues after all seeds have died. Hence, we are not seeking to correlate RNA integrity and viability directly, because the timelines for these responses are different. Instead, we propose the hypothesis that ageing rates for various responses, including viability loss and RNA degradation, are correlated. We manipulated ageing rates by applying temperature or moisture stresses. As these stresses also transition cytoplasm between fluid and solid states, we also explored how extreme conditions relate to target storage conditions that maintain dry cytoplasm in a solid state.
Materials and methods
Soya bean (cv Williams 82) seeds were received within 4 months of harvest over a period of 36 years and stored at 3–5°C and 30–50% relative humidity (RH) (seed water content ≈ 0.074 g H2O g−1 dry weight (dw)), except for 1982H and 1995H seeds, which were also stored at −18°C. This study used seed harvested in 2017 to 2014, 1995, 1989 and 1982 (harvest year is indicated by H after year, such as 2015H). All seeds were grown in the United States Midwest and came from the following sources: Missouri Foundation (2017H to 2014H), Illinois Foundation (1995H, 1989H), United States Department of Agriculture soya bean germplasm collection (1982H, PI 518671 and NSSL sample 203534.01) (Fleming et al., Reference Fleming, Richards and Walters2017). Most experiments began in 2016 or 2017 using 2014H and 2015H seeds; some confirmatory studies began in 2018 using 2017H seeds. There was no indication at the onset of experiments that the quality of 2014–2017H seeds had changed over the ~2–4 years of storage.
Stress treatments
Seeds were exposed to various stress intensities and durations and monitored for response using viability and RNA integrity assays. Storage at 5°C and 30–50% RH provided control conditions; time = zero indicates when seeds were moved to experimental conditions. Heat stress experiments began in April 2016 using temperatures from 22°C (i.e. room temperature) to 90°C. Moisture during heat stress was maintained at about 30% RH, monitored using RH data loggers (S-10 wireless sensor monitors, Omnisense LLC Ladys Island, SC, USA) or iButtons (ButtonLink, LLC Whitewater, WI). For 22, 35 and 45°C treatments, RH was controlled by storing seeds over saturated MgCl2 solutions; water content was 0.068, 0.061 and 0.053 g H2O g−1 dw, respectively. For the 60°C treatment, seeds were dried at room temperature and 14% RH (controlled by a saturated LiCl solution) to a water content of 0.047 g H2O g−1 dw and then sealed in foil laminate bags which included an iButton (RH recorded 30% RH). For the 80 and 90°C treatments, seeds were stored in open containers and allowed to dry to about 0.01 g H2O g−1 dw. Heat stresses were maintained until the sample completely died (e.g. 30 min at 90°C) or were used up during monitor testing (~2 years for some treatments at 22°C).
To achieve cold stress, seeds were placed in conventional freezers (−18 to −30°C) or cryogenic freezers (MVE ‘stock series’ cryotank with 1400 L LN capacity, Chart MVE Biomedical, New Prague, MN, USA) above liquid nitrogen vapour (−176°C). Long-term (>20 years) stress was applied to seeds that were first dried to about 0.065 g H2O g−1 dw (5°C and 20% RH). Short-term freezing stress was achieved by hydrating seeds to 0.25 or 0.35 g H2O g−1 dw and then placing them at −20 or −30°C overnight.
To apply high moisture stress, seeds were placed at 35°C and elevated RH ranging from 60 to 95%, controlled by saturated NaNO2, NaCl, KCl, KNO3 and K2SO4 solutions and monitored using RH data loggers (water contents were 0.10, 0.13, 0.15, 0.17 and 0.19 g H2O g−1 dw for 60, 75, 85, 90 and 95% RH treatments, respectively). Seeds were placed in plastic (Nalgene) desiccators above saturated salt solutions until viability was near 0%. High moisture treatments began in 2017 using 2015H seeds and moisture treatments of 60, 75 (two separate time courses) and 90% RH. The surprising results for 2015H seeds prompted further experiments in 2018 using 2017H seeds and additional 85 and 95% RH treatments. Microbial growth at RH ≥ 90% necessitated relatively short (≤21 d) exposure times.
Desiccation stress was applied by imbibing seeds harvested in 2015 for 24 or 48 h in excess water, a time sufficient for radicle protrusion to >2 mm (i.e. germination) in 50% and 100% of the seeds, respectively. Seed(ling)s were then re-dried under ambient lab conditions of 22°C and 30% RH for 1 d before testing for viability and RNA integrity.
Chlorine gas (Cl2) or UV-C exposure provided oxidizing stresses independent of moisture or temperature. Seeds harvested in 2015 were placed in a Cl2-filled chamber for 1–6 d, replenishing gas daily, as described for Arabidopsis seed sterilization (Lindsey et al., Reference Lindsey, Rivero, Calhoun, Grotewold and Brkljacic2017). Seeds were exposed to UV-C light (254 nm) by placing them within a Stratalinker® UV Crosslinker 2400 (Stratagene, Agilent Technologies, Santa Clara, CA, USA) (~4000 microwatts per cm2) for up to eight hours.
Viability assessments
Following stress, seeds were brought to ambient laboratory conditions overnight, and a sub-sample of 30–50 seeds was sown on damp paper towels and incubated at 25°C (16 h light, 8 h dark) for 7 d. Germination was scored as the proportion of seeds sown that produced a radicle >2 mm. Germination proportion data were fit to an Avrami kinetics model to describe curve shape and calculate P50 (time for the proportion of germinable seeds to decline to 0.5). To give an independent assessment of P50 and estimate experimental uncertainty, survival data were also fit to a logistic curve (Ballesteros et al., Reference Ballesteros, Hill, Lynch, Pritchard and Walters2019).
RNA integrity assessments
Five seeds were assayed for RNA integrity after each stress challenge. For each seed, a small portion (10–30 mg) of cotyledon was removed, pulverized with a hammer, and transferred to a micro-centrifuge tube containing 1–3 mg of polyvinylpyrrolidone-40 (Fisher Scientific, Fair Lawn, NJ, USA) and a #40 steel shot BB. Samples were frozen in LN2 and ground in a Retsch (Haan, Germany) Bead Mill at 30 oscillations s−1 for 2 min. RNA was extracted from ground samples using the Qiagen Plant RNeasy kit (Hilden, Germany), following the ‘difficult’ sample protocol and washing the column three times with Buffer RPE to reduce guanidine hydrochloride carry-over. All samples were eluted in 100 μl of nuclease-free water. Yield and purity were assessed with a Nanodrop 1000 spectrophotometer (Thermo Fisher Scientific, Wilmington, DE, USA). RNA was diluted to 2 ng μl−1 in nuclease-free water. RNA integrity was quantified using an Agilent Bioanalyzer (Waldbronn, Germany), Agilent RNA 6000 Pico chips, and the Plant RNA Pico assay (Agilent 2100 Expert software version B.02.08.SI648 R3), following the recommended protocols. Comparison of data collected from different RNA 6000 Pico chips was facilitated by peak alignment using the RisaAligner program (Navarro et al., Reference Navarro, Fabrègue, Scorretti, Reboulet, Simonet, Dawson and Demanèche2015).
Statistical analyses
Most comparisons (e.g. linear regressions) used general descriptive statistics available in Excel spreadsheet packages. P50 was calculated from linear regressions of double log plots (Avrami models) using Excel software and the R statistical function dose.p with time as the independent variable (Crawley, Reference Crawley2007; R Core Team, 2018; Ballesteros et al., Reference Ballesteros, Hill, Lynch, Pritchard and Walters2019). An analysis of covariance in R, with stepwise simplification of model variables (i.e. cohort, temperature or RH) was used to compare slopes and intercepts (Crawley, Reference Crawley2007; R Core Team, 2018).
Results
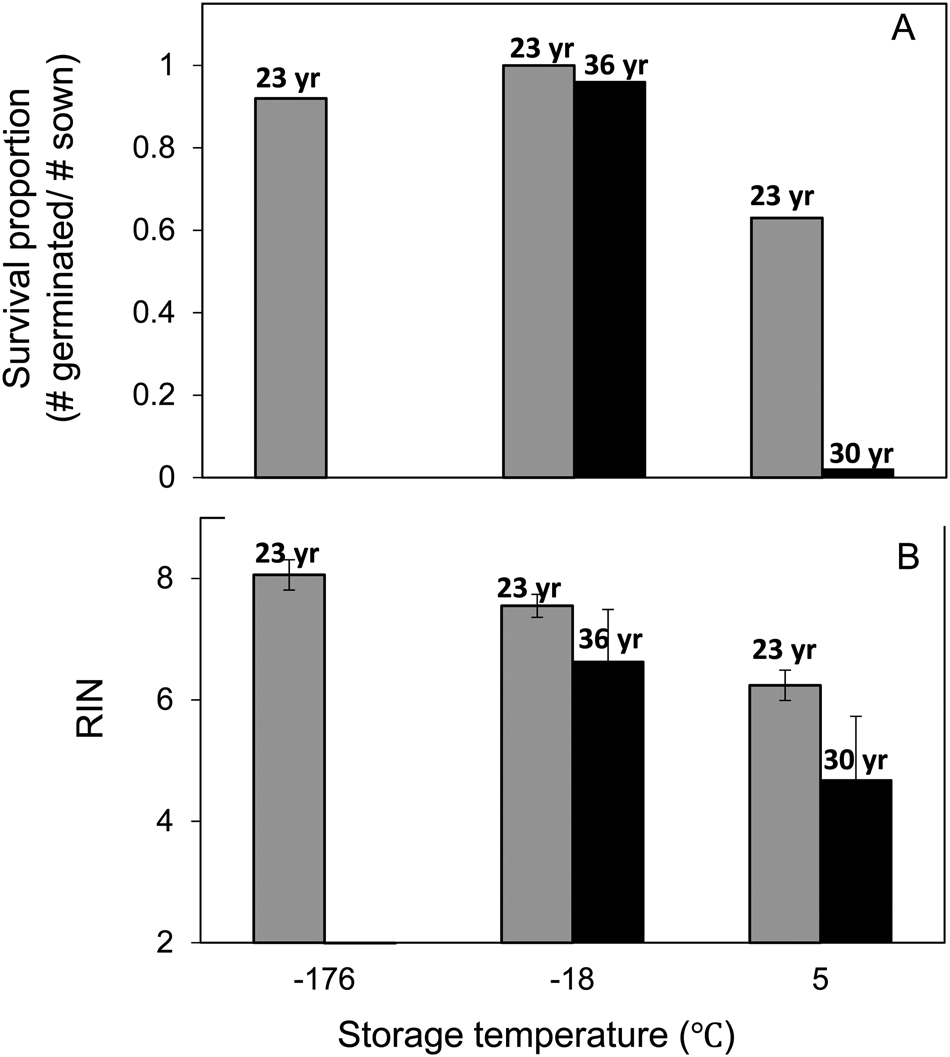
Recently received soya bean seeds germinated rapidly (within 24–48 h) and produced healthy roots within 7 d of planting (Fleming et al., Reference Fleming, Richards and Walters2017). Initially, germination proportion was between 1.00 and 0.96 for all seed lots. In 2018, 1995H and 1982H seeds (23 and 36 years old, respectively), stored at −18 and −176°C were healthy (i.e. germination proportion ≥ 0.92), while there was significant mortality in the1995H accession stored at 5°C (germination proportion = 0.63) (Fig. 1A). Seeds stored for 29 years at 5°C (1989H) were almost completely dead (germination proportion = 0.02).
Effects of low temperature for extended periods on seed viability (A) and RNA integrity (B). Soyabean seeds, harvested in 1995 (23 years), 1989 (30 years) and 1982 (36 years), were stored in the refrigerator (5°C), freezer (−18°C) and vapour above liquid nitrogen (−176°C) and assayed in 2018. Data are not available for Williams 82 stored at −176°C for more than 23 years. P50 is projected at about 7272 d (20 years) for 5°C storage based on P50 values measured for the 1995H and 1989H cohorts (Table 1) and 22,458 d (62 years) for seeds stored at −18°C, based on calculations of germination data from a range of cohorts (Fleming et al., Reference Fleming, Richards and Walters2017, Reference Fleming, Hill and Walters2018b). For each storage temperature, RIN was lower in the older cohort. The daily rate of RIN decline was calculated as −2.7⋅10−4 and −7.7⋅10−5 RIN d−1 for 5 and −18°C treatments, assuming linear decline, an initial RIN of 7.7 and 2018 assessments of 1982H, 1989H and 1995H cohorts. Germination assays consisted of 35–50 seeds and RIN assessments used cotyledon slices from five separate seeds.

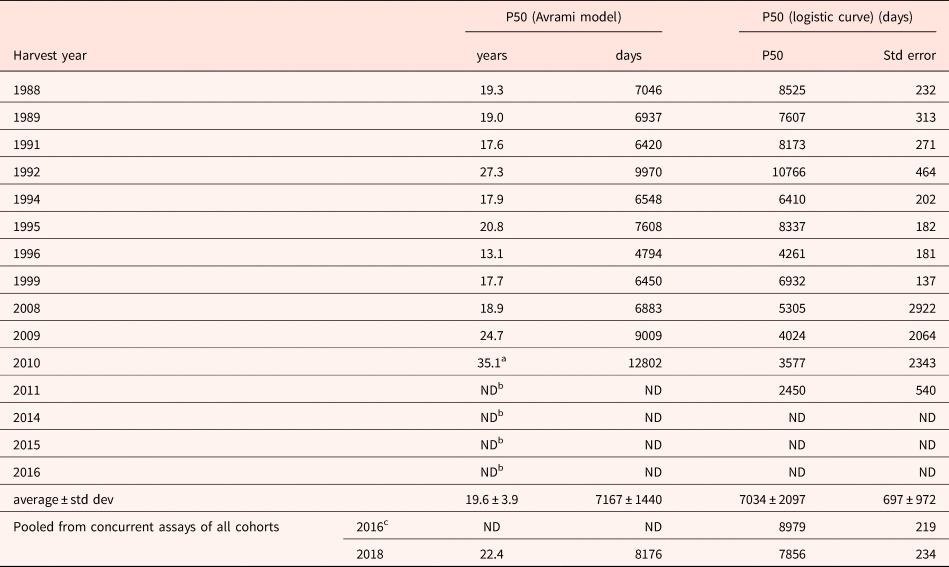
Variation in longevity of soya bean ‘Williams 82’ cohorts stored at 5°C and RH between 30 and 50%

Viability, measured as total germination, was monitored in seeds since receipt until 2018, and P50 values were calculated by fitting these time-course data to either Avrami or logistic curve fitting models (Ballesteros et al., Reference Ballesteros, Hill, Lynch, Pritchard and Walters2019). Listed P50 values describe the extent of observable deterioration within the cohort prior to stress treatments used in this paper. P50 values could not be calculated (or were not reliable) for cohorts harvested since 2010 (ND) because germination had not changed appreciably. The large standard error for P50 from the logistic function indicates high uncertainty for longevity in samples harvested since 2008. The average P50 (based on cohorts harvested in 2009 or before) is consistent for the two models (~19.5 years) and is about 5 years less than results achieved by pooled germination data among cohorts from a single germination assay in 2017 (Fleming et al., Reference Fleming, Richards and Walters2017, Reference Fleming, Hill and Walters2018b).
a Likely overestimated because germination proportion was >0.7 (i.e. less than 30% decline).
b Not determined because less than 20% decline in germination proportion.
c Germination data reported in Fleming et al. (Reference Fleming, Richards and Walters2017). P50 from Avrami analyses was not published.
In previous work, viability time courses were constructed from recent, concurrent germination tests of all cohorts in the collection, and longevity for the cultivar was calculated by fitting these data to Avrami or logistic functions and calculating the time for germination proportion to decrease to 0.5 (P50) (Fleming et al., Reference Fleming, Richards and Walters2017, Reference Fleming, Hill and Walters2018b). Using this method and 2018 germination monitoring data, the P50 for Williams ’82 seeds is estimated as 22.4 years (8176 d) and about 62 years (22,458 d) for seeds stored at 5 and −18°C, respectively (Table 1). An alternative method makes use of germination data accumulated over 30 years (not provided) to calculate P50 for each cohort during 5°C storage. Values for P50 for the 1989H and 1995H cohorts (used in Fig. 1) were 19.0 and 20.8 years (6937 and 7608 d), respectively, and P50 for other cohorts in the collection ranged from 13.1 years (1996H) to ~35 years (2010H, extrapolation of Avrami model) (summarized in Table 1). Viability had not declined sufficiently in 2018 to estimate P50 values for recently harvested seeds (2011H–2017H) from Avrami or logistic models (Fleming et al., Reference Fleming, Richards and Walters2017). The long period of high germination in seeds stored in the refrigerator or freezer exemplifies the asymptomatic phase of seed ageing and underscores the difficulty of acquiring data to validate models of deterioration at target conditions.
RNA extracted in 2016 from 2014H and 2015H cotyledons had high integrity, with average RIN = 7.7 and standard deviation (std dev) of 5 replicates = 0.38 (time = 0 in Fig. 2B) (Fleming et al., Reference Fleming, Richards and Walters2017) (hereafter expressed using RIN = 7.7 ± 0.38 notation). RNA extracted in 2018 from 2017H cotyledons was a bit lower quality, with RIN = 7.0 ± 0.72 (t = 0 in Supplementary Fig. S1). RNA quality varied by storage temperature and time in seeds that had been stored at ≤5°C for 23, 30 or 36 years (Fig. 1B). For example, RIN values for the 1995H cohort (stored 23 years) ranged from 8.06 ± 0.25 (−176°C) to 6.24 ± 0.57 (5°C) and RNA was more degraded in seeds stored at 5°C for 29 years (1989H, RIN = 4.68 ± 1.05). The changes in RIN over decades of seed storage allow us to calculate the RNA degradation rate as −0.09 RIN yr−1 (−2.6 × 10⁻⁴ RIN d−1) and −0.028 RIN yr−1 (−7.7 × 10⁻⁵ RIN d−1) for 5°C and −18°C storage, using the slopes of linear regressions of RIN versus storage time with initial RIN constrained to 7.7 (r 2 = 0.92 and 0.83; P < 0.005). In other words, it should take about 4 years to detect significant differences in RIN for soya bean seeds stored at 5°C, assuming a degradation rate of about −0.1 RIN yr−1, a sample size of five seeds and a standard deviation of 0.4.
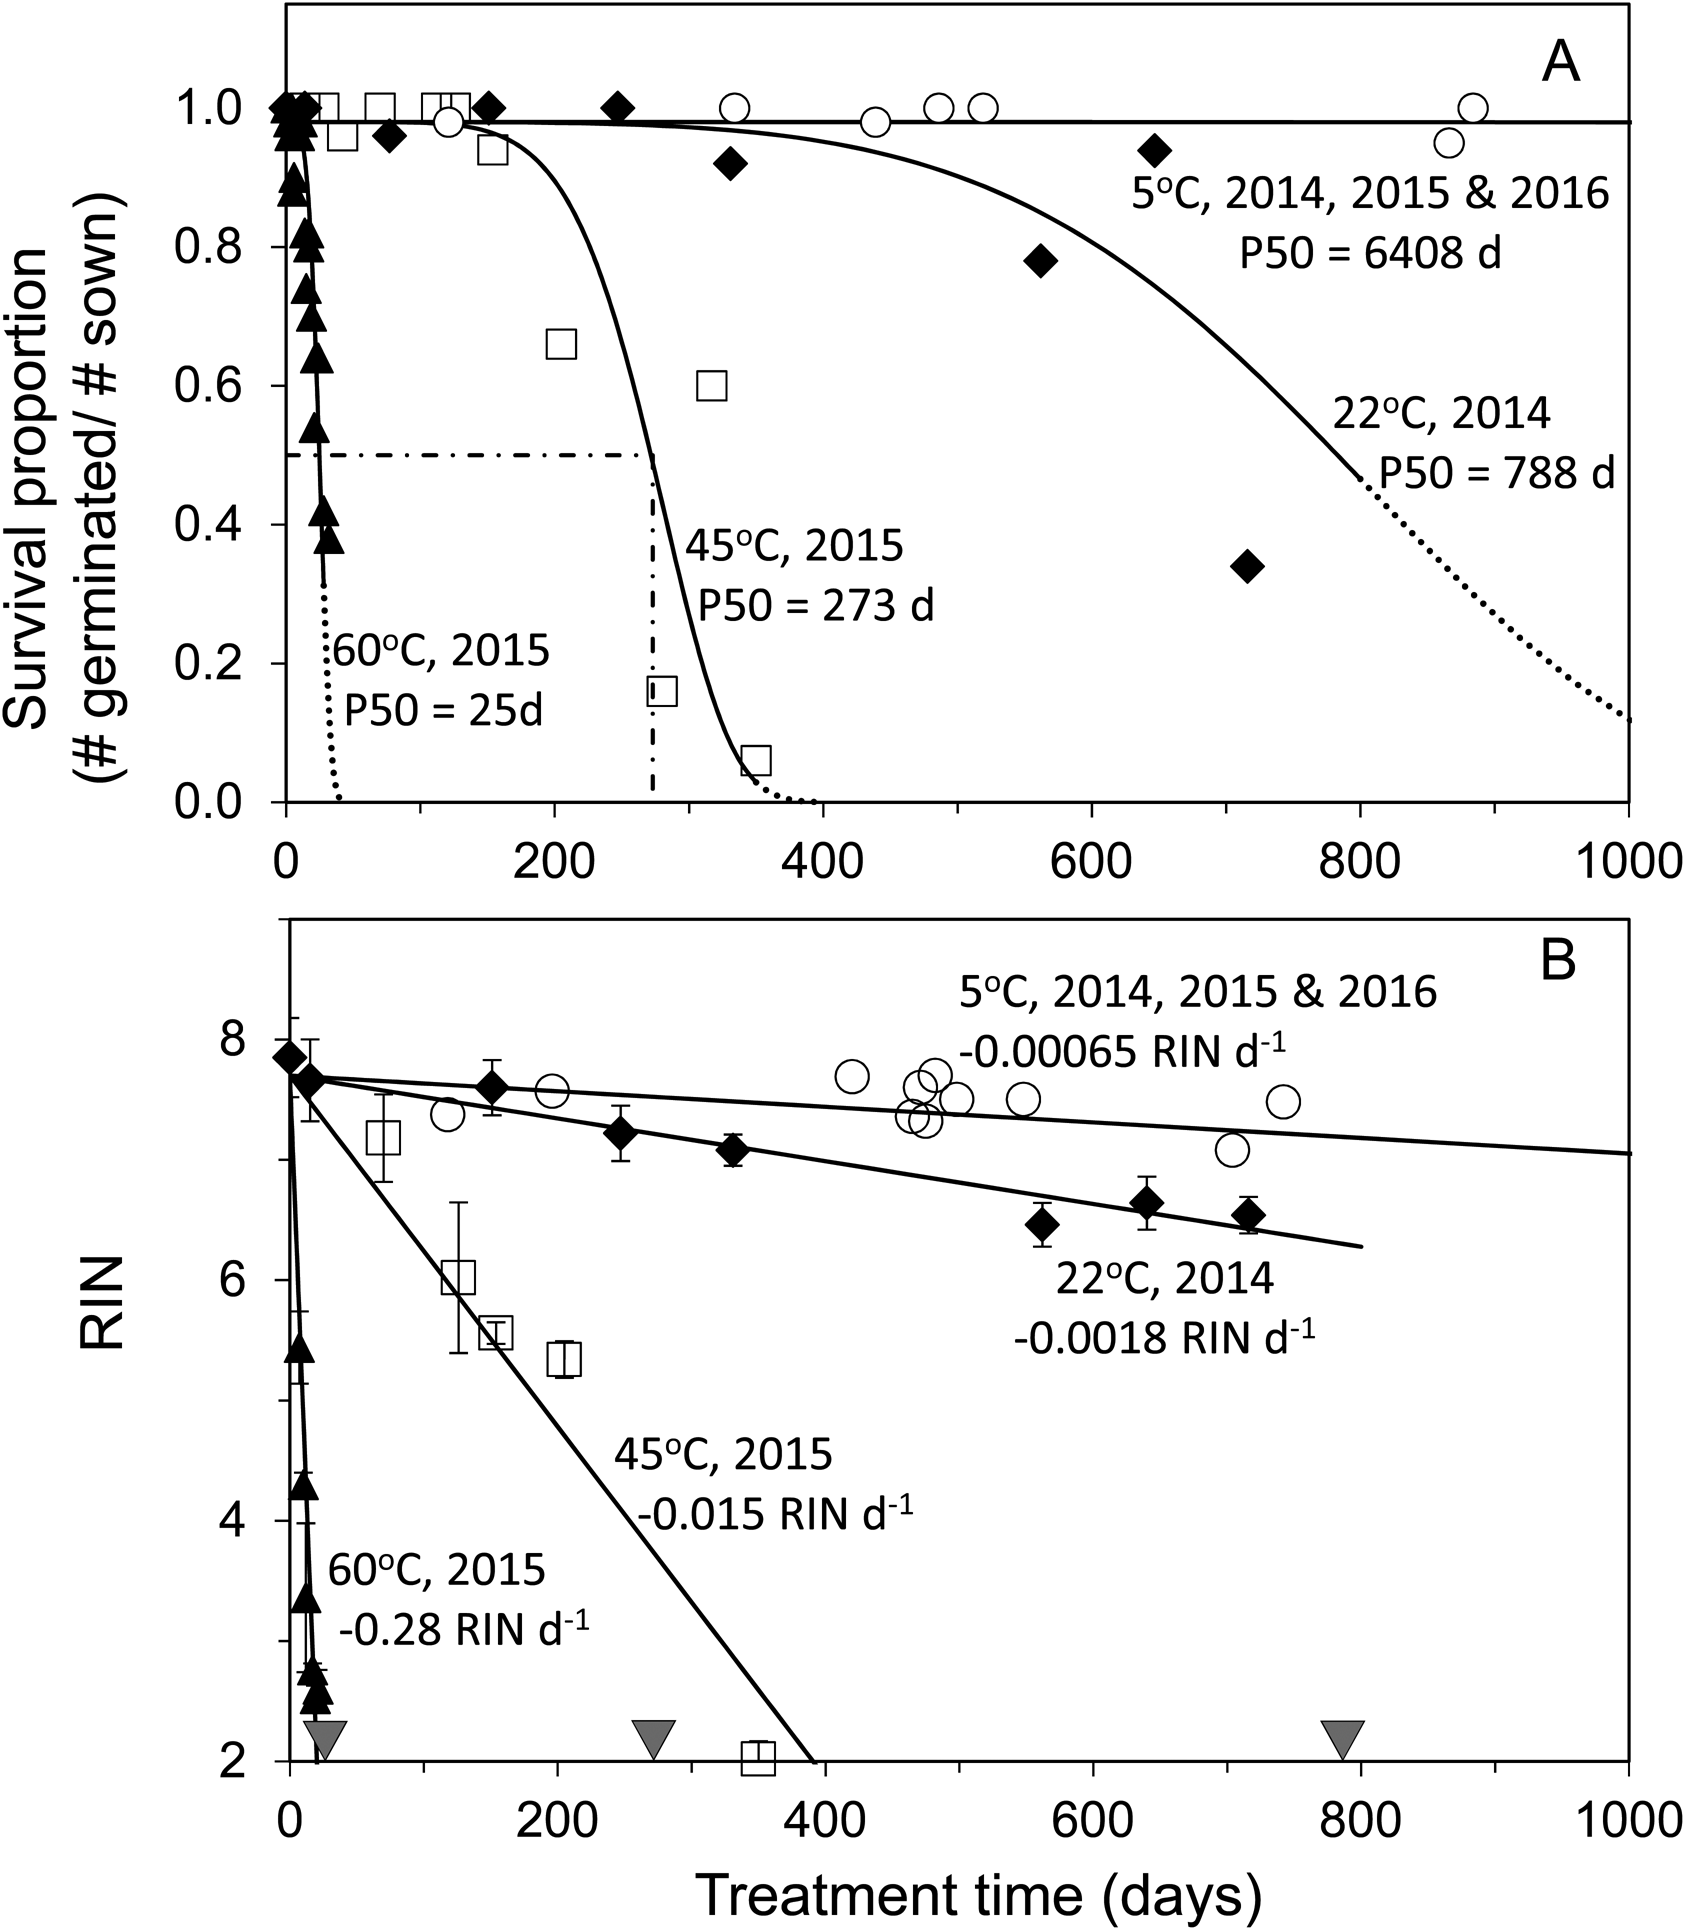
Effects of elevated temperature on seed viability (A) and RNA integrity (B). Soya bean seeds, harvested in 2014 or 2015, were placed at indicated temperatures (5°C is control) in 2016 and periodically assayed. Curves represent Avrami (A) or linear regression (B) models fitted to data, with initial values constrained to 0.98 and 7.7 for viability and RIN, respectively; solid curves are within time-frame of collected data and dashed lines are extrapolations of the Avrami model. The dot-dashed lines in A represents a typical calculation of P50, done for the 45°C treatment; the triangles on the x-axis of B mark P50 calculated for 60, 45 and 22°C. P50 for 5°C is probably near 7300 d (20 years) (Table 1). Time-course relationships are significant at the P < 0.001 level for all responses except viability change at 5°C. The daily rate of RIN decline (indicated) was calculated from the slope of regression lines in B, with data pooled for 2014H, 2015H and 2016H cohorts stored at 5°C. Moisture levels were controlled to about 30% RH (see methods). Number of seeds used in germination assays ranged from 25 to 50. Error bars around RIN values are the calculated standard deviation of five different soya bean cotyledons.

Responses to heat stresses
Extreme conditions may simulate ageing of dry seeds and provide a way to condense ageing experiments into more experimentally tractable time-frames. We tested how increased storage temperature affected rates of loss of viability and RNA integrity. Storage at 22°C (2014H) to 60°C (2015H) started in 2016, and it took about 788 and 25 d, respectively, for half the seeds to die (Fig. 2A). An initial asymptomatic period, with no change in viability, was observed after transfer to higher temperatures: at 60°C, this period lasted 10 d. No loss in viability was observed for seeds of these cohorts stored at 5°C for over 1400 d (only 1000 d shown).
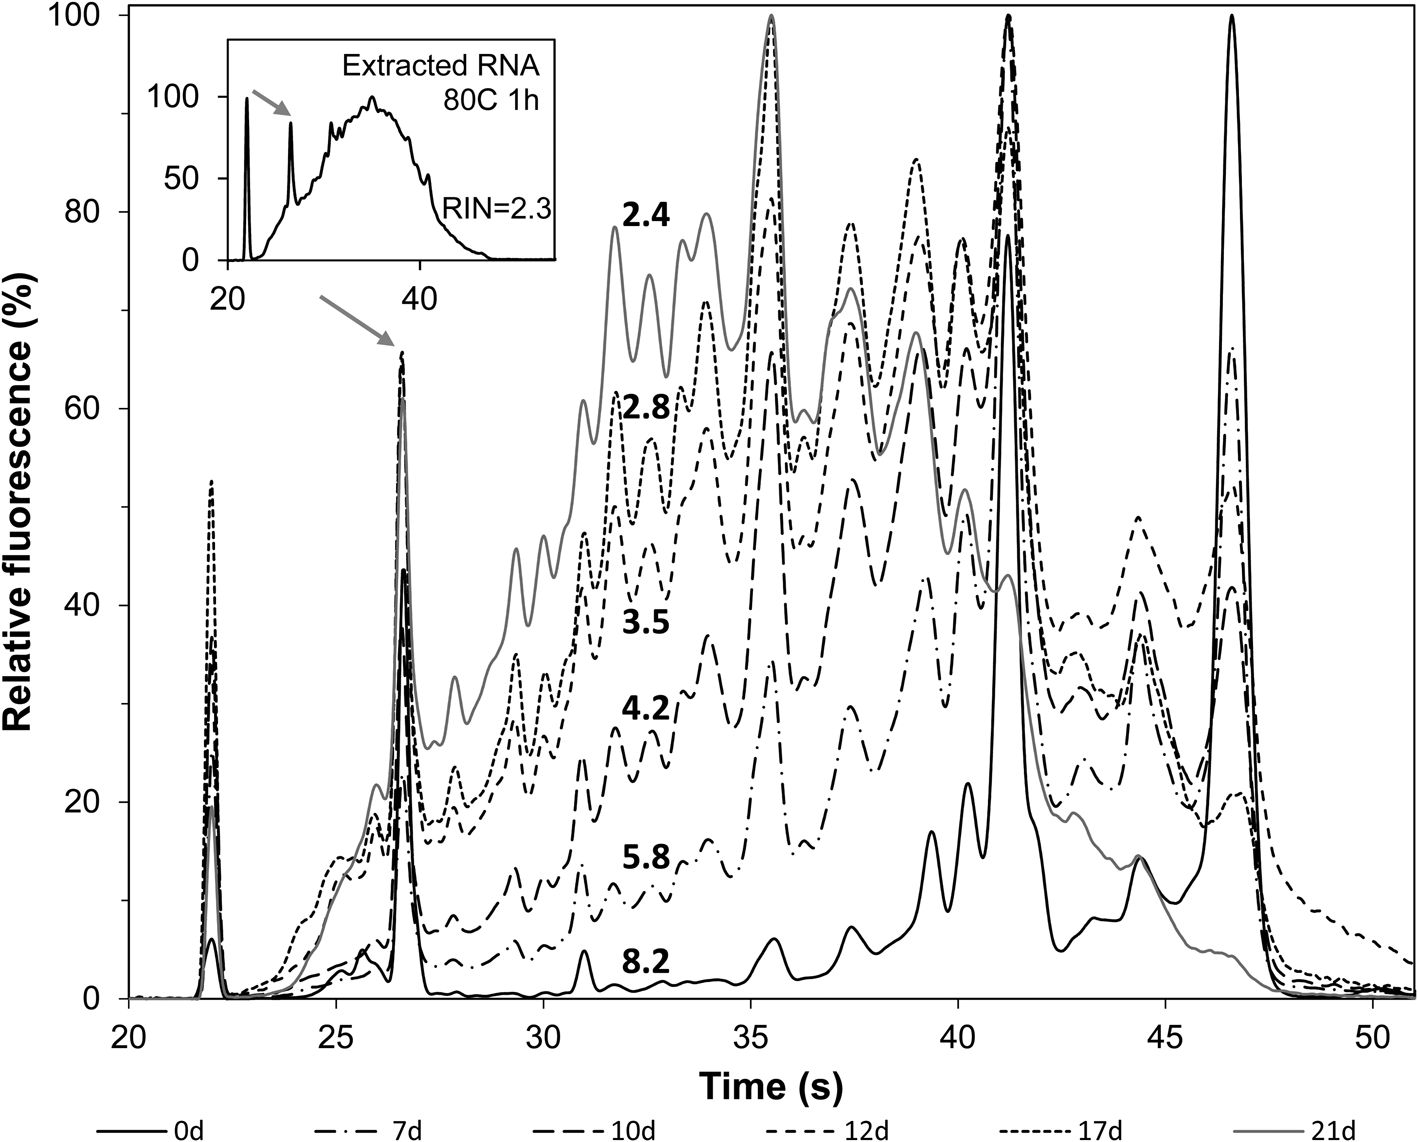
RNA integrity of heat-stressed seeds declined with time at all temperatures studied (Figs 2B–4). Changes to RNA electrophoretic patterns followed similar patterns as previously reported for seeds stored at 5°C (Fig. 3, Fleming et al., Reference Fleming, Richards and Walters2017, Reference Fleming, Hill and Walters2018b). In particular, rRNA peaks (18S and 25S, represented by peaks at 42 and 47 s) were initially prevalent and dominated the signal, but diminished with increasing exposure time. Concomitantly, more RNA eluted earlier (28–37 s), and increasing heights of distinct peaks at, for example, 35 or 37.5 s suggests fragmentation of the larger molecules. The RIN calculation assesses both the ratios of the two rRNA peaks and the prevalence of low-molecular-weight RNA (Schroeder et al., Reference Schroeder, Mueller, Stocker, Salowsky, Leiber, Gassmann and Ragg2006). RIN decreased linearly with time (r 2 > 0.95 for temperatures ≥ 22°C) and decreased faster at higher temperatures [slopes of the linear correlation between RIN and time increased about tenfold for every +20°C (rates indicated in Fig. 2B)]. The RNA degradation rate from seeds harvested over the last 4 years and stored at 5°C (control) was about −0.24 RIN yr−1 (calculated using data from Fig. 2B, constraining RIN at time = 0 to 7.7, r 2 = 0.79; P < 0.001; slope = −6.5 × 10⁻⁴ RIN d−1), which is a similar order of magnitude as the estimated rate of −0.1 RIN yr−1 for pooled 1995H and 1989H cohorts stored at 5°C (Fig. 1B). The value of RIN at P50 (indicated by triangles on x-axis of Fig. 2B) ranged from 6.3 (22°C) to 0.6 (60°C), with no apparent relationship with temperature.
Effects of heating seeds on the quality of subsequently extracted RNA. Seeds harvested in 2015 were exposed to 60°C for 12–21 d as described in Fig. 2; RNA was then extracted and electrophoresed (main panel). RIN values are indicated by numerals. Distinct peaks at 41 and 46 s are rRNA and increasing signal at shorter times with greater exposure time indicates an increase in lower-molecular-weight molecules. Electropherograms from unstressed seeds were published previously (Fleming et al., Reference Fleming, Richards and Walters2017, Reference Fleming, Patterson, Reeves, Richards, Gaines and Walters2018a). An electropherogram of extracted RNA in water, exposed to 80°C for 1 h (inset), indicates complete degradation, with only the most quickly eluting RNA peak (arrows) presenting a clearly distinct signal (summarized in Supplementary Table S1).

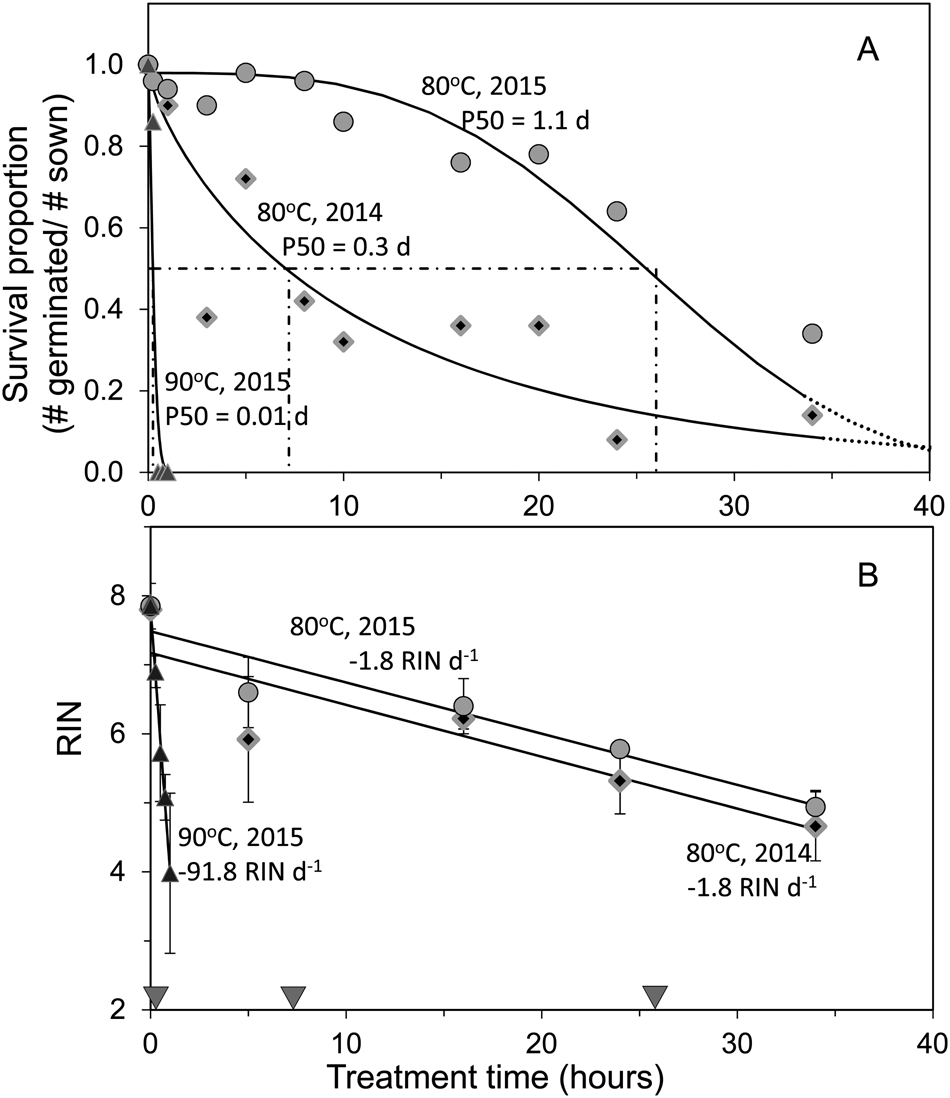
To further reduce the time required to kill dry seeds, we exposed them to 80 and 90°C (Fig. 4). At the onset of the imposed stresses (i.e. time = 0), 2015H and 2014H seeds had high germination potential and RIN, and did not appear appreciably different. Seeds (2015H) placed at 90°C were killed within 30 min and RIN declined to <4 within 60 min. Viability of 2014H seeds exposed to 80°C also decreased almost immediately (P50 = 0.3 d), while this response was delayed 8–10 h in the 2015H seeds (P50 = 1.1 d). Despite differently shaped viability deterioration curves at 80°C (Fig. 4A), RIN declined linearly with time (Fig. 4B, as also shown in Fig. 2B), and at the same rate for both cohorts (slope = −1.8 RIN d−1, not different at P ≫ 0.1). The intercepts of the linear regressions differed by 0.31 (7.48 and 7.17 for 2015H and 2014H, respectively), which could be accounted for by 1 year's deterioration at 5°C (−0.24 RIN yr−1, Fig. 2B); however, the difference in intercepts was not statistically significant in our experiment (P > 0.05). In these experiments, RIN values at P50 (indicated by triangles on x-axis of Fig. 4B) were between 5.6 and 6.9.
Effects of 80 and 90°C treatments on seed viability and RNA integrity. Soya bean seeds, harvested in 2014 or 2015, were placed at indicated temperatures in 2017 and assayed for (A) proportion of germinating seeds and (B) RNA integrity over 1.5 d or 1 h. Curves represent Avrami (A) or linear regression (B) models fitted to data; solid curves are within time-frame of collected data and dashed lines are extrapolations of the Avrami model. The dot-dashed lines in A represent the calculation of P50 and the inverted triangles on the x-axis of B mark that P50. Error bars around RIN values are the calculated standard deviation measured from slices of five different cotyledons. Germination assays usually consisted of 50 seeds. Time-course relationships are significant for all treatments. This graph uses a time scale of hours for clarity; however, P50 and RNA degradation are expressed in units of days to be consistent with other treatments.

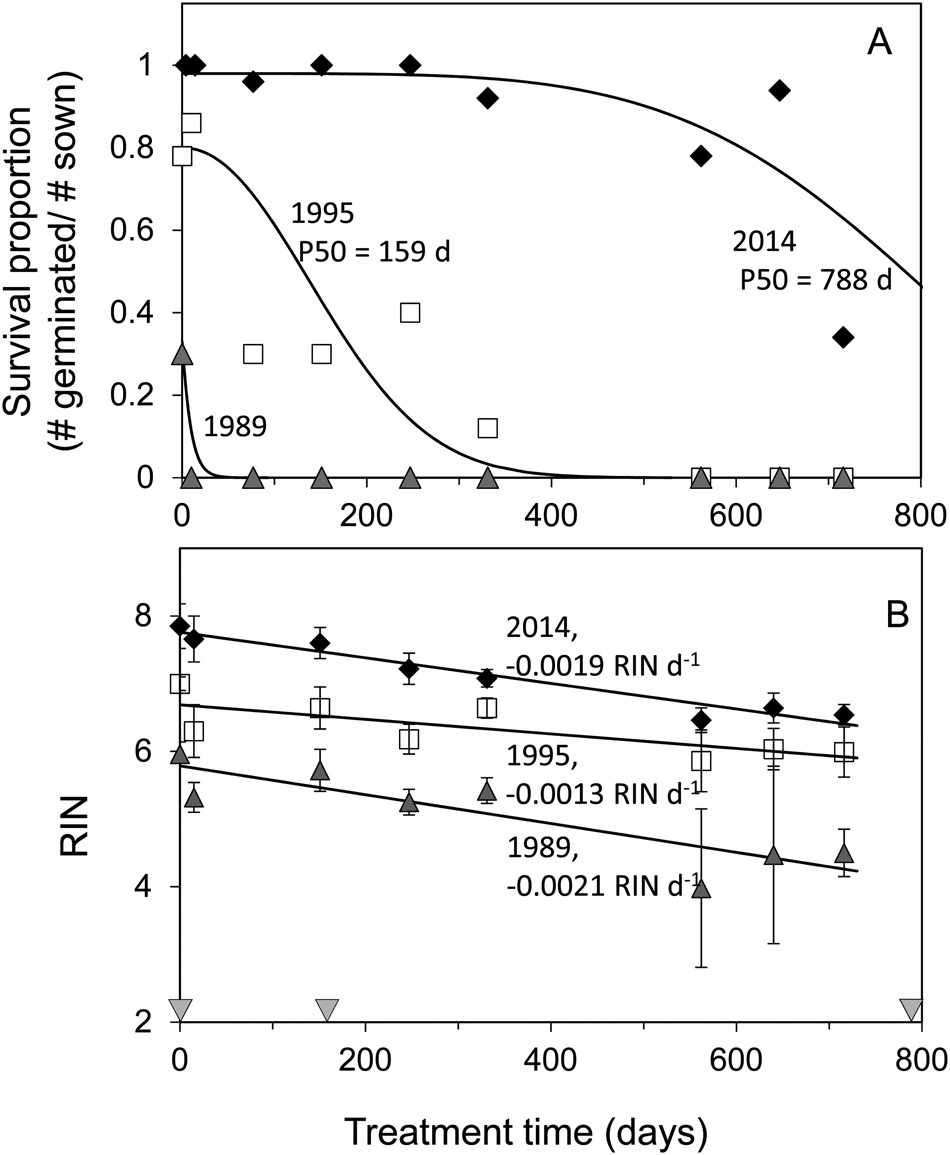
To further probe seed responses (i.e. P50 and RNA degradation rates) to increased temperature among cohorts, we compared degradation rates of 1989H, 1995H and 2014H seeds that were moved simultaneously from 5 to 22°C (Fig. 5). At the onset of the experiment in 2016, 2014H seeds showed no signs of deterioration; 1995H seeds were near the threshold marking rapid loss in viability; and 1989H seeds were well past P50 (calculated as 19.0 years, Table 1). The 1995H seeds died rapidly when transferred to the higher temperature, eliminating evidence of any remaining asymptomatic ageing (Fig. 5A). Despite the different patterns of viability loss, changes to RNA integrity appeared linear in the three cohorts (Fig. 5B). The slopes of the regressions between RIN and treatment time ranged from −1.3⋅10−3 to −2.1⋅10−3 RIN d−1 (0.5 to 0.8 RIN yr−1) and were not significantly different (P > 0.05), though it is noteworthy that 1995H seeds appeared more robust than other cohorts based on higher P50 (Table 1) and slightly slower rate of RIN decline (Fig. 5B). The intercepts of the regressed relationship decreased from 7.76 to 6.69 to 5.79 for the 2014H, 1995H and 1989H cohorts, respectively, with values between cohorts being significantly different (P < 0.01), confirming that seed quality among cohorts was different when the 22°C experiment began. Our collection of similarly treated cohorts, with associated P50 values, will help address questions about variation in longevity responses.
Effect of increase in storage temperature on the trajectory of viability loss (A) and rate of RIN decline (B). Samples from indicated harvest year were removed from 5°C storage and placed at 22°C (room temperature) and 33% RH. Data for 2014 are the same as those presented in Fig. 1. The curves in A are Avrami models fit to germination data with time = 0 being when seeds were switched to 22°C and maximum germination constrained to 0.98, 0.80 and 0.33 for 2014, 1995 and 1989 cohorts, respectively. Lines in B are linear regressions of RIN versus time data. Error bars around RIN values are the calculated standard deviation measured from slices of five different cotyledons. The slope of the regression is indicated as rate of change of RIN. For comparison, the rate of RNA degradation at constant 5°C (i.e. no switch to higher temperature) was about five times less than the 22°C treatment (compare with Figs 1B, 2B).

Responses to high moisture treatments
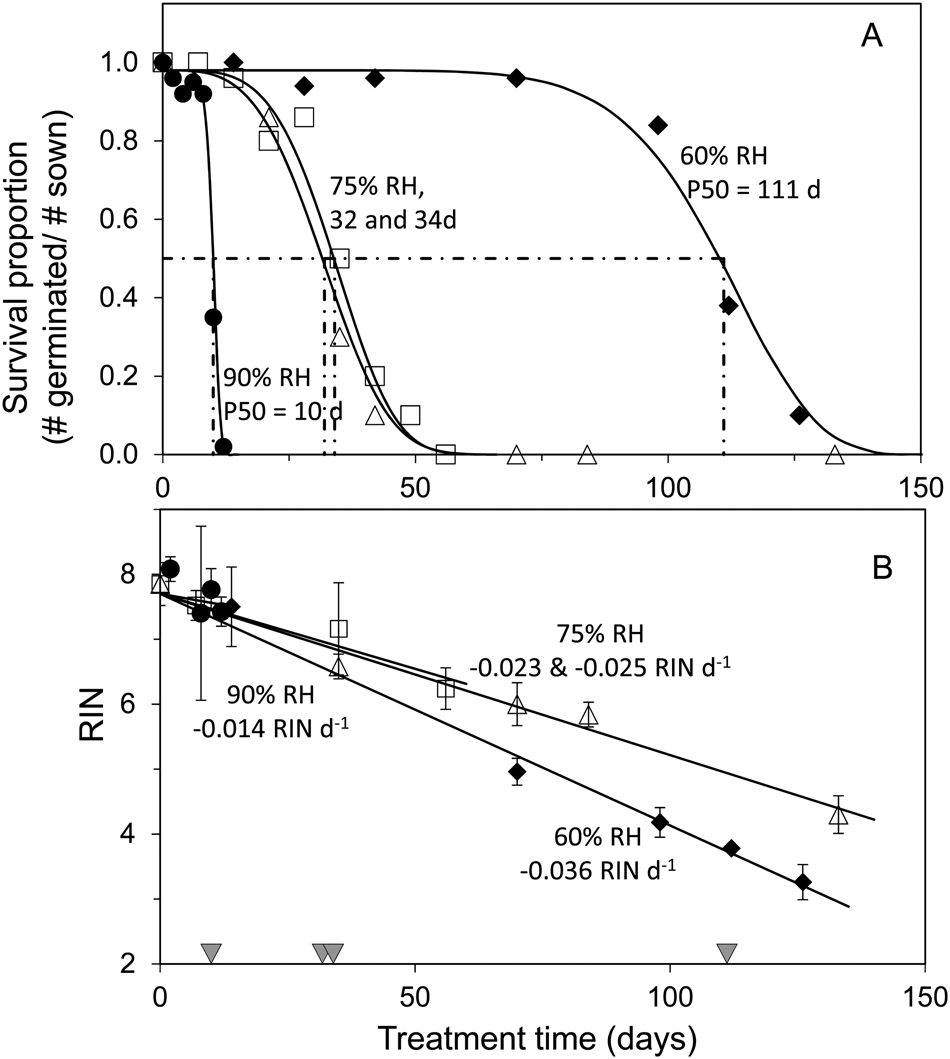
Rate of viability loss of soya beans increased by an order of magnitude when RH increased from 30% to between 60 and 90%: P50 was 111, 33 and 10d for 2015H seeds stored at 60, 75 and 90% RH (35°C), respectively (Fig. 6A, consistent results for 2017H are shown in Supplementary Fig. S1A).
Effects of storage RH on seed viability loss (A) and RNA integrity (B). Samples harvested in 2015 were placed at 35°C and indicated RH. Error bars around RIN values are the calculated standard deviation measured from slices of five different cotyledons. The number of seeds used in germination assays ranged from 20 to 30. Curves represent Avrami (A) or linear regression (B) models fitted to data, with initial values constrained to 0.98 and 7.7 (as in Fig. 1B), respectively. The dot-dashed lines in A represent the calculation of P50 for each RH treatment and the inverted triangles on the x-axis of B mark that P50. The slope of the regression (i.e. the rate of change of RIN) is indicated. The effect of time is significant at P < 0.001 for all treatments except RIN decline of seeds placed at 90% RH, which is not significant (but monitoring only lasted 12 d due to fungal contamination). This experiment was repeated using 2017H seeds (see Supplementary Fig. S1).

RIN declined linearly with time in seeds exposed to elevated RH (Fig. 6B). Unlike P50, there were no significant or consistent effects of RH on RNA integrity. RIN declined at rates between −0.014 and −0.036 RIN d−1 for 60 and 90% RH treatments in 2015H seeds (Fig. 6B) and between −0.039 and −0.049 RIN d−1 in 2017H seeds (Supplementary Fig. 1B). RIN decreased at a rate of −0.08 RIN d−1 in 2017H seeds exposed to 95% RH; the experiment was abandoned after 21 d because the seeds were moldy.
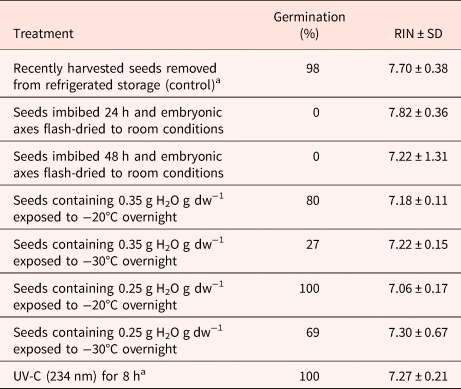
Elevated seed water content had major short-term effects on viability responses to dehydration or freezing stresses. Embryonic axes imbibed for 24 or 48 h were killed by drying them to 30% RH (Table 2), while this RH had no effect on unimbibed seeds. A high proportion of seeds that were hydrated to 0.25 or 0.35 g H2O g−1 dw (~90 and 95% RH at room temperature) died upon an overnight exposure to −20 or −30°C, whereas most dry seeds survived for decades at −18 ± 3°C (compare Table 2 and Fig. 1A). Despite the major effects on seed viability, these stresses did not reduce RIN (Table 2).
Effects of low moisture or temperature stresses on viability and RIN of imbibed seeds

RNA was extracted from embryonic axes for desiccation treatments and cotyledons for control, freezing stresses and UV-C exposure.
a Results provided for comparative purposes. Seeds were not imbibed prior to this treatment.
Responses to oxidizing agents
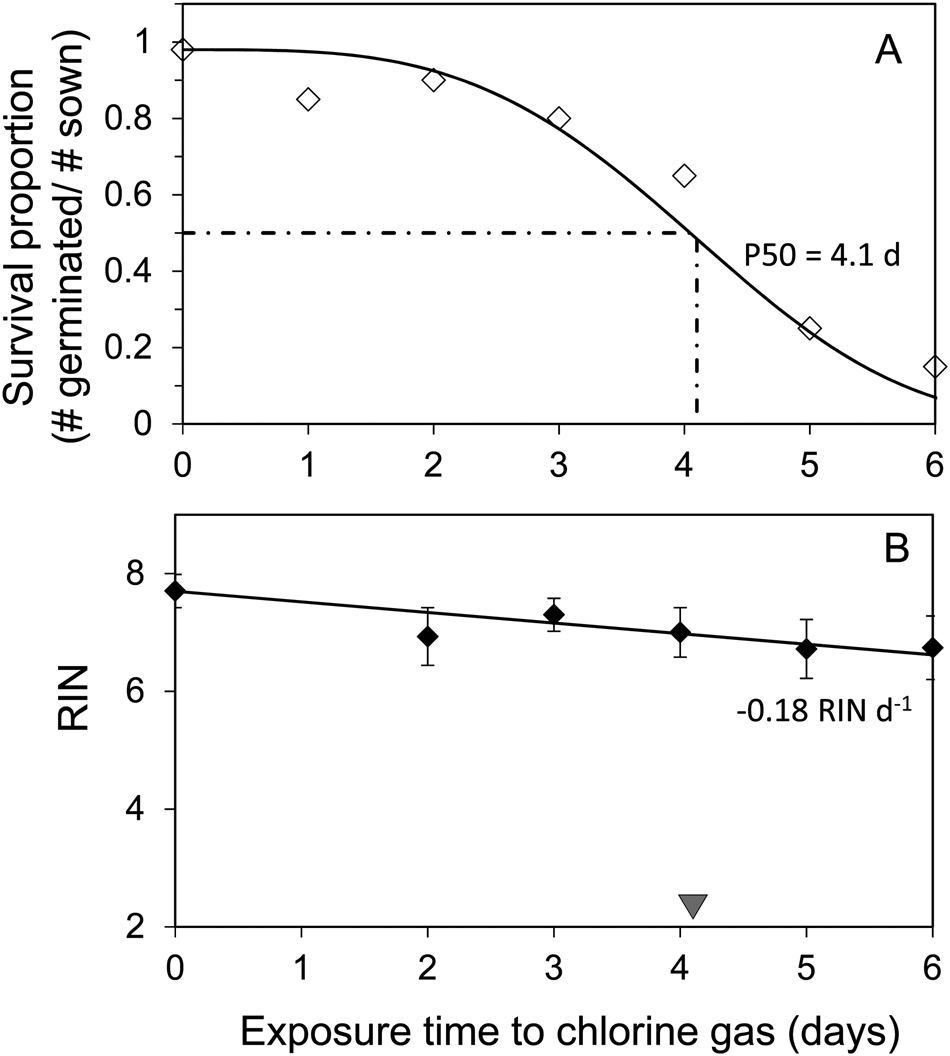
Chlorine gas was used to simulate the role of oxidizing agents associated with cellular ageing. Both viability and RIN decreased when soya bean seeds were exposed to Cl2: P50 = 4.1 d; RNA degraded at −0.18 RIN d−1 (Fig. 7). Eight hours of UV radiation did not demonstrably affect viability or RIN (Table 2).
Effects of seed exposure to chlorine gas on seed viability loss (A) and RNA integrity (B). Samples harvested in 2015 were dried to 33% RH and then sealed in a glass desiccator containing chlorine gas and stored at room temperature (22°C) for 1–6 d. Error bars around RIN values are the calculated standard deviation measured from slices of three to seven different cotyledons. The number of seeds used in germination assays ranged from 20 to 30. Curves represent Avrami (A) or linear regression (B) models fitted to data, with initial values constrained to 0.98 and 7.7 (as in Fig. 1B), respectively. The dot-dashed lines in A represent the calculation of P50 and the inverted triangle on the x-axis of B marks that P50. The slope of the regression (i.e. the rate of change of RIN) is indicated. The effect of time is significant at P < 0.001 for both responses (P = 0.022 for RIN decline when the intercept is not constrained to 7.7). For comparison, the slope of RIN decline in seeds stored under similar conditions without chlorine gas was −0.0018 RIN d−1 (Fig. 2B).

Calculating ageing rate
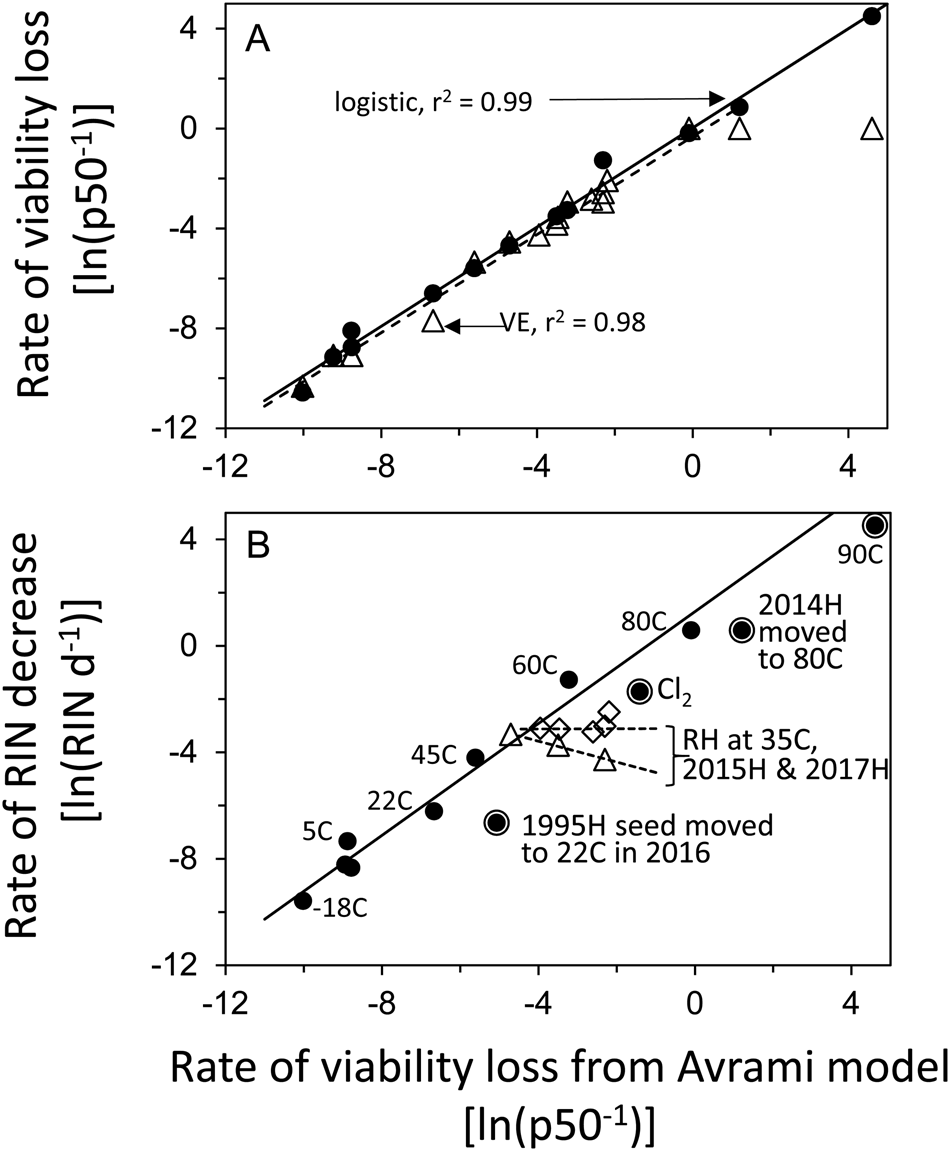
Calculations of P50 may approach infinity in slowly ageing materials, often resulting in the exclusion of important data in analyses or high error when including slowly ageing materials in correlations. To address this issue, we converted P50 to ageing rate, expressed as the reciprocal, P50−1. Ageing rate has a definitive lower limit of 0. For example, negligible viability loss of seeds stored at −18°C for 36 years (Fig. 1A, legend) gives high uncertainty of P50, but the ageing rate is confined between 7.7⋅10−5 d−1 and 0. There was a high correlation between ageing rates (P50−1) calculated using the Avrami or logistic curve-fitting algorithms (Fig. 8A, slope = 0.99, r 2 = 0.99, P ≪ 0.001). These ageing rates also strongly correlate with P50−1 values calculated using the VE model (RBG Kew, 2018) and soya bean coefficients (Ellis et al., Reference Ellis, Hong and Roberts1988) for a viability decrease from 98 to 50%, RH = 30% and temperature as indicated. Uncertainty of P50−1 is high when ageing is very fast [ln(p50−1) > 4 on x-axis of Fig. 8A], and, consistently, correlation between experimental and modelled P50−1 is strengthened by omitting the 90°C treatment (Fig. 8A, slope = 0.97, r 2 = 0.98, P ≪ 0.001).
Correlations among assessed rates of viability loss (A) and measured rates of RIN decline (B). The rate of viability loss is quantified as the reciprocal of P50 and values obtained from fitting the Avrami model are used on x-axis. The rates of viability loss from experimental treatments, calculated either from Avrami or the logistic function in R (solid circles), are highly correlated (slope = 0.99, r 2 = 0.99). These experimental values also correlate well with predictions calculated using the VE module on the Kew Seed Information Database (RBG, 2018, visited 15 Dec 2018) using temperature as indicated and water contents corresponding to soya bean seeds at 27% RH or as measured for treatments at RH ≥ 60% (open triangles) [slope = 0.98, r 2 = 0.98, excluding the 90°C (fastest ageing) treatment]. In panel B, the rate of viability loss also correlates with the rate of RIN decline for all treatments (slope = 0.89, r 2 = 0.92, P ≪ 0.0001). The correlation is stronger for temperature treatments under dry conditions, excluding pre-aged seeds (encircled or open points) (slope = 1.05, r 2 = 0.98, P = 0.0001, solid line). RIN decline in seeds placed at RH ≥ 60% did not correlate strongly with P50−1 for either cohort tested: 2015H [measured in 2017 (Fig. 6B)]: slope = −0.39, r 2 = 0.99, P = 0.06; 2017H [measured in 2018 (Supplementary Fig. S1)]: slope = 0.005, r 2 = 0.001, P ≫ 0.1; dashed lines.

Rates of viability loss and RNA degradation were highly correlated for all treatments (slope = 0.91, r 2 = 0.93, P ≪ 0.001, Fig. 8B, correlation line not drawn). The slope and r 2 increased when the regression was restricted to constant temperature treatments <90°C and RH ~ 30% (solid circles; slope = 1.06, r 2 = 0.98, solid line in Fig. 8B). Notably, increasing RH above 60% changed the direction of the relationship between viability loss and RNA degradation (dashed lines in Fig. 8B: triangles for 2015H: slope = −0.39, r 2 = 0.99, P = 0.06; diamonds for 2017H: slope = 0.005, r 2 = 0.002, P = 0.99). In other words, the relationships of viability loss and RNA degradation were different for heat-induced and high moisture-induced stresses.
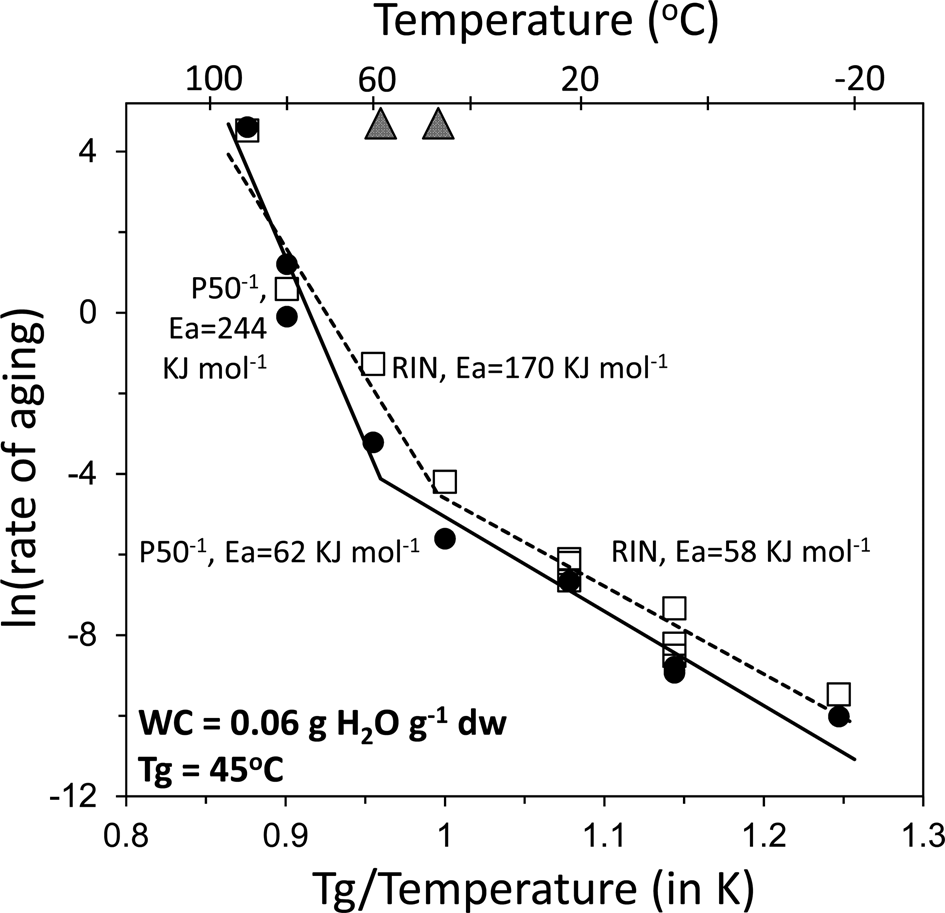
The effect of temperature on ageing rates was further characterized by Arrhenius plots of viability loss and RNA degradation (Fig. 9). For illustrative purposes, the x-axis of the plot is scaled by the glass transition temperature for soya bean seeds containing 0.06 g H2O g−1 dw (RH = 30% at 45°C, Tg = 45°C) (Sun and Leopold, Reference Sun and Leopold1994; Buitink and Leprince, Reference Buitink and Leprince2008; Ballesteros and Walters, Reference Ballesteros and Walters2011). Arrhenius behaviour is indicated by linear relationships at temperatures <47 and 58°C for RNA degradation and viability loss, respectively (r 2 ≥ 0.93, P ≪ 0.001). The apparent activation energies (Ea) for ageing reactions were 58 and 62 KJ mol−1, which were not significantly different (P ≫ 0.1). Slopes increased above 47 and 58°C for RIN and viability loss, respectively, giving Ea values that were nearly three- or fourfold greater than at the lower temperature range. Values for r 2 were smaller for Arrhenius plots of treatments within the higher, compared to the lower, temperature range, and the parallel relationship between viability loss and RNA degradation was lost.
Arrhenius plots, scaled by Tg, of the effect of temperature on ageing rate measured as viability loss (filled circles) and RIN decline (open squares) between 90 and −18°C. Lines are from regression analyses of ageing rate data provided in graphs or legends of Figs 1, 3–5. Correlation coefficients (r 2) for the lower temperature segments (<50°C) are 0.93 and 0.95 for P50−1 and RIN d−1, respectively, and are significant at P ≪ 0.001. Correlation coefficients (r 2) for the higher temperature segments are 0.90 (P = 0.05) and 0.77 (P > 0.05) for P50−1 and RIN d−1, respectively. Arrows at the top of the graph point to the temperature at which lines intersect (58 and 47°C, respectively). Apparent activation energies (Ea = slope × R, R = 8.314 J mol−1 K−1) for all portions are indicated. The break in the Arrhenius plot occurs near the glass transition temperature (Tg).

Stability of extracted RNA
Extracted RNA in water was stable on ice for at least 8 h and was stable at −80°C for at least 2 years (Supplementary Table S1). Heating freshly extracted RNA at 80°C for 1 h greatly reduced RNA integrity (Fig. 3 inset), but long molecules, eluting after 40 s, are still present, suggesting that molecular sizes of ~2000 nucleotides persist. In contrast, extracted RNA exposed to Cl2 for 6.5 h produced no signal on the electropherogram, indicating that all RNA polymers were completely broken down into nucleotides. Higher RIN values for RNA within cells of stressed seeds compared to extracted RNA suggests that the dry seed matrix protects RNA from degradation during heat or oxidative stress.
Discussion
The kinetics of seed degradation were quantified by germination and RIN assays of Williams ‘82 soya bean seeds exposed to a range of stresses. Though many approaches rapidly killed seeds, only a narrow range of temperature and moisture stresses induced ageing at rates relatable to ageing under cold, dry conditions used by genebanks. Under these carefully defined conditions of ≤50°C and ~30% RH, the kinetics of RNA degradation corresponded well to the rate at which seeds lost germination potential. These conditions reflect a solid-state system in which reaction kinetics are dominated by constrained molecular mobility.
Physiological change in a dry seed is both discrete and discreet. Viability time courses contain a discontinuity that separates initial and final segments when the seed retains and lacks, respectively, germination potential. Viability's sole criterion of ‘aliveness’ implies that ageing is ‘asymptomatic’ before and after mortality, and precludes characterization of discreet effects as ageing progresses. For example, germination of seeds that were stored for different durations (i.e. different cohorts) could be similar when no stress was applied, but the shape of viability time courses was different when stresses of higher temperatures (Figs 4A and 5A) or cryogenic storage (Walters et al., Reference Walters, Wheeler and Stanwood2004) were applied. It is currently not possible to assess germination potential in a quiescent organism without adding water to stimulate metabolism. So, dry seeds die subtly, and the timing of their death can only be approximated for a population by repetitive germination assays, as shown by the data points in Fig. 2A. The chosen monitoring interval is critical to the accuracy of this approximation: a too-narrow interval unnecessarily consumes seeds, while a too-wide interval makes it uncertain when the onset, midpoint and end of rapid mortality occur within the population. Choosing the correct monitoring interval is challenging since it must be done before the onset of rapid mortality. The midpoint, when half of the initially viable seeds have died (P50), is commonly used to quantify longevity (Walters, Reference Walters1998).
Methods that detect subtle effects of ageing will warn of imminent mortality. Yet method development is itself a challenge: effects detected prior to mortality would not correlate with viability, which only changes once mortality begins. The problem can be partially circumvented by comparing kinetics of changes in both viability and candidate markers of early ageing. Longevity (expressed as P50) can be transformed to a rate term by taking the reciprocal (P50−1).
This project focused on damage to RNA as a candidate marker of early ageing effects. RNA is necessary for transcription and translation processes supporting seed germination (Dirk and Downie, Reference Dirk and Downie2018) and is labile compared to other cellular constituents (Wurtmann and Wolin, Reference Wurtmann and Wolin2009). Damage to RNA can be detected with relative ease using the RIN assay (Schroeder et al., Reference Schroeder, Mueller, Stocker, Salowsky, Leiber, Gassmann and Ragg2006), and we found that RNA integrity and viability declined contemporaneously in stored seeds (Fleming et al., Reference Fleming, Richards and Walters2017). Here, we confirm the apparent linearity of RNA degradation with time (Fleming et al., Reference Fleming, Hill and Walters2018b) for a range of stresses (Figs 2B, 4B, 5B, 6B and 7B). RNA degraded at a similar rate during stress treatments among cohorts (Figs 4B and 5B), even when there were undetected differences in the progress toward mortality (Figs 4A and 5A). Small differences in RNA degradation rates among cohorts (Fig. 5B) may reflect within-cultivar variation in seed longevity (Table 1). RNA degraded profoundly when exposed to the same stresses after being extracted from the seed (Fig. 3 inset; Table 3), emphasizing the substantial protections provided by the seed itself.
Rates of viability loss and RNA degradation were highly correlated (r 2 = 0.92, P ≪ 0.0001, Fig. 8B). The correlation coefficient increased by omitting treatments that killed seeds faster than expected (i.e. 90°C and Cl2 treatments for recently harvested seeds and 22 or 80°C treatments for older cohorts: encircled points in Fig. 8B), and was further improved to r 2 = 0.98 if high humidity treatments were also omitted (open triangles and diamonds in Fig. 8B). The close relationship between temperature and viability loss or RNA degradation is further illustrated by nearly parallel Arrhenius plots for the two responses at temperatures below 50°C [r 2 = 0.93 and 0.95 for P50−1 and RIN decline; Ea = 62 and 58 KJ mol−1, respectively (Fig. 9)]. The activation energy (Ea) of degradation measured here is consistent with temperature coefficients of 55–57 KJ mol−1 reported for other crop seeds (Fleming et al., Reference Fleming, Hill and Walters2018b) and lower than 70–90 KJ mol−1 reported for fern spores at comparable moisture and temperature ranges (Ballesteros et al., Reference Ballesteros, Hill, Lynch, Pritchard and Walters2019). That viability loss and RNA degradation kinetics have similar temperature dependencies suggests that molecular mobility regulates ageing reactions within the solidified matrix of soya bean seed cytoplasm. The tight coupling of these kinetics will allow further probing of structure and mobility properties in solidified cytoplasm.
RNA degradation rates and P50−1 correlated poorly in high RH treatments (Figs 6, 8B and Supplementary Fig. S1). Viability loss followed expected patterns (Figs 6A, 8A and Supplementary Fig. S1A). However, rate of RIN decline was barely affected by increased RH (Fig. 6B and Supplementary Fig. S1B). In general, introducing moisture appeared to uncouple the kinetics of mortality and RNA degradation, exemplified by germinated axes or hydrated cotyledons being quickly killed by desiccation or freezing, while RIN values in the damaged tissues remained high (Table 2).
These experiments suggest that moisture and temperature do not have interchangeable effects on seed ageing, as once thought (Ellis and Roberts, Reference Ellis and Roberts1980; Zheng et al., Reference Zheng, Jing and Tao1998). Water is a ‘plasticizer’ of solidified cytoplasm (Buitink and Leprince, Reference Buitink and Leprince2008; Ballesteros and Walters, Reference Ballesteros and Walters2011), meaning it loosens the constrained structure of the solid by increasing the size of pores in the matrix (Yoshioka and Aso Reference Yoshioka and Aso2007; Bhattacharya and Suryanarayanan, Reference Bhattacharya and Suryanarayanan2009; Chang and Pikal, Reference Chang and Pikal2009). In other words, water increases mobility by relieving spatial constraints, rather than by increasing the energy within the system. Hydration lowers the concentration of reactants that were pressed together in the solid, consequently changing the chemical potential of ageing substrates and the driving forces of different ageing mechanisms. Therefore, the nature and kinetics of ageing reactions may be affected by adding moisture and causing a solid ↔ fluid transition (Yoshioka and Aso Reference Yoshioka and Aso2007; Bhattacharya and Suryanarayanan, Reference Bhattacharya and Suryanarayanan2009; Chang and Pikal, Reference Chang and Pikal2009). The solid ↔ fluid transition (Tg) occurs near 45°C for soya bean seed dried to 33% RH at 22°C (0.06 g H2O g−1 dw) (data not shown, see also Ballesteros and Walters, Reference Ballesteros and Walters2011). At higher temperatures, the apparent Ea for degradation increased three- to fourfold (Fig. 9), indicating that constrained molecules participating in the reaction are ‘released’ as the solid ‘melts’ (Yoshioka and Aso Reference Yoshioka and Aso2007; Bhattacharya and Suryanarayanan, Reference Bhattacharya and Suryanarayanan2009; Chang and Pikal, Reference Chang and Pikal2009).
Previous studies suggest that ageing involves oxidative reactions (Halliwell and Chirico, Reference Halliwell and Chirico1993; Sattler et al., Reference Sattler, Gilliland, Magallanes-Lundback, Pollard and DellaPenna2004; Nyström, Reference Nyström2005; Harman, Reference Harman2006; Kranner et al., Reference Kranner, Minibayeva, Beckett and Seal2010; Mira et al., Reference Mira, González-Benito, Hill and Walters2010; Halliwell and Gutteridge, Reference Halliwell and Gutteridge2015; Sano et al., Reference Sano, Rajjou, North, Debeaujon, Marion-Poll and Seo2016). Oxidizing agents, including O2 and Cl2, extract electrons from cellular constituents (Nelson et al., Reference Nelson, Lehninger and Cox2008). Exposing seeds to Cl2 gas resulted in a 200- and 100-fold increase in rates of viability loss and RNA degradation, respectively (compare Fig. 2 with Fig. 7). The twofold greater effect on viability (Fig. 8B) may indicate some decoupling of reactions leading to viability loss or RNA degradation. This experiment suggests that small, volatile molecules can penetrate through pores of solid (i.e. glassy) matrices, and that oxidizers can enhance the deterioration rate of preserved materials (Angell, Reference Angell1995; Groot et al., Reference Groot, Surki, De Vos and Kodde2012; Fundo et al., Reference Fundo, Quintas and Silva2015). Antioxidant activity or an anoxic environment is a likely substrate-based strategy critical to protect against mobile oxidizing agents that can permeate solid-state systems (Sattler et al., Reference Sattler, Gilliland, Magallanes-Lundback, Pollard and DellaPenna2004; Harman Reference Harman2006; Kranner et al., Reference Kranner, Minibayeva, Beckett and Seal2010; Groot et al., Reference Groot, de Groot, Kodde and van Treuren2015; Halliwell and Gutteridge, Reference Halliwell and Gutteridge2015).
Conclusions
Dry seeds, like most solid-state germplasm, exhibit remarkable resistance to change despite considerable stress. When dried to about 0.06 g H2O g−1 dw, soya bean seeds survived at least three decades in the freezer, a few minutes at 90°C, and a few days in the presence of lethal Cl2 gas. The rates of viability loss and of RNA degradation were co-correlated in the solid matrix, especially when temperature was the only moderating factor. We do not mean to imply a cause–effect relationship between RNA degradation and viability loss: all cellular constituents are subject to the same process of degradation, and viability loss is likely the culmination of accumulated damage from minor events. The tight relationship between rates of viability loss and RNA degradation strongly suggests that structure and mobility within the solid matrix are dominant features regulating ageing rate. When molecular mobility is not a dominant regulating factor, such as in a fluid system, RNA integrity and seed survival are almost completely uncoupled. Predicting longevity of preserved germplasm requires consideration of the properties of the solid matrix and there are few research tools that easily probe structure and mobility of dried cytoplasm. Assays that reflect molecular mobility, and quantitatively relate to preserving conditions, have promise for predicting longevity that might span decades or centuries. This approach may also contribute to understanding variation of longevity within diverse germplasm.
Supplementary material
To view supplementary material for this article, please visit: https://doi.org/10.1017/S0960258520000197.