

Radiocarbon (14C) dating of marine-sourced carbon samples has considerable value in coastal archaeology and represents a significant percentage of the cumulative global radiocarbon record in coastal settings. However, its effective use is hampered by complexities of carbon pathways in marine systems, changes in such systems over time, and ongoing debates about the most appropriate way to sample and quantify the difference between them. Debates within geologic and geochemical literature are foundational to the archaeological purpose of estimating ages and rates of processes. We demonstrate that common archaeological calibration practices underestimate uncertainty, especially compared with revised estimates of error proposed by Cook and colleagues (Reference Cook, Ascough, Bonsall, Hamilton, Russell, Sayle, Scott and Bownes2015). We show that increasing the sample of data points of the difference between marine and terrestrial systems does not necessarily increase either the accuracy (the proximity of results to reality) or the precision (the range of uncertainty in results) of such estimations. The main culprit for the disjunction between sample size and accuracy is likely the mismatching of marine-terrestrial pairs from different chronological contexts. We also note a consistent and pervasive overstatement of precision in archaeological estimates, largely due to inappropriate calculations of error. Using a large set (n = 63, though 48 of these pairs were derived from 24 dates; see below) of marine-terrestrial pairings from the Prince Rupert Harbour region of British Columbia, Canada, we demonstrate that the most accurate, precise, and cost-effective method for correcting marine-sourced radiocarbon samples is the multiple-pair sample approach developed by Ascough and colleagues (Reference Ascough, Cook, Church, Dugmore, McGovern, Dunbar, Frioriksson and Gestsdóttir2007), Russell and colleagues (Reference Russell, Cook, Ascough, Scott and Dugmore2011), and Cook and colleagues (Reference Cook, Ascough, Bonsall, Hamilton, Russell, Sayle, Scott and Bownes2015). We see value in wider application of this method in coastal archaeology.
Kintigh (Reference Kintigh, Barcelo and Bogdanovic2015) notes that many computational presentations of archaeological mathematics gloss over both the logical implications and the mathematical steps. As with any academic genre, such an approach is efficient when directed at disciplinary peers but generates exclusion of those not familiar with the foundational ideas or the applied methods. Kintigh writes,
If practicing archaeologists lack reasonable access to a method, it is unlikely to achieve widespread use. I here use “access” in two senses, that the method can be adequately understood and that it is possible to find and use the software tools to execute it [2015:488].
Given its wide use and value, radiocarbon dating in general, and its application to marine-sourced carbon in particular, is explored by many archaeologists who do not have much experience with quantitative methods. Thus, we see value in both an assessment of logical and mathematical options and a step-by-step guide to best practices (including supplemental Microsoft Excel spreadsheet templates for conducting the calculations), which we elaborate on below.
The calibration of radiocarbon ages, estimated from samples containing marine-derived carbon, is complicated by a spatially and temporally variable reservoir effect that makes these samples appear too old (Mangerud and Gulliksen Reference Mangerud and Gulliksen1975; Stuiver et al. Reference Stuiver, Pearson and Braziunas1986). Radiocarbon is produced in the stratosphere, rapidly oxidizes to carbon dioxide, and diffuses through the troposphere and into terrestrial biological systems via organic carbon production (fixing) through photosynthesis. The timescale for these biogeochemical processes is short, on the order of 10 to 20 years (Ascough et al. Reference Ascough, Cook, Dugmore, Barber, Higney and Scott2004). This creates a correlation between the annual production of radiocarbon and its accumulation in the terrestrial organic carbon reservoir that requires calibration via the IntCal13 curve to correct for variation in 14C production (Reimer et al. Reference Reimer, Bard, Bayliss, Beck, Blackwell, Ramsey, Buck, Cheng, Edwards and Friedrich2013; Stuiver et al. Reference Stuiver, Pearson and Braziunas1986). Because of the slow rate of diffusion of carbon dioxide into water and the isolation of bodies of water from the ocean/atmosphere interface for potentially many hundreds of years, marine biochemical pathways effectively fix carbon from older carbon sources than terrestrial systems, with correspondingly depleted levels of radiocarbon. Hence, marine samples generate artificially older age values. The resulting difference between the terrestrial and marine systems is expressed as a cumulative difference between the terrestrial and marine calibration curves for radiocarbon ages, known as the marine reservoir effect (MRE).
The MRE differs through the ocean water column, but most archaeological samples derive from the surface seawater (mixed) photic zone, where photosynthetic uptake of inorganic carbon occurs (Ascough et al. Reference Ascough, Cook, Dugmore, Barber, Higney and Scott2004:611). MRE is expressed mathematically as R(t) = R + ΔR, or the sum of the global difference (R) and the additional local value that modifies it (ΔR). Although MRE calculations and estimates of both R and various ΔR values have been explored for decades, the process of enumerating and calibrating the cumulative effects of marine/terrestrial differences is undergoing continual refinement (see Hutchinson et al. Reference Hutchinson, James, Reimer, Bornhold and Clague2004 for a discussion of this).
The current global value of R, at ~400 years, is a modeled estimate of the average age difference between surface marine and terrestrial carbon reservoirs (Hughen et al. Reference Hughen, Baillie, Bard, Beck, Bertrand, Blackwell, Buck, Burr, Cutler and Damon2004). Early enumerations of ΔR were based on the radiocarbon dating of modern pre–atomic bomb marine samples (usually shells of intertidal marine invertebrates) of known age and location, to estimate ΔR into antiquity. Stuiver and colleagues (Reference Stuiver, Pearson and Braziunas1986) defined a ΔR intercept estimate based on the difference between the conventional marine radiocarbon age and the equivalent marine age projected from the intercept of a stratigraphically (and thus chronologically) paired terrestrial age (see Stuiver and Braziunas Reference Stuiver and Braziunas1993:153 for calculating the intercept value; see Russell et al. Reference Russell, Cook, Ascough, Scott and Dugmore2011: Figure 1 for a graphic illustration of this logic).
Increasingly, ΔR is calculated using a sample of marine carbon for which the terrestrial/atmospheric 14C age is known; that is, it is stratigraphically paired, usually from an archaeological context, to a 14C-dated terrestrial sample with the assumption that deposition was coeval. The terrestrial/atmospheric 14C age ± 1σ of the terrestrial carbon sample is converted to a modeled marine 14C age via interpolation between the IntCal13 atmospheric curve and the Marine13 curve (Reimer et al. Reference Reimer, Bard, Bayliss, Beck, Blackwell, Ramsey, Buck, Cheng, Edwards and Friedrich2013). ΔR is simply the difference between this modeled marine 14C age and the conventional 14C age of the marine carbon sample. The 1σ error on this difference is calculated by the propagation of the errors on the individual measurements.
Sources of Uncertainty in Marine Reservoir Effects
As Stuiver and colleagues (Reference Stuiver, Pearson and Braziunas1986:980) observe in their foundational analysis, the first approximation of ΔR as a constant value must be assumed in the absence of a representative sample of MRE data over time. It is important to note, following Stuiver and colleagues (Reference Stuiver, Pearson and Braziunas1986:986) and Stuiver and Braziunas (Reference Stuiver and Braziunas1993:139), that while R(t) varies over time, ΔR does not vary if local conditions remain stable enough to create a constant difference between the marine and terrestrial curves (cf. Weisler et al. Reference Weisler, Hua, Zhao, Nguyen, Nothdurft, Yamano and Mihaljević2017). By this preliminary logic, a suitably derived ΔR from any time period serves as a proxy for all time periods. However, MRE processes are potentially highly variable over short distances and have the potential to shift over time, especially in the context of global postglacial environmental changes affecting oceanographic circulation, rendering ΔR calculations susceptible to dramatic variation (e.g., Gómez et al. Reference Gómez, Borel, Aguirre and Martínez2008; Goodfriend and Flessa Reference Goodfriend and Flessa1997; Heier-Nielsen et al. Reference Heier-Nielsen, Heinemeier, Nielsen and Rud1995; Ingram and Southon Reference Ingram and Southon1996; Kennett et al. Reference Kennett, Ingram, Erlandson and Walker1997; Kovanen and Easterbrook Reference Kovanen and Easterbrook2002; Rick et al. Reference Rick, Henkes, Lowery, Colman and Culleton2012; Southon and Fedje Reference Southon and Fedje2003; Southon et al. Reference Southon, Nelson and Vogel1990; Stuiver and Braziunas Reference Stuiver and Braziunas1993; Stuiver et al. Reference Stuiver, Pearson and Braziunas1986; Taylor et al. Reference Taylor, Southon and Lauriers2007). As Misarti and colleagues (Reference Misarti, Finney, Maschner and Wooller2009) and Spzak and colleagues (Reference Spzak, Buckley, Darwent and Richards2018) illustrate for the North Pacific and Bering Sea, there is a high probability of a major environmental change occurring in the northern oceans between the modern and ancient periods that likely influenced the reservoir age, making this approach less applicable to archaeological chronologies. Variability in ΔR values across space and time undermines the use of marine-sourced carbon for both relative and absolute chronological estimates, a significant issue for coastal archaeology (Ascough et al. Reference Ascough, Cook, Dugmore, Barber, Higney and Scott2004). Hutchinson and colleagues (Reference Hutchinson, James, Reimer, Bornhold and Clague2004) argue that in most coastal contexts, stability in MRE conditions over time is unlikely, creating an empirical problem to be tested. However, both Hua and colleagues (Reference Hua, Webb, Zhao, Nothdurft, Lybolt, Price and Opdyke2015) and Weisler and colleagues (Reference Weisler, Hua and Zhao2009) present examples of stable ΔR periods in the context of changes over time and consistency over regions, respectively, reminding us that patterns of change or stability are possible but need demonstration in each local context.
While the extent of variability in MRE over time and space remains unclear for many archaeological contexts, the sources of variation are relatively well known. Hutchinson and colleagues (Reference Hutchinson, James, Reimer, Bornhold and Clague2004) anticipate variation both in the marine water column and in marine carbon pathways. The former may derive from changes in oceanographic and nearshore hydrologic conditions that mix deep ocean waters with near-surface layers, while the latter include variation in the chemical and biochemical pathways through which carbon is fixed in marine tissues (Hutchinson et al. Reference Hutchinson, James, Reimer, Bornhold and Clague2004; Rick et al. Reference Rick, Henkes, Lowery, Colman and Culleton2012; Stocker and Wright Reference Stocker and Wright1998; Stuiver and Braziunas Reference Stuiver and Braziunas1993; Taylor et al. Reference Taylor, Southon and Lauriers2007). Hutchinson and colleagues (Reference Hutchinson, James, Reimer, Bornhold and Clague2004:194–195) also include carbon leaching at the outer surface of marine shell after death, variation in carbon uptake and feeding strategies by different marine invertebrates, and seasonal growth variation as examples (see also Petchey et al. Reference Petchey, Anderson, Zondervan, Ulm and Hogg2008). Some of these variables can be controlled by sample selection for marine species with known or near-surface habitat ranges. However, these factors can render MRE too heterogeneous to be easily estimated in some contexts. For example, Etayo-Cadavid and colleagues (Reference Etayo-Cadavid, Andrus, Jones, Hodgins, Sandweiss, Uceda-Castillo and Quilter2013) note a pattern of considerable variation (~150–400 years) in ΔR variability from short-lived marine mollusks (Donax obesulus) in coastal Peru over the last 2,000 years that they associate with increased short-term variation in deepwater upwelling caused by El Niño events. Similar challenges are outlined in Deo and colleagues (Reference Deo, Stone and Stein2004) and Gómez and colleagues (Reference Gómez, Borel, Aguirre and Martínez2008), discussed below.
Recent scholarship identifies variation in ΔR values from the same locations at different times, often from samples derived from archaeological contexts (Eldridge et al. Reference Eldridge, Parker, Mueller and Crockford2014; Goodfriend and Flessa Reference Goodfriend and Flessa1997; Ingram and Southon Reference Ingram and Southon1996; Kennett et al. Reference Kennett, Ingram, Erlandson and Walker1997; McKechnie and Eldridge Reference McKechnie and Eldridge2013; Stocker and Wright Reference Stocker and Wright1998; Stuiver and Braziunas Reference Stuiver and Braziunas1993; Voelker et al. Reference Voelker, Sarnthein, Grootes, Erlenkeuser, Laj, Mazaud, Nadeau and Schleicher1998), generating a chronological curve in some locations. Given the potential for a variable MRE regime across space and time, the challenge for archaeologists is to balance the ambitions of accuracy (the proximity of the ΔR value to reality) and precision (the uncertainty of the ΔR calculation at different points in time/space). The cost of sample retrieval and 14C dating often influences outcomes, with most archaeological programs using extant ΔR estimates or single marine-terrestrial pairs. Here we review the appropriate estimate of the MRE via the calculation of a local value for ΔR. We then turn to a case study in the Prince Rupert Harbour (PRH) area of north coastal British Columbia, Canada, to compare different approaches to calculating ΔR and its uncertainty.
Calculating ΔR
The evaluation of MRE differs somewhat between archaeological and geochemical approaches. Geochemists tend to build temporally and spatially constrained datasets from which to assess ΔR values, while archaeologists usually seek ΔR values to estimate the correct age of previously dated samples. The archaeological application of ΔR to existing 14C datasets, often spanning large time periods and/or regions that are oceanographically diverse, promotes a circular logic in which the expectation that ΔR is measurable and useful is assumed before evidence is collected. Consider the following geochemical (Gómez et al. Reference Gómez, Borel, Aguirre and Martínez2008) and archaeological (Deo et al. Reference Deo, Stone and Stein2004) examples.
Gómez and colleagues (Reference Gómez, Borel, Aguirre and Martínez2008) calculated ΔR values from 18 pre-bomb, early twentieth-century shell samples of known age from seven locations along the northeastern coast of Argentina. They identified high variation (143–2,482 years) in ΔR between locations, likely the consequence of the dynamic and varied carbon cycles in local hydrologic and oceanographic effects, particularly the effects of large estuaries and variability in freshwater inputs in this coastal region. The authors conclude that the analytical resolution and hence interpretive value of marine shell in 14C chronologies over the sampled time periods in this region is low. Gómez and colleagues do not calculate dispersion but argue that the variation in the region in all but one location is too great to assess ΔR as a constant, concluding that building chronologies with marine-sourced carbon in the area is “seriously limited” (Reference Gómez, Borel, Aguirre and Martínez2008:128).
In contrast, archaeologists regularly seek ΔR values for predetermined age ranges and regions, based on the existing use of 14C data in chronology building. Indeed, in many contexts, imperfect ΔRs are already applied, and the archaeological effort is to refine and correct existing conclusions. For example, Deo and colleagues (Reference Deo, Stone and Stein2004) used shell-charcoal pairs from previously excavated archaeological samples in Washington State to assess marine reservoir effects over the last 3,000 years in the Salish Sea, including the American Gulf Islands and Puget Sound. A ΔR of 400 ± 23 years was widely employed, based on previously published regional estimates of modern, pre-bomb samples (Robinson and Thompson Reference Robinson and Thompson1981). Deo and colleagues (Reference Deo, Stone and Stein2004) identified a fluctuating MRE based on the analysis of 18 marine-terrestrial pairs, which produced ΔR estimates ranging from −504 to 2,281 years over the last 3,000 years. They propose ΔR values of 0 (from 0 to 500 14C years BP), −400 (from 500 to 1200 BP), and 0 (from 1200 to 3000 BP),Footnote 1 while outliers were identified subjectively as values away from the “internal consistency” of the pattern (2004:779).
The differences between these examples are significant for archaeology, and each approach has considerable mathematical and logical implications. If MRE is constant over time and stable over wide regions, then ΔR can be reliably estimated from small, spatially or temporally constrained samples, such as modern, pre-bomb invertebrate shells of known age. In contexts where this is supported, archaeologists can rely on existing regional estimates and need not dedicate funds or effort to resolving MRE via ΔR. However, stability cannot be assumed, and estimating ΔR in variable contexts remains a logistical and financial challenge. Importantly, archaeological estimates of uncertainty in ΔR tend to be either judgmental (e.g., identifying anomalies during exploratory data analysis) or calculated as simply the combination of the measurement errors on the marine and terrestrial radiocarbon age estimates. We argue that recent research supports more robust methods for estimating error in the association of marine and terrestrial samples.
Outliers and Sample Selection
Archaeologists are often reluctant to conclude that in some contexts, marine-sourced carbon cannot be effectively used in chronologies, assuming instead that additional paired samples will resolve variation and reduce uncertainty. This is essentially a debate about outliers and more broadly the interpretive utility and unresolved uncertainty of marine-influenced radiocarbon dates. Anticipation of consistent MRE conditions expects redundant samples from a single location to be unimodal and thus vary around a measure of central tendency. Deviations from such a pattern are interpreted as outliers whose influence can be minimized by trimming the dataset (for example, ignoring values beyond the interquartile spread), by differential weighting to the modality (for example, via a weighted mean), or by reducing the temporal or spatial range of the ΔR assessment based on available data.
The expectation that MRE conditions change over time anticipates ΔR as a curve that can be estimated as a sequential pattern of central tendencies over a series of times in a location or region. Here, outliers are identified against the curve, either as a central tendency calculated within temporal bins or as a polynomial trend line through the data. It is uncommon for archaeologists to collect a sufficient sample of marine-terrestrial pairs to mathematically identify outliers. It is more common, such as in Deo and colleagues (Reference Deo, Stone and Stein2004) and Eldridge and colleagues (Reference Eldridge, Parker, Mueller and Crockford2014), for a ΔR curve and its outliers to be identified judgmentally.
As Deo and colleagues (Reference Deo, Stone and Stein2004:775) note, the archaeological context is challenged by potentially compounding sources of error. Archaeological assessments of ΔR typically employ pairs of terrestrial- and marine-sourced carbon from the same stratigraphic context. The first, and perhaps most ubiquitous, error is the lack of securely contemporary samples derived from the same chronological context; variation here can add considerable uncertainty that will not be resolvable through subsequent measurement precision, a problem that cannot be overstated. A given terrestrial date has its own 14C measurement error: an error that is not introduced when marine samples of known age are used, such as in Gómez and colleagues (Reference Gómez, Borel, Aguirre and Martínez2008). The contemporaneity (coeval deposition) of marine and terrestrial samples is also a source of uncertainty, as even spatial proximity does not preclude a difference in the year of death of marine and terrestrial organisms. Charcoal and shell are commonly dated materials, and both are susceptible to a time gap between the death of the organism and its deposition in archaeological sediments, the so-called old wood and old shell effects (e.g., Rick et al. Reference Rick, Vellanoweth and Erlandson2005). However, this problem can be addressed with an additional line of dating evidence independent of the radiocarbon measurements or calibration curve, such as that yielded by uranium-thorium series dating (Burley et al. Reference Burley, Edinborough, Weisler and Zhao2015; Weisler et al. Reference Weisler, Hua, Zhao, Nguyen, Nothdurft, Yamano and Mihaljević2017) or optically stimulated luminescence (Neudorf et al. Reference Neudorf, Smith, Lepofsky, Toniello and Lian2017).
In the context of such variation, increasing sample size within narrow (in archaeological terms) temporal bins of 500 to 1,000 years may improve the accuracy and precision of ΔR estimates. However, this is not necessarily the case, and events lasting as little as a few decades can introduce significant variability within 500- to 1,000-year bins. The prospect of increasing sample sizes at such a temporal scale presents a major financial barrier to archaeologists and has no guarantee of a meaningful reduction in uncertainty. As we discuss below, the multiple-pair approach developed by Ascough and colleagues (Reference Ascough, Cook, Church, Dugmore, McGovern, Dunbar, Frioriksson and Gestsdóttir2007), Russell and colleagues (Reference Russell, Cook, Ascough, Scott and Dugmore2011), and Cook and colleagues (Reference Cook, Ascough, Bonsall, Hamilton, Russell, Sayle, Scott and Bownes2015) provides a useful balance between accuracy and cost by making the best use of the statistical properties of 14C age measurements.
Calculation of ΔR from a Single Marine-Terrestrial Pair
A ΔR result can be calculated in one of four ways. Stuiver and colleagues (Reference Stuiver, Pearson and Braziunas1986) outline three ways: first, as the difference between the known age of a pre-bomb marine sample and its 14C age; second, as the difference in 14C years between paired marine and terrestrial samples, allowing the adjusted marine 14C age to be calibrated via the terrestrial curve; and, third, as the difference between the conventional marine age and a modeled marine age, the latter being derived from the paired terrestrial sample. Stuiver and colleagues (Reference Stuiver, Pearson and Braziunas1986) argue that the latter is preferred in contexts without historically known ages, and it has become the standard geochemical approach for archaeological samples (see also Russell et al. Reference Russell, Cook, Ascough, Scott and Dugmore2011:278–280).
Fourth, recently Reimer and Reimer (Reference Reimer and Reimer2017) announced an online tool (deltar: calib.org/marine) for computing ΔR from known-age, pre-bomb marine samples or contemporaneously paired marine and terrestrial samples. The deltar program computes ΔR using the full calibrated probability distribution function rather than just the intercepts, making it a more accurate assessment of MRE.
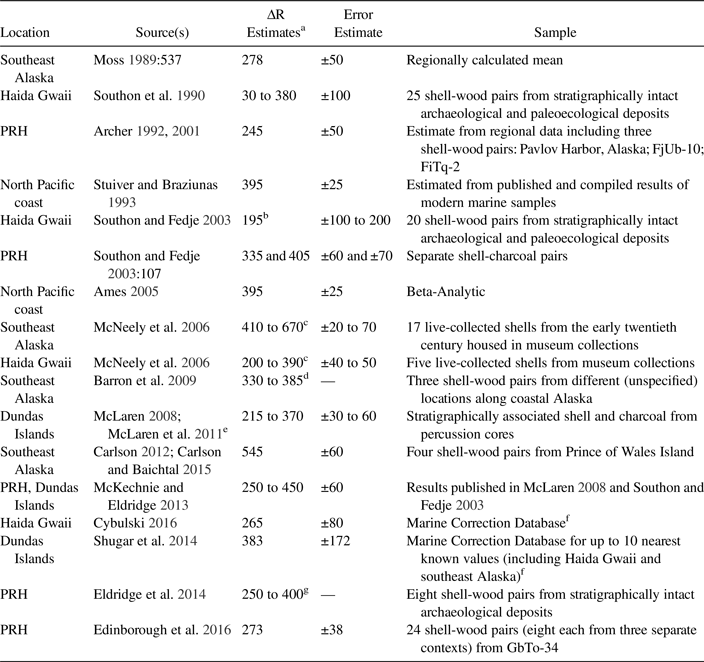
Published estimates of ΔR, such as in the PRH region and elsewhere on the Northwest Coast (Table 1), are often inconsistent in the application of these approaches. The first approach is common in geochemical analyses of historically collected shells, such as McNeely and colleagues (Reference McNeely, Dyke and Southon2006), who report a range of ΔR values for Haida Gwaii and southeast Alaska from 410 to 670 years, with measurement errors of ±20–70 years. Early archaeological efforts, published before the first marine calibration curve, Marine98 (Stuiver et al. Reference Stuiver, Reimer and Braziunas1998), employed the second approach (Archer Reference Archer1992; Moss and Erlandson Reference Moss and Erlandson1992; Southon et al. Reference Southon, Nelson and Vogel1990), generating ΔR estimates ranging from 245 to 430 years, with estimated errors of ±50–100 years. More recent work has relied on regional estimates (Ames Reference Ames2005; Cybulski Reference Cybulski, Allen and Jones2016; McLaren Reference McLaren2008) or employed the third approach (Edinborough et al. Reference Edinborough, Martindale, Cook, Supernant and Ames2016; Eldridge et al. Reference Eldridge, Parker, Mueller and Crockford2014; Martindale et al. Reference Martindale, Letham, McLaren, Archer, Burchell and Schone2009; McKechnie and Eldridge Reference McKechnie and Eldridge2013).
Regional Calculations of ΔR in the Prince Rupert Harbour (PRH) Environs Listed by Date or Publication.

a ΔR values are presented as reported unless the marine reservoir effect was enumerated only as a combined R(t) = R + ΔR value, in which case ΔR was derived by subtracting 405 from R(t), following Reimer et al. Reference Reimer, Bard, Bayliss, Beck, Blackwell, Ramsey, Buck, Cheng, Edwards and Friedrich2013.
b Southon and Fedje (Reference Southon and Fedje2003:102) estimate R(t) = 600 up to 500 BP and 700 thereafter.
c These samples were compiled from museum collections of pre–atomic bomb marine shells in Canada and the United States and reported as data points rather than compiled as ΔR values.
d Barron and colleagues (Reference Barron, Bukry, Dean, Addison and Finney2009:178) propose a marine reservoir effect value of 732 years, though the difference in ages in their Table 1 is 785 years.
e McLaren (Reference McLaren2008) presents three independent marine-terrestrial pairs listed here but relies on Southon and Fedje's (Reference Southon and Fedje2003) estimate of R(t) = 600 as accurate.
f See http://calib.org/marine/.
g Eldridge and colleagues (Reference Eldridge, Parker, Mueller and Crockford2014:66–67) plot an intercept curve from a trimmed set of eight data points from a sample of nine (ΔR range = −41 to −821, with SD range of ±40 to 75) with one outlier excluded. No calculation for error for the ΔR is presented.
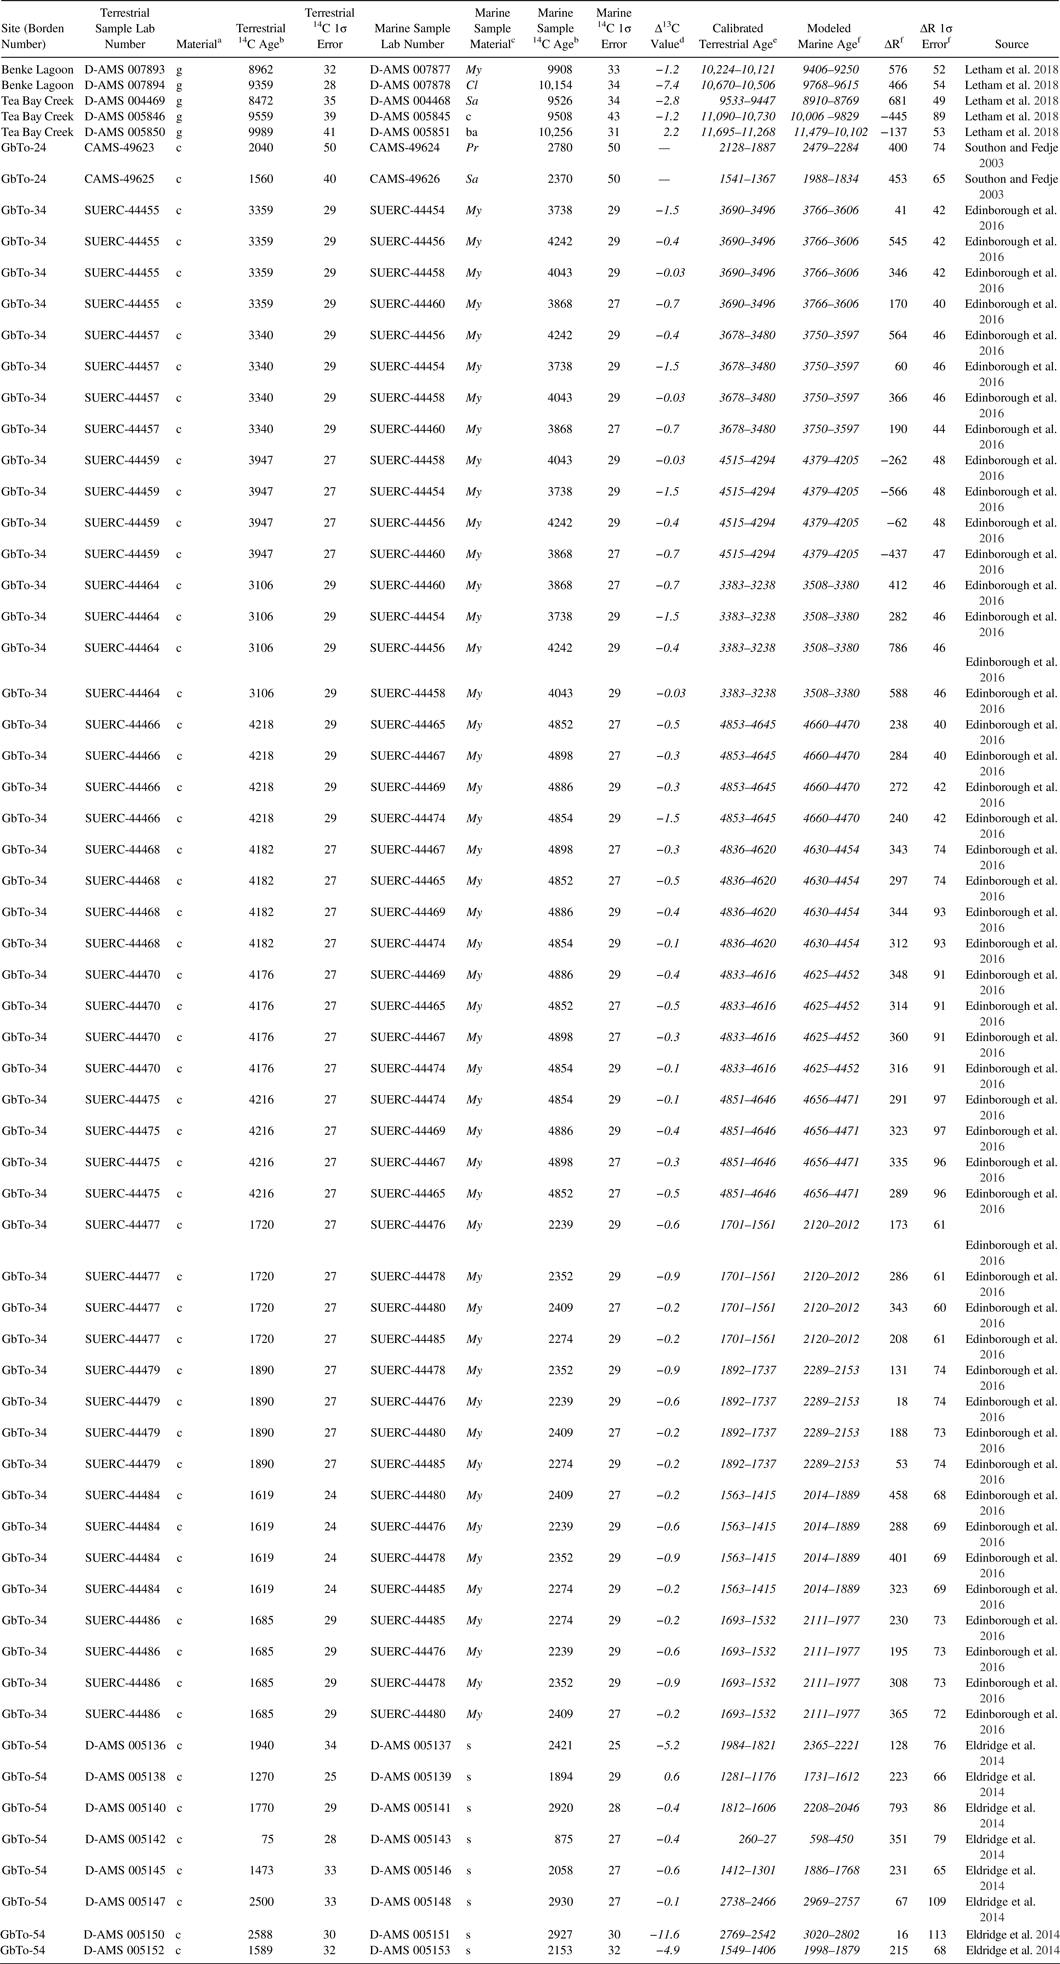
Since archaeologists typically use either the second or third approach, the differences between these are usefully illustrated with an example. Southon and Fedje (Reference Southon and Fedje2003:107) report the 14C ages of stratigraphically paired charcoal (CAMS-49625, 1560 ± 40) and marine shell (Saxidomus; CAMS-49626, 2370 ± 50) from the PRH site of GbTo-24 (Table 2). They report the value of the difference between the means of the uncalibrated marine and terrestrial ages (R[t] = 810) with an error of ± 60 years (though a simple combination of errors would return a value of ± 64); thus (using an R value of 405 years) the resulting ΔR is 405 ± 60. Southon and Fedje are cautious not to report a specific ΔR; thus their result illustrates both the second method and its limitations.
14C Marine-Terrestrial Pairings from the Prince Rupert Harbour Study Area.

a g = green wood; c = charcoal.
b All uncalibrated 14C dates are listed as conventional (i.e., normalized), where the dates are adjusted for isotopic fractionation via comparison of their Δ13C measured values against a global standard.
c My = Mytilus spp.; Cl = Clinocardium nuttalli; Sa = Saxidomus gigantea; c = clam; ba = barnacle; Pr = Protothaca; s = shell.
d Δ13C values were collected using accelerator mass spectrometry and are not as accurate as results obtained by isotope-ratio mass spectrometry.
dAll dates were calibrated using OxCal 4.2 (Bronk Ramsey Reference Bronk Ramsey2009). All terrestrial dates were calibrated using the IntCal13 curve.
e All modeled marine dates were projected off the Marine13 curve (Reimer et al. Reference Reimer, Bard, Bayliss, Beck, Blackwell, Ramsey, Buck, Cheng, Edwards and Friedrich2013). The conversion of a 14C measurement (count) into an estimate of duration corrected for isotopic fractionation (normalized or conventional age) that can then be calibrated to an estimate of time (date) uses mathematical calculations that result in values with significant digits beyond their precision. Stuiver and Polach (Reference Stuiver and Polach1977:362) recommend rounding off dates to two significant digits (i.e., the nearest decade in dates that are <10,000 years with standard errors less than 100) when dates are presented as means or medians with errors. We list dates to four-place accuracy because (1) they are presented as 2σ ranges to signal that radiocarbon age estimates are probability functions rather than specific dates and (2) we use these values in further calculations for ΔR and rounding off should only be applied to final calculated values. We recommend not rounding ΔR values but retaining rounding for the final date values they modify.
f ΔR values and errors computed from http://calib.org/deltar.
In contrast, calculating the modeled marine age requires the calibration of the terrestrial age, projecting this range onto the marine calibration curve, and computing the equivalent (modeled) marine age. The process for the intercept method for the Southon and Fedje (Reference Southon and Fedje2003) example includes the following steps: First, the 1σ calibrated age range for the charcoal sample (CAMS-49625, 1560 ± 40) is 1400–1525, derived from the IntCal13 curve. This converts the conventional age (in radiocarbon years BP) into a calibrated age range. Second, each of the bracketing ages in this calibrated age range (1400 and 1525 at 1σ) is then projected onto the Marine13 curve to derive an equivalent marine age range (1870 and 1968 years BP, respectively). This converts the calibrated age (years BP) back into a conventional age (in radiocarbon years BP), but interpolated from the marine curve. Third, the mean of the modeled marine age is 1915 years. Fourth, the difference between the conventional marine age (CAMS-49626, 2370 ± 50) and the modeled marine age mean (1915) is 455 years. This is the modeled value of ΔR.
A single value of ΔR is incomplete without an estimate of its uncertainty. As shown below, the error range in ΔR is computed as the square root of the sum of the squares of the conventional marine and modeled marine ages. In this example, the uncertainty calculation follows these steps: First, the 1σ error range of the conventional marine age is 50. Second, the modeled marine error is recorded as half the projected range from the terrestrial age interpolated from the marine curve: 1870−1968 = 98, and then 98 / 2 = 49. Third, the conventional and modeled errors are combined as the square root of the sum of their squares. Fourth, the sum of the squares of the ages = 502 + 492 = 4901. Fifth, the square root of the sum of the squares = 70 (i.e., uncertainty is ±70).
Using the deltar calculation tool, this same pair of samples returns a similar result for ΔR of 453 ± 65. Therefore, the method of computation influences both the value and the error of the ΔR value. In this case four different results are derived for methods 1–4, respectively, of 410–670 ± 20–70, 405 ± 60, 455 ± 70, and 435 ± 65 years. The deltar tool is the easiest and more accurate assessment for computing a ΔR value from single pairs of matched marine and terrestrial ages, which we use for our calculations in the PRH example below (see Table 2).
The computation of a difference between a paired marine and terrestrial sample is often insufficient by itself to accurately estimate ΔR in archaeological contexts for two reasons. First, a comparison of the measurement, or counting, errors on the terrestrial and marine ages in single-pair samples is routinely, but incorrectly, used to generate estimates of uncertainty. Second, in archaeological contexts there is no way to identify chronologically mismatched samples, which can result in considerable inaccuracy. However, both issues can be mitigated with the use of multiple marine and terrestrial sample pairs from the same context.
Addressing Accuracy and Precision of ΔR with Multiple Marine-Terrestrial Pairs
Cook and colleagues (Reference Cook, Ascough, Bonsall, Hamilton, Russell, Sayle, Scott and Bownes2015:165) identify concerns with the single-pair sample approach in which ΔR is calculated from the difference between a conventional marine age from a marine-derived sample and a modeled marine age calculated from a paired terrestrial sample. They note that such calculations routinely derive from a comparison of mean ages rather than more realistic estimates of uncertainty. They demonstrate that randomly generated values within the standard deviations of the conventional ages (i.e., values that are statistically indistinguishable from the mean values) increase the range of calculated uncertainty of ΔR from a single pair of samples. As illustrated by Cook and colleagues, paired ages from marine (6500 ± 80) and terrestrial (6000 ± 70, producing a modeled marine age of 6420 ± 70) samples result in an apparent ΔR of 80 years. However, ΔR values derived from four randomly generated ages within the standard deviations of the marine and terrestrial ages (i.e., 16 possible pairs) produced a range in ΔR of 514 years (−253 to +261).
Thus, the uncertainty of ΔR from single-pair samples is generally much greater than archaeologists estimate by relying on measurement errors in single-pair assessments. Originally, Russell and colleagues (Reference Russell, Cook, Ascough and Dugmore2010:1171) proposed that the error on the ΔR value could be calculated as the square root of the sum of the squares of the errors on the measured marine and terrestrial ages. Recently, Cook and colleagues (Reference Cook, Ascough, Bonsall, Hamilton, Russell, Sayle, Scott and Bownes2015:166) have argued that this calculation does not include the uncertainty that would encompass any future individual measurements of ΔR made on a single pair of samples from the measured context. Thus, they propose a revised estimate of uncertainty in ΔR as the standard error for predicted values: the square root of the sum of the squares of (1) the error on the weighted mean of the ΔRs from all possible sample pairings and (2) the standard deviation of the ΔR values. This can be calculated with the following steps: First, using the steps outlined in the previous section, calculate ΔR values of interest from multiple paired samples. Second, compute the weighted mean of the ΔR values (see Ward and Wilson Reference Ward and Wilson1978). Since we are assuming that the ΔR estimates derive from a coherent population, for example, Ward and Wilson's (Reference Ward and Wilson1978:20–21) Case I, we use their equation 1: the weighted (aka pooled) mean = the sum of all the age estimates divided by the squared standard error and then divided by the sum of the inverse of all squared standard errors (see the supplemental data for a Microsoft Excel spreadsheet template for this calculation). Third, compute the standard deviation of the ΔR values. Fourth, the standard error for predicted values is the square root of the sum of the squares of the error on the weighted mean and the standard deviation of the ΔR values (see the supplemental data for a Microsoft Excel spreadsheet template for this calculation).
The key message for archaeologists is that single-pair assessments of ΔR are less certain than the commonly applied archaeological calculations of uncertainty. This creates a paradox in which archaeologists either underestimate actual uncertainty, thereby generating overly precise values that are demonstrably inaccurate, or correctly estimate uncertainty, thereby generating accurate values that have such imprecision as to make marine-sourced samples considerably less useful for building chronologies.
Russell and colleagues (Reference Russell, Cook, Ascough, Scott and Dugmore2011), following Ascough and colleagues (Reference Ascough, Cook, Church, Dugmore, McGovern, Dunbar, Frioriksson and Gestsdóttir2007), propose that multiple-pair samples (i.e., four marine and four terrestrial samples) taken from the same stratigraphic context provide an opportunity to reduce mismatching and generate a more accurate estimate of ΔR than single-pair samples. Each set of four marine and terrestrial samples can be evaluated for consistency via a chi-square test. Failure indicates mismatching in the marine or terrestrial samples. If a single outlier date is the source of the inconsistency, then it can be excluded, and the remaining ages may be used if they pass a chi-squared test. A chi-square test permits an assessment of coherence within a pool of data, in effect asking the probability that the sample data derive from a homogeneous population. In this context, the population is a suite of radiocarbon ages that would be produced if the terrestrial and marine samples were drawn from organisms that died at the same time. This expectation creates a model in which the terrestrial and marine values would be similar to each other, and thus the difference between them would be consistent. This mathematical pattern can be projected as a statistically expected value; the chi-square test evaluates the difference between the observed data and the expected value via a T-statistic (Wilson and Ward Reference Wilson and Ward1981:20). Ward and Wilson (Reference Ward and Wilson1978) and Wilson and Ward (Reference Wilson and Ward1981) present the mathematics of assessing the coherence of a set of dates as the sum of the squared differences between each age and the weighted mean of the set divided by the square of the 1σ error value (see the supplemental data for a Microsoft Excel template): First, calculate the weighted mean for the measured (i.e., uncalibrated) ages of the marine or terrestrial samples using the steps listed above. Second, subtract each measured age from the weighted mean, square this value, and divide it by the square of the measured error for that sample. Third, sum these results. The resulting chi-square value is large if the variation between ages is large and small if it is small. Fourth, the chi-square value can be compared with an expected result (a T-value) derived from the chi-square function and the degrees of freedom in the calculation. In our case, with four samples, the degrees of freedom are three, and the acceptance level of the T-value is 7.815. A calculated chi-square value above this level is a fail (i.e., the samples have a >95% chance of not being from the same population). Fifth, if the failure is due to an obvious outlier date, this can be dropped and the test can be rerun. Edinborough and colleagues (Reference Edinborough, Martindale, Cook, Supernant and Ames2016) accept a marginal fail from one context with one outlier removed. However, a failure means that the samples are mismatched and cannot be used to compute a ΔR. Additional samples may need to be collected and new dates may need to be assessed until they pass the chi-square test. There is some subjectivity here in relation to the number of outliers; the context could contain samples of mixed ages that cannot provide a coherent result.
While the chi-square assessment is more expensive than using single pairs, its ability to identify mismatching is invaluable. Mismatched samples are likely a significant source of variation in ΔR values from single-pair tests, but mismatching can only be identified through multiple-sample testing. Taking multiple samples from identical contexts also increases the number of ΔR results per 14C age measurement. When individual pairs are taken in different contexts, the ratio of ΔR estimates per 14C measurement is 1:2, while this ratio increases to 2:1 with four marine and four terrestrial samples from identical contexts. This makes more efficient use of 14C measurements and consequently of research budgets as well.
As we demonstrate below, increasing the sample size via a simple amplification of the single-pair approach does not guarantee increased precision, likely because of mismatched pairings. The corollary of this logic is that many extant archaeological estimates of ΔR underestimate uncertainty and are potentially inaccurate.
The Prince Rupert Harbour Example
An archaeological view of analyses of MRE conditions and ΔR calculations is often parochial and focused on making optimal use of radiocarbon dates from marine-sourced samples in specific contexts. As archaeologists frequently attempt to retrospectively obtain the most accurate and precise age estimate from their marine-derived samples, ΔR analyses and calculations are typically conducted long after samples have been collected and dated. Many archaeologists rely on regional estimates of ΔR rather than conducting local tests. Although such tests are becoming more common, the cost of increasing the marine-terrestrial sample size to refine ΔR estimates is often considered prohibitive in the context of other research objectives. Our own research illustrates this. Prior to our work, regional and local estimates of ΔR existed, based on small numbers of single-pair samples (Table 1). Most presented ΔR as a constant, but some (Eldridge et al. Reference Eldridge, Parker, Mueller and Crockford2014; McKechnie and Eldridge Reference McKechnie and Eldridge2013; Southon and Fedje Reference Southon and Fedje2003) presented evidence of changes over time. Our settlement history research (see Ames and Martindale Reference Ames and Martindale2014; Letham et al. Reference Letham, Martindale, McLaren, Brown, Ames, Archer and Marsden2015; Martindale, Letham, et al. Reference Martindale, Letham, Supernant, Brown, Edinborough, Duelks and Ames2017; Martindale, Marsden, et al. Reference Martindale, Marsden, Patton, Ruggles, Letham, Supernant, Archer, McLaren and Ames2017) relies heavily on the dating of shell samples; thus we developed a ΔR test in concert with the Scottish Universities Environmental Research Centre to apply the approach of Russell and colleagues (Reference Russell, Cook, Ascough, Scott and Dugmore2011) to the PRH, which produced a statistically robust result spanning the last 5,000 years (Edinborough et al. Reference Edinborough, Martindale, Cook, Supernant and Ames2016). Here we consider this result in comparison to both (1) the history of ΔR estimates in the PRH region and (2) commonly applied but inaccurate and imprecise calculations illustrated with our data. We then discuss the implications of these options for archaeology.
PRH Archaeology
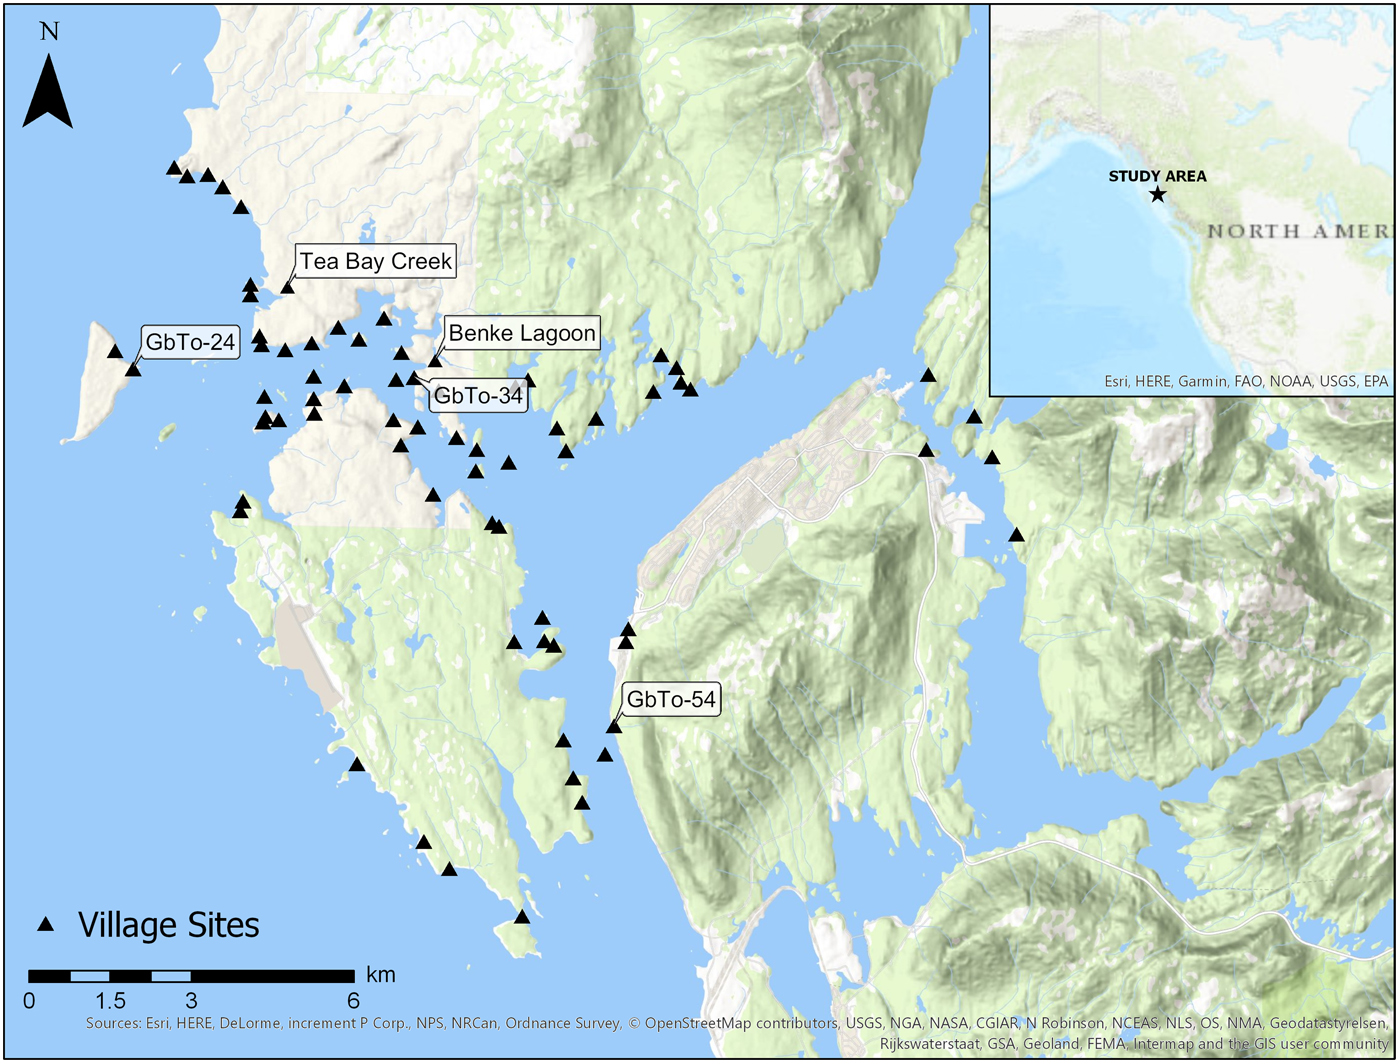
As in many coastal areas, the archaeology of the PRH region (Figure 1) is complex and presents both a range of archaeological components and a legacy of variation in materials dated. The primary material for site formation is marine shell, and the primary diet for humans is marine-sourced, including invertebrates, fish, and sea mammals. Isotopic analyses of human diet (Chisholm et al. Reference Chisholm, Nelson and Schwarcz1983; Cybulski Reference Cybulski, Allen and Jones2016; Schwarcz et al. Reference Schwarcz, Chisholm and Burchell2014) and quantitative zooarchaeology (Coupland et al. Reference Coupland, Stewart and Patton2010; Stewart et al. Reference Stewart, Stewart and Coupland2009) independently identify a diet ranging between 85% and 100% marine-derived protein.
Map of the Prince Rupert Harbour study area showing radiocarbon-dated site locations. Labels indicate sites that have paired marine-terrestrial ∆R estimates shown in Figure 2. (Color online)

Shell-bearing sites are ubiquitous in the PRH area and reflect both the by-product of food consumption and engineering efforts to construct level, well-drained habitation terraces in a highly crenulated coastal landscape dominated by bedrock outcrops, gravel beaches, and estuaries (Letham et al. Reference Letham, Martindale, Supernant, Brown, Cybulski and Ames2017). While dedicated construction episodes are known, in which massive anthropogenic landforms were built in short periods of time, shell-bearing sites also captured recurring daily behaviors, such that their lower and upper surfaces approximate the initiation and termination of occupation, respectively. Regional settlement patterns can be captured in large samples of dated basal and terminal components of marine shell, the former of which are increasingly becoming accessible via percussion coring (Cannon Reference Cannon2000; Letham et al. Reference Letham, Martindale, McLaren, Brown, Ames, Archer and Marsden2015; Martindale et al. Reference Martindale, Letham, McLaren, Archer, Burchell and Schone2009; McKechnie Reference McKechnie2015; Pluckhahn et al. Reference Pluckhahn, Hodson, Rink, Thompson, Hendricks, Doran, Farr, Cherkinsky and Norman2015).
The PRH area (approximately 180 km2) has a rich archaeological record comprising 157 currently recorded shell middens, 63 of which have architectural surface features and are classified as Tsimshian villages (Ames and Martindale Reference Ames and Martindale2014:145). The PRH has seen archaeological research spanning the last century. The current 14C dataset for the PRH region, including archaeological and geologic contexts, spans more than 10,000 14C years and includes 200 charcoal/terrestrial plant remains, 288 marine shells/bones, and 88 dates obtained from human bone collagen (Cybulski Reference Cybulski, Allen and Jones2016; Martindale, Letham, et al. Reference Martindale, Letham, Supernant, Brown, Edinborough, Duelks and Ames2017). Our current research focuses on refining the PRH settlement pattern history for the last 6,000 years, a goal that required initiation and termination dates of a representative sample of village sites, as well as developing midden formation chronologies and accumulation rates for a subset of middens. The focus of this work, conducted in partnership with the Lax Kw'alaams and Metlakatla First Nations, has been the comparison of archaeological and Tsimshian oral records, for which we needed accurate chronologies for academic and legal contexts (Edinborough et al. Reference Edinborough, Porčić, Martindale, Brown, Supernant and Ames2017; Martindale, Letham, et al. Reference Martindale, Letham, Supernant, Brown, Edinborough, Duelks and Ames2017; Martindale, Marsden, et al. Reference Martindale, Marsden, Patton, Ruggles, Letham, Supernant, Archer, McLaren and Ames2017).
Previous Calculations of ΔR in the PRH Area
A range of ΔR values has been proposed for the PRH area and environs (195 to 670 years), most with a relatively narrow margin of error (±25–50 years), based on simply combining the measurement errors of the samples (Table 1). Several authors plot curves from sets of ΔR values over time (Eldridge et al. Reference Eldridge, Parker, Mueller and Crockford2014; McKechnie and Eldridge Reference McKechnie and Eldridge2013; Southon and Fedje Reference Southon and Fedje2003) as a means of estimating a regional ΔR trend. For example, Southon and Fedje (Reference Southon and Fedje2003) propose a regional R(t) of 600 ± 100 years for the Haida Gwaii area for post-500 years BP, from a cubic polynomial trend line of least squares of values ranging from 500 to 10,000+ years ago. A few authors have followed Deo and colleagues (Reference Deo, Stone and Stein2004) in calculating ΔR for different temporal bins (Lepofsky et al. Reference Lepofsky, Smith, Cardinal, Harper, Morris, Bouchard, Kennedy, Salomon, Puckett and Rowell2015; Martindale et al. Reference Martindale, Letham, McLaren, Archer, Burchell and Schone2009), and a few have pooled sets of marine-terrestrial pairs within regions, in an attempt to increase precision. For example, Carlson (Reference Carlson2012) and Carlson and Baichtal (Reference Carlson and Baichtal2015:125) propose a ΔR of 545 ± 60 years, based on four marine-terrestrial pairs from different sites in southeast Alaska. Barron and colleagues (Reference Barron, Bukry, Dean, Addison and Finney2009) propose a ΔR of 327 years based on three marine-terrestrial pairs from deepwater marine sediment cores farther north in the Gulf of Alaska. Shugar and colleagues (Reference Shugar, Walker, Lian, Eamer, Neudorf, McLaren and Fedje2014) present a regional value for the nearby Dundas Islands of 373 ± 172 years, based on a weighted mean of the 10 nearest marine-terrestrial pairs (including some PRH data) calculated from the Marine Reservoir Correction Database, http://calib.org/marine/ (Reimer et al. Reference Reimer, Baillie, Bard, Bayliss, Beck, Bertrand, Blackwell, Buck, Burr, Cutler, Damon, Edwards, Fairbanks, Friedrich, Guilderson, Hogg, Hughen, Kromer, McCormac, Manning, Ramsey, Reimer, Remmele, Southon, Stuiver, Talamo, Taylor, van der Plicht and Weyhenmeyer2004).
It is reasonable to expect MRE and ΔR to vary considerably across this region and through the time period (Table 1), primarily from the mid- to late Holocene. Hutchinson (Reference Hutchinson2014) argues that ΔR values on the Pacific coast of North America are sensitive to oceanographic factors that vary seasonally and spatially, including wind, currents (including upwelling and downwelling), and coastal configurations (see also Southon et al. Reference Southon, Nelson and Vogel1990). Following Thomson (Reference Thomson1981), he identifies two broad patterns along the West Coast: a downwelling zone along the Pacific coast of southeast Alaska from Dixon Inlet to the far end of the Aleutian archipelago and an upwelling zone from the central British Columbia coast to southern Baja, California. In these areas, variations in ΔR values are significantly induced by wind and water movements and are affected by El Niño–Southern Oscillation events. Hutchinson predicts that ΔR values should be stable in a “transitional zone” between the major downwelling and upwelling zones that includes the Haida Gwaii archipelago and the eastward British Columbia mainland, including PRH (see also Chang et al. Reference Chang, Pedersen and Hendy2008).
The variation in ΔR values (Table 1) also likely captures patterns resulting from small sample sizes and mismatched pairs. In the absence of multiple-pair testing and chi-square assessments, there is no easy way to determine whether variation is a result of mismatching or MRE. Thus, Table 1 illustrates a problem common to archaeologists working with marine-sourced 14C dates: proposed ΔR values in different studies show a high degree of variation but are presented individually as reasonably accurate proxies for MRE. The choice for archaeologists dating marine-sourced carbon is between a coarse regional estimate or a significant financial investment in radiocarbon dates to generate a more correct local value. This creates a significant impediment to using marine-sourced dates in archaeological chronologies.
Calculating ΔR in PRH
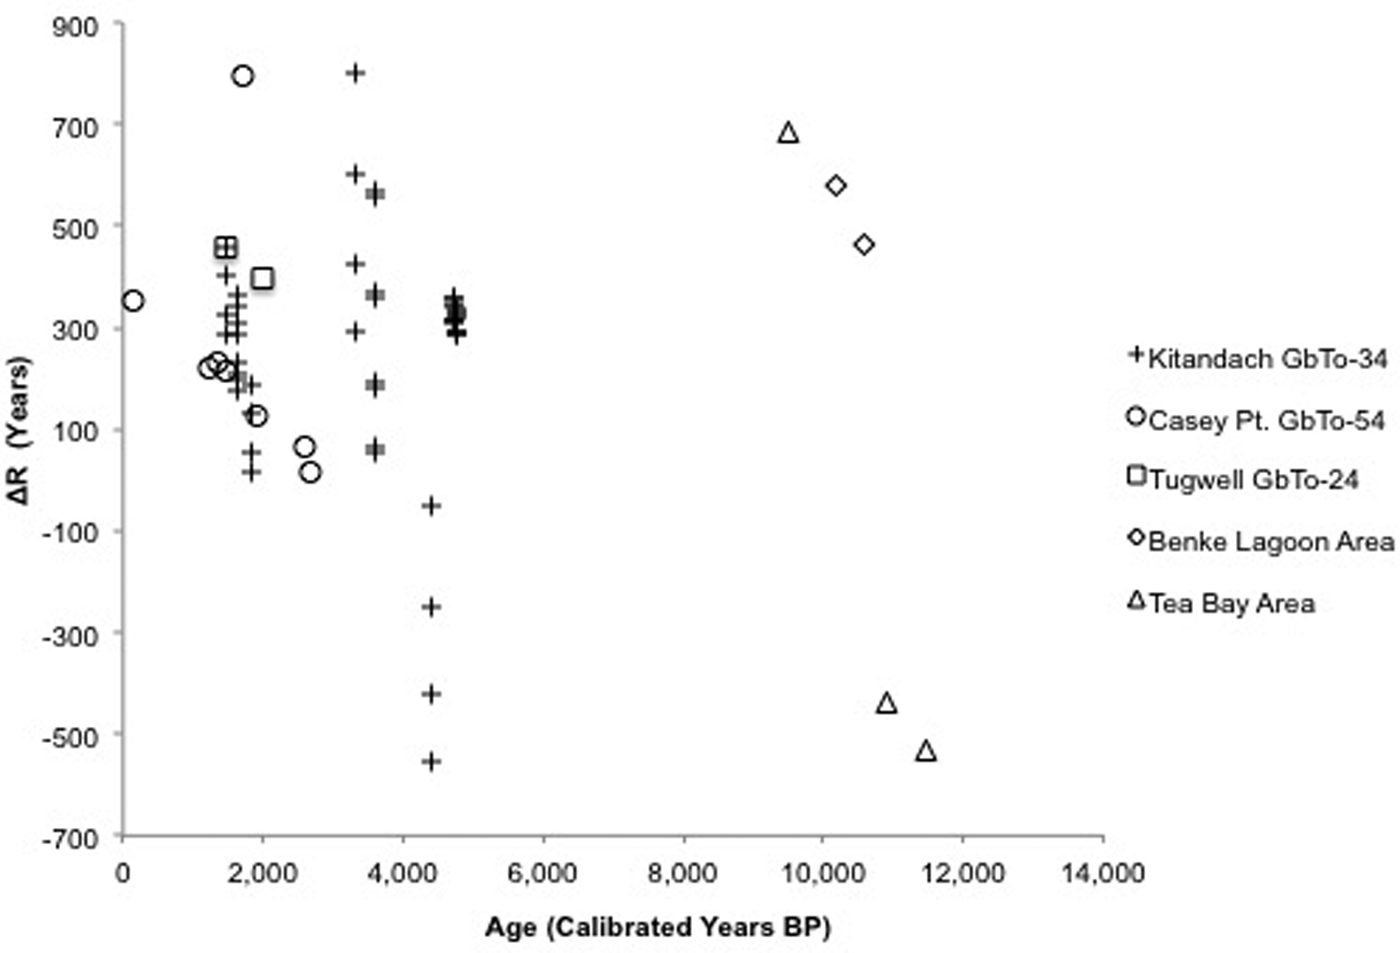
Unfortunately, simply increasing the sample size of marine-terrestrial pairs in a local area does not guarantee increased accuracy or precision. The PRH area has a large number (n = 63) of marine-terrestrial 14C pairs (Table 2), an order of magnitude larger than for most ΔR estimates elsewhere in coastal British Columbia. Thus, it is a good candidate both for estimating ΔR and for comparing differing archaeological calculations. As we discuss below, not all of these are suitable for an accurate assessment of MRE. However, archaeologists routinely address uncertainty by increasing the number of single-sample pairs, the limitations of which are easily demonstrated. A plot of the means of all modeled marine-terrestrial pairs in the PRH (Figure 2) shows considerable variation over time and between different datasets from specific archaeological sites. These values have a very wide range, −566 to + 812, illustrating the point that, in archaeological contexts, ΔR does not necessarily trend toward modality as single-pair sample size increases, particularly across long time spans. As noted above, several factors may be at play in this scattered pattern, including mixed-age samples, old wood/shell effects, and variation in laboratory measurement, as well as the possibility noted in Hutchinson and colleagues (Reference Hutchinson, James, Reimer, Bornhold and Clague2004) that MRE is heterogeneous over time and space (see also Ingram and Southon Reference Ingram and Southon1996).
ΔR values from all marine-terrestrial pairs in Prince Rupert Harbour by location. Note that the marine-terrestrial pairs from the Benke Lagoon area and one sample from the Tea Bay area (ΔR = 681 years) were selected from bulk samples. They are more likely to derive from mismatched pairs than the other samples presented in this figure. Similarly, the negative ΔR values from Kitandach and Tea Bay are likely the result of mismatched pairs, as they suggest higher 14C concentrations in the oceans than in the atmosphere.

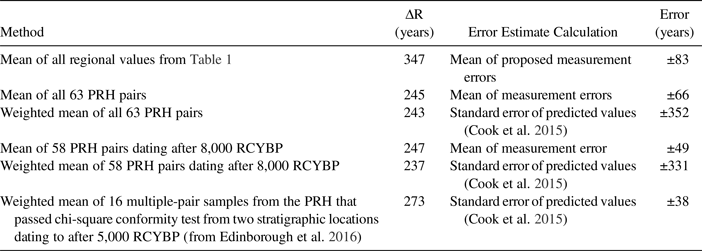
Pooling all of these pairs produces a weighted mean of 243 years. Using Cook and colleagues’ (Reference Cook, Ascough, Bonsall, Hamilton, Russell, Sayle, Scott and Bownes2015) revised calculation of standard error for predicted values generates a ΔR value of 243 ± 352, which is too uncertain to be of much use in archaeological chronologies. Data from before 8000 cal BP are both poorly sampled and highly variable. Excluding these values generates a ΔR of 237 ± 331, which is only a marginal improvement. Note that if we were to follow the common archaeological habit of estimating ΔR as a mean of both the values and the measured errors, we could return a result of 247 ± 49 years for the last 8,000 years, but this value would be an inaccurate estimate of ΔR and its precision.
Some subsets of the data show clear trends that have been reported as significant patterns in MRE. For example, Eldridge and colleagues (Reference Eldridge, Parker, Mueller and Crockford2014:67) calculated a linear regression for eight marine-terrestrial pairs from Casey Point (GbTo-54) that show a linear trend in ΔR that increases from about 0 to 400 years from about 3,000 years ago to the present. There is a single outlier (ΔR = ~800 years at about 2000 BP), which when discarded produced a very high R2 value (0.95) for predicting the slope of the remaining values. In the context of other PRH data, this pattern is considerably weakened, though it is possible that ΔR may vary less at specific site locations. If MRE varies in different parts of the PRH, then the challenge of estimating MRE is considerable. However, it is likely that mismatching of marine and terrestrial samples is the source of variation in this dataset, something that can be assessed via multiple-pair samples.
Calculating ΔR from Multiple-Pair Samples
Following Russell and colleagues (Reference Russell, Cook, Ascough, Scott and Dugmore2011), we dated four marine and four terrestrial samples from each of three stratigraphically intact archaeological contexts at the PRH site of Kitandach (GbTo-34; see Edinborough et al. Reference Edinborough, Martindale, Cook, Supernant and Ames2016). We selected four samples from paired charcoal and short-lived marine shell fragments (Mytilus spp., likely Mytilus trossulus) from three stratigraphic components (basal, terminal, and a mid-component transition) collected via percussion coring. Our results would be improved had we identified plant species of the charcoal samples and retained only short-lived ones. Dating of the samples generated 24 dates in total and 16 potential pairs of dates from each context—thus 48 pairs in total (Table 2).
As presented in Edinborough and colleagues (Reference Edinborough, Martindale, Cook, Supernant and Ames2016), the four terrestrial and four marine samples from each stratigraphic context were evaluated via chi-square tests to assess their coherence. Only one (CT2012-005, representing the basal layer of the site) passed the chi-square test, producing a ΔR as a weighted mean of 267 ± 45 at a mean terrestrial age of 4735 ± 107 cal BP. Removal of one marine and one terrestrial outlier from the upper layer of the site (CT2012-020) increased conformity in this set to a marginal fail, with a ΔR weighted mean of 288 ± 69 at a mean terrestrial age of 1637 ± 76 cal BP. The third set from the middle of the site (CT2012-001), which had a mean terrestrial age of 3722 ± 95 cal BP, was too varied to produce a ΔR value under the criteria of Russell and colleagues (Reference Russell, Cook, Ascough, Scott and Dugmore2011). Edinborough and colleagues (Reference Edinborough, Martindale, Cook, Supernant and Ames2016) chose the conservative route of discarding context CT2012-001 and computing a weighted mean of the results, with the error as the standard error for predicted values from CT2012-005 and CT2012-020 (ΔR = 273 ± 38) as the revised value of ΔR for the PRH.
Given the range of proposed values for a PRH ΔR and the mathematical options for its calculation, it is useful to compare results from alternate methods (Table 3). Here we illustrate the difference between a common archaeological approach to estimating ΔR using simple means of age differences and measured values against the use of weighted means and the standard error of predicted values (from Cook et al. Reference Cook, Ascough, Bonsall, Hamilton, Russell, Sayle, Scott and Bownes2015). Note that the different ΔR estimates are in reasonable accord with many of the regional estimates in Table 1, including the means of these proposed values and their measurement errors. The critical difference between these methods is in the way error is calculated, which has major implications for the accuracy of calibrated ages. A simple mean of measured errors from the PRH (Table 3) generates reasonably precise values (±66 for the entire sample, ±49 for the more coherent pre-8,000 RCYBP sample). However, applying the standard error of predicted values generates a far greater, and we argue more accurate, estimate of uncertainty (±352 for the entire sample, ±331 for the more coherent pre-8000 BP sample). These values are both far larger than most archaeological estimates (Table 1) and so large as to make dates from marine samples problematic in the construction of archaeological chronologies. The correct error estimate accurately reflects the heterogeneity of the sample pairs, likely a result of mismatched pairing. While we cannot control for vagaries in MRE over time, we can control for mismatching errors. Thus, the multiple-sample method using chi-square tests of conformity to ensure matching and exclude mismatching results in a correct error estimate of only ±38. This revised value is in line with other results developed for the region (Table 1) but is more accurate, as it is based on (1) the assessment of coherence from multiple pairs derived from the same stratigraphic context, (2) ΔR values computed via marine-modeled ages of calibrated terrestrial dates, (3) a weighted mean of the resulting values for ΔR to best approximate a constant over time, and (4) the use of Cook and colleagues’ (Reference Cook, Ascough, Bonsall, Hamilton, Russell, Sayle, Scott and Bownes2015) standard error for predicted values. We argue that these methods of both deriving and calculating estimates of ΔR should become standard in future archaeological assessments of ΔR.
Alternate Estimates of ΔR in the Prince Rupert Harbour (PRH) Area.

Conclusions
The challenge for archaeologists using marine-sourced 14C age measurements is finding a balance between accuracy (the proximity of results to reality) and precision (the range of uncertainty in results) in the estimate of marine reservoir effect via ΔR. Achieving this balance is possible with the multiple-pair approach derived from Ascough and colleagues (Reference Ascough, Cook, Church, Dugmore, McGovern, Dunbar, Frioriksson and Gestsdóttir2007), Russell and colleagues (Reference Russell, Cook, Ascough, Scott and Dugmore2011), and Cook and colleagues (Reference Cook, Ascough, Bonsall, Hamilton, Russell, Sayle, Scott and Bownes2015). This method requires more investment by archaeologists in radiocarbon dating of marine-terrestrial 14C pairs. However, it is more efficient and cost-effective than simply increasing marine-terrestrial pair sample sizes, which often exacerbates variability between ∆R estimates, because it cannot control for mismatched samples. Research budgets and overarching chronological objectives of archaeological projects in coastal settings may have to be adjusted at the project planning and grant application stage as a result. However, the benefits include improved chronological resolution and the fact that a large number of existing marine shell 14C measurements can be appropriately recalibrated and incorporated into regional chronologies. The PRH example indicates that the analytical benefits are clear, as the multiple-pair method provides a relatively affordable solution that generates a statistically robust result in comparison with single paired samples. Given the variability in our results, we are cautious in extending the temporal range for our calculated ΔR. We have insufficient data to propose a ΔR for before 5,000 years ago. For these time periods (e.g., Letham et al. Reference Letham, Martindale, Macdonald, Guiry, Jones and Ames2016), we use the value for the last 5,000 years with the caveat that new data from the terminal Pleistocene and early Holocene are likely to modify it. Finally, archaeologists would be well served by engaging with geologic and geochemical scholars as they propose and refine the use of ΔR to estimate MRE for archaeological research.
Acknowledgments
This research was conducted with the support and partnership of the Lax Kw'alaams and Metlakatla Indian Bands and the nine hereditary tribes they represent; we are most grateful for permission to work on their lands and history. Funding for this research was provided by the National Science Foundation (US) grant #1216847 (principal investigator: K. Ames) and the Social Science and Humanities Research Council of Canada grant #410-2011-0841 (principal investigator: A. Martindale). Canadian National Rail is thanked for its financial and other assistance to Millennia Research Limited to complete the excavation and analysis of the Casey Point sites. We also thank T. J. Brown, Bryn Letham, and Michael Richards for providing much useful guidance during the planning and editing of this article. We thank Paula Reimer for access to the intercept concatenation tables and a prepublished version of the announcement of deltar. We are grateful to the three anonymous reviewers whose careful assessment of this work improved it considerably. Many thanks to Luis Borrero for the Spanish translation of the abstract.
Data Availability Statement
The radiocarbon data on which this analysis is based are included within this publication as supplemental material and in Table 2.
Supplemental Materials
For supplementary material accompanying this article, visit https://doi.org/10.1017/aaq.2018.47.
The supplemental materials accompanying this article are data and formulae in an MS Excel spreadsheet containing radiocarbon dates and the calculation of ΔR and Standard Error (Sheet 1) and the multiple paired samples of radiocarbon dates and the calculation of weighted means and chi-square values (Sheet 2).