Introduction
The order Ricinulei is an enigmatic group of arachnids indigenous in modern times to West Africa, South America, and Central America (Selden, Reference Selden1992). The order was originally described from fossil material found in England by William Buckland, who misinterpreted the specimen as a curculionid beetle (Buckland, Reference Buckland1837). A year later, the first living specimen was discovered, and classified as an opilionid (Guérin-Méneville, Reference Guérin-Méneville1838a, Reference Guérin-Ménevilleb). From the outset, this peculiar group of arachnids was little understood due to their limited ranges, rarity, and secretive nature (Finnegan, Reference Finnegan1935; Selden, Reference Selden1992). It was not until 1904 that ricinuleids were separated from Opiliones and elevated to order Ricinulei Thorell, Reference Thorell1876 (Hansen and Sørensen, Reference Hansen and Sørensen1904). To this day they remain understudied, with much of their natural history unknown.
The position of Ricinulei within Arachnida has been a subject of debate (Garwood and Dunlop, Reference Garwood and Dunlop2014). Due to the suite of conflicting characters possessed by the order, several contradictory relationships to different arachnid groups have been proposed. Early classification schemes suggested a close relationship to the mites (Acari) primarily on the basis that both orders exhibit six-legged larvae that develop into eight-legged adults (Shultz, Reference Shultz2007). The locking mechanism that joins the carapace and opisthosoma and the divided opisthosomal tergites suggest their classification as sister to the order Trigonotarbida, an extinct group of arachnids that are among the earliest terrestrial organisms (Dunlop, Reference Dunlop2010). Most recently, genetic evidence suggests ricinuleids may be most closely related to the order Xiphosura (horseshoe crabs) (Ballesteros and Sharma, Reference Ballesteros and Sharma2019).
Extant ricinuleids are small, blind predators that inhabit caves and the litter of rainforest floors, seeking prey with their elongate sensory second leg pair (Adis et al., Reference Adis, Platnick, de Morais and Gomes Rodrigues1989). A paucity of observations has left many questions regarding their ecological niche, including their diet in the wild and their population structure (Platnick and Pass, Reference Platnick and Pass1982). Ricinuleids are often found in large congregations, though the behavioral purpose of this grouping behavior is speculative and remains untested (Mitchell, Reference Mitchell1969). Despite their relatively low diversity (extant ricinuleids form a single family with only three genera), ricinuleids occupy a surprisingly large number of diverse niches (Selden, Reference Selden1992). Extant species occupy one of only two major ecotypes (soil dwellers or troglodytic). Nonetheless, they exhibit diverse adaptations to these niches, from the modified setae of Cryptocellus adisi Platnick, Reference Platnick1988, which create an air pocket around themselves to survive periodic inundations of the soil, to the elongate legs of the troglodytic Pseudocellus krejcae Cokendolpher and Enríquez, Reference Cokendolpher and Enríquez2004, which allow it to walk over the surface of subterranean pools (Adis et al., Reference Adis, Messner and Platnick1999; Cokendolpher and Enríquez, Reference Cokendolpher and Enríquez2004). Hence, despite being relatively low in taxonomic diversity, ricinuleids nonetheless represent a myriad of interesting adaptations and ecologies that demand further study.
In contrast to the low taxonomic diversity of extant ricinuleids, the fossil record presents a veritable cornucopia of ricinuleid biodiversity. Four families and six genera contain 21 identified fossil species, yet the evolutionary history of the group remains ambiguous due to large spatial and temporal gaps in the ricinuleid fossil record (Selden, Reference Selden1992; Wunderlich, Reference Wunderlich2015). Fossil ricinuleids are known only from the Pennsylvanian and the Cretaceous, and from only a few localities in Myanmar, England, Germany, and the United States (Selden, Reference Selden1992; Wunderlich, Reference Wunderlich2017). The mid-Cretaceous (99 Ma) specimens (two genera, five species) come from Burmese amber (Shi et al., Reference Shi, Grimaldi, Harlow, Wang, Wang, Yang, Lei, Li and Li2012; Selden and Ren, Reference Selden and Ren2017). The majority of fossil ricinuleids, however, originate from the Atokan and Desmoinesian (Moscovian) stages of the Pennsylvanian (ca. 308–315 Ma) (Selden, Reference Selden1992; Wagner and Winkler Prins, Reference Wagner and Winkler Prins2016). The North American specimens occur primarily in the Pennsylvanian Fossil-Lagerstätte of Mazon Creek, Grundy Co., Illinois, apart from a single specimen from Morris, Oklahoma (Selden, Reference Selden1992). The Mazon Creek fossils occur in the Francis Creek Shale, which is part of the Carbondale Formation (Willman et al., Reference Willman, Atherton, Buschbach, Collinson, Frye, Hopkins, Lineback and Simon1975). The Francis Creek Shale directly overlies the Colchester No. 2 Coal; it is composed of shales and fluvial sandstones (Baird, Reference Baird and Nitecki1979).
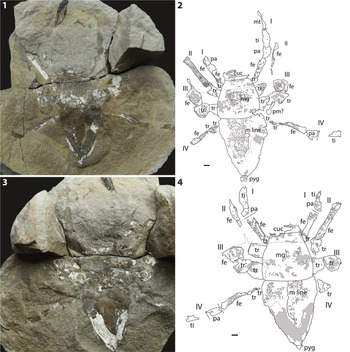
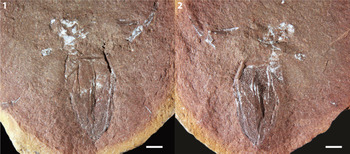
Here, we describe a new fossil ricinuleid from the Pennsylvanian of Illinois (Fig. 1), the first Pennsylvanian ricinuleid described since 1992 (Selden, Reference Selden1992). The fossil comes from the Energy Shale in Vermilion County, a new stratigraphic and geographic locale for fossil ricinuleids. The fossil is referred to a new species in the genus Curculioides Buckland, Reference Buckland1837, C. bohemondi n. sp. The specimen is notable for its numerous, large, well-preserved tubercles. At 21.77 mm body length, it is the largest ricinuleid known, living or extinct. We also take the opportunity to illustrate the Oklahoma ricinuleid, Amarixys gracilis (Petrunkevitch, Reference Petrunkevitch1945), mentioned by Selden (Reference Selden1992) but not previously figured (Fig. 2).
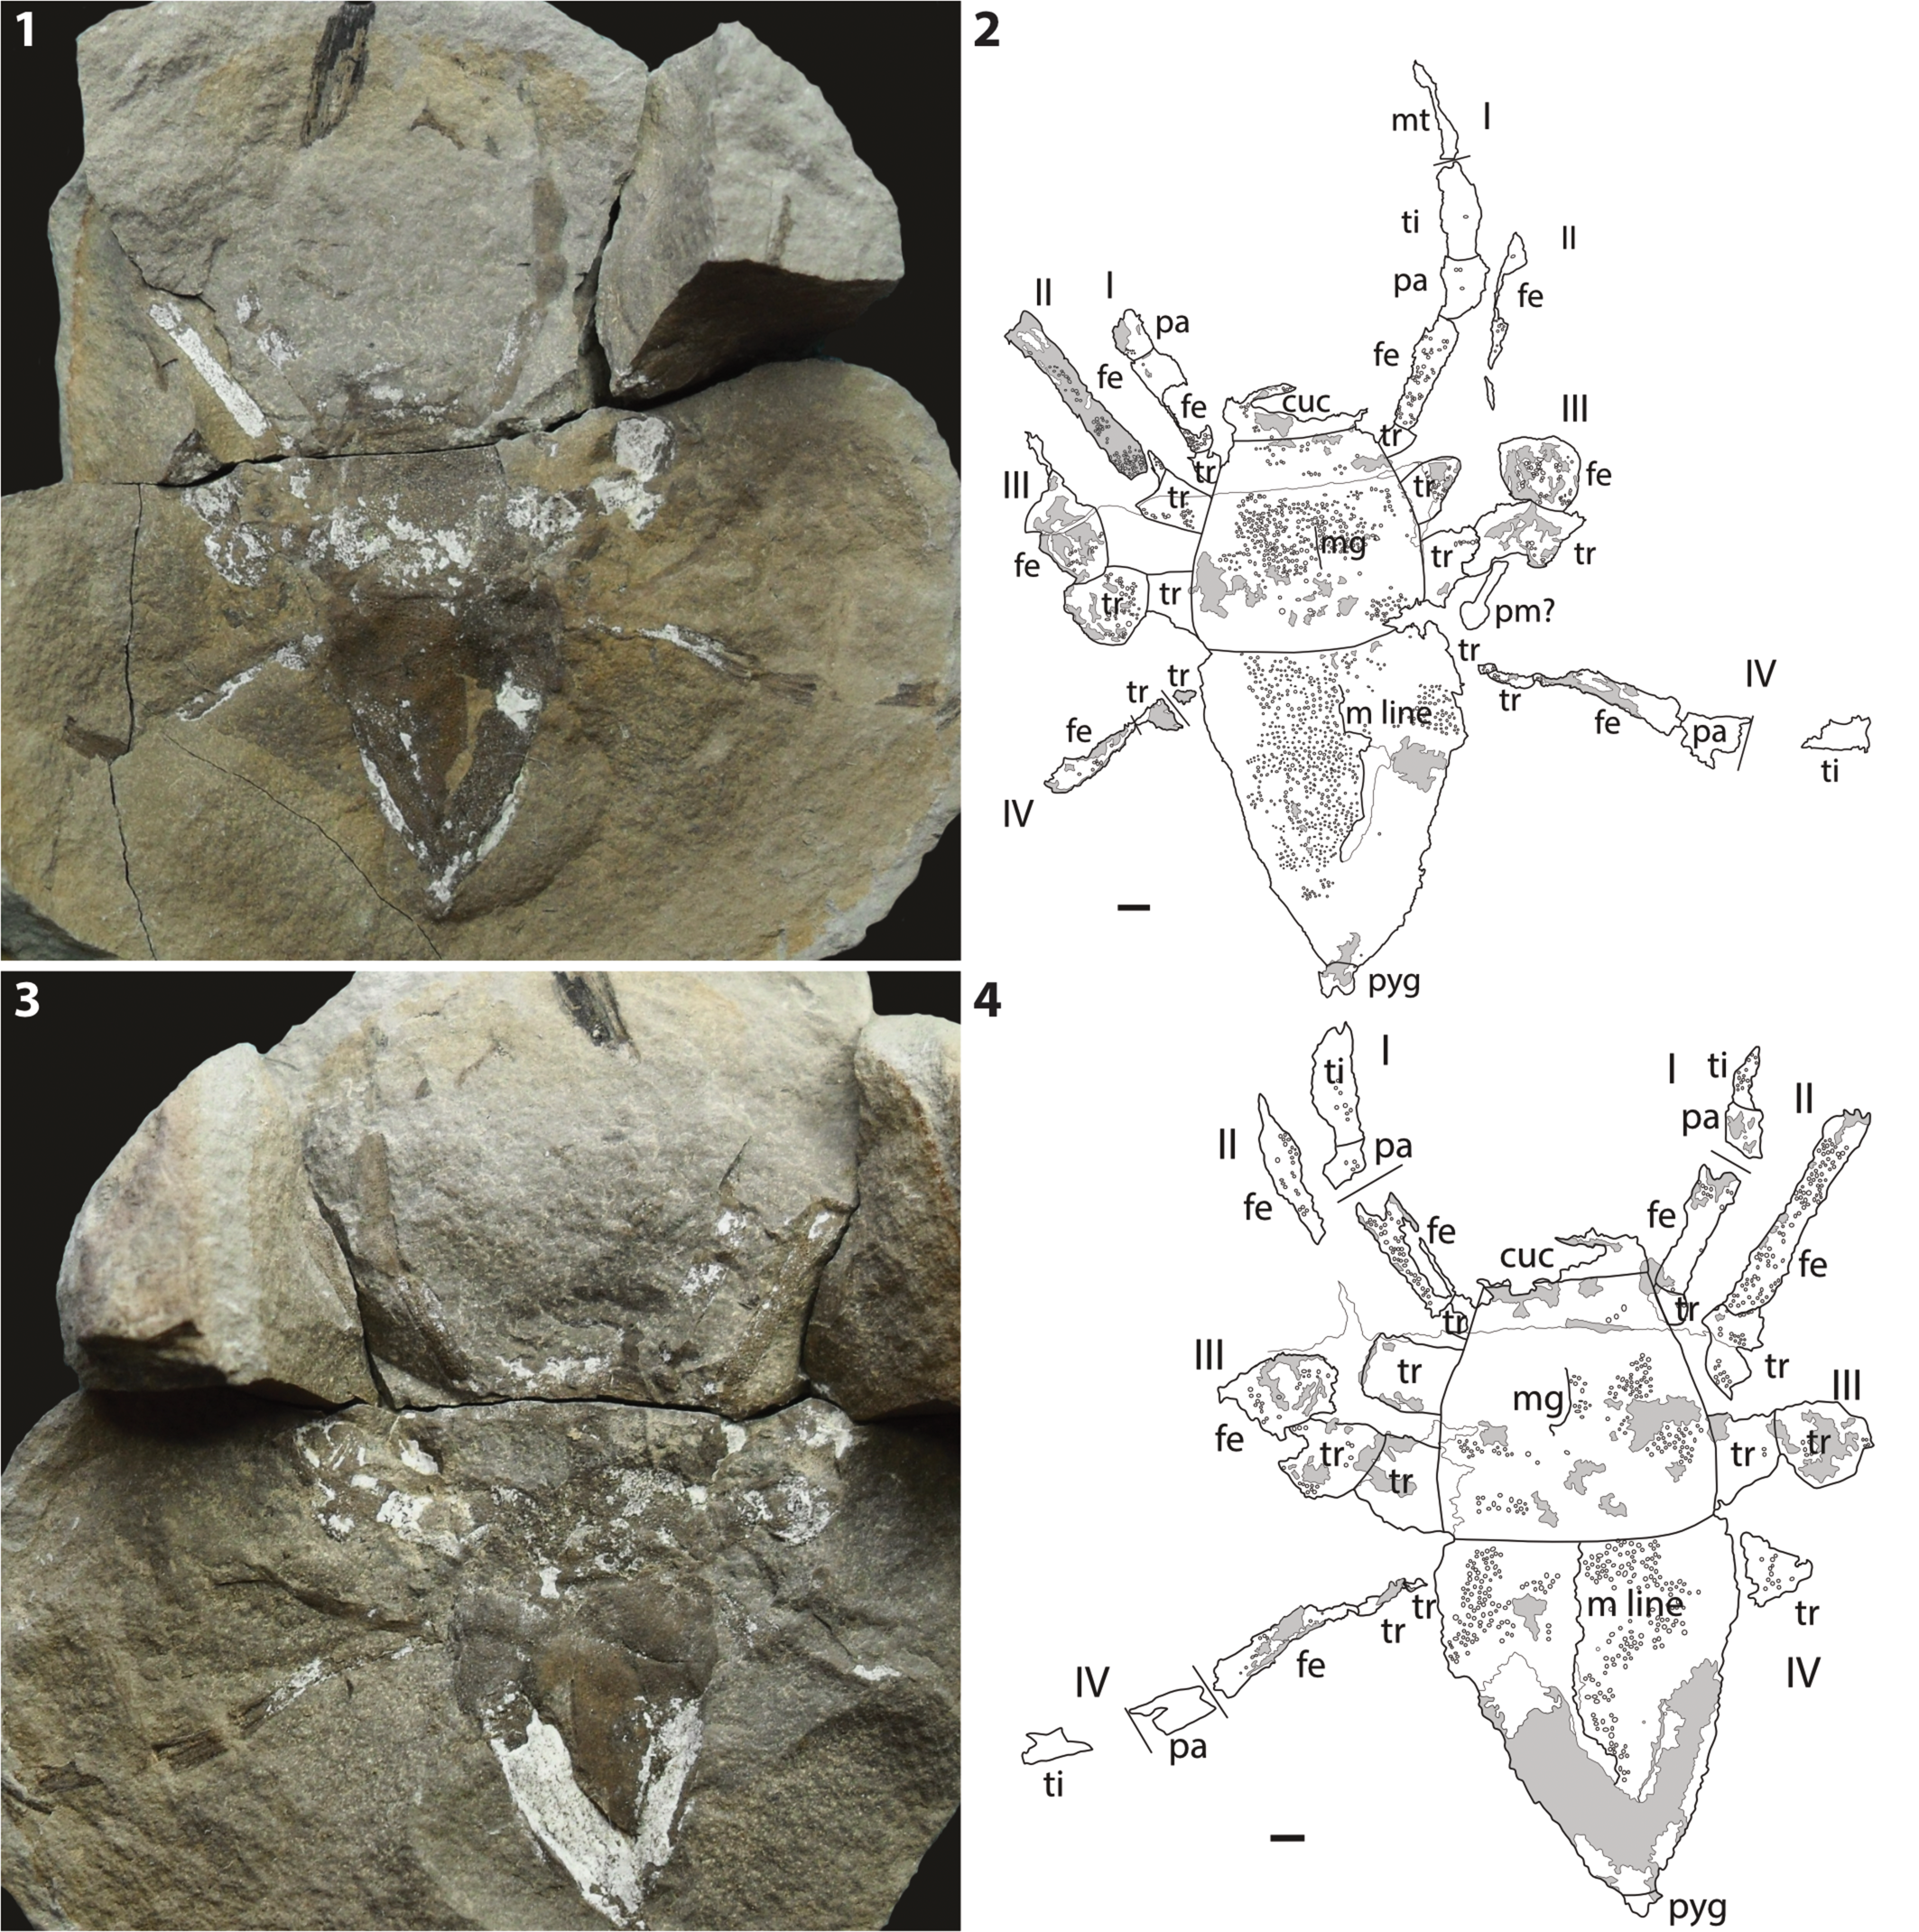
Curculioides bohemondi n. sp., holotype and only known specimen, ACCN2015-104, Pennsylvanian (Desmoinesian) Energy Shale Member, Carbondale Formation, Kewanee Group, near Little Vermilion River, Georgetown, Vermilion County, Illinois. (1) Photograph of part; (2) explanatory drawing of part; (3) photograph of counterpart; (4) explanatory drawing of counterpart. I–IV = walking legs 1–4; cuc = cucullus; fe = femur; m line = median line; mg = medial groove; mt = metatarsus; pa = patella; pm = plant material; pyg = pygidium; ti = tibia; tr, trochanter. Gray areas represent kaolinite; other thin lines are fractures. Scale bars = 1 mm.
Amarixys gracilis (Petrunkevitch, Reference Petrunkevitch1945), Field Museum of Natural History PE56942, from Westphalian strata, north-west of Morris, Okmulgee County, Oklahoma. Specimen mentioned by Selden (Reference Selden1992), but not previously figured. (1) Photograph of part; (2) Photograph of counterpart. Scale bars = 1 mm.

Ricinuleid ontogeny consists of five post-egg life stages: larva, protonymph, deutonymph, tritonymph, and adult (Pittard and Mitchell, Reference Pittard and Mitchell1972). Determining the life stage of fossil specimens has often proven problematic. Definitive ontogenetic conclusions cannot generally be made because the majority of ricinuleid fossils fail to preserve the most-recognizable defining feature of each life stage—the number of terminal tarsomeres on each leg (Pittard and Mitchell, Reference Pittard and Mitchell1972). With the aim of identifying a potential life stage that the specimen could represent, we examine ontogenetic trends in extant ricinuleids, with a primary focus on a character often found in fossil specimens: the tubercles. Tubercles are raised, roughly hemispherical bumps covering the cuticle surface of both extinct and extant ricinuleids. The utility of tubercles in diagnosing adult members of ricinuleid species has previously been documented, but the changes these structures may undergo across life stages have not been explored (Selden, Reference Selden1992). To determine if these potential changes correlate with life stage, tubercles were examined throughout the ontogeny of representative species from all three modern ricinuleid genera.
Geological setting
The Kewanee Group lies in the middle of the Pennsylvanian strata of Illinois, situated between the underlying McCormick Group and the overlying McLeansboro Group (Willman et al., Reference Willman, Atherton, Buschbach, Collinson, Frye, Hopkins, Lineback and Simon1975). The Kewanee Group contains the highest concentration of coals of the three units and exhibits the first appearance of widespread, uniformly thick limestones in the Illinois Pennsylvanian (Kosanke et al., Reference Kosanke, Simon, Wanless and Willman1960). The ricinuleid fossil was discovered in the Carbondale Formation of the Kewanee Group, a unit notable for including among its most distinguished members the Francis Creek Shale: stratigraphic home to the Mazon Creek biota, which has previously produced a number of ricinuleid specimens (Willman et al., Reference Willman, Atherton, Buschbach, Collinson, Frye, Hopkins, Lineback and Simon1975; Selden, Reference Selden1992).
In Vermilion County, where the new specimen was discovered, the Carbondale Formation averages 200 ft. thick and is composed primarily of gray shales with associated sandstone channels, thin argillaceous limestones, and numerous coals (Jacobson et al., Reference Jacobson, Goodwin and White1980). The fossil was found in the Energy Shale Member of the Carbondale Formation, a gray silty shale that can reach up to 100 ft. in thickness (Jacobson et al., Reference Jacobson, Goodwin and White1980). The Energy Shale is located between the underlying Herrin No. 6 Coal and the overlying Anna Shale and exhibits a noteworthy drop of 3–5% sulfur content from the neighboring rocks (Jacobson et al., Reference Jacobson, Goodwin and White1980). Sulfurs in coals are thought to originate from exposure to seawater, hence this low-sulfur content suggests that the Energy Shale represents a freshwater system (Nelson, Reference Nelson1983).
The Energy Shale is primarily interpreted as a series of crevasse-splay deposits; the source river is thought to be preserved in the form of the Walshville Channel, an enormous (one mile wide, 60–80 ft. thick) channel sandstone cutting through the upper part of the Herrin No. 6 Coal and the Energy Shale (Burk et al., Reference Burk, Deshowitz and Utgaard1987; Hatch and Affolter, Reference Hatch, Affolter, Hatch and Affolter2002). The deposition of these fluvial features is considered to have been contemporaneous with the deposition of peat, which became the Herrin No. 6 Coal (Treworgy and Jacobson, Reference Treworgy and Jacobson1985). The Energy Shale dates to the Desmoinesian Stage (ca. upper Moscovian), fixing it firmly in the middle of the Pennsylvanian, 308–306 Ma (Willman et al., Reference Willman, Atherton, Buschbach, Collinson, Frye, Hopkins, Lineback and Simon1975). The paleoclimate would have been hotter and drier than the preceding stages of the Pennsylvanian, but still wet enough to form swamps during frequent humid, rain-heavy periods (Cecil, Reference Cecil1990).
The basal 5 m of the Energy Shale contain numerous siderite concretions that preserve various plants as well as terrestrial and marine fauna (Burk et al., Reference Burk, Deshowitz and Utgaard1987; Baird et al., Reference Baird, Sroka, Shabica and Beard1985). Concretions occur in a faintly laminar gray, silty mudstone and contain diverse organisms, such as branchiopods, freshwater shark egg capsules, syncarid shrimps, Euproops, aquatic bivalves, and, on rare occasions, flying insects (Baird et al., Reference Baird, Sroka, Shabica and Beard1985). Later transgression of the sea from the southwest flooded the Walshville Channel river system, resulting in the overlying brackish–marine Anna Shale and Bereton Limestone members (Treworgy and Jacobson, Reference Treworgy and Jacobson1985; Burk et al., Reference Burk, Deshowitz and Utgaard1987).
Morphological interpretation
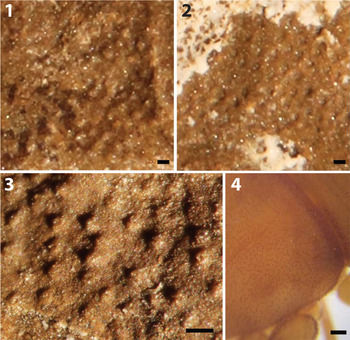
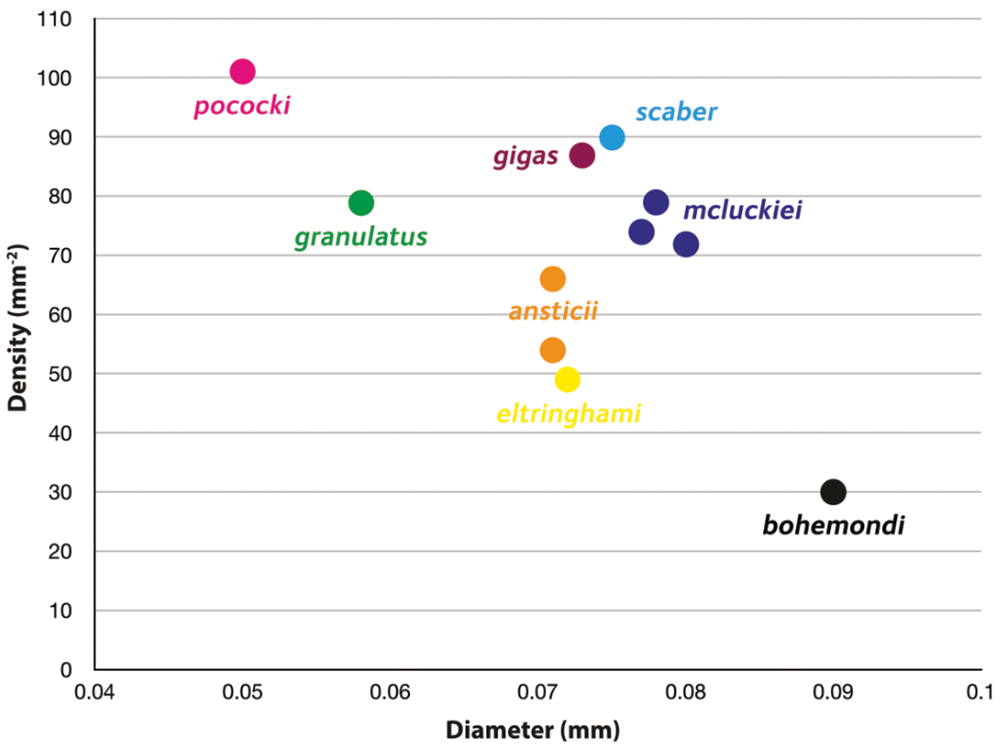
Both part and counterpart (Fig. 1) represent the dorsal surface, with the part representing an external mold and the counterpart preserving a combination of internal and external molds. The ventral surface is not preserved. Tubercles cover the entire body and are unimodal in size. Tubercles lack any sort of surface sculpturing or ornamentation; if such fine features were originally present, they were likely lost during fossilization. The rounded apex and overall circular morphology of the well-defined opisthosoma tubercles suggest they most closely resembled the small dome-like tubercles of extant ricinuleids; conversely, the shallow relief exhibited by the less well-defined carapace tubercles suggests a more flattened apex typical of iridescent tubercles (Salvatierra and Tourinho, Reference Salvatierra and Tourinho2016; Fig. 3). Due to the lack of any sculpted surfaces on these tubercles however, such identifications remain tenuous. At 113% the diameter and 60% the density of the next largest and sparsely distributed ricinuleid tubercles (Fig. 4), the tubercles of this specimen are greater in size and distributed more sparsely than those of any other known fossil species (Selden, Reference Selden1992).
Detail of tuberculation in Curculioides bohemondi n. sp. and Pseudocellus pearsei. (1) C. bohemondi n. sp. carapace tubercles preserved as internal molds. Scale bar = 0.1 mm. (2) C. bohemondi n. sp. carapace tubercles preserved as external molds. Scale bar = 0.1 mm. (3) C. bohemondi n. sp. opisthosoma tubercles showing exceptional preservation, preserved as internal molds. Scale bar = 0.1 mm. (4) Carapace of P. pearsei showing tuberculation in modern ricinuleids. Scale bar = 1 mm.

Graph of tubercle size against density on the dorsal cuticle of Curculioides specimens. The new species described here, C. bohemondi n. sp., plots far away from other Curculioides species on account of its larger tubercles at a very low density.

The cucullus is partially preserved as a scrap anterior to the carapace on both the part and the counterpart. Some weak tuberculation is present on the part, however much is obscured by heavy mineralization, including its margin with the carapace. No tuberculation is visible on the counterpart. It appears to have been preserved in an open position based on its significant anterior projection. A small depression is visible running longitudinally near the lateral edge of the cucullus in the part, similar to the observed longitudinal grooves in the cucullus of Curculioides mcluckiei Selden, Reference Selden1992.
The carapace exhibits a straight anterior margin with the cucullus. It then broadens posteriorly until its termination with the gently procurved posterior margin. A single median longitudinal groove runs down the midline of the carapace, visible most clearly as an external mold on the part; the counterpart has fractured along this groove. No change in tubercle distribution is evident nearer to the groove. It extends about two-thirds the length of the carapace before fading out. The median groove divides this anterior region of the carapace into two raised areas, forming a pair of raised lobes most visible as an external mold on the part. The median groove runs directly into the topographically lower posterior region of the carapace, forming a triangular spandrel-like architecture between the two lobes. Although this precise morphological arrangement of raised areas is unique, raised carapace areas have previously been observed in the Pennsylvanian ricinuleid Amarixys stellaris Selden, Reference Selden1992. No posterior depressions (or the characteristic smaller tubercles normally contained therein) are evident. Extensive tuberculation is present across the carapace on both the part and the counterpart. A crack running latitudinally through the carapace on both the part and counterpart, and the glue used to repair it, partly obscures the area where eyes likely may have been originally present. Because no evidence of eyes can be observed on the margins of the glued area, it appears they may have been reduced in size, if indeed they were present at all. With such a large area obscured, no definite conclusion can be made.
The opisthosoma is better preserved on the part, but also possesses areas of mineralization and fracturing. Its margin with the carapace is defined by an untuberculated groove, which is visible as an external mold on the part. The remainder of the opisthosoma is well tuberculated and exhibits a median longitudinal line, but the line appears to have been somewhat warped by taphonomic processes and is only well defined close to the carapace and near the distal end of the body; it can be seen most clearly on the counterpart. Tubercles appear almost ordered on the opisthosoma, substituting the random distribution found across the rest of the body for a series of curved rows and columns, mirroring the curve of the carapace-opisthosoma boundary. Several particularly well-preserved tubercles are exhibited on the counterpart directly adjacent to this boundary. At the distal end of the opisthosoma, the pygidium appears relatively well defined, though neither the second nor the third segments appear to be extended. The pygidium curves slightly off the midline, presumably warped by taphonomic processes.
The appendages are preserved in varying degrees of detail. No appendage is preserved completely; preserved material invariably terminates before reaching the tarsus. The pedipalps are present neither in the part nor the counterpart. It is possible that they were folded beneath the carapace or in some way torn off near the coxae. Legs I and II are best preserved, though detail is lost distally from the body. A dark, organically stained area extending from the right leg I in the part is interpreted as a continuation of the leg, including the patella, tibia, and part of the metatarsus. Unlike the femur of this appendage, these segments lack tuberculation or any form of structure more delicate than their gross morphology. This is most likely due to taphonomic processes and is not a true representation of the original condition of the limb. The femora are the best-preserved podomeres, with leg II providing a particularly exceptional example on the left side of the part and right side of the counterpart. This segment retains much of the original tuberculation but, unlike leg I, lacks any further distal segments. Interpretation of the segments is generally based on small areas where preservation is weaker and appear to line up with where segments would presumably be divided. It is likely these liminal regions of the limb, being less robust than the adjacent segments, were lost during fossilization. The femur of leg II, compared to that of leg I, does not appear to be enlarged. Leg III appears to be the most poorly preserved leg, retaining only lobe-shaped structures extending out from the body midway down the carapace. These distorted shapes are interpreted as originally being the first and second trochanters of these limbs, now damaged and contorted. It is unlikely that these areas represent the femur given they lack an elongate morphology and appear roughly as long as they are wide. This width is notably greater than that of the trochanter of any other appendage. Leg IV is the longest preserved appendage, although, as in the case of leg I, significant detail is lost in the distal segments, so their identity is somewhat dubious. The first two trochanters of leg IV are preserved as very small scraps that lack much detail, which are followed by a better preserved elongate structure interpreted as the femur. The femur pinches out distally, followed by a small patch slightly longer than it is wide, interpreted as the patella. Finally, the tibia is the most poorly preserved and the most distal segment the specimen exhibits from leg IV; it is present only as a scrap some distance away from, but still in line with, the terminus of the patella.
Materials and methods
The specimen (Fig. 1) is preserved in a brown, fine-grained concretion, which is split horizontally through the specimen, creating part and counterpart. Several fragmentary plant remains are preserved in longitudinal section on the same plane as the specimen. It was studied and photographed dry, in both direct and low-angle light, using a Leica M205C stereomicroscope, and photographed with a Canon EOS 5D MK II camera mounted on the microscope. Illustrations were drawn using a camera lucida attachment to the microscope at 11× magnification. The pencil drawing was then traced in Adobe Illustrator. All measurements are in mm.
Due to the large size of the new specimen, we posited that it might represent the adult form of a previously described fossil species. In order to investigate this possibility, ontogenetic analyses of both extant and extinct ricinuleids were performed involving carapace length and tubercle size (two characters that are reliably ubiquitous in fossil specimens), in the expectation that these criteria might identify juvenile stages (Selden, Reference Selden1992). Observations were made on ricinuleid species for which one or more nymphs have been identified and described. The species included in this analysis included all three extant ricinuleid genera: Ricinoides karschii Hansen and Sørensen, Reference Hansen and Sørensen1904, R. hanseni Legg, Reference Legg1976, R. sp., Pseudocellus olmeca Valdez-Mondragón, Francke, and Botero-Trujillo, Reference Valdez-Mondragón, Francke and Botero-Trujillo2018, P. quetzalcoatl Valdez-Mondragón, Francke, and Botero-Trujillo, Reference Valdez-Mondragón, Francke and Botero-Trujillo2018, P. pearsei Chamberlin and Ivie, Reference Chamberlin and Ivie1938, Cryptocellus conori Tourinho and Saturnino, Reference Tourinho and Saturnino2010, C. pelaezi Pittard and Mitchell, Reference Pittard and Mitchell1972, and C. magnus Ewing, Reference Ewing1929. Measurements were made directly from the literature for all species, excepting P. pearsei, C. magnus, R. karschii, and R. sp. these species were analyzed instead from a collection of previously undescribed nymphal stages in the collections of the American Museum of Natural History (AMNH), and the California Academy of Sciences (CAS).
Tubercle diameter was divided by the length of the carapace to determine the “tubercle coefficient” (TC), a measure of the size of the tubercles compared to the size of the organism. Carapace length, as opposed to the total body length, was chosen because it has been shown to vary less between individuals than total body length (Adis et al., Reference Adis, Platnick, de Morais and Gomes Rodrigues1989). In keeping with previous assessments of tubercle diameter, measurements were taken from the carapace only (Selden, Reference Selden1992). Measurements were determined using ImageJ (imagej.net); 20 tubercles, the highest number that could reliably and consistently be found in fossil specimens, were measured from each individual. In the case of asymmetric tubercles, diameters were taken along their longest axis. When tubercles appeared in clumps, as in the case of the Ricinoides specimens, diameters were taken from the individual tubercles making up these clumps. All five life stages were sampled in six of the 10 species; measurements for P. quetzalcoatl exclude the protonymph, while P. olmeca and C. conori do not include the protonymph or deutonymph. Tubercles appeared to exhibit consistent overall morphologies between life stages (i.e., clumped tubercles in the protonymph of R. karschii developed into clumped tubercles in the adults), although no intensive examination of their morphologies was attempted.
Two-way analyses of variance (ANOVA) were performed in R (r-project.org) to determine whether TC varies significantly between life stages (R Core Team, 2019). The data for each species was divided into two columns: TC, calculated individually for each of the 20 diameters, and life stage (LS). Normality was confirmed using the diagnostic plots in R. Linear models were constructed from the data, treating LS as the independent variable and TC as the dependent variable. A null linear model was constructed for each species assuming no influence of LS on TC, and an alternative linear model was constructed assuming LS did influence TC. ANOVA tests were performed to determine if any significant difference (p < 0.05) was present between the fit of the data to these two models.
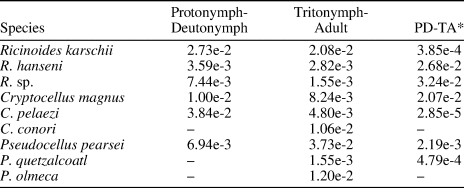
Two one-sided t-tests (TOST) were utilized to test for statistical equivalence (p < 0.05) of TC between life stages. Unlike ANOVA tests, TOST analyses assume the samples are statistically different as the null hypothesis, with the alternative hypothesis indicating the two samples are equivalent (Limentani et al., Reference Limentani, Ringo, Ye, Bergquist and McSoreley2005). TOST analyses are primarily used for equivalence testing in the pharmaceutical industry, but more recently have been employed to test biological hypotheses (Rose et al., Reference Rose, Mathew, Coss, Lohr and Omland2018). Due to the nature of the test, only two samples can be compared at a time (Limentani et al., Reference Limentani, Ringo, Ye, Bergquist and McSoreley2005). As such, three TOST analyses (R-package ‘equivalence’) were performed for each species to assess the equivalence of all stages to each other (Robinson, Reference Robinson2016). The first compared the TC values of the protonymph and deutonymph; the second compared the TC values of the tritonymph and adult; and the third compared the combined TC values of the protonymph and deutonymph to the combined TC values of the tritonymph and adult. When a life stage from a species was not sampled, comparisons were made only between the life stages available. The average standard deviation of the samples being compared was used as the theta value (referred to as “epsilon” in the r-code), the variable representing the amount of variation the means of two samples may exhibit while remaining statistically equivalent (Limentani et al., Reference Limentani, Ringo, Ye, Bergquist and McSoreley2005). The standard deviation is a measure of the variability of a sample that roughly represents the average distance between the data points making up the sample and the mean (McKenzie, Reference McKenzie2014). If two means are equivalent, they would be expected to fall within less than a standard deviation from each other; implying each is within the expected average variability of the other. Taking the average standard deviation from both samples mitigates the potential issue of a single large standard deviation from one of the samples guaranteeing equivalence.
ANOVA tests were again performed to determine if TC varies between species in extant genera. Data were divided into two columns, TC and species. One test was performed for each genus. Species was treated as the independent variable and TC as the dependent variable. A null model was constructed that assumed no influence of species on TC, as well as an alternative model that assumed species did influence TC. The fit of the data to these models was compared using an ANOVA test. An additional ANOVA test was performed on the same parameters of the two largest fossil Curculioides species, C. gigas Selden, Reference Selden1992 and C. bohemondi n. sp., to determine whether this character was species specific in the genus.
Repositories and institutional abbreviations
The new specimen is held in the Research and Collections Center, Illinois State Museum, under the designation ACCN2015-104. The Oklahoma Amarixys gracilis (Petrunkevitch, Reference Petrunkevitch1945) is held in the Field Museum of Natural History with number PE56942.
Systematic paleontology
Order Ricinulei Thorell, Reference Thorell1876
Suborder Posteriorricinulei Wunderlich, Reference Wunderlich2015
Infraorder Palaeoricinulei Selden, Reference Selden1992
Family Curculioididae Cockerell, Reference Cockerell1916
Genus Curculioides Buckland, Reference Buckland1837
Type species
Curculioides ansticii Buckland, Reference Buckland1837.
Diagnosis
As in Selden (Reference Selden1992).
Remarks
The specimen can be placed in Ricinulei on the basis of its possession of a cucullus, which is a synapomorphy for the order. The specimen is referred to the family Curculioididae because of the presence of a median line or sulcus on the dorsal opisthosoma. The new fossil has a median line, not a sulcus, and thus belongs in Curculioides rather than Amarixys Selden, Reference Selden1992.
Holotype
One specimen, ACCN2015-104, from the middle Pennsylvanian (Desmoinesian, 308–306 Ma) Energy Shale Member of the Carbondale Formation, Kewanee Group, near Little Vermilion River, Georgetown, Vermilion County, east-central Illinois (Baird et al., Reference Baird, Sroka, Shabica and Beard1985).
Diagnosis
Curculioides with cuticular tubercles >0.090 mm in diameter and a density of ~30 mm-2. All other species of Curculioides have smaller tubercles (<0.085 mm) and a much greater density (>60 mm-2) (Selden, Reference Selden1992, table 1); lacking transverse opisthosomal lines seen in C. gigas; raised areas on anterior carapace divided by median longitudinal groove.
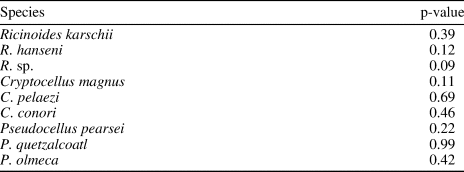
Results of ANOVA tests measuring the significance (p < 0.05) of the effect of life stage on the tubercle coefficient.

Description
Body length 23.59 mm. Tubercles distributed evenly over entire body, diameter 0.09 mm, density 30 mm-2. Cucullus length 1.58 mm, width 4.98 mm. Carapace rounded trapezoid in dorsal outline; length 8.19 mm, width 4.91 mm; anterior margin straight, carapace broadens posteriorly to gently procurved posterior margin, rounded posterolateral corners; median longitudinal groove running down midline from anterior to ~⅔ length of carapace; raised anterior areas adjacent to longitudinal groove; no posterior depressions. Opisthosoma elongated subtriangular in dorsal outline, with straight anterior margin, gently outwardly curved lateral margins converging to pygidium, median longitudinal groove; length 12.79 mm, width 9.68 mm. Pygidium 3-segmented, length 1.03 mm, width 1.28 mm. Podomere lengths: Leg I trochanter length 1.13 mm, width 0.92 mm. Leg I femur length 4.25 mm, width 1.34 mm. Leg I patella length 1.83 mm, width 1.57 mm. Leg I tibia length 3.50 mm, width 1.35 mm. Leg I metatarsus length 3.90 mm. Leg II trochanter length 2.44 mm, width 1.76 mm. Leg II femur length 8.44 mm, width 1.11 mm. Leg III trochanter I length 1.81 mm, width 1.75 mm. Leg III trochanter II length 2.63 mm, width 2.48 mm. Leg IV trochanter I length 1.33 mm. Leg IV trochanter II length 2.24 mm. Leg IV femur length 5.54 mm, width 1.36 mm. Leg IV patella length 2.30 mm, width 1.7 mm. Leg IV tibia length 4.46 mm, width 1.48 mm.
Etymology
Named for the eleventh century crusader Marc Guiscard, who received the nickname Bohemond (after a mythical giant) due to his immense stature, in recognition of the large size of the fossil specimen.
Remarks
Tuberculation is one of the main characters used to distinguish the fossil ricinuleids (Selden, Reference Selden1992). Figure 4 shows a plot of tubercle diameter against density for Curculioides species. Curculioides bohemondi n. sp. plots far from the other species in this genus. The tubercles of C. bohemondi n. sp. are much larger (>0.090) than those of other Curculioides species (see Selden, Reference Selden1992, table 1). The smallest are found in C. pococki Selden, Reference Selden1992 (<0.055), in C. granulatus Petrunkevitch, Reference Petrunkevitch1949 they are <0.065, and in C. mcluckiei Selden, Reference Selden1992, C. eltringhami Petrunkevitch, Reference Petrunkevitch1949, and C. scaber Scudder, Reference Scudder1890 they are 0.065–0.085 mm in diameter. In C. gigas Selden, Reference Selden1992 the tubercles are bimodal in size, with the larger being ~0.073 mm in diameter. There are also differences in tubercle density. The greatest density occurs in C. pococki (>95 mm-2), with a high density (~90 mm-2) also found in C. adompha Brauckmann, Reference Brauckmann1987 from the Namurian (approximately Serpukhovian–Bashkirian) of Germany. The density in C. scaber is >85 mm-2; it is 65–85 mm-2 in C. granulatus and C. mcluckiei, and <65 mm-2 in C. eltringhami. However, in C. bohemondi n. sp. the density is sparse at ~30 mm-2.
Other characters used to distinguish Curculioides species are the presence of a pair of longitudinal ventral sulci in C. ansticii and the presence of transverse lines on the dorsal opisthosoma in C. gigas. Curculioides scaber possesses a triangular sclerite at the anterior terminus of the opisthosomal median longitudinal line. Paired pits posterior and lateral to the median longitudinal groove of the carapace are seen in most Curculioides species. None of these characters is present in the new specimen (although the presence of ventral sulci cannot be known because the ventral surface is not visible). Curculioides bohemondi n. sp. is the only known species within Curculioides that possesses raised carapace areas.
Genus Amarixys Selden, Reference Selden1992
Type species
Amarixys sulcata (Melander, Reference Melander1903).
Amarixys gracilis (Petrunkevitch, Reference Petrunkevitch1945)
Figure 2
Holotype
Curculioides gracilis Petrunkevitch, Reference Petrunkevitch1945 (p. 68–70, text-fig. 34, pl. 11, figs 8–10), ISM 14862, part and counterpart, Illinois State Museum, Springfield, IL; from Westphalian D of Mazon Creek, Illinois.
Diagnosis
As in Selden (Reference Selden1992).
Remarks
The specimen of this species, from a strip mine tip in Westphalian rocks, north-west of Morris, Okmulgee County, Oklahoma, which was formerly numbered MCP 548 and held in the collections of the Mazon Creek Project, Northeastern Illinois University, Chicago, was described by Selden (Reference Selden1992), but not figured. It has now been accessioned to the Field Museum in Chicago as PE56942, and the opportunity is taken here to figure it (Fig. 2). Notice that this curculionid genus is easily separated from Curculioides by the median sulcus on the dorsal opisthosoma.
Discussion
Ontogeny
The incomplete nature of many fossil ricinuleid specimens renders it difficult to determine the life stage to which the individual belonged. This causes ambiguity in species diagnoses because conspecifics in different stages of development may be mistaken for different species. To alleviate this issue, some general growth trends in modern ricinuleids, which may be applicable to fossil specimens, are described and applied to the new specimen.
Modern adult male and female ricinuleids can readily be distinguished by the terminal segments of leg III, modified in the male to form a conspicuous copulatory apparatus (Pittard and Mitchell, Reference Pittard and Mitchell1972). Due to the incomplete preservation of fossil specimens, this specific trait is not often available. Remaining potentially identifiable in the fossil record however is the sexually dimorphic leg thickening exhibited in many adult male ricinuleids. This limb thickening is characterized by wider basal segments of leg II compared to the other limbs of the organism, although males of some species (e.g., Cryptocellus becki Platnick and Shadab, Reference Platnick and Shadab1977 and C. iaci Tourinho, Lo Man-Hung, and Bonaldo, Reference Tourinho, Lo Man-Hung and Bonaldo2010) instead exhibit this thickening on the basal segments of leg III (Adis et al., Reference Adis, Platnick, de Morais and Gomes Rodrigues1989; Tourinho et al., Reference Tourinho, Lo Man-Hung and Bonaldo2010; Salvatierra et al., Reference Salvatierra, Tourinho and Giribet2013). The inflated limbs of the adult males appear to form only at maturity; they are not generally observed in tritonymphs. While the degree of thickening may differ between species and individual males, no thickening is observed in females.
This same leg thickening may be exhibited in the specimen of Curculioides bohemondi n. sp. The basal segments of leg III appear roughly as long as they are wide, giving them an inflated appearance in comparison to the other legs. If the trend observed in extant species is an indication, this could suggest the specimen represents an adult male. This region of the fossil is not very well preserved in general however, so a definitive conclusion is difficult to make.
Another trend throughout development is the increasing depth and definition of the carapace median longitudinal groove. In species that exhibited a median longitudinal groove, the most well-defined groove was found in the adult, a slightly less-defined groove in the tritonymph, and, if present at all, a very vaguely defined groove in the deutonymph of a few species (Cryptocellus magnus, C. iaci, P. pearsei). This was generally associated with a change in tubercle distribution as well, with a sparser tubercle density closer to the groove, becoming more apparent up to maturity.
The well-defined median longitudinal groove of Curculioides bohemondi n. sp. would suggest the specimen represents an adult or possibly a tritonymph. Although this character does not provide a precise life stage determination, it does provide utility for comparative analysis. Curculioides mcluckiei is another Pennsylvanian ricinuleid from Illinois with morphological similarities to C. bohemondi n. sp., however the median groove confirms that these two do not represent the same species. The C. mcluckiei holotype exhibits a median longitudinal groove at least as well defined as that of C. bohemondi n. sp., suggesting the specimen was near maturity despite being significantly smaller than C. bohemondi n. sp. in overall size. This would imply that C. bohemondi n. sp. is in fact a different species with a larger adult size.
Further diagnostic information was revealed through the ontogenetic analyses of tubercle size. ANOVA tests examining how the tubercle coefficient changed through maturation found no significant (p < 0.05) difference in TC between life stages in any of the species examined (Table 1). TOST analyses found significant (p < 0.05) results in all species examined, suggesting that TC remains equivalent between life stages (Table 2). Further ANOVA tests examining how TC differs between species found significant (p < 0.05) results in all tested genera, suggesting that the null hypothesis of species having no influence on TC be rejected (Table 3). These tests demonstrate that TC is an ontogenetically stable character that can be used to differentiate species regardless of life stage.
Results of TOST analyses testing for equivalence (p < 0.05) of tubercle coefficient between life stages. Dashes (–) indicate comparisons that were not performed in this study. *PD-TA represents the combined protonymph and deutonymph values compared to the combined tritonymph and adult values. Note that the P. quetzalcoatl sample in this column compares solely the deutonymph to the combined tritonymph and adult values.

Results of ANOVA tests measuring the significance (p < 0.05) of the effect of species on the tubercle coefficient.

The consistency of the tubercle coefficient between life stages implies isometric growth of the tubercles with regard to the carapace. The ratio of tubercle diameter to carapace length remained the same regardless of the life stage examined in all tested modern species. Because the incomplete preservation of Pennsylvanian specimen limbs prevents life stage from being empirically determined, the presence of this character in the Paleozoic must be inferred. The modern ubiquity of this character, present in all extant genera, would heavily imply its ancestral nature. It is therefore very likely that the Pennsylvanian ricinuleids exhibited this isometric growth pattern as well.
To examine if the character is useful in differentiating previously described Pennsylvanian ricinuleids from the new specimen, the tubercle coefficient of Curculioides gigas, a geographic compatriot and contemporary of C. bohemondi n. sp., was compared to that of C. bohemondi n. sp. using an ANOVA test. The two (C. bohemondi n. sp. with a mean TC of 1.5e-2 ± 1.5e-3 and C. gigas with a mean TC of 8.0e-3 ± 8.6e-4) were found to be significantly (p < 0.05) different, supporting the conclusion that the two are different species. Although the lack of variability in TC through ontogeny effectively disqualifies it for use in determining life stage, the species-specific nature of the character suggests its utility in diagnosing both modern and fossil species. This has notable significance to the fossil ricinuleids, among which, if life stage cannot be determined, cryptic conspecifics may more easily remain undetected. The use of the tubercle coefficient in species diagnosis, consistent across the entire lifespan of the organism, circumvents this issue.
Taphonomy and geologic significance
The presence of a terrestrial ricinuleid in an assemblage of primarily aquatic organisms is explained by the interpretation of the Energy Shale as a crevasse splay deposit (Baird et al., Reference Baird, Sroka, Shabica and Beard1985). The levee breakage involved in the deposition of a crevasse splay unleashes water from the river onto the surrounding floodplain, catching terrestrial organisms such as ricinuleids off guard and depositing them among aquatic organisms and sediments from the river (Treworgy and Jacobson, Reference Treworgy and Jacobson1985). Indeed, the ricinuleid very likely drowned based on the position of its limbs, spread out as if turgid from the surrounding water (Cooke, Reference Cooke1967). The visible untuberculated groove on the anterior portion of the specimen's opisthosoma is part of the ricinuleid carapace-opisthosoma locking mechanism—it is not visible when the two body segments are in the usual locked position (Pittard and Mitchell, Reference Pittard and Mitchell1972). The visibility of this groove would suggest the carapace and opisthosoma are in the “unlocked” position, perhaps another result of the specimen's turbulent final moments.
The allochthonous deposition of the ricinuleid makes interpretation of the specimen's original paleoenvironment difficult, but not impossible. The Herrin No. 6 Coal, representing a heavily forested environment, likely represents the kind of ecosystem the ricinuleid would have called home (Treworgy and Jacobson, Reference Treworgy and Jacobson1985). Deposition of the Herrin No. 6 Coal is considered contemporaneous with the Energy Shale, and in places is even interbedded with it (Burk et al., Reference Burk, Deshowitz and Utgaard1987). Additionally, the presence of in-situ tree stumps within the Energy Shale directly demonstrates how material from the Energy Shale crevasse splays would have covered these active swamps and forests with sediment (Nelson, Reference Nelson1983). Most likely the ricinuleid was originally a resident of one of these forests and was swept up in a sudden flooding event and deposited within the crevasse splay.
The siderite concretion itself is indicative of a freshwater environment. Only an aquatic system provides the water chemistry necessary for the formation of such a feature (Woodland and Stenstrom, Reference Woodland, Stenstrom and Nitecki1979). Likely the mechanics of concretion formation would mirror that displayed in the Mazon Creek, where, after initial burial, a small amount of aerobic decomposition created a microenvironment around the organism ideal for the precipitation of siderite; with enough time the concretion forms, preserving the specimen (Woodland and Stenstrom, Reference Woodland, Stenstrom and Nitecki1979).
Comparison to the Francis Creek Shale
The Energy Shale is a new locality for fossil ricinuleids, but remains in close geographic and temporal proximity to the more renowned Mazon Creek of the Francis Creek Shale where the majority of North American fossil ricinuleids have been found (Selden, Reference Selden1992). As such, a brief discussion comparing the two strata is warranted.
The Mazon Creek fauna belongs to the Francis Creek Shale, found in Grundy County Illinois, located northwest of the locality for C. bohemondi n. sp. in Vermilion County Illinois (Baird, Reference Baird and Nitecki1979). Neither location offers a continuous stratigraphic column featuring both members. The Energy Shale is found mostly in southern and eastern Illinois, while the Francis Creek Shale is found in northern Illinois (Baird, Reference Baird and Nitecki1979; Burk et al., Reference Burk, Deshowitz and Utgaard1987). However, the lateral continuity of the Herrin No. 6 Coal provides a benchmark, suggesting the Energy Shale overlying it is somewhat younger than the Francis Creek Shale that, where it is deposited, is significantly beneath the Herrin (Willman et. al., Reference Willman, Atherton, Buschbach, Collinson, Frye, Hopkins, Lineback and Simon1975).
Both the Energy Shale and the Francis Creek Shale are thought to broadly represent river delta systems, but there are some important differences (Burk et al., Reference Burk, Deshowitz and Utgaard1987; Clements et al., Reference Clements, Purnell and Gabbott2018). Lithologically, the Energy Shale is composed primarily of siltstones and silty shales that decrease in grain size with increasing distance from the Walshville Channel (Burk et al., Reference Burk, Deshowitz and Utgaard1987). The Francis Creek Shale is composed of shales and siltstones that grade laterally into crossbedded sandstones in multiple areas (Baird, Reference Baird and Nitecki1979). Although the lithologies are similar, their distribution suggests a difference in the morphology of the deltaic system. Whereas the Energy Shale was fed primarily by the singular Walshville Channel, the Francis Creek Shale was apparently sourced by numerous smaller rivers (Treworgy and Jacobson, Reference Treworgy and Jacobson1985).
Another important difference is in the interpreted salinity of the two deposits. The Energy Shale is largely a freshwater deposit, as signaled by its aquatic biota and the low sulfur content of its contemporaneous underlying coal (Nelson, Reference Nelson1983; Baird et al., Reference Baird, Sroka, Shabica and Beard1985). Only at the farthest extent from the Walshville Channel does the unit appear to exhibit a marine influence, where euryhaline bivalves indicate a brackish bay system (Burk et al., Reference Burk, Deshowitz and Utgaard1987). The Francis Creek Shale, however, features marine influence to different degrees throughout the unit (Clements et al., Reference Clements, Purnell and Gabbott2018). Brackish and marine biota in addition to aquatic and terrestrial organisms, as well as the ubiquitous pinstriped bedding indicative of tidal rhythmites all suggest a sizable marine influence (Clements et al., Reference Clements, Purnell and Gabbott2018). Siderite concretions, which require a freshwater system in which to precipitate, are explained by the frequent but periodic recession of these tides, allowing the concretion to form in a temporary freshwater environment (Woodland and Stenstrom, Reference Woodland, Stenstrom and Nitecki1979). However, it appears that the nonmarine organisms preserved within these Francis Creek Shale concretions are not necessarily contemporaneous with the deposition of the unit—leading to another important difference between the two members (Clements et al., Reference Clements, Purnell and Gabbott2018).
Both members overlie a coal bed—the Energy Shale being situated above the Herrin No. 6 Coal while the Francis Creek Shale is above the Colchester No. 2 Coal (Willman et. al., Reference Willman, Atherton, Buschbach, Collinson, Frye, Hopkins, Lineback and Simon1975; Jacobson et al., Reference Jacobson, Goodwin and White1980). The relationship between these shales and their underlying coals differs in timing of deposition (Baird, Reference Baird and Nitecki1979; Jacobson et al., Reference Jacobson, Goodwin and White1980). Whereas the Energy Shale is thought to have been deposited concurrently with the peat deposition of the Herrin No. 6 Coal, the Francis Creek Shale is thought to have been deposited after the deposition of the Colchester Coal (Burk et al., Reference Burk, Deshowitz and Utgaard1987; Clements et al., Reference Clements, Purnell and Gabbott2018). Non-marine and terrestrial biota preserved in the Francis Creek Shale are thought to have been integrated into the member from already inundated swamps in the deltaic system, flooded by the transgressing ocean (Clements et al., Reference Clements, Purnell and Gabbott2018). Concretions are thought to have been formed around already-dead organisms at the bottom of these flooded brackish swamps (Clements et al., Reference Clements, Purnell and Gabbott2018). The result is a system that, although paleontologically and lithologically similar, is actually fairly disparate in terms of the intricacies governing fossil formation within it.
Size
It is widely known that many insects of the Carboniferous (Mississippian–Pennsylvanian) exhibited some form of gigantism as compared to their modern forms (Shear and Kukalová-Peck, Reference Shear and Kukalová-Peck1990). This has been attributed to a higher oxygen content in the planet's atmosphere at the time, allowing the organism to absorb sufficient amounts of the gas despite the smaller surface area to volume ratio implied by a larger overall size (Shear and Kukalová-Peck, Reference Shear and Kukalová-Peck1990). The tracheal system of insects is made more efficient by higher atmospheric oxygen partial pressure (Dudley, Reference Dudley1998). In an environment without a high-oxygen atmosphere, large insects must dedicate a high amount of resources to the expansion of their tracheal system simply to supply the necessary oxygen to tissues for their metabolic function (Kaiser et al., Reference Kaiser, Jaco Klok, Socha, Lee, Quinlan and Harrison2007).
Among Pennsylvanian ricinuleids, C. bohemondi n. sp. is the largest by a significant margin. The closest in length (excluding the cucullus and pygidium) is C. gigas, at 18 mm long, whereas C. bohemondi n. sp. is 20.98 mm long (Selden, Reference Selden1992). Both species, however, dwarf even the largest known extant ricinuleid, which only measures ~6 mm long (Naskrecki, Reference Naskrecki2008). It is possible that this change in size may be due in part to the higher oxygen content of the Pennsylvanian atmosphere. Though not insects themselves, extant ricinuleids exhibit a respiratory system composed of sieve trachea, not entirely unlike the respiratory system of insects (Levi, Reference Levi1967). If fossil ricinuleids exhibited this similar system, then the higher oxygen partial pressure would likely have a similar effect to that which it has on insects, allowing the organism to bypass the limitations of oxygen diffusion with a higher-efficiency system that requires less energy investment into the trachea (Levi, Reference Levi1967). However, this comparative gigantism is relatively minimal compared to the larger forms of some Carboniferous arthropods, and as such, is unlikely to have been entirely due to higher atmospheric oxygen content. Differing ecologies between ricinuleids of these two disparate eras likely played an important role as well (Shear and Kukalová-Peck, Reference Shear and Kukalová-Peck1990).
Paleoecology
Due to the incomplete nature of the specimen and the problems inherent in interpreting ecology from an isolated concretion (let alone one isolated in an environment separate from that in which it likely lived), definite conclusions regarding the ecology of the specimen are difficult to make; however, some speculation can be made. All modern ricinuleids occupy one of two overarching niches—terricolous species (living beneath the rainforest floor and into the subsoil), and cavernicolous species (living in the complete darkness of subterranean caverns) (Selden, Reference Selden1992; Adis et al., Reference Adis, Messner and Platnick1999). It appears however that the ancestral niche of the order is not reflected in these modern ecologies. The recently discovered Cretaceous ricinuleids are preserved in amber, suggesting that they may have exhibited a scansorial lifestyle or at least frequented the bases of tree trunks—an unusual setting for modern ricinuleids (Cooke, Reference Cooke1967; Wunderlich, Reference Wunderlich2015).
Likewise, the ubiquity of eyes among Pennsylvanian species would also suggest they were surface dwellers. Eyes are not present in extant ricinuleids, although some species exhibit carapacial translucent areas, which may or may not serve a rudimentary photosensitive function (Botero-Trujillo and Valdez-Mondragón, Reference Botero-Trujillo and Valdez-Mondragón2016). It is likely their eyes were lost due to the transition to the low-light environments of the subsurface, a phenomenon occurring in many species that have made similar ecological shifts (Sumner-Rooney, Reference Sumner-Rooney2018). Their presence in fossil species however would indicate the ancestral life habit was surficial.
Modern ricinuleids possess modified first and second leg pairs, the tarsi of which are covered with specialized sensilla and slit organs that perform thermosensory, hygrosensory, gustatory, olfactory, mechanosensory, and proprioceptive functions (Talarico et al., Reference Talarico, Palacios-Vargas, Silva and Alberti2006). The long length of the second leg makes it particularly well suited for sensory purposes; modern ricinuleids tap these limbs exploratorily on the ground as they navigate their environment (Talarico et al., Reference Talarico, Palacios-Vargas, Silva and Alberti2005). The apparent presence of this structure in eye-bearing fossil forms would suggest an ancestral dual sensory system, with the non-visual sensory apparatus of the legs allowing ricinuleids to thrive in a cavernicolous habitat even early into the order's subterranean invasion. This trend of preexisting non-visual sensory structures allowing for adoption of a cavernicolous lifestyle has been previously documented in many clades, most notably catfish (Walls, Reference Walls1942; Lythgoe, Reference Lythgoe1979).
The ancestral presence of the leg-based sensory structure is suggested in both Cretaceous and Pennsylvanian ricinuleids. The Cretaceous species exhibit an elongate second leg pair, which is the typical morphology of the modern leg II sensory system (Wunderlich, Reference Wunderlich2015). Although no Pennsylvanian ricinuleid specimens exhibit preserved tarsi, the segments of the second leg are consistently the longest among the limbs in all known species, including C. bohemondi n. sp., implying an elongate second limb in the Paleozoic species as well (Selden, Reference Selden1992). Similar to the antennae of modern insects, most likely the second leg pair has always served a sensory function, originally supplementing the visual information from the eyes and allowing behaviors to continue in the dark (Pelletier and McLeod, Reference Pelletier and McLeod1994). Investigation regarding the presence of sensory sensilla on the surface of fossil ricinuleid tarsi will be necessary to confirm this, however, because the possibility remains that the preexisting elongate second limbs may have been later coopted to serve a primarily sensory function. In the absence of an alternative original purpose for these disproportionately long limbs, it seems plausible that extinct ricinuleids such as C. bohemondi n. sp. would have used them to probe the lycopod-forest floor for small invertebrate prey, similar to their modern relatives (Clements et al., Reference Clements, Purnell and Gabbott2018).
Acknowledgments
We are extremely grateful to B. Riegler, Champaign, Illinois, who discovered the specimen and kindly donated it to the Illinois State Museum (ISM). We thank M. Mahoney of the ISM for loan of the specimen for study, and P. Mayer of the Field Museum of Natural History for the loan of the Amarixys gracilis specimen PE56942. For access to the collections of extant ricinuleids in the American Museum of Natural History, we thank L. Prendini, L. Sorkin, P. Colmenares, and R. Botero-Trujillo. NW thanks the editing team at Fitzwilliam Books for their valuable feedback and comments, as well as T. Hunt of Florida State University for the helpful discussions and suggestions. We greatly appreciate reviewers J. Dunlop and A. Tourinho for their helpful comments.