I. INTRODUCTION
In many cases, nanosized particles are not produced as single primary particles but rather as particle collectives consisting of several primary particles. In most applications, the particles have to be available in liquid as separately dispersed primary particles or at a certain aggregate size.Reference Winkler1, Reference Schilde, Breitung-Faes and Kwade2 Generally, the influencing factors for breaking up the aggregates depend on the grinding and dispersing process itself, as well as on the properties of the fluid and the aggregates itself. Especially, the micromechanical properties, like Young’s modulus, hardness, and plastic and elastic deformation energies, of nanostructured aggregates have a strong effect on the aggregate breaking behavior and on the dispersing process and the application properties. Basically, the material properties, the surface modification, the porosity, the structure, the particle size distribution, and the particle–particle interactions have a strong influence on the micromechanical properties. Basic research on plastic and elastic deformation as well as on breakage of aggregates by nanoindentation are done by Kendall and WeihsReference Kendall and Weihs3 and Raichman et al.Reference Raichman, Kazakevich, Rabkin and Tsur4 Kendall and WeihsReference Kendall and Weihs3 observed elastic and plastic deformations of aggregates during compression tests. In their experiments, the total macroscopic behavior of aggregates was characterized but no information was obtained regarding the particle–particle interactions in the aggregates. Raichman et al.Reference Raichman, Kazakevich, Rabkin and Tsur4 characterized the strength of individual small silver agglomerate fixed on a hard substrate by measuring via nanoindentation. In contrast to Kendall and Weighs, who examined the macroscopic agglomerate deformation behavior, Adams et al.Reference Adams, Akram, Briscoe, Lawrence and Parsonage5 tried to characterize the particle–particle interactions within colloidal, polymer-bonded silica coatings using a Berkovich indenter (three-sided pyramid-shaped diamond tip). The fluctuations of force–displacement curves, which are based on the breakage of interparticulate bonds, were analyzed. Perrey et al.Reference Perrey, Mook, Carter, Gerberich, Berndt, Fischer, Ovid’ko, Skandan and Tsakalakos6 applied new mechanical and microscopy testing methods to investigate the mechanical properties of single nanoparticles. The mechanical properties depending on the particle size of single silicon nanoparticles between 20 and 200 nm were investigated by Gerberich et al.Reference Gerberich, Mook, Cordill, Jungk, Boyce, Friedmann, Moody and Yang7 In this study, an increasing toughness was obtained with decreasing particle diameter. Similar results were achieved by Mook et al.Reference Mook, Nowak, Perrey, Carter, Mukherjee, Girshick, Mcmurry and Gerberich8 for the indentation of titanium and silicon nanoparticles of various sizes. However, the micromechanical characterization of single aggregates consisting out of a huge number of single nanoparticles is a major challenge due to the inherent complexity as well as the large deformation involved. Especially for nanostructured aggregates, the particle–particle interactions are very strong. Moreover, due to multiple effects on the micromechanical measurements of very small aggregates such as the response of the substrate, bond breakage, and primary particle rolling and sliding, the description of the micromechanical behavior becomes a problem of statistical nature.Reference Raichman, Kazakevich, Rabkin and Tsur4 Roth et al. investigated colloidal films made from monodisperse poly(methyl methacrylate) particles with a diameter of 1.6 μm via nanoindentation in combination with confocal microscopy. The resulting macroscopic information from the nanoindentation measurements were complemented by the three-dimensional (3D) aggregate structure and by the individual displacements of the constituent particles. Different microscopic reorganization processes for amorphous and highly crystalline structures were identified, and the average strain field was calculated. For the dense amorphous aggregates, the strain field was in reasonable agreement with the predictions from analytical continuum theories.Reference Roth, Schilde, Lellig, Kwade and Auerhammer9 In this study, for the determination of the micromechanical properties of nanostructured aggregates, different series of measurements were carried out on aggregates in the micrometer range with help of a nanoindenter.
II. EXPERIMENTAL SETUP
A. Materials
For the measurement of the micromechanical properties via nanoindentation, silica model aggregates with different primary particle sizes between 50 and 400 nm were used. The monodisperse silica primary particles are produced according to a Stöber synthesis methodReference Stöber, Fink and Bohn10 followed by a spray drying process and separation of the generated aggregates (between 5 and 50 μm) by a cyclone using a laboratory spray dryer of the company Büchi (Essen, Germany) at a drying temperature of 100 °C. Tetraalkoxysilane and water were used as educts, and ethanol and ammonia were used as catalysts in the particle synthesis corresponding to the following reaction equationReference Gellermann, Ballweg and Wolter11:

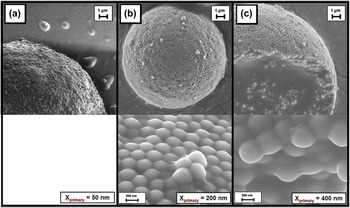
Because of the particle synthesis according to a Stöber synthesis method, following the spray drying process and separation of the generated aggregates by a cyclone,Reference Gellermann, Ballweg and Wolter11 a narrow primary and secondary particle size distribution and a narrow distribution of the micromechanical aggregate properties are obtained. In addition, low drying temperatures in the spray drying process lead to homogenous aggregates with less cavities and the possibility to increase the content of solid bonds between the primary particles and the strength of the aggregates by thermal treatment. Figure 1 shows the silica model aggregates with different primary particle sizes at comparable aggregate dimensions.
Silica model aggregates with different primary particle sizes: 400 nm (c), 200 nm (b), 50 nm (a).

B. Nanoindentation
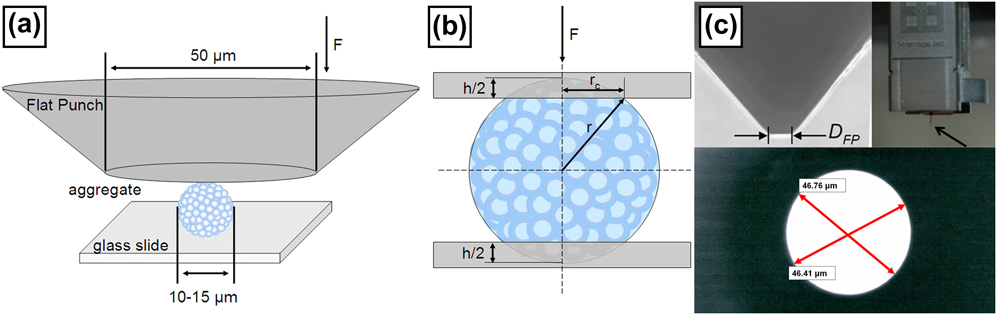
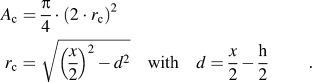
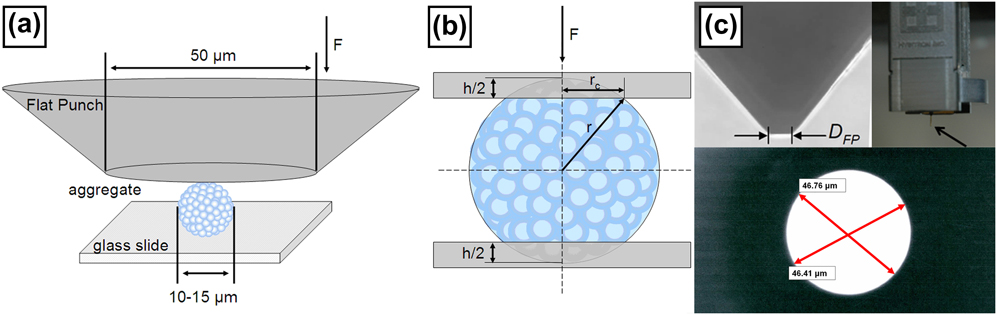
The micromechanical properties of the silica aggregates were measured via nanoindentation using the TriboIndenter TI 900 from Hysitron, Inc (Minneapolis, MN). The samples were stressed by a commonly used hardened steel flat punch specimen with known material properties and geometry. Because of the small Young’s modulus of the aggregates (approximately 0.8 GPa, measured via nanoindentation) compared to the Young’s modulus of the indenter tip (210 GPa for steel), the effect of the tip material on the micromechanical measurements can be neglected. This is the case for a large number of synthesized micro- and nanoparticles which agglomerate or aggregate during the particle synthesis (e.g., precipitation processes, flame pyrolysis, etc.). For this reason, sink-in effects of the aggregates in the glass substrate during the indentation measurement can also be excluded. In this work, the deep-sensitive normal force measurement is adopted, where the sample will be stressed by a normal force and the resultant force–displacement curve is plotted. In the experiments, the displacement was controlled during the measurements. As an example, the schematic plot of stressing an individual aggregate by the flat punch method is shown in Fig. 2(a). Thereby, the flat punch requires precise calibration on the parallelism of the indenter and the glass slide [Fig. 2(a)] and was cleaned before and after each measurement to remove impurities and adhesions such as aggregate fragments, dust, or external impurities. For cleaning, the indenter was disconnected and cleaned with ethanol. The adjustment of the parallelism between indenter and glass substrate was done by the use of a control desk with a comparatively high dimension in x–y directions and adjustable micrometer screws. For calibration, the indentation measurements in tin were performed and the offset angle was determined by the measurement of a 3D topography using an atomic force microscopy. The selection of the aggregates lying on the substrate was made using the optical microscope of the indenter.Reference Arfsten, Bradtmöller, Kampen and Kwade12 As a first approximation, the contact model for plastic deformation of Antonyuk et al.Reference Antonyuk, Tomas, Heinrich and Mörl13 was used to calculate the contact area of the elastic–plastic aggregate deformation during indentation [Fig. 2(b) and Eq. (2)]. In this case, the contact area A c deforms only plastically for an elastic–plastic material. The contact radius r c is given as function of the indentation depth h and the aggregate diameter x.
Schematic plot of the flat punch test (a), model of the contact geometry by plastic–elastic deformation (b), and microscopy images of the flat punch indenter with the exact dimensions (c).
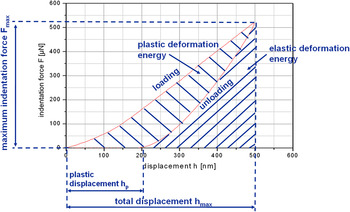
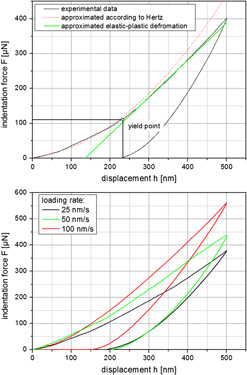
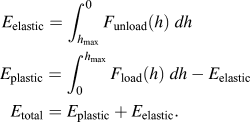
For the indentation measurements, a maximum indentation depth of 500 nm was chosen with a constant indentation velocity of up to 100 nm per second for the stress and discharge curves. To separate the silica aggregates for the measurements, the dried samples were prepared on glass slides using the dry dispersing device RODOS from Sympatec (Clausthal-Zellerfeld, Germany). For a good reproducibility of the micromechanical measurements and to avoid measurement artifacts due to different aggregate sizes, only silica aggregates between 10 and 15 μm were stressed. When dealing with smaller aggregates or much higher deformations, the mechanical response of the substrate must be considered. However, in this case of measuring aggregates at small deformations the contribution of the substrate’s hardness to the measured one is very small because the hardness of the substrate is comparatively high.Reference Raichman, Kazakevich, Rabkin and Tsur4, Reference Balakrishnan, Pizette, Martin, Joshi and Saha14 The results of the stress and discharge curves give information about the maximum normal force at certain indentation depths, the irreversible deformation depth and the plastic and the elastic deformation energies of the aggregates. Figure 3 shows a schematic representation of the indentation results without breakage of the aggregates. Thereby, the plastic (E plastic) and elastic (E elastic) deformation energies are calculated as integral of the indentation force F over the displacement h [see Eq. (3)]. It allows to separate the indentation energy into elastic and plastic componentsReference Bartali, Micheli, Gottardi and Laidani15–Reference Malzbender and De Witt17:
Schematic representation of the indentation results without breakage of the aggregates (loading rate = 100 nm/s, maximum displacement = 500 nm).

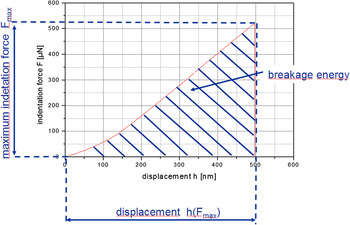
For the determination of the fracture force and fracture energy and the strength of the silica aggregates, an additional load function was selected to stress the aggregates until breakage occurs. Figure 4 shows a schematic representation of the indentation results with breakage of the aggregates. In contrast to the aggregate breakage measurements according to Antonyuk et al.,Reference Antonyuk, Tomas, Heinrich and Mörl13, Reference Antonyuk, Palis and Heinrich18 in almost all cases no multiple breakage points were obtained stressing the silica aggregates. The fracture energy E fracture of Fig. 4 can be calculated using Eq. (4):

Schematic representation of the indentation results with breakage of the aggregates (loading rate = 100 nm/s, displacement-controlled indentation until breakage occurs).

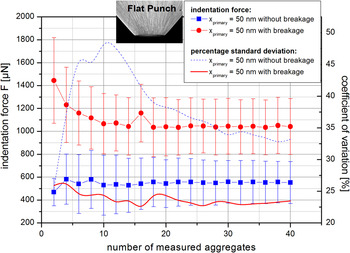
To increase the confidence level and achieve an impression of the distribution of the micromechanical properties, 40 measurements of each sample were performed. Figure 5 illustrates the maximum indentation force and their percentage standard deviation as functions of the number of measured aggregates for the used flat punch indenter geometry with displacement until breakage and without aggregate breakage and a displacement of 500 nm. Since, the force–displacement resolution of the nanoindenter measurement system (displacement: 0.2 nm, force: 100 nN) is significantly lower than the obtained values, the measurement results are representative for micromechanical properties of each aggregate. Although the average maximum indentation force for both test series stays constant between 10 and 40 measured aggregates, the standard deviation decreases with an increasing number of measured aggregates. However, a constant standard deviation of the micromechanical properties will be achieved for an infinite high number of measurements since the micromechanical properties of each aggregated system are distributed. According to Fig. 5 after the measurement of approximately 40 aggregates, the standard deviation of the micromechanical properties approaches a approximately constant value, which is determined by the inherent distribution of the micromechanical properties of the aggregates itself. Therefore, the distribution of the micromechanical properties of the aggregates can be roughly estimated from the distribution of the measured 40 aggregates. Similar conclusions were achieved in other studies, e.g., Arfsten investigated the evolution in median values and the standard deviations of several micromechanical properties of yeast cells measured via nanoindentation as functions of the number of measurements up to 100 single measurements.Reference Arfsten, Kampen and Kwade19–Reference Arfsten21
Dependency of the maximum indentation force and coefficient of variation on the number of measured silica aggregates (primary particle size x primary = 50 nm) for a flat punch indenter geometry with and without aggregate breakage.

Due to the strong plastic deformation behavior of the aggregates, the calculation of the local Young’s modulus based on a model like the one of Sneddon and Oliver and Pharr using a Berkovich indenter geometryReference Oliver and Pharr22–Reference Sneddon24 is not possible. Although, the typical models cannot be applied for the calculation of the local Young’s modulus, the stiffness of the aggregates can be determined for small indentation depths on the basis of the Hertzian contact theory.Reference Goldsmith25, Reference Hertz26 The indentation force F depends on the local deformation coefficient K, the aggregate diameter x, and the deformation α. The relationship between the deformation force and the displacement for a spherical particle is given by the following Eq. (5). Basically, according to the Hertzian contact theory the exponent β is equal to 1.5.
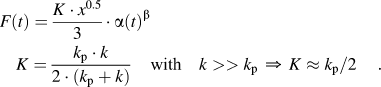
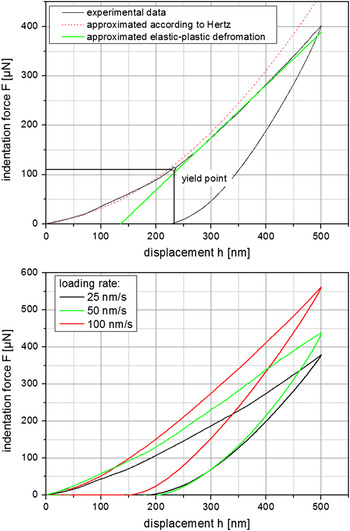
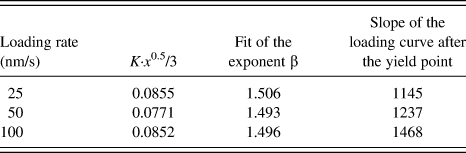
In case of the indentation of spherical aggregates, the deformation α is equal to the indentation depth h. Because of the small stiffness of the aggregates k p compared to the stiffness of the indenter tip k, the local deformation coefficient K is approximately given by k p. Figure 6 (bottom) shows exemplary three force–displacement curves of the silica model aggregates with a primary particle size of 200 nm as functions of the loading rate using a flat punch indenter geometry. At the beginning of the indentation, an elastic deformation of the aggregates takes place (Fig. 6, top) as described by the Hertzian theory [Eq. (5)]. The average values of 40 force–displacement curves by varying loading rates between 25 and 100 nm/s were approximated by the Hertzian theory as plotted in Fig. 6 (bottom) and Table I. The average values were determined using the least square method. The average value of the exponent β in Table I is closely to 1.5, and the behavior of nanostructured model aggregates can be fitted referring to the Hertzian contact theory for small deformations independent on the loading rate. As expected, corresponding to the constant value of the exponent β, the term K·x 0.5/3 is also approximately constant. At a certain threshold, plastic aggregate deformation starts (Fig. 6, top), which depends on the aggregate diameter and the yield strengthReference Antonyuk, Tomas, Heinrich and Mörl13 as well as on the loading rate. An increase in the loading rate leads to an increasing slope of the loading curve after the yield point (dependent on the loading rate located in the range between 100 and 300 nm displacement) and thus a less plastic deformation is obtained (see Table I). More generally for a homogenous elastic–plastic material a semiempirical relation to the so-called Meyer’s lawReference Cheng and Cheng27 can be used for the description of the loading curve [Eq. (6)]. The proportionally factor K′ is a function of the material properties and the indenter geometry. For the description of the whole loading curve of the stressed aggregates in this work, the Meyer’s law is not applicable. After the yield point, plastic deformation occurs. If the exponent b in Eq. (6) reaches the value of zero after the yield point, linear plastic deformation can be described referring to Antonyuk (see Fig. 6, top). For small deformation, the Meyer’s law comply with the Hertzian contact theory for b = 1.5 [see Eqs. (5) and (6)].

Force–displacement curves of silica model aggregates with 200-nm primary particle size as functions of the loading rate for a flat punch indenter geometry.

Fit of the Hertzian contact theory for the silica model aggregates (x primary = 200 nm, sintering temperature = 100 °C) at small deformations varying the loading rate.
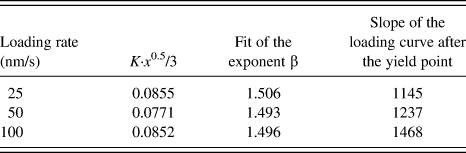
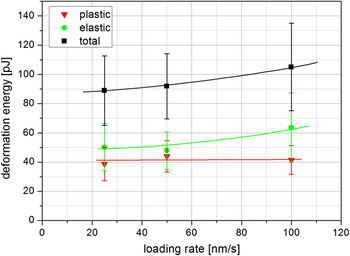
Figure 7 shows the average plastic, elastic, and total deformation energies for 40 measurements of the nanostructured silica with a primary particle size of 200 nm at different loading rates. The results are similar to the results presented in Fig. 6, in which the indentation force increases with rising loading rate. The reason for the increase in the total deformation energy is the increase in elastic deformation energy while the plastic deformation energy stays constant.
Deformation energies of silica model aggregates with 200-nm primary particle size as functions of the loading rate for a flat punch indenter geometry.

III. RESULTS AND DISCUSSION
A. Effect of the primary particle size on the micromechanical properties and the solid bridge diameter
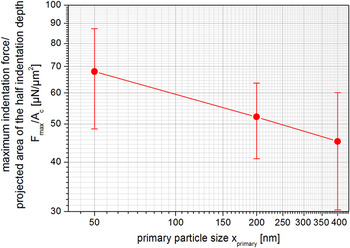
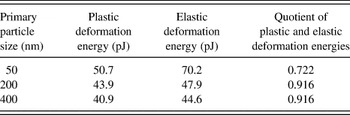
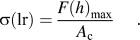
The effect of the primary particle size on an average compression stress σ [Eq. (7)] is shown in Fig. 8. The compression stress is calculated as the quotient of the average maximum indentation force F max measured by nanoindentation and the projected area of half the indentation depth A c (according to a characteristic particle contact of plastic spherical particles using the model of Antonyuk et al.Reference Antonyuk, Tomas, Heinrich and Mörl13, Reference Bartali, Micheli, Gottardi and Laidani15, Reference Cheng and Cheng27). The measurements are carried out with a maximum indentation depth of 500 nm. The quotient F max/A c and the average compression stress of the aggregates [see Eq. (7)] depend significantly on the loading rate (see Figs. 6 and 7). For this reason, Eq. (7) characterizes a loading rate (lr)-dependent average compression stress σ(lr) at the given presetting of the nanoindenter load function. Figure 8 shows that the quotient F max/A c of the nanostructured aggregates increases with decreasing primary particle size. Thereby, the quotient can be evaluated as a function of the primary particle size with the least square method and can be described by a power law [Eq. (8)].Reference Schilde, Breitung-Faes and Kwade2 The values of the model parameters a and b obtained by the least square method are given in Table II. The deformation energies and the quotient of the plastic and elastic deformation energies are shown in Table III.
Compression stress as a function of the primary particle size (loading rate = 100 nm/s, maximum displacement = 500 nm, aggregate diameter = 7 μm).

Model parameters a and b for calculating the quotient of the average maximum indentation force and the projected area as functions of the primary particle size [according to Eq. (7), sintering temperature = 100 °C].

Deformation energies as a functions of the primary particle size (loading rate = 100 nm/s, maximum displacement = 500 nm).

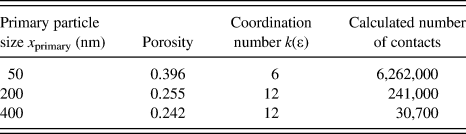
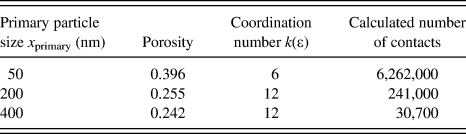
A decrease of the primary particle size and an increase in the number of solid bonds (see calculated values for the number of contacts in Table IV) in the aggregates leads to an increase of the maximum indentation force and an increase of the deformation energies. Thereby, the quotient of the plastic and elastic deformation energiesReference Bartali, Micheli, Gottardi and Laidani15 decreases and therewith indicates increasing elastic deformation behavior with increasing content of solid bonds.
Porosity, coordination number (via mercury porosity), and calculated number of contacts within the aggregates as functions of the primary particle size.
As shown in Fig. 5, the standard deviation of the measurement reaches a constant value, which is determined by the distribution on the micromechanical properties of the aggregated systems. Therefore, the standard deviation in Fig. 8 indicates a rough estimation of the distribution of the micromechanical properties.
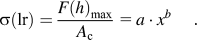
The average compression stress derived from Eq. (8) can be compared to the aggregate strength. Based on statistical considerations, the breaking stress and the strength of such aggregates with spherical primary particles can be described by the formula of RumpfReference Rumpf28, Reference Rumpf29:

where ε is the specific porosity of the aggregate, k the average coordination number, x primary the primary particle diameter, and F the force acting at the coordination points. It is assumed that for similar particle material and approximately isotropic agglomerate behavior, the breaking stress is responsible for the average compression strength of agglomerates and aggregates. According to the model of Bika et al.,Reference Bika, Tardos, Panmai, Farber and Michaels30 the force F, required to separate two particles after a cylindrical bridge has formed between them, can be calculated from the following equation:

where σ sb is the strength of the solid bridge and r sb is the narrowest portion of the bridge r sb (neck). It is assumed that the solid bridge breaks at the narrowest portion of the bridge r sb under tensile, compression, or shear stress. Under the assumption that the average compression stress from Eq. (8) can be related linearly to the breaking stress [Eq. (9)] and the solid bridges between the primary particles have the same strength σ sb, the radius of the narrowest portion of the bridge r sb can be calculated. The narrowest portion of the bridge can be compared to the experimental and analytical solutions for the radius of the narrowest portion of the bridge.
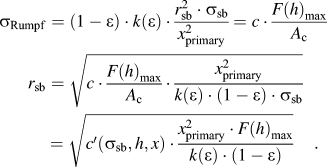
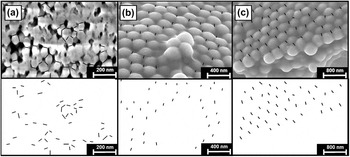
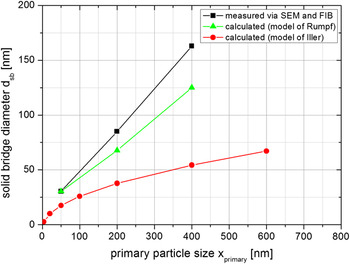
Under the assumption of a constant aggregate diameter and indentation displacement, the porosity of the aggregate and the coordination number must be known for the solution of Eq. (11). For the used silica aggregates, the porosity of the aggregate can be characterized via mercury porosity measurements (PoreMaster; Quantachrome, Odelzhausen, Germany). Condition for the characterization of the aggregate porosity is that solely the intra-aggregate porosity and not the interaggregate and intra-primary particle porosity is determined. Therefore, in the porosity measurements the interaggregate porosity was excluded by calculating the pore size distribution below a pore size of 1 μm. The mean values of the pore size distributions are detected in the range of x pore,primary 50 nm = 14 nm for the aggregates with a primary particle size of 50 nm, x pore,primary 200 nm = 70 nm for the primary particle size of 200 nm, and x pore,primary 400 nm = 110 nm for the primary particle size of 400 nm. Because of the magnitude of the median-measured pore size and a comparatively narrow pore size distribution, porous primary particles were also excluded. Moreover, the average coordination number can be calculated for approximately isotropic agglomerate behavior using the porosity of the aggregate. The values for the coordination number k and porosity ε are given in Table IV. To get an impression of the accuracy of the mercury porosity measurements, Fig. 9 shows a focused ion beam (FIB) image of the aggregates with a primary particle size of 50 nm (a) and scanning electron microscope (SEM) image of the aggregates with a primary particle size of 200 (b) and 400 nm (c). The packing density of the aggregates with primary particle sizes of 200 and 400 nm in Fig. 9 is approximately a close-packing of spheres (ε max = 0.26), and the measured porosity 0.255 and 0.242 (see Table IV) and used coordination number of 12 seem to be in the right order of magnitude. However, the values for the measured porosity are slightly smaller than the porosity of a close-packing due to the solid bridges between the primary particles. For the aggregates with a primary particle size of 50 nm, Fig. 9 shows a much higher porosity and smaller coordination number as it was also shown in the porosity measurement (Table IV). Based on the porosity measurements (Table IV) and the micromechanical properties (Fig. 8 and Table III), a proportional value for the solid bridge diameter d sb (d sb = 2·r sb) can be calculated using Eq. (11). Calculated bridge diameters related to the value of the proportional bridge diameter of a primary particle size of 50 nm are given in Table V. Additionally, the calculated bridge diameters using the analytical model of IlerReference Iler31 are given in Table V. Iler describes the formation of interparticle bonds due to the solubility of monomeric silica in the crevice at the point of contact. The solubility of a surface with a negative radius of curvature is less than that of a flat surface. The neck joining the particles increases in diameter until the difference in solubility in the crevice and the solubility over the surface of the particle becomes small. Therewith, the solubility in the crevice is a function of the particle diameter.Reference Iler31
Focused ion beam (FIB) image of the aggregates with a primary particle size of 50 nm (a, top), scanning electron microscope (SEM) images of the aggregates with a primary particle size of 200 nm (b, top) and 400 nm (c, top); images for the graphical analysis of the bridge diameter via imageJ software (bottom). In the FIB image, the solid bridge diameters are marked. In the SEM images, the distances between the primary particle radii and the bridge radii are marked.

Measured bridge diameter (via SEM and FIB) and calculated bridge diameter [Eq. (10) and IlerReference Iler31] as functions of the primary particle size.

SEM, scanning electron microscope; FIB, focused ion beam.
To get an impression of the accuracy of the solid bridge diameter calculation of the model of Rumpf [Eq. (11)] and Iler, the solid bridge diameters between the primary particles were measured with the help of the software ImageJ and the SEM and FIB images (see Fig. 9). In the SEM images, the bridge diameter can be calculated from the measured distance a between the primary particle radius and the bridge radius and the sputtered coating thickness c AU of 20 nm using the following equation:

Because of the irregular particle packing of the aggregates with 50-nm primary particle size, Eq. (12) was not applicable for the measurement of the solid bridge diameter. For this reason, FIB images were taken and the solid bridge diameter was measured directly from the image using the software ImageJ (see Fig. 9). For the FIB measurements, a FEI Nova 600 Nanolab dual beam instrument (combined SEM and FIB, Hillsboro, OR) was used at low voltage for SEM imaging (2-kV acceleration voltage) to minimize sample charging (magnification 100.000×). The milling parameters for the FIB were chosen to 30 kV acceleration voltage, a rough cut at 0.5 nA beam current and a final cut of the cross section using 10 pA of beam current.
The calculated solid bond diameters according to Eq. (10) and the model of Iler as well as the measured solid bond diameters via FIB and SEM images are presented in Fig. 10. To compare the proportionality value of Eq. (11) with the calculated solid bond diameters and the measured diameters, the relative calculated bond diameter (d sb,c/d sb,c,50; see Table V) are multiplied with the measured bridge radius dsb,SEM of the aggregates with 50-nm primary particles dsb,c/dsb,c,50 · dsb,SEM,50 (see Fig. 9 and Table V). Here, the quotient d sb,SEM,50/d sb,c,50 is a value for the proportionality factor c′ in Eq. (11). Obviously, the measured solid bond diameter and the calculated diameter using Eq. (11) show a similar linear trend, whereas the calculated solid bond diameters using the model of Iler are significantly smaller. The higher the primary particle size, the higher the difference between the measured and calculated solid bond diameters. For this reason, the model of Iler is not applicable in this case. Based on the micromechanical properties and aggregate structure measurements (porosity and coordination number), the trend in the solid bond diameter as function of the primary particle size can be determined. The model of Rumpf is well suited to estimate the trend of the solid bond diameter d sb.
Measured bridge diameter [via SEM and FIB) and calculated bridge diameter [Eq. (10) and IlerReference Iler31] as functions of the primary particle size.

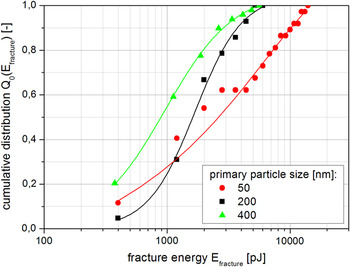
In contrast to the measured micromechanical aggregate properties without aggregate breakage in Fig. 8, Fig. 11 shows the measurement results of stressing the aggregates until breakage occurs. Referring to a constant standard deviation of the micromechanical measurements for more than 30 measurements (Fig. 5), a distribution of the micromechanical properties can be estimated. Figure 11 shows the cumulative distribution of the fracture energy for different primary particle sizes based on 40 measured aggregates. The aggregates are stressed with a high indentation rate of 100 nm/s until breakage of the aggregates occurs. As expected, and similar to the results without aggregate breakage, the fracture energy increases strongly with decreasing primary particle size and increasing number of particle–particle interactions and solid bonds (see calculated values for the number of contacts in Table IV). The resistance of the aggregates against fragmentation increases. Compared to literature, a linear relationship between the median particle fracture energy and median particle strength of various materials and constant stiffness are derived in a double logarithmical scale.Reference Bond32 However, this relationship is restricted strictly to elastic spherical particles.
Cumulative distribution of the fracture energy as function of the primary particle size measured by nanoindentation.

Typically, the fracture probability of single particles can be described due to Weibull statistics. Thereby, the Weibull statistics is based on the principle of the weakest link in a chain. It gives the probability for fracture of a chain, which consists of a number of links of a certain strength when the load is applied.Reference Vogel33, Reference Schilde, Beinert and Kwade34 In the case of stressing aggregates containing solid bonds between the primary particles by compression stresses, more than one solid bond in the aggregate has to break up for sufficient aggregate fracture. Additionally, the strength and radius of solid bonds between primary particles, the primary particles itself, and defects inside the aggregate structure are partially log-normal distributed. For this reason, a log-normal distribution instead of Weibull statistics are expected for the aggregate fracture distribution, which fits well to the measurement data in most cases (e.g., for a primary particle size of 200 and 400 nm in Fig. 11).Reference Schilde, Beinert and Kwade34
B. Effect of the strength of solid bonds on the micromechanical properties
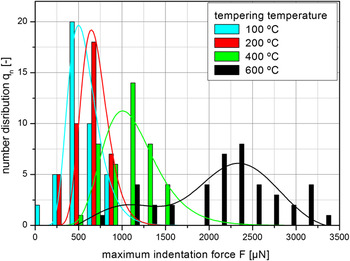
Besides the primary particle size, the temperature of the sintering process was also varied as it was one of the most important process parameters to increase the strength of solid bonds inside the aggregates. The median primary particle size of the silica was in the range of 50 nm; the measured aggregate size was between 10 and 15 μm. Figure 12 shows the influence of the sintering temperature on the maximum indentation force at a relative aggregate deformation (displacement/aggregate size) of approximately 5%. A global stress mechanism was used for the measurements using a flat punch indenter. The number distribution of the maximum indentation force of 40 indentation measurements can be fitted with a log-normal distribution [according to Eq. (13)]. The log-normal distribution depends on the peak center x c, the absolute peak width w, and the amplitude A. As expected, with increasing sintering temperature, the strength of the sinter bridges in the aggregates increases and leads to higher maximum indentation forces. This increase can be described by a power function. A progression in the logarithmic peak width of the maximum indentation force distribution with increasing sintering temperature is not observable (peak width: sintering temperature 100 °C, w 100 °C = 0.31; sintering temperature 200 °C, w 200 °C = 0.23; sintering temperature 400 °C, w 400 °C = 0.30; sintering temperature 600 °C, w 600 °C = 0.21).

Number distribution of the maximum indentation force as function of the sintering temperature of model silica aggregates.

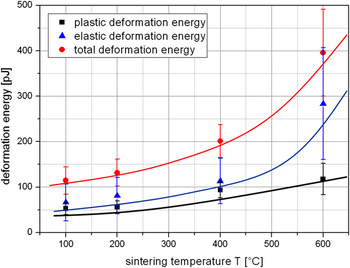
The application properties, for example the maximum reachable product fineness and the energetically efficiency of the dispersion process, are strongly affected by the plastic deformation energy or by the quotient of plastic and elastic deformation energies. Figure 13 shows the total, the plastic, and the elastic deformation energies for the nanostructured silica at different sintering temperatures. Similar to the results presented in Fig. 12, the values of the plastic, elastic, and total deformation energies increase with increasing sintering temperatures. The reason for this effect is the increasing strength of sinter bridges with increasing sintering temperature as shown before. The quotient of plastic and elastic deformation energies is between 0.8 for a sintering temperature of 100 °C and 0.4 for a sintering temperature of 600 °C. At a sintering temperature of 600 °C, the strength of sinter bridges is higher and the movement of the primary particle during the indentation measurement is less possible. This effect results in a more elastic aggregate behavior and a smaller quotient of plastic and elastic deformation energies. Using a Berkovich indenter and a local stressing of the sample, this effect could change.
Influence of the sintering temperature of model silica aggregates on the deformation energy.

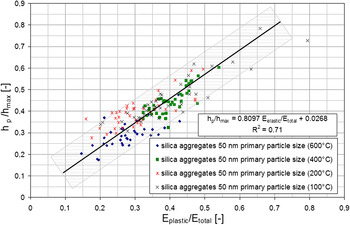
From Cheng and Malzbender, an approximately linear correlation between the quotient of the plastic and total deformation energies and the quotient of the hardness H and the Young’s modulus E* for conical and pyramidal indenter tips was derived [Eq. (14)] for a uniform substrate.Reference Malzbender and De Witt17, Reference Cheng and Cheng35 Thereby, the hardness H can be directly compared to the compression stress σ(lr). Besides the quotient of the hardness H and the Young’s modulus E*, the quotient of the elastic and total deformation energies is proportional to the quotient of plastic indentation depth h p and the maximal indentation depth h max [see Fig. 3, Eq. (14)]:

where λ and κ are the proportional parameters. Figure 14 shows the quotient of plastic indentation depth and the maximum indentation depth as a function of the quotient of the elastic and total deformation energies for different silica model systems stressed by a flat punch indenter geometry. The measurement data can be well fitted by a linear correlation with h p/h max = 0.8097· E plastic/E total + 0.0268. Therefore, the model of Cheng and Cheng can also be used to characterize nanostructured aggregates with different contents and strengths of solid bonds and primary particle sizes measured by a flat punch indenter instead of conical and pyramidal indenter geometry as known from literature.Reference Malzbender and De Witt17, Reference Cheng and Cheng35 Several other nonlinear correlations are explored by other authors, e.g., Lawn and HowesReference Lawn and Howes36 and Mencik and Swain.Reference Mencik and Swain37 However, the elastic–plastic deformation behavior depends on the aggregate diameter and on the loading rate. An increase of the loading rate leads to a higher slope of the loading curve after the yield point and a higher indentation force at a displacement of 500 nm (see Fig. 6 and Table I). For this reason, based on Eq. (6), the compression stress σ(lr) and the hardness H depend strongly on the loading rate, especially for aggregates with strong plastic deformation behavior. Under the assumption of a constant Young’s modulus, the hardness and the quotient of hardness and Young’s modulus depends strongly on the loading rate. Therefore, the term on the right side of Eq. (14) is not applicable. Nevertheless, the quotients of the plastic and total deformation energies as well as the quotient of the plastic and elastic deformation behaviors give information not only on uniform substrates but also on the elastic–plastic deformation behavior of nanostructured aggregates.
Quotient of the elastic and total deformation energies as function of the quotient of plastic indentation depth and the maximal indentation depth for different silica model systems stressed by a flat punch indenter geometry.

IV. CONCLUSION
The application properties of aggregated nanoparticles are a function of the physicochemical properties, which can be characterized by the measurement of the micromechanical properties via nanoindentation, e.g., aggregate strength and stiffness, plastic and elastic deformation energies. For the nanoindenter measurements, sol–gel produced model silica aggregates with varying primary particle sizes between 50 and 400 nm were used as model aggregates. Besides the primary particle size, the temperature of the sintering process of the sol–gel produced silica was also varied to increase the strength of the sinter bridges in the aggregates. Following conclusions could be drawn:
(1) The micromechanical properties determined by indentation measurements, such as maximum indentation force or fracture energy of aggregates, follow a log-normal distribution instead of Weibull statistics.
(2) The micromechanical behavior of the silica aggregates containing solid bonds can be described by the Hertzian contact theory at small indentation depths. The deformation behavior changes after the yield point is passed to an elastic–plastic deformation behavior.
(3) An increase in the number of solid bonds in the aggregates by decreasing the primary particle size leads to an increase in the fracture energy as well as in the maximum indentation force and compression stress. Based on the micromechanical properties and aggregate structure measurements (porosity and coordination number), the trend in the solid bond diameter can be determined.
(4) The higher the sintering temperature and the higher the strength of solid bonds in the aggregates, the higher is the maximum indentation force. The maximum indentation force and the aggregate strength increases with increasing sintering temperature and decreasing primary particle size. Similar to the results obtained by varying the primary particle size, the elastic deformation behavior increases with increasing sintering temperature.
(5) The model of Cheng and Cheng can be used to characterize the elastic–plastic deformation behaviors of nanostructured aggregates with different strengths of solid bonds and primary particle sizes measured with a flat punch indenter. However, the model is not applicable regarding hardness and Young’s modulus.
ACKNOWLEDGMENTS
The authors gratefully acknowledge the financial support of the German Research Foundation (DFG) within the priority programme (SPP) “colloid technology.” The SEM pictures were kindly taken by the Physikalisch-Technische Bundesanstalt (PTB), Braunschweig. The FIB pictures were kindly taken by Michael Kappl, Max Planck Institute for Polymer Research, Mainz. The Fraunhofer Institut für Silicatforschung, Würzburg, are acknowledged for the supply of the model silica aggregates produced by sol–gel synthesis.