

Introduction
Lichens adapted to extreme environmental conditions such as polar and high alpine areas provide a diverse, abundant, and important flora in the terrestrial ecosystem of the Antarctic. Some of them are endemic to the Antarctic and others are bipolar or cosmopolitan species inhabiting Arctic, sub-Antarctic, or alpine areas (Øvstedal & Smith Reference Øvstedal and Smith2001). Studies on the geographical distribution of Antarctic lichens have been mostly based on morphological data and molecular approaches to understand the biogeography and evolution have been rarely tried (Romeike et al. Reference Romeike, Friedl, Helms and Ott2002, Wirtz et al. Reference Wirtz, Printzen and Lumbsch2008, Fernández-Mendoza et al. Reference Fernández-Mendoza, Domaschke, García, Jordan, Martín and Printzen2011). As the occurrence of cryptic phylogenetic species within phenotypically characterized lichen species and infraspecific genetic variability are already well known (Zoller et al. Reference Zoller, Lutzoni and Scheidegger1999, Grube & Kroken Reference Grube and Kroken2000, Crespo & Perez-Ortega Reference Crespo and Perez-Ortega2009), the application of molecular methods in phylogeographic studies on lichens will provide insights into the population structure and evolutionary history (Printzen Reference Printzen2008).
Lichen species occupy much wider distributional ranges than vascular plants and intercontinental disjunctions are common even at the species level (Printzen & Ekman Reference Printzen and Ekman2002, Lücking Reference Lücking2003). The disjunct distributions of lichens have been explained alternately by vicariance and widespread long-distance dispersal as in other groups of organisms (Printzen & Ekman Reference Printzen and Ekman2002). Studies for some taxa lead to the conclusion that a vicariance model caused by geological or climatic events best explain disjunctions (Printzen & Lumbsch Reference Printzen and Lumbsch2000, Lücking et al. Reference Lücking, Papong, Thammathaworn and Boonpragob2008). Alternatively, data from other studies have indicated that distribution patterns of lichens result from recent long-distance dispersal (Galloway & Aptroot Reference Galloway and Aptroot1995, Crespo et al. Reference Crespo, Molina, Blanco, Schroeter, Sancho and Hawksworth2002, Myllys et al. Reference Myllys, Stenroos, Thell and Ahti2003, Muñoz et al. Reference Muñoz, Felicísimo, Cabezas, Burgaz and Martínez2004, Buschbom Reference Buschbom2007, Otálora et al. Reference Otálora, Martínez, Aragón and Molina2010). In relation to long-distance dispersal, Galloway & Aptroot (Reference Galloway and Aptroot1995) and Crespo et al. (Reference Crespo, Molina, Blanco, Schroeter, Sancho and Hawksworth2002) considered bipolar disjunctions of a species to be a result of a relatively early origin and then subsequent dispersal. Myllys et al. (Reference Myllys, Stenroos, Thell and Ahti2003) also suggested migrations during the Pleistocene glaciations or from more recent long-distance dispersal as a reason for the disjunct distribution of two closely related bipolar lichens of the genus Cladonia.
Cladonia borealis S. Stenroos is found in polar, subpolar, and alpine regions such as Alaska, the Antarctic Peninsula, South Shetland Islands, South Georgia, South Orkney Islands, and the Andes Mountains (Ahti Reference Ahti2000, Brodo et al. Reference Brodo, Sharnoff and Sharnoff2001, Øvstedal & Smith Reference Øvstedal and Smith2001). Cladonia borealis on King George Island (62°S, 58°W), the largest island of the South Shetland Islands in the maritime zone of Antarctica, is one of the dominant species and its morphology is highly variable. Although molecular sequences of C. borealis have been included in several phylogenetic studies to understand the relationship with related species (Stenroos et al. Reference Stenroos, Hyv Nen, Myllys, Thell and Ahti2002, Lee et al. Reference Lee, Lee, Hur, Andreev and Hong2008), no studies based on the molecular data have been undertaken to understand the phylogeny and evolution of C. borealis.
The goal of our study was to understand the origin and evolution of the morphologically diverse C. borealis population on King George Island. We examined phylogenetic diversity of C. borealis on King George Island based on the partial SSU, ITS1-5.8S-ITS2, and partial LSU rDNA sequence information and the genealogical relationship between the C. borealis population of King George Island and those of Chile and Norway.
Materials and methods
Lichen specimens and DNA isolation
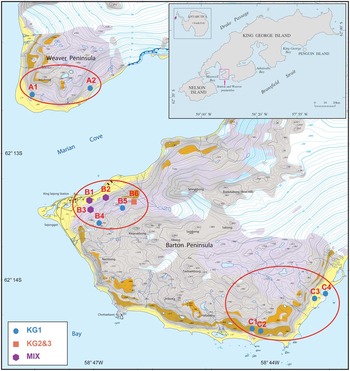
A total of 42 specimens of C. borealis were collected from three neighbouring localities on King George Island (Figs 1 & 2). Region A is located in the southern part of Weaver Peninsula. Region B and C are located in the northern and southern part of Barton Peninsula, respectively. Six specimens were collected from four sites in Svalbard, Norway (78°54′–78°55′N, 11°52′–12°00′E), and two specimens were collected from one site in Punta Arenas, Chile (53°09′S, 71°01′W).
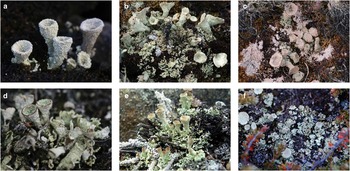
Cladonia borealis from King George Island (a. HSG080111-11, b. PCH080113-51, c. PCH080111-15), Svalbard (d. CNY080715-05A, e. HSG060721-09), and Punta Arenas (f. PCH080123-48).

Approximately 0.02 g of freeze-dried specimens was ground with TissueLyser II (Qiagen, Germany). DNA was isolated using the Wizard® Genomic DNA Purification Kit (Promega, USA) according to the procedures provided by the manufacturer.
PCR amplification and DNA sequencing
The partial SSU, ITS1-5.8S-ITS2, and partial LSU rDNA was amplified using the primers ITS1F (Gardes & Bruns Reference Gardes and Bruns1993) and LR5 (Vilgalys & Hester Reference Vilgalys and Hester1990). Touch-down PCR amplifications were performed in a T-gradient thermocycler (Biometra, Germany) with the following cycling parameters: 5 min initial denaturation at 94°C, 15 touch-down cycles of 30 sec denaturation at 94°C, 1 min annealing at 62–55°C at the ramp of 0.5°C per cycle, 2 min extension at 72°C, followed by 30 cycles of 30 sec denaturation at 94°C, 1 min annealing at 55°C, 1 min extension at 72°C, 10 min final extension at 72°C. Sequences of partial SSU, ITS1-5.8S-ITS2, and partial LSU rDNA regions were determined with primers, ITS1F, ITS4 (White et al. Reference White, Bruns, Lee and Taylor1990), LR0R (Rehner & Samuels Reference Rehner and Samuels1994), and LR5 using ABI 3730XL automated sequencer (Applied Biosystems, USA).
Sequence data for the partial SSU, ITS1-5.8S-ITS2, and partial LSU rDNA have been deposited at GenBank database under the accession numbers: JN863236–JN863286.
Phylogenetic analyses
The sequences were edited and aligned using the PHYDIT program version 3.2 (http://plaza.snu.ac.kr/~jchun/phydit/). Phylogenetic trees were inferred by neighbour-joining (NJ), maximum parsimony (MP), and maximum likelihood (ML) methods using PAUP 4.0b10 (Swofford Reference Swofford2002). Distance matrices for NJ analyses were calculated with the Kimura's 2-parameter model (Kimura Reference Kimura1980). Maximum parsimony analyses were performed with a heuristic search with 1000 replicates of random addition, tree-bisection-reconnection (TBR) branch swapping, and MulTrees options in effect. All gaps were treated as missing data. Maximum likelihood trees were obtained by heuristic search under the GTR+I+G model, which was deduced as the best fit model for the data by the likelihood ratio test using MODELTEST version 3.7 (Posada & Crandall Reference Posada and Crandall1998). Bootstrap values were calculated from 1000 resampled datasets for each phylogenetic method. Cladonia gracilis (L.) Wild. was included as an outgroup.
Congruency tests between datasets
Maximum parsimony and ML criteria were used to test congruency between non-intron domain and intron sequences. Maximum parsimony and ML trees of non-intron domain sequences were reconstructed under the constraints of the hypothetical tree based on the robust branches in the intron tree. The constraint trees were compared with the best trees reconstructed by MP and ML criteria by Kishino-Hasegawa (MP criteria) and Shimodaira-Hasegawa (ML criteria) tests.
Haplotype network construction
Genealogical relationships among haplotypes of the rDNA sequences were analysed by haplotype network reconstruction using TCS version 1.21 (Clement et al. Reference Clement, Posada and Crandall2000). Gaps were treated as fifth character state and the probability of parsimony was set at 95%. The outgroup sequence was removed from the haplotype analysis.
Results
Phylogenetic analyses
The length of sequenced rDNA ranged between 1910 and 2039 bp. All of them contained 234 bp intron in SSU rDNA at nucleotide position 1777 (Saccharomyces cerevisiae numbering, Acc. J01353, Mankin et al. Reference Mankin, Skryabin and Rubtsov1986) and 245 bp intron in LSU rDNA at nucleotide position 1042 (S. cerevisiae numbering, Acc. J01355, Bayev et al. Reference Bayev, Georgiev, Hadjiolov, Nikolaev, Skryabin and Zakharyev1981). Intron sequences of SSU rDNA were highly conserved among all of the specimens except one, HSG060721-09 from Svalbard. It showed a very low sequence similarity (89.3–89.7%) with other intron sequences. Instead it was closely related with the intron sequence of Cladonia cenotea (Ach.) Schaerer (94.8%) (data not shown). These results imply that the evolution of the intron sequences of SSU rDNA might not be orthologous and they were not included in the further analyses.
Alignment of non-intron domain sequences led to 1541 nucleotide sites. Among them 1470 sites were constant, 61 sites were variable but parsimony-uninformative, and ten sites were parsimony-informative. Maximum likelihood analysis resulted in a phylogenetic tree with two well supported monophyletic lineages (Fig. S1A, http://dx.doi.org/10.1017/S0954102012000223). One of the well-supported lineages consisted of ten specimens from King George Island and the other lineage consisted of 32 specimens from King George Island and two specimens from Svalbard. The other branches that had low bootstrap supports in ML analysis were not preserved in NJ and MP analyses.
Alignment of intron sequences of LSU rDNA led to 254 nucleotide sites. Among them 214 sites were constant, 25 sites were variable but parsimony-uninformative, and 15 sites were parsimony-informative. Maximum likelihood analysis resulted in a well-resolved phylogenetic tree with high bootstrap supports (Fig. S1B, http://dx.doi.org/10.1017/S0954102012000223). Most of the branches were preserved in NJ and MP analyses. Specimens from King George Island were separated into two lineages and specimens from Svalbard were separated into three lineages. Most of phylogenetic lineages in the non-intron domain tree were maintained in the intron tree, but the relationships among the lineages were quite different. For example, the SV2 lineage was closely related to the SV3 lineage in the intron tree rather than the PA lineage. The SV4 lineage was closely related with the KG2&3 and the PA lineages rather than the KG1 and the SV1 lineages. As different tree topology might imply incongruency between non-intron domain and intron datasets, we conducted the data congruency test by using the MP and ML criteria. The hypothetical tree (Fig. S2, http://dx.doi.org/10.1017/S0954102012000223) based on the well-supported branches in the intron tree was used as constraints to produce constraint non-intron domain trees. When the constraint trees were compared with the best trees, it appeared that the intron dataset was consistent with the non-intron domain sequences (Table S1, http://dx.doi.org/10.1017/S0954102012000223). Therefore, non-intron domain and intron sequences were combined for further analyses.
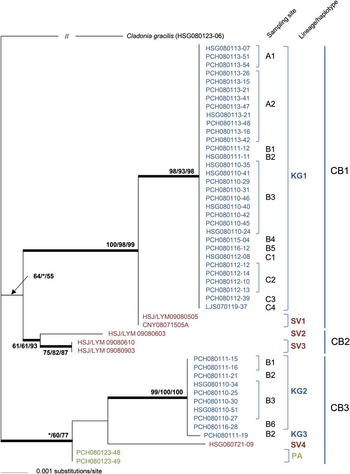
Combined datasets of non-intron domain and LSU (large subunit) intron sequences consisted of 1795 nucleotide sites, which contained 25 parsimony informative sites. Maximum likelihood analysis of combined datasets resulted in a phylogenetic tree that looks very similar to the intron tree (Fig. 3). In most cases, the relationships in the combined tree were better supported than in the intron tree. Most of the relationships were maintained in the NJ and MP analyses. Specimens from King George Island were separated into two monophyletic lineages. The bigger lineage, KG1, contained 32 specimens from various sampling sites (Fig. 2). The lineage was closely related with the SV1 lineage from Svalbard. The relationship was strongly supported by high bootstrap values. The other King George Island lineage, KG2&3, obtained ten specimens from the restricted sampling sites (B1, B2, B3, and B6 in Fig. 2). They were collected only from coastal areas and low hills in the northern part of Barton Peninsula. The lineage was closely related with the SV4 lineage from Svalbard and the PA lineage from Punta Arenas. Three samples from Svalbard formed a monophyletic lineage (CB2). It was further divided into two monophyletic lineages, SV2 and SV3. The relationships among three main lineages, CB1, CB2, and CB3, were not preserved in NJ, MP, and ML analyses and bootstrap support for the branch was not high. Therefore, it was difficult to tell which lineage was closer to the ancestral node of C. borealis.
Geographical distribution of two major lineages (KG1 and KG2&3) in Weaver Peninsula (region A) and Barton Peninsula (regions B and C) on King George Island. Circle, square, and hexagon indicate KG1, KG2&3, and mix of the two lineages, respectively.

Maximum likelihood tree of Cladonia borealis based on the combined sequences of non-intron domain and LSU intron sequences in partial SSU, ITS1-5.8S-ITS2, and partial LSU rDNA region. Thickened branches indicate those that were conserved in maximum likelihood (ML), maximum parsimony (MP), and neighbour-joining (NJ) trees. Bootstrap values of ML, MP, and NJ tree (both 1000 replicates) were indicated on corresponding branches. Abbreviations of the geographical origin are as follows: KG = King George Island; SV = Svalbard, Norway; PA = Punta Arenas, Chile.

Haplotype network
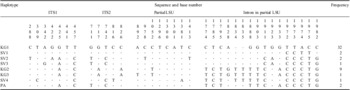
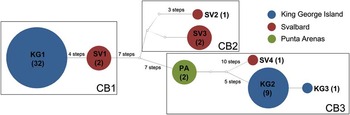
ITS1, ITS2, and partial LSU exon domains contained seven, five, and eight polymorphic sites, respectively (Table I). Intron domain in partial LSU rDNA contained 16 polymorphic sites. Three haplotypes were observed from King George Island, four from Svalbard, and one from Punta Arenas. Each of the haplotypes was observed only from one geographical locality. Observation of only three haplotypes from 42 specimens on King George Island imply that genetic diversity of C. borealis on King George Island is very low. Considering the number of specimens examined in this study, it is considered that Svalbard harbours high genetic diversity.
Haplotypes of Cladonia borealis.

Network among the eight haplotypes revealed that relationships among haplotypes are very similar to the result of phylogenetic analyses (Fig. 4). Two haplotypes, the KG1 and SV1, included in the CB1 lineage, were related to each other. They were distinguished by four consecutive polymorphic sites in LSU intron sequences. Two Svalbard haplotypes, SV2 and SV3, included in the CB2 lineage, were related to each other. They were distinguished by three and two polymorphic sites in ITS1 and LSU, respectively. The CB3 lineage included four haplotypes. Two King George Island haplotypes, KG2 and KG3, were related with PA haplotype from Punta Arenas and SV4 haplotype from Svalbard.
Haplotype network of Cladonia borealis based on ITS, exons and intron of partial LSU rDNA constructed by TCS version 1.21. Blue, red, and green circles indicate King George Island (KG), Svalbard (SV), and Punta Arenas (PA), respectively. The size of the circles is proportional to the number of sampled sequences. The number is presented in parenthesis. Open circles represent haplotypes not present in the sample. A line between haplotypes represents one mutational step unless step numbers are not presented.

Discussion
Morphologically diverse C. borealis specimens from King George Island were separated into two monophyletic lineages based on nuclear rDNA sequences (Fig. 3). Each of the lineages had closely related lineages of Arctic origin. Haplotype network analysis also showed the close relationships among samples with different geographical origins (Fig. 4). Although the relationships among three main lineages were not clearly resolved in phylogenetic analyses, it is considered that the common ancestor of the observed lineages is placed near the internal nodes connecting the three lineages. Accepting this hypothesis for the origin of observed haplotypes, it is assumed that the three main lineages evolved independently after early diversification. The KG1 haplotype, which was observed on King George Island, was derived from the SV1 haplotype from Svalbard. Thus, it is proposed that migration between Arctic and Antarctic areas has occurred during the evolution of the CB1 lineage. The CB3 lineage includes four haplotypes from King George Island, Svalbard, and Punta Arenas. The PA haplotype is more closely related to the ancestral node, and the SV4 and KG2&3 haplotypes were derived from the PA haplotype. Summarizing these conclusions, it is proposed that C. borealis evolved from a common ancestor into three independent lineages with frequent intercontinental migration including two independent introductions into King George Island.
In this study, only three haplotypes of ITS-partial LSU rDNA were observed on King George Island, but this does not imply that the genetic diversity of C. borealis is as homogeneous as rDNA genotypes. It is well known that even among microbial strains or individuals showing homogeneous rDNA genotypes, highly variable phenotypes or genomic constitutions are very frequently observed (Oda et al. Reference Oda, Tanaka and Tsuda2004, Chun et al. Reference Chun, Grim, Hasan, Lee, Choi, Haley, Taviani, Jeon, Kim, Lee, Brettin, Bruce, Challacombe, Detter, Han, Munk, Chertkov, Meincke, Saunders, Walters, Huq, Nair and Colwell2009). In this study, it is proposed that C. borealis on King George Island was introduced at least twice and it might have evolved enough times to express diverse genetic changes. King George Island harbours highly diverse lichen species and the genus Cladonia is especially diverse (Olech Reference Olech2004, Kim et al. Reference Kim, Ahn, Hong, Andreev, Lim, Oh, Koh and Hur2006, Lee et al. Reference Lee, Lee, Hur, Andreev and Hong2008). It is proposed that genotypic diversity in the C. borealis population and combination of genotypes are one of the alternative explanations of morphological diversity. Although we did not examine the genetic diversity for the functional genes or marker loci such as SNP or microsatellite sites at the genomic level in this study, these approaches may provide further evidence on the evolution and adaptation of C. borealis on King George Island.
Many lichen species living in the Antarctic were also described from Arctic areas (Sancho et al. Reference Sancho, Schulz, Schroeter and Kappen1999, Øvstedal & Smith Reference Øvstedal and Smith2001). Although most of the bipolar lichen species are phenotypically defined, the bipolar distribution of several morphologically defined species was supported by molecular analyses (Myllys et al. Reference Myllys, Stenroos, Thell and Ahti2003, Wirtz et al. Reference Wirtz, Printzen and Lumbsch2008, Fernández-Mendoza et al. Reference Fernández-Mendoza, Domaschke, García, Jordan, Martín and Printzen2011). The current study shows that specimens of the bipolar species, C. borealis, are phenotypically diverse but closely related to each other. It has been suggested that plants and lichens can travel between Southern and Northern hemispheres by birds and wind (Bailey & James Reference Bailey and James1979, Kappen & Straka Reference Kappen and Straka1988, Marshall Reference Marshall1996, Crespo et al. Reference Crespo, Molina, Blanco, Schroeter, Sancho and Hawksworth2002, Richardson et al. Reference Richardson, Fay, Cronk and Chase2003), with birds such as Arctic terns (Sterna paradisaea Pontoppidan), proposed as the major travel agents (Egevang et al. Reference Egevang, Stenhouse, Phillips, Petersen, Fox and Silk2010). Migration between South America and the Antarctic could be explained by wind and birds (Muñoz et al. Reference Muñoz, Felicísimo, Cabezas, Burgaz and Martínez2004, Wirtz et al. Reference Wirtz, Printzen and Lumbsch2008). In many cases of widely distributed lichen species, the same haplotypes are found in different localities and this can be explained by recent long-distance dispersal (Buschbom Reference Buschbom2007, Wirtz et al. Reference Wirtz, Printzen and Lumbsch2008). In our study of C. borealis each genotype was collected only from one locality and no one genotype was found in more than one place. This can be partly explained by insufficient sampling from South America and the Arctic area. However, it cannot explain the absence of South American or Arctic genotypes on King George Island because they were not found among 42 samples on King George Island. We suggest that migration of C. borealis does occur but not often enough to observe the same genotypes both in the Arctic and the Antarctic areas. Cladonia borealis has been recorded from alpine areas such as the Rocky Mountains and the Andes Mountains as well as in polar areas (Ahti Reference Ahti2000). Stenroos (Reference Stenroos1993) reported that migration of cladoniacean taxa in Antarctic areas may have occurred along the Andean chain immediately after Pleistocene glaciation. Wirtz et al. (Reference Wirtz, Printzen and Lumbsch2008) proposed migration along the summits of mountain ranges for the lichen species Usnea lambii (Imshaug) Wirtz & Lumbsch. Considering cosmopolitan distribution of C. borealis along the Rocky Mountains and the Andes Mountains, this last explanation may be as relevant as the wind and bird hypotheses.
The next stage will be to collect more specimens from the Arctic, South America, and mountain areas as well as using more genetic markers.
Acknowledgements
We would like to thank Jae Kyung Chon (Seoul National University) for helping us with preparing the illustrations. We are also grateful to reviewers for comments which improved the contents of the paper. This work was supported by the Korea Polar Research Institute (Grant PE11030 and PE10140).
Supplemental material
Two supplemental figures and one table will be found at http://dx.doi.org/10.1017/S0954102012000223.