I. INTRODUCTION
In the past decades, rare earth (RE) ion-doped luminescence glasses have been widely applied in many fields, such as light sources,Reference Zhu, Yang, Liang, Yuan and Chen1 scintillators,Reference Wantana, Kaewjaeng, Kothan, Kim and Kaewkhao2 biomedical detectors,Reference Tillman, Dettmann, Herrig, Thune, Zieser, Michalek, Been, Martinez-Szewczyk, Koster, Wilkinson, Kielty, Jacobsohn and Akgun3 lasers,Reference Jha, Richards, Jose, Teddy-Fernandez, Joshi, Jiang and Lousteau4 optical communications,Reference Hewak, Deol, Wang, Wylangowski, Neto, Samson, Laming, Brocklesby, Payne and Jha5 etc. Recently, advances in GaN-related devices have enabled the UV light-emitting diode (LED) chips popular on the market. This in turn advances the rapid development of new light sources excited by the UV LED chip. Now the maturest wavelength of UV LED chips located in the UV region, while RE ions cannot be excited highly efficient by UV light due to the nature of 4f transitions of RE ions.Reference Zhang, Lin, Yu, Chen, Xu and Wang6 To obtain high efficient luminescence, some activators with broadband absorption in the ultraviolet-visible region, such as Eu2+,Reference Gao, Da, Reibstein and Wondraczek7,Reference Chen, Zhou, Jiang, Lv and Qiu8 Ce3+1, charge-transfer,Reference Liu, Qiao, Dong, Ye, Zhu, Lakshminarayana, Chen and Qiu9 and noble metal ions,Reference Li, Wei, Liu and Guo10 were used to overcome the problem.
Actually, hybrid optical materials consisting of glass matrices, RE ions, and noble metal ions have been extensively studied over the past decades, due to their potential applications in various photonic and optoelectronic devices, e.g., solar cells,Reference Rivera, Ledemi, Pereira-da-Silva, Messaddeq and Marega11,Reference Xu, Chen, Zhou, Hong, Hao and Qiu12 biomedical imaging,Reference Chung, Gerelkhuu, Oh and Lee13 and light-emitting devices.Reference Wei, Ma, Wei, Gao and Guo14 In the past decades, enhanced visible light emitting has been observed and studied in RE and various noble metal ion codoped glasses from the application standpoint. For example, Kaur et al. reported an improved visible luminescence and increased lifetime of 4G5/2 emitting states from Sm3+-doped polymeric containing Ag nanoparticles.Reference Kaur, Verma, Rai and Rai15 Wu et al. reported enhanced upconversion luminescece in Er–Yb codoped bismuth-germanate glasses containing sliver nanoparticles.Reference Wu, Shen, Dai, Xu, Chen, Lin, Xu and Nie16 And a similar phenomenon was observed in Er-doped phosphate and zinc tellurite glasses containing silver nanoparticles.Reference Singh, Giri, Rai and Rai17,Reference Mahraz, Sahar, Ghoshal, Dousti and Amjad18 The authors ascribed the enhanced luminescence to the energy transfer from Ag nanoparticles to the RE ions via surface plasmon resonance of Ag nanoparticles. However, the reports are concentrated on the enhancement luminescence of the RE ions excited by blue light via surface plasmon resonance. It was not consistent with the wavelength of UV LED chip. Recently, more researchers reported enhancement luminescence of RE ions via energy transfer from silver ions to RE ions, which provide an efficient strategy to improve the luminescence efficience of RE ions when excited by the ultraviolet light. The absorption band of Ag+ was located at 200–350 nm range, which was consistent with the wavelength of the UV LED chip. The energy transfer from the silver ions to the RE ions provide a new avenue to obtain high efficient luminescence glasses which have potential application in the WLED excited by UV light.
In this paper, Sm3+-doped silicate glasses containing Ag ions were fabricated. The spectroscopic characteristics of the Sm3+ ions with the increase of the silver concentration when excited by UV and blue light were systematically studied to clarify the energy transfer mechanism between the Sm3+ ions and silver ions. And the results showed that the enhancement of luminescence was observed when the silver concentration upon 0.5 wt%. When excited at blue light, the luminescence of Sm3+ ions decreased with the increase of the Ag concentration. We believed that this work might be a benefit to the designation of the high luminescence efficient RE-Ag ion codoped luminescence glasses.
II. EXPERIMENTAL
A glass composition of 63SiO2–10BaF2–12Na2CO3–12Li2CO3–1.5La2O3–1.5Sm2O3 in mol% was selected as the target silicate glass matrix. Different concentrations of AgNO3 (x = 0, 0.1, 0.5, 1.5, 3.0 wt%) were introduced to the glass matrix. Analytical reagents SiO2, BaF2, Na2CO3, AgNO3, 4N La2O3, and Sm3O3 were used as starting materials. 30 g mixture of the raw materials were weighed according to the above nominal compositions and were homogeneously ground and mixed. Then the mixed raw materials were transferred to an alumina crucible. All the samples were melted at 1350 °C for 30 min, and then poured onto a preheated stainless steel plate at 300 °C. The samples afterward were annealed at 300 °C for 3 h then were cut into suitable sizes. Two big faces of each sample were polished for optical measurements. The obtained samples were denoted as Sm–xAg (x = 0, 0.1, 0.5, 1.5, 3.0).
Absorption spectra were measured by using a Lambda 900 spectrophotometer (Perkin Elmer, Waltham, Massachusetts). Static excitation and emission spectra, and fluorescence decay curves were measured by using a Edinburgh FLS920 fluorospectrophotometer (Edinburgh Instruments Ltd., Livingston, United Kingdom) with double xenon lamp houses. One was 450 W for steady state measurement and another was 60 W microsecond flashlamp for dynamic spectrum recording. All the measurements were performed at room temperature.
III. RESULTS AND DISCUSSIONS
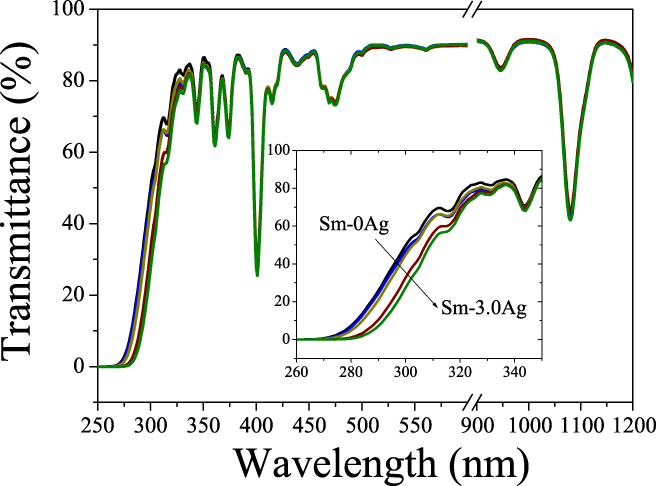
Figure 1 shows the transmittance spectra of the glass samples with the increased concentration of AgNO3 from 0 to 3.0 wt%. In the wavelength range from 350 to 1200 nm, the transmittance of the glass samples does not change with the increase of the AgNO3 concentration. Five strong absorption peaks at 344, 360, 374, 401, and 475 nm were observed in the visible range, which were assigned to the transitions of 6H5/2 → 4I11/2, 6H5/2 → 6P5/2, 6H5/2 → 4K13/2, 6H5/2 → 6P3/2, and 6H5/2 → 4I13/2, respectively.Reference Zhang, Peng, Dong and Qiu19 The absorption peaks and intensity do not change along with Ag concentration increasing. While the ultraviolet region absorption edge shows a slight blue-shift from 275 to 260 nm when the Ag concentration increases from 0 to 3.0 wt%, as shown in the inset of Fig. 2. The ultraviolet region absorption edge was derived from the transition from localized states at the top of the valence band to the delocalized states in the conduction band. Davis and Mott deduced a general form to describe the relationship between the photon energy and the absorptionReference Davis and Mott20:
 $$\alpha \left( \omega \right) = {B \over {\hbar \omega }}{\left( {\hbar \omega - {E_{{\rm{opt}}}}} \right)^r}\quad ,$$
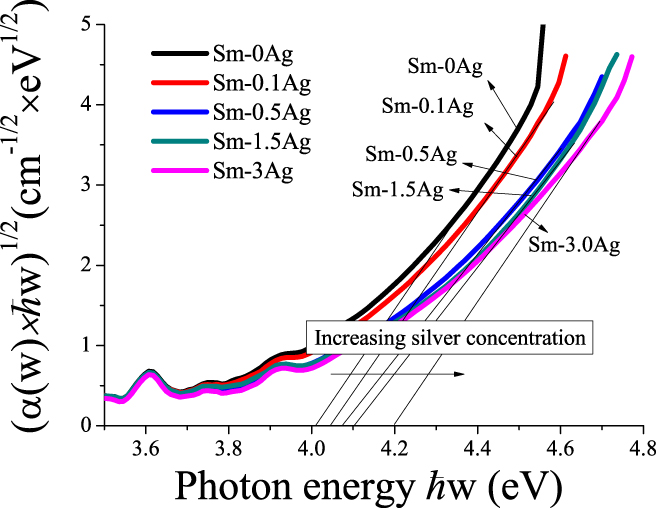
where α(ω) is the optical absorption coefficient, B is a constant, ħ is the reduced Planck constant, ω = 2πv, E opt is the optical energy gap, and r is an index which can assume values of 2, 3, 1/2, 3/2 depending on the nature of the electronic transitions responsible for the absorption. For many oxide glasses, the r was estimated to be 2.Reference Konijnendijk, Stevels, Pye, Fréchette and Kreidl21 We replotted the optical absorption in terms of absorption by indirect transitions for the glass samples with the AgNO3 concentration from 0 to 3 wt% in Fig. 2, and the E opt can be obtained from the extrapolation of the linear portion of these curves. The value of the E opt shows a slight decrease from 4.2 to 4.0 eV when the AgNO3 concentration increases from 0 to 3 wt%. The E opt was represented as the transitions from localized states at the top of the valence band into the delocalized states in the conduction band or vice versa. Stevels had suggested that the movement of the ultraviolet absorption band to longer wavelengths corresponding to transitions from the nonbridging oxygen which bind an excited electron less tightly than bridging oxygen.Reference Konijnendijk, Stevels, Pye, Fréchette and Kreidl21 Silver ions were introduced into the silicate glass matrix to perform as modifiers. With the increase of silver ions, the network of silicate glass would be modified, thus induces the increase of nonbridging oxygen content and shifts the ultraviolet absorption band edge to the shorter wavelength and leads to a decrease in the value of E opt. It was well known that the surface plasmon resonance band of the Ag nanoparticle was located at about 400 nm, which was similar to the absorption of the transition from ground state energy to the excited state 6P3/2. Thus, the surface plasmon band of Ag nanoparticles cannot be observed in the Ag–Sm3+ codoped silicate glasses.
Transmittance spectra of glasses with the increased concentration of AgNO3 from 0 to 3.0 wt%.

Replotted optical absorption in terms of absorption by indirect transitions for tellurite glasses with the AgNO3 concentration from 0 to 3 wt%.

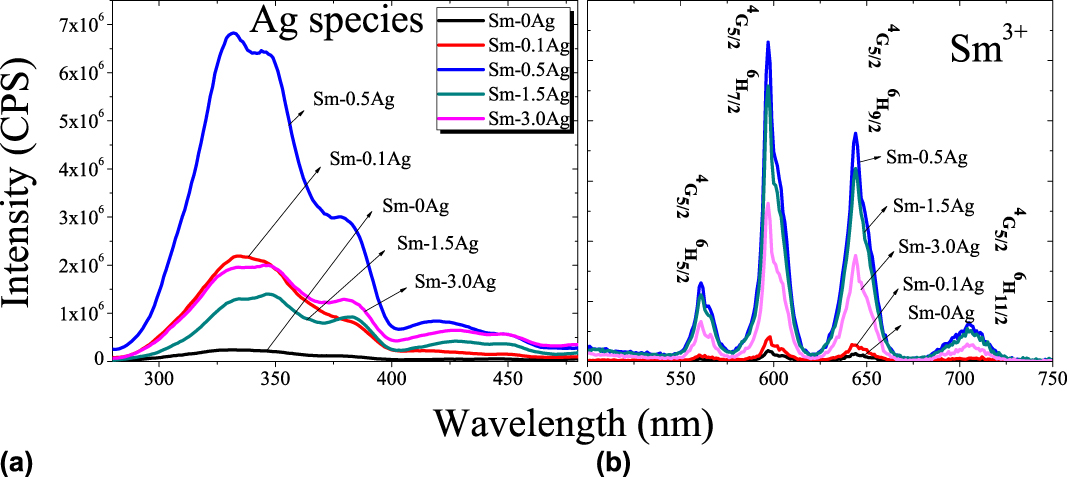
Figure 3 is the fluorescence spectra of Sm3+–Ag codoped silicate glasses excited at 255 nm with the increased concentration of AgNO3 from 0 to 3.0 wt%. In the 280–500 nm range, a broad emission band at 350 nm was observed as shown in Fig. 3(a). In the 500–800 nm range, four emission bands at 562, 596, 643, and 704 nm can be observed as shown in Fig. 3(b). The four emission bands located in the 500–800 nm range can be assigned to the transitions 4G5/2 → 6H5/2, 4G5/2 → 6H7/2, 4G5/2 → 6H9/2, and 4G5/2 → 6H11/2 of Sm3+, respectively, while the emission bands located at 280–500 nm cannot be assigned to the transitions of Sm3+. First, there was no energy level gap of Sm3+ match the energy of the ultraviolet emission. Second, no ultraviolet emission bands were observed from Sm3+-doped glass without AgNO3 content. Finally, the emission band derived from the transition of RE ions would be a narrow band due to the nature of the 4f transitions, while the emission band at 350 nm was a broad band with the width more than 100 nm. The ultraviolet emission bands should be derived from Ag relative species. When the AgNO3 concentration is smaller than 0.5 wt%, the intensity of the fluorescence of the Sm3+ linearly increased about almost 31 times comparing with the Sm3+-doped silicate glass without AgNO3. When the AgNO3 concentration increased more than 0.5 wt%, then the fluorescence intensity decreased linearly.
(a) Fluorescence spectra of Sm–Ag codoped silicate glasses excited at 255 nm in the 280–480 nm range; (b) fluorescence spectra of Sm–Ag codoped silicate glasses excited at 255 nm in the range 500–750 nm.

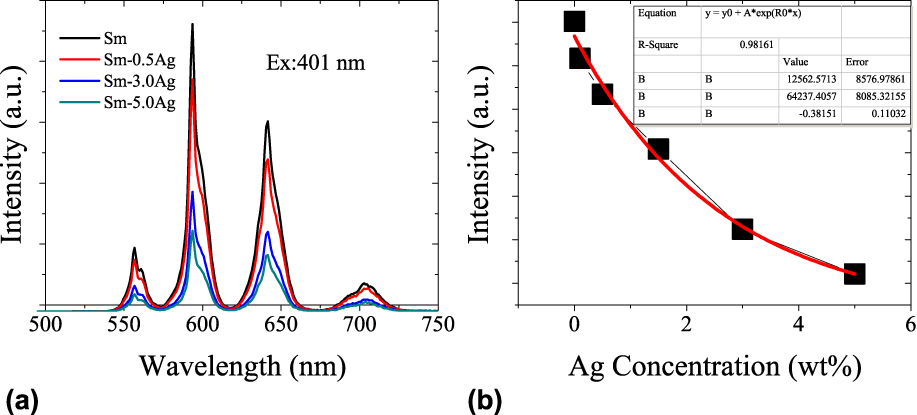
Figure 4(a) shows the fluorescence spectra of Sm3+–Ag codoped silicate glasses excited at 401 nm. The fluorescence spectra were similar to the emission spectra excited at 255 nm. Four emission bands located at 562, 596, 643, and 704 nm can be observed, corresponding to the transitions 4G5/2 → 6H5/2, 4G5/2 → 6H7/2, 4G5/2 → 6H9/2, and 4G5/2 → 6H11/2 of Sm3+, respectively. Figure 4(b) shows the dependence of the emission intensity of Sm3+ excited at 401 nm on the AgNO3 concentration. With increasing AgNO3 concentration from 0 to 3.0 wt%, the fluorescence intensity of Sm3+ decreased exponentially, as shown in Fig. 4(b).
(a) Fluorescence spectra of Sm–Ag codoped silicate glasses excited at 401 nm and (b) the dependence of the fluorescence intensity on the AgNO3 concentration.

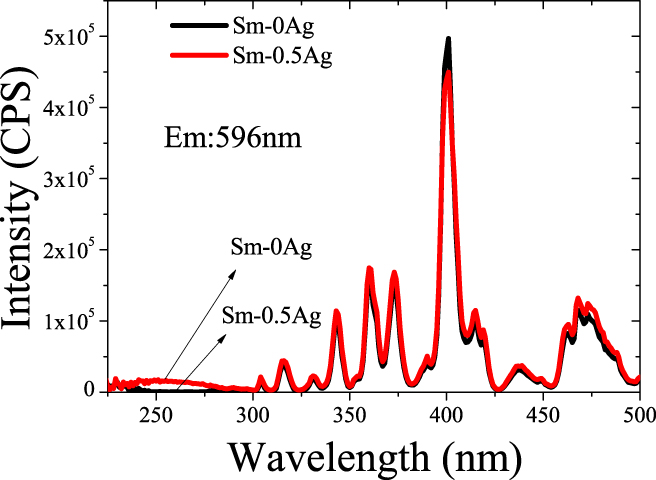
Excitation spectra of Sm3+–Ag codoped silicate glasses monitored the emission at 596 nm are exhibited in Fig. 5. In the range 300–500 nm, night excitation bands were observed, corresponding to the transitions of Sm3+. In the range ∼300 nm, a broad excitation band around 255 nm was observed in Sm3+-doped silicate glasses with 0.5 wt% AgNO3, while it was not observed in the glass without Ag content. It was well known that there was no absorption band located around 255 nm of Sm3+. And the absorption band derived from the transition of RE ions would be a narrow band due to the nature of the 4f transitions. Thus, the excitation band around 255 nm must be related to Ag species. A similar broad excitation band around 245 nm and emission around 340 nm were reported in isolated Ag+ ion-doped soda-lime silicate glasses, and ultraviolet emission was assigned to the electronic transition from the ground state (1S0) of 4d 10 to the exited state (3D1) of 4d 95s 1.Reference Borsella, Battaglin, Garcia, Gonella, Mazzoldi, Polloni and Quaranta22,Reference Meijerink, Van Heek and Blasse23 Thus, in our opinion, the strong visible emission of Sm3+ when excited at 255 nm may be derived from the energy transfer from Ag+ to Sm3+.
Excitation spectra of Sm–0Ag and Sm–0.5Ag glasses when monitored the emission at 596 nm.

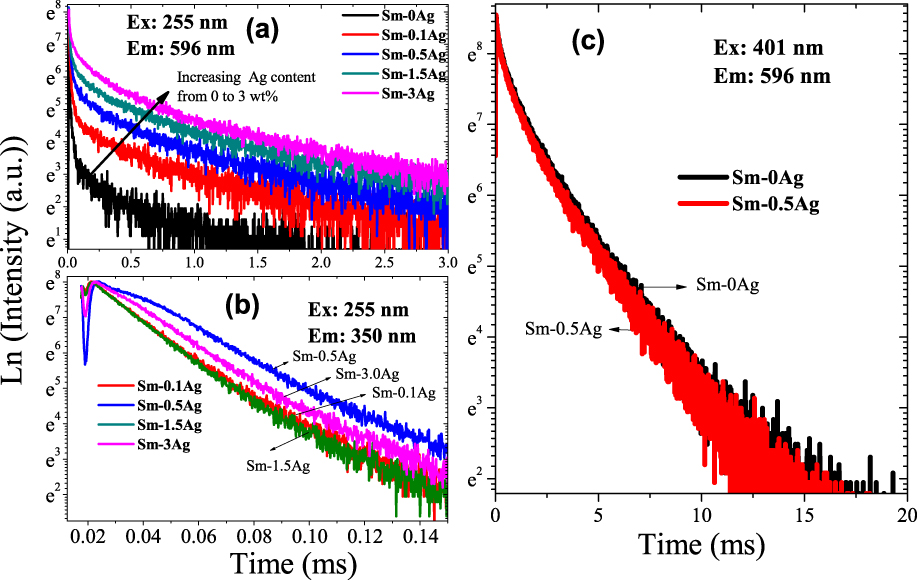
To further clarify the origin of the ultraviolet excitation and emission bands, we measured the fluorescence decay curves for the emission at 596 nm excited by 255 and 401 nm, which are exhibited in Figs. 6(a) and 6(c). And the fluorescence decay curves for the emission at 350 nm excited by 255 nm are also exhibited in Fig. 6(b). The fluorescence curves of the emission at 596 nm excited by 255 nm follow the double exponential decay, and two fluorescence lifetimes can be obtained according to the fitting curves, which indicated that there were two fluorescence centers exist in the glass samples. The fitted shorter lifetimes were about 7–20 μs, and they were varied along with the AgNO3 concentrations. While other fitted longer lifetimes were about 2 ms, and they were independent of the AgNO3 concentrations. When exited by 401 nm, the emission of Sm3+ at 596 nm follows a single exponential decay, as shown in Fig. 6(c), and the decay curves do not change with the increase of AgNO3 concentrations. The fitted lifetimes were about 1.37 ms for all the samples. The 350 nm emission excited by 255 nm follows a single exponential decay and the fitted lifetimes about 10–20 μs, which shows a slight decrease along with increasing AgNO3 concentrations. When excited by 255 nm, the slower decay about 2 ms can be assigned to the decay of Sm3+ since it was comparable with the lifetimes of Sm3+ excited by 401 nm. While the fast decay was comparable with the 350 nm emission decay. According to the above discussion, we found that the emission at 350 nm excited by 255 nm was assigned to the electronic transition of Ag+ from the ground state (1S0) of 4d 10 to the exited state (3D1) of 4d 95s 1. Thus, the fast decay can be ascribed to the decay of Ag+.
(a) Fluorescence decay curves for all glass samples excited by 255 nm and monitored the emission at 596 nm; (b) fluorescence decay curves for all glass samples excited by 255 nm and monitored the emission at 350 nm; (c) fluorescence decay curves for Sm–0Ag and Sm–0.5 Ag excited by 401 nm and monitored the emission at 596 nm.

According to the above discussion, we can conclude that the enhancement of the emission of Sm3+ excited at ultraviolet light originate from the energy transfer from Ag+ to Sm3+. When excited by ultraviolet light, Ag+ was first excited from the ground state to excited state, then the excited Ag+ relax to the ground state, accompanying with broad band UV emission and transferring a part of energy to a neighboring Sm3+, resulting in the visible emission from Sm3+, which is exhibited in Fig. 7. The efficient of the energy transfer determined the emission intensity of Sm3+. The energy transfer rate can be commonly expressed as followsReference Di Bartolo and Goldberg24:
 $${P_{{\rm{DA}}}} = {1 \over \tau }{\left( {{{{R_0}} / R}} \right)^6}\quad ,$$
where R is the distance between the donor and acceptor. R 0 is the critical distance. τ is the radiative lifetime of donor. According to Eq. (2), the energy transfer rate was determined by the distance R. With the increase of Ag+ concentration, the distance between the Ag+ and Sm3+ should be smaller, and then the energy transfer rate should be increased exponentially with the index of 6. Thus, the decay of Ag+ should be faster, and it was demonstrated by the lifetime of the emission at 350 nm, as shown in Fig. 6(b). However, the emission intensity when excited by 255 nm does not increase continuously with the AgNO3 content increasing. It was up to strongest when the AgNO3 content was 0.5 wt%, then decreased. In our opinion, the emission intensity of Sm3+ excited by 255 nm was determined not only by the energy transfer from Ag+ to Sm3+ but also effected by the Sm3+ concentration. When AgNO3 content increased, the relative concentration of Sm3+ should be slightly decreased. Thus, it would deduce a slight decrease of the emission intensity. It can also account for the exponential decrease of the emission intensity when excited by 401 nm.
The simple energy level diagrams for Ag+, Sm3+, and the energy transfer process.

IV. CONCLUSIONS
In this work, we systematically investigated the effects of AgNO3 content on the spectroscopic characteristics of Sm3+. When excited by 255 nm, a significant enhancement visible emission of Sm3+-doped silicate glass containing 0.5 wt% AgNO3 was observed, and it was about 31 times stronger than the Sm3+-doped silicate glass without AgNO3. And a broadband ultraviolet emission at 350 nm was observed in Ag+ and Sm3+ codoped glasses, while it was not observed in Sm3+ singly doped glass. The ultraviolet emission was derived from the transition of Ag+ since it is similar to the reported excitation and emission bands of Ag+. The fluorescence decay curves of the 596 emission follow a double exponential decay. Two lifetimes can be obtained according to the fitted decay curves, and the fitted shorter lifetimes were about 7–20 μs, while the fitted longer lifetimes were about 2 ms. The shorter lifetimes were comparable with the lifetimes of 350 nm emission, which were derived from Ag+, and the longer lifetimes were comparable with that of the visible emission from Sm3+ excited by 401 nm. It demonstrated that the emission of Sm3+ excited by 255 nm was derived from the energy transfer from Ag+ to Sm3+.
ACKNOWLEDGMENTS
This work was financially supported by the National Natural Science Foundation of China (Grant No. 61505084), Natural Science Foundation of Jiangsu Province, China (Grant No. BK2015084), and the Doctoral Scientific Research Foundation of Jiangxi University of Science and Technology (Grant No. 3401223332).