

Introduction
This paper attempts to analyse Consultative Parties’ (CP) contributions during the period 1998–2011, based on various aspects of their participation in the Antarctic Treaty Consultative Meetings (ATCM), and it also discusses a number of factors that might be used to explain the different patterns of participation observed, with particular emphasis on the work of the most active CPs. In this study, the term ‘pattern of participation’ makes reference to inter alia a set of decisions made by a given CP in the context of ATCMs which may reveal its preference to work either proactively, reactively or passively; either isolated or in association with others; and its selectiveness to choose certain issues to engage in and the resources it devotes to do so. Therefore, this paper neither attempts to quantify CP performance nor to produce a ranking among them. Rather, it aims to describe, and to a certain extent, to understand, the different ways in which CPs choose (or manage) to participate in the ATCM arena.
Addressing an analysis of how CPs participate in the framework of ATCMs is complex. As any decision making process deals with people and organisations, any attempt of modeling them will be challenging. In this study, Allison's three models of foreign policy analysis (Allison Reference Allison1969) and the work of his critics, like Bendor and Hammond (Reference Bendor and Hammond1992), will be used as a conceptual basis. The entanglements of domestic politics and international relations in individual structures of decision making, as modeled by the ‘logic of two-level games’ (Putnam Reference Putnam1988), also provide this study with additional elements that may contribute to explain specific countries’ patterns of participation. However, it is not the purpose of this paper to unveil how CPs internally build up their decisions in the context of ATCMs, but to reflect how their patterns of participation looked like in a specific period of time, and to point out how different outputs of the treaty parties within ATCMs can reveal information that may serve as useful tools to approach new areas of study. The results of this work may therefore contribute to trigger further focused studies on different aspects of the patterns of participation of selected CPs in the political arena.
Within ATCMs, countries strategically negotiate with different partners in different instances and contexts, and from different perspectives. Negotiation is thus defined as an interactive process between two or more parties where common and conflicting interests coexist, and whose results are not subject to be entirely controlled by any of the parties. As different countries’ patterns of participation might have different, both direct and indirect, effects on other parties’ decisions, the term ‘influence’, broadly defined here as the capacity of a given CP, through a certain pattern of participation, to produce effects on the actions, behaviours, or opinions, of other CPs towards a direction that converge with its interests, has been used in this study to reflect the nature of the results of such strategic negotiations. Such a concept, in the author's opinion, adequately fits the spirit of consensus upon which the Antarctic Treaty has been built since its inception.
Describing the arena for CP participation
The ATCMs
The Antarctic Treaty conducts its formal business at annual meetings known as Antarctic Treaty Consultative Meetings (ATCMs). According to the Treaty's article IX, the meetings are held for the purpose of ‘exchanging information, consulting together on matters of common interest pertaining to Antarctica, and formulating and considering, and recommending to their Governments, measures in furtherance of the principles and objectives of the Treaty’.
The ATCMs normally consist of several sessions, including those of the plenary and the working groups, which unfold in parallel to the meeting of the Committee for Environmental Protection (CEP). For the 1998–2011 period, three working groups have functioned in the ATCM's framework: Legal and Institutional Affairs, Operational Matters, and Tourism and Non-Governmental Activities (the latter, as of 2004). The CEP started its operations in 1998: when the Protocol on Environmental Protection to the Antarctic Treaty (also known as the Madrid Protocol and hereinafter referred to as the protocol), a legal regime for the protection of the Antarctic environment, entered into force on 14 January, 1998. It established (through article 11) the Committee for Environmental Protection, acknowledging that implementing a comprehensive environmental framework would require specialist environmental, scientific and technical advice (Sánchez and McIvor Reference Sánchez and McIvor2007). The entering into force of the protocol constituted a milestone in Antarctic policy making, and substantially changed the way ATCMs conducted their activities since then. This is the main reason why this study begins its analysis in 1998.
Since its inception, the CEP meeting has traditionally had to deal with the highest (and ever increasing) workload, compared to the remaining sessions of the ATCM. Therefore, for the purposes of this work, a distinction between the CEP meeting and the ATCM (which encompasses the work of the plenary and the working groups) has been made.
Working groups and the CEP often work simultaneously. The plenary usually opens and closes the ATCM, and it is where all recommendations made in the remaining sessions and the CEP meeting are considered and, if appropriate, adopted through legally binding measures, procedural decisions or hortatory resolutions.
Since the signing of the Antarctic Treaty in 1959 and up until 1977, membership was limited to the original 12 signatories. Out of these, seven nations (Argentina, Australia, Chile, France, New Zealand, Norway and the United Kingdom) have sustained sovereignty claims to parts of the Antarctic continent, and two (United States and the Russian Federation, originally the Soviet Union) reserve rights to make claims in the future. These countries are usually called the ‘7+2’ group, or the ‘claimants + 2’ group (hereinafter referred as ‘G7+2’). However, it must be noted that such claims and reservations are currently set aside by article IV of the Treaty. The remaining non-claimant original signatories are Belgium, Japan and South Africa. At present, membership has expanded to 29 CPs, and 24 Non-Consultative Parties (28 CPs and 22 Non-CPs during the period considered in this study).
CPs are entitled to participate in the ATCMs and in its process of decision-making, which is based on the principle of consensus. The ATCMs are also attended by Non-CPs Parties, Observers (among which the Scientific Committee on Antarctic Research, SCAR, and the Council of Managers of National Antarctic Programs, COMNAP, stand as the most relevant Antarctic advisory bodies), and experts from international organisations. Non-CPs, observers and experts do not take part in the ATCM decision-making process.
Matters for discussion at the ATCM are raised by parties either in the form of Working Papers (WPs) or Information Papers (IPs). The former refer to papers that require discussion and action at a meeting, while the latter provide either information in support of a WP or relevant information to discussions at a meeting. As of ATCM XXXV, Hobart, 2012, a new category, Background Papers (BPs), was introduced which refers to papers that are submitted by any participant for the purpose of formally providing information to the meeting, without being introduced to it. In addition, Secretariat Papers (SPs) refer to papers prepared by the secretariat pursuant to a mandate established at a meeting, or which would, in the view of the executive secretary, help inform the meeting or assist in its operation (ATCM 2011). This study only considers WPs, as they are the main source for debates within ATCMs.
In particular, a given WP can broadly pursue any of the following purposes: a) to bring a new issue for debate; b) to add new elements/visions to a continuing discussion; c) to call the attention of the meeting on a certain matter; or d) to fulfill a requirement of the treaty/protocol. WPs and IPs can either be submitted to the CEP only (if its main subject deals exclusively with the CEP agenda); to both the CEP and the ATCM (if it concerns to the CEP meeting, but also to the agenda of any of the remaining sessions); or only to the ATCM (when the paper is to be discussed by any of the working groups, or the plenary). It is an attribution of each CP to decide to which session its WPs are submitted. While WPs are translated into the four treaty languages (English, Spanish, French and Russian), IPs are only translated at the request of the proponent CP.
Intersessional work
Originally, CPs concentrated all of their work at the ATCMs. With the advent of the internet, new opportunities emerged to make progress on certain ATCM issues during intersessional periods. The CEP has had a leading role in this new practice and at its very first meeting (1998) it established its first Intersessional (open ended) Contact Group (ICG). According to Rule 9 of its rules of procedures, the CEP is entitled to establish ICGs to examine specific issues and report back to the committee (ATCM 2011). Firstly, these intersessional discussions took place through e-mail exchanges. Once the treaty secretariat was established, in 2004, a web-based discussion forum to host such intersessional activities was set up on-line, providing the system with a dynamic work environment, a much higher degree of transparency and also with the possibility of recording each exchange, thus creating a very valuable archive of such discussions. As of 2007, non-CEP matters have also had the chance to be discussed intersessionally through a web-based ATCM discussion forum, also hosted by the treaty secretariat.
Over time, different types of intersessional activities arose. Hence, the work was undertaken in the ICGs, as well as the so called ‘informal’ intersessional discussions, and the subsidiary groups. The main difference between the former two types is that ICGs operate under a clear mandate, given by terms of reference previously agreed to by the meeting, while the ‘informal’ discussions do not follow a mandate, being basically an exchange of opinions over a specific issue, which the meeting considered useful. Concerning the subsidiary groups, the CEP has also played a leading role when in 2008 it established, with the approval of the ATCM and according to its rule of procedure 10, its Subsidiary Group on Management Plans (SGMP). Prior to the SGMP, the so called Trial Informal Group on Management Plans Review worked on a trial basis during the 2007–2008 period on the CEP web-based discussion forum.
Subsidiary Groups are thought routinely to undertake CEP tasks, such as, in this case, the consideration of new and revised management plans for Antarctic protected areas. Finally, within the CEP, consideration of certain types of environmental impact assessments (the so-called Comprehensive Environmental Evaluations, or CEEs) is also undertaken intersessionally. Originally this was carried out through e-mail exchanges, and since 2004, through the CEP web-based discussion forum.
Intersessional activities are structured with a coordinator, who leads discussions, and CPs, non-CPs, observers and experts who voluntarily take part in them. Coordinators are designated by the meeting and usually represent the countries which put forward the specific issues for debate. Coordination of exchanges within the SGMP is led by the first CEP vice-chair. The results of intersessional activities are presented on behalf of the coordinator's country of nationality, through a WP for consideration of the following meeting.
According to the ATCM Rules of Procedure, only SCAR, COMNAP and CCAMLR are considered observers, while experts is a category limited to international organisations having a scientific or technical interest in Antarctica. The ATCM, after a proposal from any CP, shall decide which of these shall be invited to designate a representative to attend the forthcoming Meeting in order to assist it in its substantive work. In relation to CEP Meetings, its Rules of Procedure states that observer status in the Committee shall be open to a) any CP to the Antarctic Treaty which is not a party to the protocol; b) the President of the SCAR, the Chairmen of CCAMLR's Scientific Committee and COMNAP, or their nominated representatives; and c) subject to the specific approval of the ATCM, other relevant scientific, environmental and technical organisations which can contribute to the work of the Committee (ATCM Rules of Procedure # 39–41 and CEP Rule of Procedure #4).
Web based intersessional discussions have proved very useful because they allow for making progress and ‘massaging’ issues that require a more in depth treatment. In that way, they enable saving valuable discussion time at the meetings, and so the system gains in efficiency. The system also gains in quality, since it allows specialists not attending the meeting to provide inputs for debate over more extended periods of time, than those available at meetings.
Materials and methods
This article attempts to describe CPs’ participation on the ATCMs’ work in terms of the following aspects:
-
a) WPs content
-
b) WPs authorship
-
c) Parties’ proaction in presenting issues for intersessional debate
-
d) Parties’ emphasis on ATCM/CEP arenas
-
e) Size of national delegations attending ATCMs
The period considered in this paper covers thirteen ATCMs and one Special ATCM, from 1998, the year the Madrid Protocol entered into force and the CEP was established, to 2011. Information on WPs tabled at ATCM and CEP meetings and ATCM/CEP final reports are available in full on the website of the Antarctic Treaty Secretariat (www.ats.aq).
WPs contents
Dudeney and Walton (Reference Dudeney and Walton2012) took production of WPs by each CP as a measure of leadership and engagement, but recognising that such an indicator, in which all WPs were equally weighed, did not provide a comprehensive measure, as the contents of individual WPs were not taken into account. Thus, this analysis attempts partly to fill this gap, by considering the issues approached by parties in the WPs they have submitted to ATCMs during the considered period (1998–2011). As the way different countries participate in ATCMs might influence other parties’ decisions, the analysis of parties’ paper production, in the author's opinion, would only allow estimating the CPs levels of ‘engagement’ in the ATCM work, as well as identifying the matters that have most concerned each CP, but it would not adequately apply to estimate ‘leadership’, which would require a more comprehensive analysis.
Among all possible issues, seven main subject matters have been selected to analyse WP contents, taking into account their most frequent occurrence in WPs and also the area of incumbency at the meeting. However, it should be noted that the contents of a given WP may on occasions be attributable to more than one category, and the agenda point to which it was submitted to the corresponding session of the meeting might not always be fully indicative.
The seven main subject matters are: a) Protected areas; b) Other environmental issues, including the Madrid Protocol Annexes I to IV (environmental impact assessments, conservation of flora and fauna, waste management and prevention of marine pollution) and Climate change issues; c) Tourism (including issues of management and safety); d) Operational matters (issues associated to station operations, safety, navigation, inspection reports); e) Antarctic Treaty Secretariat matters (establishment and functioning); f) Meeting administrative business (for example rules of procedure and other normative issues); g) Legal issues (Liability arising from environmental emergencies and biological prospecting activities, among others). Finally, an eighth category (‘Other matters’) was left for those issues not covered by the previous seven categories.
Likewise, for the purposes of this article, single and multi-author papers count as one for each CP, although noting that for certain multiple party authorships, there is often a main author, followed by one or more accompanying countries.
WPs authorship
WPs can be submitted by a single party or by multiple parties. Therefore, for each party, the number of WPs tabled alone will be compared to those in association with one or more partners, as an indication of a party's will to share their proposals with one or more CPs (or their will to join others). The number of countries with which a given party has co-sponsored WPs, as well as the number of frequent associates has also been considered, as an additional measure to estimate CPs’ openness, and selectiveness, to interact with other players. In this case, single and multi-author papers also count as one for each CP.
Parties’ proaction in presenting issues for intersessional debate
Parties exhibit proactive behaviour when they intentionally and directly aim to change things, by taking the initiative to create new circumstances, or actively to alter current ones, for the better (based on a proaction definition by Bateman and Crant (Reference Bateman and Crant1999). Thus, introducing matters for intersessional discussion to the ATCM speaks of a particular, proactive interest and commitment in making progress on a given line of work. Therefore, as coordinators of intersessional activities convene ICGs on behalf of the countries who put forward the specific issues for debate, the number of intersessional activities coordinated by each CP was taken as a measure of their proactive participation.
Parties’ emphasis on ATCM/CEP arenas
The existence (or the absence) of common patterns of participation between the ATCM and CEP will be briefly described, in terms of submission of WPs. Thus, the emphasis CPs have placed in one arena in respect to the other (that is ATCMs on the one hand or CEPs on the other) will be exhibited and compared. For this purpose, the number of WPs submitted to the CEP and the ATCM was used as an indicator. To take account of papers submitted to more than one session (ATCM or CEP), a very simple rule was adopted: a WP targeted only on one session (ATCM or CEP) counts as 1, while if tabled at both (ATCM and CEP), it counts as 0.5 each. In addition both single and multi-author papers count as one for each CP.
Size of national delegations attending ATCMs
Finally, the size of a national delegation may speak of the CP's need for (or interest in) more or less specific knowledge and expertise on the different issues addressed at ATCMs. Or the extent to which the national organisation is wedded to bureaucracy. National delegations are therefore represented by a broad spectrum of professionals (including lawyers, political, social, and natural scientists, and militaries, among others), who are often internally recruited from different governmental agencies dealing with, inter alia, foreign affairs, defence, environmental protection, and science and technology, and even from non-governmental organisations. (Sánchez and Njaastad Reference Sánchez, Njaastad, Tin, Liggett, Maher and Lamers2014). The size and the composition of delegations to ATCMs and its evolution during the considered period may therefore give hints on the interests placed by a given CP on the issues addressed at ATCMs over time.
Results and discussion
WPs contents
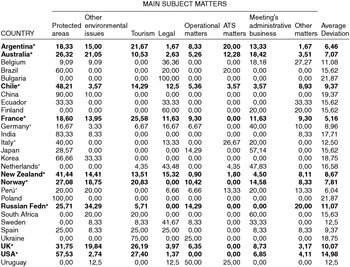
Table 1 shows the percentage of WPs devoted to each category of content for each CP, expressed as a fraction of their totals. The final column to the right expresses the average deviation (∑ deviation of each category / no. of categories) of their percentages.
Main subject matters approached by parties in the WPs submitted to ATCMs during the period 1998–2011. In bold, countries belonging to the ‘G7+2’. Those CPs marked with a * have presented, on average, more than one WP per year in the period 1998–2011 (see table 4 for each country's total no. of WPs)

The results from Table 1 show that for the ‘G7+2’, environmental (including protected areas and other environmental related matters) and tourism issues constitute the most important source for papers. With some specific exceptions, during the considered period, this group seems to have more consistently worked around these issues, which roughly account for 60–90% of their WPs in such a period.
Matters connected to protected areas are particularly significant for those countries involved in the designation of numerous protected areas (including Antarctic Specially Protected Areas, or ASPAs; Antarctic Specially Managed Areas, or ASMAs, and Historic Sites and Monuments, or HSMs). For countries like the United States, United Kingdom, Australia, New Zealand and Chile, which altogether are among the proponents of nearly two thirds of all protected areas (including more than 80% of all ASPAs), this is a top issue, which stands for more than 25% in all cases, and up to nearly 60% of the WPs submitted between 1998 and 2011. As the protocol requires proponent parties to present a review of the corresponding protected areas’ management plans every five years, countries such as the United States, the United Kingdom or Australia are to submit, on average, two or three WPs per year, only to fulfil this requirement.
Tourism-related WPs constitute 20–30% of all WPs submitted to ATCMs for the United States, France, United Kingdom, Argentina and Norway between 1998 and 2011. All these countries have tour operators and/or vessels which have conducted Antarctic operations under their supervision during that period, most notably the United States. However, other countries which are also responsible for tour operators/vessels, like Chile, Australia, Germany, Netherlands and the Russian Federation seem to have placed relatively less emphasis on tourism. However, it should be noted that for some of these countries the evolution of this topic through time has not been uniform and that many tourist ships are flagged by countries not signatory to the Antarctic Treaty, such as Panamá, Barbados, Bahamas, Malta and Liberia.
During the period in question, debates on legal matters were mostly connected to discussions on issues of liability arising from environmental emergencies, which finalised in 2005 with the adoption of a sixth annex to the protocol on this topic; and to matters of biological prospecting, which addresses the use of biological and genetic resources of Antarctic organisms for commercial purposes. Debates on bioprospecting started in 1999 and are still taking place in the ATCMs. The Netherlands and Sweden, with more than 40% of their production of WPs devoted to these matters, seem to have placed a particular focus on such legal issues. The relatively lower number of WPs on operational matters may reflect the fact that these issues are more in-depth considered in other Antarctic operational fora, such as COMNAP.
Most papers concerning the Antarctic Treaty Secretariat came from a limited number of parties and had to do with its establishment, a process that eventually concluded in 2004. After that point, this issue was restricted to matters related to its functioning. It is not surprising that Argentina, host of the secretariat, has therefore had a considerable fraction of its WP totals devoted to this matter. Finally, it seems that administrative issues particularly attracted countries like Japan, Netherlands and Germany, which, during the 1998–2011 period, have devoted 40% or more of their WP production efforts to them.
An interesting result of this table is how countries have distributed their interests throughout this wide range of thematic issues. Among the most active countries, France, Argentina, Australia and Norway seem to have more equally distributed their efforts in all categories (holding the lowest values of average deviation). On the other hand, India, the Netherlands, Japan and the United States are the countries with the most unequal distribution (highest values of average deviation). These results imply that the former might have been quite equally concerned on all aspects of ATCM's agendas, while the latter might have had more specific areas of interest.
The fact that some countries have placed more emphasis on certain matters is likely to reflect either a particular national interest, or specific capabilities on such matters (or both). For instance, it is not surprising that the Netherlands, a country with a strong tradition in international law, has mainly focused on legal, administrative and institutional issues, which represent more than 90% of its WP totals. Added to this, the fact that the Netherlands do not operate stations in Antarctica provides it with room to place its focus on other non-operational issues. Similarly, the high number of protected areas proposed to be designated as such by the United States, plus the number of Antarctic tour operators under its supervision, are factors that may explain why these issues stand for almost 85% of its WPs. Further information on working papers (and also information papers) submitted under CEP agenda items between 1998 and 2006, can be found in Sánchez and McIvor (Reference Sánchez and McIvor2007).
It should be noted that an analysis of WP contents, such as the one presented here, says little about its actual effects. Given that debates over certain WPs may eventually lead to new regulation (or to changes in existing regulation), some WPs may turn out to be more influential than others. Therefore, production of WPs, including the issues they address, does not seem to be a useful indicator to measure what their actual impacts were, either on the way ATCMs work, or on the way national programmes carry out their activities in Antarctica.
WPs authorship
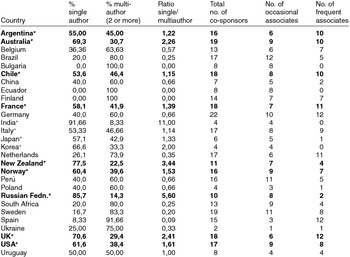
Firstly, it is important to note that the number of WPs submitted jointly by two or more countries has steadily increased from 1998 to 2011. While in 1998 only 7% of the total WPs tabled at XXII ATCM/CEP I were presented by more than one party, in 2011 this fraction has risen to nearly 25%. Generally speaking, this reflects the fact that parties are gradually engaging in a more cooperative strategy. It can reasonably be argued that such a strategy aims to show the meetings that the proposals contained in a given WP are, at the time of its presentation, stronger due to its higher level of support, given the higher number of parties endorsing the paper. In this sense, parties seem to acknowledge that this new modus operandi, which now appears to be followed by most of them, could be a more efficient approach to submit proposals to the meetings. Such an assumption, however, may not always prove to be that effective, and other parties seem to feel that keeping a proposal on their own field is still important. Therefore they prefer to work in a more isolated manner. Table 2 shows the results of the analysis of WPs’ authorship for the 1998–2011 period.
Analysis of WPs’ authorship for the period 1998–2011, in terms of single/multiauthorship and number of total, frequent and occasional co-sponsors. In bold, countries belonging to the ‘G7+2’. Those CPs marked with a * have ratios single authorship / multiple authorship > 1.

Table 2 shows that the ‘G7 + 2’ nations have tabled more WPs on their own than in partnership (ratios single/multiauthor >1). Notwithstanding this general trend, some of these seem to be more prone to co-work than others: Chile, Argentina and France are among the most cooperative ones (ratios single/multiauthor between 1 and 1,5), followed by Norway and United States (ratios single/multiauthor between 1,5 and 2,0). For New Zealand and the Russian Federation a much stronger preference for a more isolated work tends to prevail (ratios single/multiauthor above 3,0). Among the newer members, there is a general trend towards partnership (ratios single/multiauthor <1). For instance, Bulgaria, Ecuador and Finland have never submitted a WP as a single author, and Spain and Sweden tend to work almost exclusively in partnership (more than 80% of all their WPs in coauthorship). However, some of the newer members, like India and, to a lesser extent, Korea and Italy show opposite behaviour.
Among the ‘G7 + 2’ the number of parties with which they have co-sponsored papers remains quite stable around 16 and 19, except for New Zealand and the Russian Federation (11 and 10, respectively). If those parties with which coauthorship has occurred only once or twice (which can be considered occasional associations) are removed, the number of each CP partnerships keeps around 7–12, with the exceptions of New Zealand and the Russian Federation. These countries have kept frequent associations with 4 and 2 countries, respectively, a fact that reinforces their preference for individual work and signals an even higher selectivity to choose partners. Interestingly, in most cases that group of 7–12 countries corresponds to the same ‘G7 + 2’ nations. That is, when looking for likely co-authorships, this group of countries tends to associate with each other more often. This should not be that surprising: as Ruzicka and Wheeler (Reference Ruzicka and Wheeler2010) pointed out, in an international agreement trust is inevitably weak in the beginning, but it can grow stronger through a range of practices, including an increased exchange of reliable information, greater acceptance of interdependence, and confidence in others living up to mutual agreements (Ruzicka and Wheeler Reference Ruzicka and Wheeler2010). So the ‘G7+2’ nations, perhaps due to the sensitive issue of sovereignty claims, had actually a stronger basis to build up such trusting relationships over time. Notwithstanding this, other geographical and cultural associations can also be observed, like, for instance, amongst the western European countries, the Latin American nations and also amongst most of the English speaking countries (mostly United Kingdom, Australia, New Zealand and the United States). Finally, Asian and eastern European countries exhibit the lowest number of frequent partners (0-2), which seems to reveal that finding associates in this game is still difficult for them. On the operational field, some of these associations have given way to the establishment of cooperation agreements, such as the meeting of Latin-American Managers of National Antarctic Programs (Reunión de Administradores de Programas Antárticos Latinoamericanos, RAPAL), an Asian science and logistics group which meets regularly to discuss common interests (Asian Forum for Polar Sciences, AFoPS), and the framework of a mutual understanding on which Scandinavian countries share logistic resources to assist Antarctic scientific activities (Sánchez Reference Sánchez2007).
Parties’ proactivity in presenting issues for intersessional debate
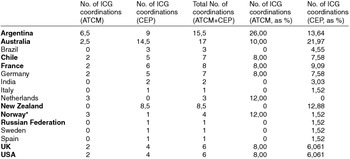
The number of intersessional activities coordinated by each CP is depicted in Table 3. Each coordination counts as 1. When an intersessional activity has been coordinated by two parties, it counts as 0,5 each. When such activities extended to a second intersessional period, each period counts as 1.
Analysis of CP's intersessional activities for the period 1998–1999/2011–2012, in terms of each country's number of coordinations of intersessional activities (CPs having coordinated no intersessional activities have been omitted. In bold, countries belonging to the ‘G7+2’.

This analysis includes only those intersessional activities the convenor of which acted on behalf of his/her country of nationality, noting that during the considered period a number of intersessional activities have been coordinated by the Antarctic Treaty Secretariat, the CEP Chair or SCAR; while one of them was a non-coordinated activity.
Data from Table 3 indicate that ‘G7+2’ nations (except for the Russian Federation) have coordinated, in the aggregate, an 80% of all ICGs ever, both in ATCM and CEP arenas. It is also noteworthy that only 8 (out of 28) countries have presented matters for intersessional debate at both the ATCM/CEP, and that 7 of such countries belong to the ‘G7+2’ group (all but the Russian Federation and New Zealand).
In general terms, Australia and Argentina, followed by New Zealand and France, have been the most proactive countries in taking matters for debate. If only the ATCM is considered, then Argentina, followed by Netherlands and Norway, has coordinated the highest number of ICGs. When the coordination of CEP intersessional activities are analysed, it was Australia, followed by Argentina and New Zealand, that were the most proactive countries presenting issues for intersessional discussion.
It should be noted, however, that, as CEP's intersessional activities more than doubled those at the ATCMs, this analysis may be rather biased towards the CEP. In addition, some 50% of the CEP intersessional activities were related to the presentation of revised draft management plans of Antarctic protected areas and draft CEE projects, which are associated to protocol's requirements. Therefore additional care should be exercised when taking such presentations directly as a measure of proactivity, as they were not primarily intended to either bring a new issue for debate or to add new elements/visions to an ongoing discussion within the CEP. However, if such coordinations of intersessional work were not taken into account, the general results observed would not substantially change.
Parties’ emphasis on ATCM/CEP arenas
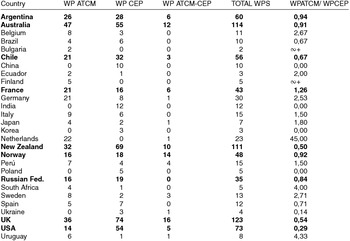
Table 4 shows the results of comparing the number of WPs submitted to either the ATCM or the CEP meeting for the period 1998–2011.
Analysis of CP's patterns of participation between the ATCM and CEP, in terms of submission of WPs for the period 1998–2011. In bold, countries belonging to the ‘G7+2’.

Prior to comparing the emphasis put by each CP on either arena, Table 4 allows definition, in absolute terms, of the level of participation in relation to WP submission of each CP.
Thus, results from Table 4 show that members of the ‘G7+2’ are, together with Germany (the second oldest of the non-original signatory parties to reach consultative status in March 1981), the only countries who have presented, on average, more than two WPs per year during the period 1998–2011. The remaining countries have scarcely presented an average of less than one WP a year, with the exception of the Netherlands, Italy and Perú.
In reference to the ratio between ATCM/CEP WPs, the United States and New Zealand show a clear preference for the CEP (ratios <0,5), followed by the United Kingdom, and Chile (ratios between 0.5 and 0,75). Australia, Norway and Argentina (ratios around 0.90 and 1.00) seem to work equally in both fora, while for France and Germany the tendency is towards the ATCM (ratios between 1.25 and 2.50).
For the remaining (non ‘G7+2’) countries, Germany, Italy and Japan, and most noticeably the Netherlands, have consistently directed more efforts in presenting WPs to the ATCM than to the CEP, while India and China have presented WPs exclusively to the CEP.
Size of national delegations
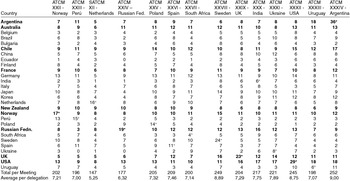
The average number of national delegates per delegation attending ATCMs during 1998–2011 varied from a minimum of 5.25 delegates (XII SATCM, The Hague, 2000) to a maximum of 9.00 delegates (XXXIV ATCM, Buenos Aires, 2011), but it tended to remain quite stable around 7 to 8 delegates (see Table 5).
Evolution of national delegation size for the period 1998/2011. In bold, countries belonging to the ‘G7+2’. Those cells marked with a * correspond to host countries.

The most numerous ATCM delegations have been those of the ‘G7+2’ nations, which have attended ATCMs with an average from 8.4 to 13.8 delegates. Only Germany and Japan (10.7 and 9.2 delegates, respectively) mix within this group, while China, Korea and Sweden show averages higher than 7 delegates per meeting. Not only does this significant presence speaks of a clear and sustained interest of these countries on Antarctic issues, but also of their preference to rely on a more specific advice on a variety of issues, even though the risk of a lower level of internal coordination might grow higher with an increasing number of delegates.
It should be underlined that on occasions, the number of delegates attending an ATCM may be influenced by its location, particularly if the meeting is held at home. During the considered period, five ATCMs were organised by ‘G7+2’ nations: Norway (1998), Russian Federation (2001), United Kingdom (2006), United States (2009) and Argentina (2011). Thus, the size of the host's national delegation is normally much larger than usual. Similarly, when an ATCM is held close to home, the size of delegations tends to grow higher as well. For instance, some South American national delegations were larger than usual in 2010–2011, as ATCMs were held in Uruguay and Argentina, respectively. The same applies to Scandinavian countries when they organised the meeting in 1998 (Norway) and 2005 (Sweden).
Notwithstanding this ‘location factor’, while for some ‘G7+2’ nations the number of delegates has showed no very significant changes during the considered period (especially for New Zealand and France), for some others an increasing trend can be identified. In particular, as of 2005–2006 the size of UK and US delegations seem to have stabilized some 50% above previous figures. Similarly, the Australian delegation seems to have slowly increased from 1998 to 2011. For these countries, such trends constitute a signal that their way of participation in ATCMs has changed (or is changing), although the likely reasons behind this are beyond the scope of this study, and should therefore be the subject of dedicated future research.
Other ways of participation
Alternative ways of participating in ATCMs, more oriented to exert influence on the ATCM system, also exist, apart from those already described. For instance, parties seem to exert influence by attempting to cover positions within the ATCM structure. In particular, they seem to do so in the CEP, which is the only ATCM body whose authorities are chosen, including the chance of being re-elected, for periods exceeding the meeting's duration, so their functions are exerted during the intersessional periods too.
When the powers and responsibilities of the CEP chair are considered, his/her possibilities to exert influence become clearer. Thus, according to rule 16 of the CEP rules of procedure, the CEP chair is entitled to convene, open, preside at and close each meeting of the committee; make rulings on points of order raised at each meeting of the committee; approve a provisional agenda for the meeting; present the report on each meeting of the committee to the ATCM; and represent the committee in other fora as agreed by the committee, among others.
The four chairs the CEP has had during the considered period (1998–1999, 2011–2012), as well as seven out of its nine vice-chairs, came from a subset of the ‘G7+2’ nations (Australia, Argentina, Chile, France, New Zealand, Norway and United States). Such an over-representation seems to be an indication that the coverage of the CEP authorities’ positions is particularly important for these countries.
Likely factors behind the results observed
The results of this work show that diverse patterns of CP's participation within the ATCMs exist, which have given way to an asymmetric system, in which the level of engagement of the ‘G7+2’ nations clearly differentiates from that of the remaining CPs. This might be associated to a prevalence of their sovereignty interests over Antarctica. Thus, claimant countries (plus those which reserve rights to make claims in the future) may feel a more compelling mandate to keep the ATCM system running, and to stay active in the game.
However, it may not only have to do with sovereignty interests (for example claimants versus non-claimants), but also with commercial interests (fishing and tourism, among others). For instance, commercial interests were arguably the main driving force that may explain why the number of CPs grew significantly during the 1980s, where what would eventually become the Convention on the Regulation of Antarctic Mineral Resource Activities (CRAMRA) was discussed (Orheim and others Reference Orheim, Pressand, Gilbert, Berkman, Lang, Walton and Young2011).
The interest on specific issues can also be related to the specific capabilities CPs have available at home. Therefore, not all CPs may be playing the same game. Some CPs may voluntarily choose not to actively participate in the decision making process, and prefer to focus their Antarctic efforts exclusively on, for example, science. The scientific interest in Antarctica is increasing due to the obvious importance of this area of the world in understanding global processes, so the scientific community is increasingly demanding more access to Antarctica (Sánchez and Njaastad Reference Sánchez, Njaastad, Tin, Liggett, Maher and Lamers2014). Authors like Dastidar (Reference Dastidar2007) and Dudeney and Walton Reference Dudeney and Walton2012) have illustrated aspects of the CPs’ scientific performance in Antarctica, so their work might contribute to shed light on this issue.
This study also shows that ‘G7+2’ nations tend to behave, generally speaking, in a rather endogamic way, in which partners seem to be primarily chosen from members of the same subset of countries. Geopolitical, geographic and cultural factors may be used to explain these associations. However, if these results are analysed through time, it seems that, on one side, a trend towards more cooperation between more active and less active members is slowly evolving; and, on the other side, newer members are steadily becoming more involved in the system.
Other factors can also help to understand the reasons why the patterns of participation among CPs considerably differ. The number of institutions involved in Antarctic activities in each CP may contribute to determine its level of participation. For instance, the presence of centralised Antarctic agencies might favour participation in ATCMs. As the elaboration of proposals (which are to be eventually presented as working papers) often require permanent contact and consultation among interdisciplinary technical and political staff, those CPs devoid of such a central coordination would be in a less favourable position to engage in such activities than those which do have it at home. Not surprisingly, most of the ‘G7+2’ countries (all but the United States) have Antarctic or polar devoted institutions with a long history dealing with Antarctic issues.
Last, but not least, language is a factor that may determine parties’ participation. In ATCMs, all interventions are simultaneously translated to the four official languages (English, French, Spanish and Russian). Those countries at which these languages are not spoken are at a disadvantage, particularly Asian countries who do not even share the same alphabets. Even for French, Spanish and Russian speaking countries the situation can on occasions be disadvantageous. It is a common practice at ATCMs to derive some issues from the plenary to small informal contact groups on the margins of the meeting to speed up a solution to likely conflicts. These contact groups work without exception in English. Intersessionally, all non-English speaking countries are again at a disadvantageous position, as these debates are held exclusively in this language. So, this may constitute a structural constraint for those non-English speaking CPs (and, inherently, an advantage for English speaking countries) at the time of proposing interssesional debates.
Although some of the above mentioned factors can, to a lesser or larger extent, be useful to explain CPs’ patterns of participation, some of the likely explanations provided should therefore be empirically demonstrated and tested by further studies.
Conclusions and final remarks
Based on the results of this work, it can be concluded that in the period 1998–2011 the so called ‘7+2’ group have consistently and actively engaged in ATCM's issues and activities, thus exerting the greatest political influence on these fora. In practice, this group can be seen as the main ‘propellers’ of the ATCM system. This does not necessarily imply that members of this group work consistently towards similar directions. Although their points of view may be coincident in some issues, they may greatly differ in others. Particular contexts associated to specific issues may on occasions lead parties to take divergent positions, or encourage competitive behaviours. Associations therefore change over time, depending on the matters addressed.
Notwithstanding this, some of the not so new players are actually learning to play the game of Antarctic policy-making, and their performance is becoming increasingly consistent, on occasions even more so than that of some of the original claimant countries. Likewise, those CPs less involved in this system may still find it difficult to be incorporated into this game as active players, or may have simply chosen to play the Antarctic game in other arenas, like science.
The way that influence is exerted may greatly vary between different actors. CPs choose certain issues on which they may have more interests/expertise over others; participate either proactively or reactively; engage in more or less cooperative ways; prefer to associate to certain partners and not to others; select particular areas for cooperation; decide on the arenas where their working efforts will be maximized (CEP versus ATCMs) and so forth. On occasions, such preferences are more clearly evident for some CPs than for others, and thus their patterns of participation, which might be more or less consistent over time, can be more or less identifiable.
These patterns of participation can be explained using a number of factors, with different methods and at various levels. Intervening factors can be of geopolitical, institutional, cultural, economic and structural nature. Qualitative and quantitative methods (or any combination of them) can be used to study these patterns of participation, although each of their results can reveal slightly different situations. Finally, a given pattern can be analysed at the national, organisational, and even personal levels (although the amount of information needed to do so increases in this sequence), and each level would add for understanding different aspects of such a pattern of participation.
These different patterns of participation have so far resulted in a rather asymmetric and endogamic system. So, the question that stems from this would be: are the most active countries in the ATCM currently working towards leveling the playing field? Whether these patterns of behaviour might in the future help to make the system more symmetric and less endogamic, a goal that could ultimately be expected in a system that works based on the principle of consensus, is therefore a question open for debate, and an interesting subject for future studies.
Some further aspects of CPs patterns of participation and their effects on the treaty system certainly remain yet to be unveiled, and would deserve a deeper focus on them. An in-depth analysis of the WPs submitted by countries to the ATCM/CEP meetings, and their consequences on the Antarctic regulatory framework, as well as on the progress of human activities in the continent could turn out to be a very good complement to the present article. Likewise, studying the effects of the size, composition and changes in national delegations to the ATCM/CEP meetings on CPs’ behaviours would also add very valuable information. Finally, it would also be useful to compare the results of this study, in terms of how CPs have participated in ATCMs, to those of the previous period, since the treaty's signature. Taking into account that the use of internet as a platform for discussion and the establishment of the CEP have dramatically changed the way parties interacted in ATCMs, a comparison between these two periods would constitute a very challenging task for those interested to approach such an analysis in future studies.
The evolution of these and other aspects over time, particularly for the most influential actors, would contribute to build up a more consistent framework that may allow for a greater understanding of how different countries are playing the Antarctic policy making game.
Understanding of countries’ patterns of participation in Antarctic policy making constitutes a key mechanism that may contribute to explain how the game of ATCMs unfolds through time. It is an important element that may help understand the course of Antarctic policies events and foresee probable future directions of this very particular system of joint administration.
Acknowledgements
I thank José María Acero, Pilar Bueno, Máximo Gowland, Mariana Heredia, Fausto López Crozet, Jerónimo López Martínez, Cristian Lorenzo and Patricia Ortúzar for their valuable comments on this article, and Magdalena Cornejo for her assistance with statistics and graphs. The comments of anonymous reviewers are gratefully acknowledged. This study was a result of the final work of the author on the M.A. degree in Public Policies of the Universidad Torcuato Di Tella (Buenos Aires, Argentina), which was generously funded by the Instituto Nacional de la Administración Pública (INAP), and the Fondo Permanente de Capacitación y Recalificación Laboral (FOPECAP), Jefatura de Gabinete de Ministros de la República Argentina.