





1. Introduction
Low-temperature plasmas are a prototypical class of non-equilibrium plasmas that can generate abundant reactive species and strong physicochemical effects near room temperature, enabling key advances in semiconductor manufacturing (Primc Reference Primc2022; Graves et al. Reference Graves2024; Oehrlein et al. Reference Oehrlein2024). By modifying surfaces while largely preserving bulk substrate properties, they support anisotropic etching and well-controlled thin-film deposition in integrated-circuit fabrication (Profijt et al. Reference Profijt, Potts, Van De Sanden and Kessels2011; Baklanov et al. Reference Baklanov, De Marneffe, Shamiryan, Urbanowicz, Shi, Rakhimova, Huang and Ho2013; Donnelly & Kornblit Reference Donnelly and Kornblit2013; Kanarik et al. Reference Kanarik, Lill, Hudson, Sriraman, Tan, Marks, Vahedi and Gottscho2015). Among low-temperature plasma sources, radio-frequency capacitively coupled plasmas (RF-CCPs) are widely used in both semiconductor processing and complex plasma experiments due to their simple geometry and straightforward controllability (Czarnetzki et al. Reference Czarnetzki, Schulze, Schüngel and Donkó2011).
As feature sizes shrink and wafer/chip dimensions increase, increasingly stringent requirements are placed on plasma density, ion energy and spatial uniformity. Conventional single-electrode, single-frequency CCP operation is constrained by coupled control of ion energy and ion flux, radial non-uniformity and high-frequency electromagnetic effects (Lee et al. Reference Lee, Manuilenko, Babaeva, Kim and Shon2005; Howling, Sansonnens & Hollenstein Reference Howling, Sansonnens and Hollenstein2007; Liu et al. Reference Liu, Zhang, Bogaerts and Wang2015). Superimposing low- and high-frequency RF voltages (dual-/multi-frequency operation) can partially decouple ion flux from ion energy and improve axial and radial uniformity via waveform tailoring and phase control (Korolov et al. Reference Korolov, Donkó, Czarnetzki and Schulze2012; Lafleur et al. Reference Lafleur, Delattre, Johnson and Booth2012; Gao et al. Reference Gao, Zhang, Zhao and Wang2014; Schüngel et al. Reference Schüngel, Donkó, Hartmann, Derzsi, Korolov and Schulze2015). Bi et al. (Reference Bi, Liu, Jiang, Xu and Wang2011) noted that the high-frequency component predominantly sets the plasma density, whereas the low-frequency component primarily modulates the sheath voltage and hence the ion energy distribution. Wilczek et al. (Reference Wilczek, Schulze, Brinkmann, Donkó, Trieschmann and Mussenbrock2020) synthesised particle simulations with analytical modelling to clarify electron-heating and power-deposition mechanisms in low-pressure CCP, providing a theoretical basis for electron kinetics in multi-frequency, multi-electrode configurations.
Dust particles are a major source of physical contamination in semiconductor manufacturing (Noh, Kim & Oh Reference Noh, Kim and Oh2010; Lee & Yook Reference Lee and Yook2015). Laser-scattering measurements show that particles often levitate and cluster near the sheath edge, with their distributions governed by the discharge potential structure (Kamataki et al. Reference Kamataki2022; Xu et al. Reference Xu, Du, Khrapak, Ding, Yang, Shi and Zhang2025). Because sheath fields can change abruptly during voltage modulation or plasma shut down, previously equilibrated particles may rapidly relocate and deposit onto wafers; contamination therefore tends to occur during process transitions (Chaubey & Goree Reference Chaubey and Goree2024). In situ particle monitoring and temperature-compensated quartz crystal microbalance measurements track particle-number variations and deposited mass, enabling quantitative contamination-risk assessment (Song et al. Reference Song, Choi, Oh, Kim and Yun2019; Stadlmayr et al. Reference Stadlmayr, Szabo, Biber, Koslowski, Kadletz, Cupak, Wilhelm, Schmid, Linsmeier and Aumayr2020). Geometry and waveform tailoring further enable active particle control, e.g. travelling-wave sheaths driven by segmented electrodes (Li et al. Reference Li, Konopka, Jiang, Shimizu, Höfner, Thomas and Morfill2009) and phase-locked dual-frequency excitation exploiting the electrical asymmetry effect to tune direct-current self-bias and sheath-voltage sharing (Iwashita et al. Reference Iwashita, Uchida, Schulze, Schüngel, Hartmann, Shiratani, Donkó and Czarnetzki2012), thereby reducing shut-down fall out and power-cycling re-suspension.
When particulate contamination occurs in processing plasmas, particles do not behave as passive tracers: they rapidly acquire a large negative charge, interact with the sheath potential and can levitate and self-organise collectively. Such particle–plasma systems are commonly referred to as complex (dusty) plasmas, comprising micrometre-sized particles immersed in a background of electrons, ions and neutrals. In RF discharges, the particles levitate under the combined action of gravity, electrostatic forces, ion drag and neutral drag, forming a dust cloud (Morfill & Ivlev Reference Morfill and Ivlev2009). Depending on the coupling strength and confinement conditions, complex plasmas can form plasma crystals exhibiting a melting and defect dynamics (Bonitz, Henning & Block Reference Bonitz, Henning and Block2010; Durniak et al. Reference Durniak, Samsonov, Ralph, Zhdanov and Morfill2013), while stable confinement often yields a central dust void (Khrapak et al. Reference Khrapak2016; Schwabe et al. Reference Schwabe, Du, Huber, Lipaev, Molotkov, Naumkin, Zhdanov, Zhukhovitskii, Fortov and Thomas2018). Dust vortices, shear flows and externally controlled transport have also been reported (Choudhary Reference Choudhary2025). Studied in RF-CCP experiments on the ground and in microgravity (e.g. on the International Space Station), complex plasmas provide an ‘atomic analogue’ for phase transitions and transport in strongly coupled soft matter (Chaudhuri et al. Reference Chaudhuri, Ivlev, Khrapak, Thomas and Morfill2011).
Most experimental studies of complex plasmas rely on single-frequency CCP, where electrode design and discharge-parameter control are used to tune dust-cloud morphology, void structure and particle transport. For instance, Deng et al. (Reference Deng, Huang, Zhang, Zhang and Song2025) showed that pressure and RF power strongly affect a bowl-shaped dust cloud and its void, and attributed the collective behaviour to the axial–radial force balance (electrostatic force, ion drag, gravity, etc.); He et al. (Reference He, Ai, Dai, Song, Wang, Sun, Liu and Feng2020) demonstrated unidirectional ratchet transport using a serrated electrode and identified non-equilibrium ion drag and sheath-potential asymmetry as key to rectification; and Lisin et al. (Reference Lisin, Petrov, Sametov, Vaulina, Statsenko, Vasiliev, Carmona-Reyes and Hyde2020) used a gaseous electronics conference RF reference cell with high-speed imaging to quantify particle forces and the dynamics across discharge conditions. In dual-frequency CCP, Schleitzer, Schneider & Kersten (Reference Schleitzer, Schneider and Kersten2021) used microparticles as probes to investigate how phase-controlled excitation modifies sheath width, particle levitation height and the electric-field force in the sheath. More recently, Wang et al. (Reference Wang, Yang, Huang, Li, Zhang, Liu and Du2026) employed a self-consistent two-dimensional fluid model to examine dust-cloud spatial distribution and discharge-structure evolution in dual-frequency discharges. However, there are still few experimental studies on particle behaviour in dual-frequency CCP.
Building on this background, we study a complex RF-CCP in argon at a pressure of 20 Pa operated in push–pull mode. The discharge is symmetrically driven either at 27.12 MHz or simultaneously at 2 and 27.12 MHz. This frequency pair was selected because its frequency ratio exceeds 10, which favours separation between plasma-density control and sheath-voltage modulation in dual-frequency CCPs (Sharma & Turner Reference Sharma and Turner2013), and similar 2 and 27 MHz combinations have been used in industrial Lam etching systems (Bhatnagar et al. Reference Bhatnagar, Panda, Edleman, Allen, Wise and Mahorowala2007; Meng et al. Reference Meng, Li, He, Luo, Li, Zhao and Yan2014). Using two-dimensional (2-D) non-intrusive optical-emission spectroscopy coupled with a collisional–radiative model (OES-CRM) diagnostics, we map electron density and electron temperature over driving voltages and frequencies and benchmark the measurements against a geometry-matched 2-D particle-in-cell/Monte Carlo collisions (PIC/MCC) model.
2. Experimental set-up, diagnostics and plasma simulation
2.1. Experimental set-up
Figure 1 schematically illustrates the complex CCP apparatus operated in push–pull mode and the 2-D diagnostic arrangement. The plasmas are generated between two parallel circular stainless steel electrodes with an electrode spacing of 60 mm, and four observation ports are symmetrically distributed around the chamber. From the centre outward, the circular electrode assembly comprises a 10 mm diameter quartz-glass insert (reserved for future laser manipulation and having the same thickness as the electrodes), an 80 mm diameter powered electrode, a polytetrafluoroethylene insulating ring (80 mm inner diameter, 90 mm outer diameter) and an outer grounded electrode (90 mm inner diameter, 138 mm outer diameter). The grounded electrode and the chamber sidewall are electrically grounded, with an annular gap of ∼1 mm between them to facilitate gas flow. Argon is introduced through the lower inlet, diffuses into the chamber via the annular gap and is subsequently exhausted through the lower outlet by a vacuum pumping system, thereby minimising gas-flow-induced perturbations to the dust particles. Two RF supply chains are employed, providing 2 and 27.12 MHz, respectively. Each RF output is independently matched by its corresponding matching box, and the matched outputs are then combined via a passive power combiner to preserve individual channel matching and reduce cross-coupling before being applied to the powered electrode, while the upper and lower electrodes are wired symmetrically. The SiO2 particles (3.9 µm in diameter) are injected via a sidewall-mounted dispenser. A 660 nm laser is shaped into a sheet to illuminate a 2-D cross-section of the dust cloud.
(a) Schematic of the experimental set-up; (b) top view of the electrode structure.

2.2. Diagnostics
This work employs a non-intrusive optical diagnostic based on OES-CRM to obtain 2-D distributions of electron density and electron temperature (Wu et al. Reference Wu, Zheng, Wang, Cao, Zhou, Zhang and Huang2021). A fibre-optic spectrometer is used to measure the absolute emission-line intensities at the discharge centre for the Ar 2p2→1s5 transition (696.5 nm) and the 2p1→1s2 transition (750.4 nm). These absolute intensities serve as references for calibrating the CCD-based 2-D emission measurements.
Two-dimensional distributions are reconstructed from CCD images of the axial r–z cross-section. Bandpass interference filters (central wavelengths 694.3 and 750.0 nm; bandwidth ≈ 10 nm) are alternately placed in front of the camera to record narrowband emission near 696.5 and 750.4 nm. Because of the 10 nm bandwidth, the 750.4 nm channel contains a 751.5 nm contribution; after CCD-spectrometer calibration, this contribution is negligible and is ignored (Cao et al. Reference Cao, Wang, Xu, Dai and Huang2025). After optimising exposure time and subtracting the dark field, relative-intensity maps are obtained for both lines. A small region near the discharge centre is used to match the mean grey level to the spectrometer-measured absolute intensity, yielding calibration factors that convert full-field CCD images into absolute emission-intensity maps. These absolute line intensities are then input to the argon collisional–radiative model (Wu et al. Reference Wu, Zheng, Wang, Cao, Zhou, Zhang and Huang2021), and the steady-state rate equations are solved at each grid point to derive electron density n e (r, z) and electron temperature T e (r, z). Given the compact reactor geometry, the line-integrated OES-CRM results can reasonably reflect the plasma spatial distribution, and this treatment is consistent with optical-emission diagnostics commonly used in CCP studies (Schulze et al. Reference Schulze, Schüngel, Donkó, Luggenhölscher and Czarnetzki2010; Horváth et al. Reference Horváth, Derzsi, Schulze, Korolov, Hartmann and Donkó2020; Liu et al. Reference Liu, Schüngel, Korolov, Donkó, Wang and Schulze2016).
Dust-cloud images are acquired with a bandpass-filtered CCD camera. A 660 nm laser is injected through a side viewing port, and the camera is placed at the adjacent port with its optical axis slightly above the lower electrode. The images are processed with a Python routine to obtain the mean levitation height of the lowest particle layer, the dust-layer thickness and the void diameter under different experimental conditions.
2.3. The PIC/MCC method
To cross-validate the experimental diagnostics and provide background plasma fields for the dust-force analysis, an electrostatic axisymmetric two-dimensional spatial and three-dimensional velocity (2D3V) PIC/MCC model matched to the experimental geometry and driving conditions is used (Wang, Jiang & Wang Reference Wang, Jiang and Wang2010; Chen et al. Reference Chen, Wang, Yu, Wang, Chen, Jiang, Schulze and Zhang2024). The model follows the standard PIC/MCC framework commonly used for low-pressure RF-CCP simulations and is conceptually close to the PIC/MCC model for dual-frequency CCP described by Georgieva & Bogaerts (Reference Georgieva and Bogaerts2006). The MCC collision probabilities and post-collision velocity sampling are based on standard particle-collision probability theory (Nanbu Reference Nanbu2000). The 2D3V notation indicates that the model is two-dimensional in configuration space, with the spatial coordinates solved in the cylindrical r–z plane, and three-dimensional in velocity space, with all three velocity components retained for electrons and Ar+ ions.
Electrons and Ar+ ions are represented by kinetic superparticles, while neutral Ar is treated as a spatially uniform background gas at 300 K. The computational domain is discretised in the r–z plane with a grid spacing of approximately 0.3114 mm, and the time step is 2 × 10⁻¹⁰ s. The plasma dynamics is advanced using an implicit electrostatic PIC/MCC scheme, with the fields and particle motion solved self-consistently at each time step. Charged particles reaching solid boundaries are absorbed. Electron–neutral and ion–neutral collisions are treated by the Monte Carlo collision method, including e–Ar elastic scattering, excitation and ionisation and Ar+–Ar momentum-transfer and charge-exchange collisions.
The 27.12 MHz voltage in the single-frequency cases and the superposed 27.12 and 2 MHz voltages in the dual-frequency cases are imposed as time-dependent electrode boundary conditions, with the same push–pull phase relation as in the experiment. The field and particle motion are solved self-consistently at each time step. Within the electrostatic approximation, this treatment allows the model to describe the 27.12 MHz sheath oscillation, the 2 MHz sheath modulation and the nonlinear sheath response induced by the superposed voltage components.
The model adopts an electrostatic approximation and therefore does not resolve electromagnetic wave effects, including standing-wave and skin effects. Such effects are mainly relevant in large-area CCP operated at frequencies substantially higher than those used here; for example, standing-wave effects have been reported in large-area reactors at 60 MHz and become more pronounced at 81.36 MHz, while modelling studies often consider frequencies up to approximately 200 MHz (Liu et al. Reference Liu, Zhang, Bogaerts and Wang2015). For markedly non-axisymmetric 3-D structures, the axisymmetric 2-D approximation may introduce some uncertainty.
3. Results and discussion
3.1. Two-dimensional plasma diagnostics and simulation
3.1.1. Plasma characteristics under single-frequency push–pull excitation
This subsection examines how the RF voltage affects the discharge structure and the 2-D plasma-parameter distributions in a single-frequency (27.12 MHz) CCP operated in push–pull mode. We focus on axial electron density and electron temperature and on how their 2-D profiles change with RF voltage. The gas pressure is fixed at 20 Pa. In figure 2, r and z denote the radial and axial coordinates, with the upper and lower electrodes at z = 6 cm and z = 0 cm, respectively.
Two-dimensional distributions of (a)-(b) the measured intensities of Ar emission lines at 750.4 and 696.5 nm, (c) n e and (d) T e obtained from the collisional–radiative model and (e) n e and (f) T e obtained from PIC/MCC simulations. Discharge conditions: single-frequency (27.12 MHz) push–pull excitation, V = 40 V, p = 20 Pa.

Figure 2(a–b) shows the 2-D relative-intensity maps of the 696.5 and 750.4 nm lines. Two continuous high-intensity bands appear near the lower and upper electrodes (z ≈ 0.6 and 5.4 cm), while the intensity is much weaker in the central region. As the line intensity reflects excitation, this pattern suggests that excitation (and thus ionisation) is localised near the sheath–bulk boundary. Figure 2(c–d) shows the measured 2-D distributions of electron density and electron temperature, both displaying a symmetric double-peaked pattern. Electron density peaks axially near the sheath–bulk boundary and decreases toward the discharge centre; the peak value also drops radially toward the sidewall, consistent with stronger wall losses in the edge region. Electron temperature is elevated near the sheaths, decreases into the bulk and remains relatively uniform across it. Radially, it is also fairly uniform, with a slight edge increase due to locally strengthened fields and enhanced electron heating.
In the α mode, most of the RF voltage drops across the sheaths, so electron heating is concentrated near the sheath regions. Energetic electrons generated there enhance ionisation near the sheath–bulk boundary, leading to peaks in electron density and electron temperature, whereas energy deposition in the central bulk is much weaker. Only a fraction of sheath-expansion electrons penetrate into the bulk; the rest lose energy via ionisation/excitation collisions or become trapped, so few electrons exceed the ionisation threshold in the centre. The resulting low central ionisation rate explains why electron temperature (z = 1.0–5.0 cm) and electron density (z = 1.5–4.5 cm) are much lower there than near the sheath–bulk boundary.
Figure 2(e–f) shows the 2-D electron-density and electron-temperature distributions from PIC/MCC simulations. Along the axial direction, the simulated profiles agree well with the experiments and display the same symmetric double-peaked structure, with the main differences confined to the sheath-boundary regions. In the electron-density map, the simulations resolve distinct sheath regions (z ≈ 0–0.5 and 5.5–6.0 cm) and place the density maxima at z ≈ 1.1 and 4.9 cm; in the experimentally reconstructed map, the sheath region is less evident and the peak positions (z ≈ 0.6 and 5.4 cm) appear closer to the electrodes. In the electron-temperature map, the simulated peak region is narrower in the axial direction (0.3 cm) than that obtained experimentally (0.6 cm). These differences likely reflect electrode reflections and camera viewing-geometry effects in the CCD line-intensity measurements.
To quantify the effect of RF voltage on axial uniformity, figure 3 shows the on-axis (r = 0 cm) profiles of electron density and electron temperature for RF voltages of 40, 80, 150 and 200 V. The lower and upper electrodes are located at z = 0 and z = 6.0 cm, respectively, and all other conditions match those in figure 2. At all voltages, the axial profiles of electron density and electron temperature show a symmetric double-peaked shape. Increasing the voltage from 40 to 200 V markedly raises the central electron density and improves axial uniformity, implying that sheath-oscillation-generated energetic electrons penetrate more effectively into the bulk and enhance central ionisation/excitation. Meanwhile, the electron-temperature peak-to-valley difference increases from ∼0.6 to ∼2.0 eV and the overall electron temperature rises, consistent with energy deposition remaining concentrated near the sheath boundaries. In contrast, the electron temperature at the discharge centre increases more slowly because the bulk electric field is weaker and direct heating is limited.
Experimentally diagnosed axial profiles of (a) n e and (b) T e . Discharge conditions: single-frequency (27.12 MHz) push–pull excitation; voltages of 40, 80, 150 and 200 V; p = 20 Pa.

Compared with conventional CCP results (Jiang et al. Reference Jiang, Wang, Zhao and Wang2009; Wu et al. Reference Wu, Xiao, Wang, Huang and Dai2022), the present push–pull-driven discharge exhibits similar spatial patterns in emission-line intensity and electron temperature, but a markedly different 2-D electron-density distribution. The electron density exhibits a symmetric double-peaked structure near the plasma–sheath interfaces at both electrodes. This behaviour is associated with the relatively large electrode gap under the present discharge conditions. In Ar capacitive RF discharges, the electrode gap has been shown to affect electron heating and the electron energy distribution function (You et al. Reference You, Kim, Kim, Seong, Shin and Chang2007). In the present 60 mm-gap discharge, the sheath-localised heating discussed above leads to stronger ionisation/excitation near the two sheath–bulk interfaces than in the central bulk. In addition, unlike asymmetric CCP with one powered and one grounded electrode where the density maximum often shifts toward the powered side, the present reactor produces a highly symmetric density profile.
3.1.2. Plasma characteristics under dual-frequency push–pull excitation
This subsection examines how the 2 MHz RF voltage affects the 2-D distributions of Ar emission-line intensity, electron density and electron temperature in a dual-frequency CCP operated in push–pull mode. Hereafter, in the present dual-frequency cases, the abbreviations LF and HF denote the lower-frequency 2 MHz component and the higher-frequency 27.12 MHz component, respectively. The gas pressure is fixed at 20 Pa, the HF voltage is held at 40 V and the push–pull phase relationship is maintained for the same-frequency components between the two electrodes.
As the 696.5 and 750.4 nm Ar emission lines show similar spatial variations with LF voltage, only the 750.4 nm relative-intensity map is presented here. Both line intensities are used as inputs to the collisional–radiative model to calculate ne and Te , following the method of Wu et al. (Reference Wu, Zheng, Wang, Cao, Zhou, Zhang and Huang2021). In figure 4, the LF voltage increases from 60 to 300 to 400 V from left to right; from top to bottom, each column shows the 2-D distributions of the 750.4 nm line intensity, electron density and electron temperature. At 2 MHz, 60 V, the discharge is still dominated by the 27.12 MHz component, so electron density and electron temperature remain symmetric and double peaked, as in figure 2. The peak line intensity is slightly reduced, likely because the added the 2 MHz source suppresses high-frequency sheath-expansion excitation (Lieberman & Lichtenberg Reference Lieberman and Lichtenberg2010).
Two-dimensional distributions of (a-c) the measured intensity of the Ar 750.4 nm emission line and the diagnostically reconstructed (d)-(f) n e and (g)-(i) T e . Discharge conditions: dual-frequency push–pull excitation; HF voltage is fixed at 40 V; LF voltage increases from left to right as 60, 300 and 400 V; p = 20 Pa.

With the LF voltage raised to 300 and 400 V, all three 2-D distributions become more uniform. The line-intensity peak zone broadens and its peak-to-valley contrast decreases. Electron density increases in the bulk, reducing the peak-to-valley difference; at 400 V the near-electrode double peaks vanish and the distribution becomes clearly more uniform. Electron temperature rises slightly overall, and while the double-peaked structure persists, the high-temperature region extends gradually into the bulk. These changes can be attributed to sheath evolution induced by the increased LF voltage (Lieberman & Lichtenberg Reference Lieberman and Lichtenberg2005). A higher sheath voltage and a thicker sheath allow energetic electrons to be transported more readily toward the bulk centre, thereby increasing the electron density in the bulk plasma and enhancing collisional excitation.
To assess the effect of LF voltage on axial uniformity, figure 5 shows the centreline (r = 0 cm) axial profiles of electron density and electron temperature at LF voltages of 60, 200, 300 and 400 V. The remaining discharge conditions match those in figure 4. As shown in figure 5(a), for LF voltages below 300 V the axial electron density retains the symmetric double-peaked shape of the 27.12 MHz-dominated regime, whereas above 300 V it becomes relatively flat. With increasing LF voltage, the density near the sheath–bulk boundaries changes little, while the bulk density increases markedly. The increase is strongest near the discharge centre and continues until the bulk density approaches that near the sheath boundary. This trend reflects the combined roles of sheath evolution and enhanced electron transport, as discussed above. Figure 5(b) shows the axial electron-temperature profiles. The profiles are fairly uniform for all LF voltages. As LF voltage increases, the electric field strengthens in the sheaths, and electron temperature increases monotonically throughout the discharge.
Axial profiles of n e and T e in the dual-frequency (2 and 27.12 MHz) discharge. Discharge conditions: dual-frequency push–pull excitation; HF voltage is fixed at 40 V; LF voltage is 60, 200, 300 and 400 V; p = 20 Pa.

Figure 6 shows the 2-D electron-density and electron-temperature distributions from PIC/MCC simulations with the HF voltage fixed at 40 V and the LF voltage increasing from 60 to 150 to 300 V. At 60 V, the electron-density map in figure 6(a) remains double peaked, but the axial peak separation is smaller than in the single-frequency 27.12 MHz case (figure 2 e). At 150 V, the double-peak region in figure 6(b) moves toward the centre, the peak density decreases slightly and the sheath thickens slightly. At 300 V, the electron density in figure 6(c) becomes bulk uniform with a slightly centre-high profile and the sheath becomes markedly thicker. In the bulk region, the simulated evolution under dual-frequency excitation agrees well with the experimental trends and with the single- versus dual-frequency comparison.
Two-dimensional distributions of (a)–(c) n e and (d)–(f) T e obtained from PIC/MCC simulations. Discharge conditions: dual-frequency push–pull excitation; HF voltage is fixed at 40 V; LF voltage increases from left to right as 60, 150 and 300 V; p = 20 Pa.

Figure 6(d–f) shows that the electron temperature is fairly uniform in the bulk-plasma region both axially and radially. With increasing 2 MHz voltage, the profile changes from a symmetric double-peaked pattern to a bulk-uniform one, because a thicker sheath facilitates energetic-electron transport toward the bulk centre. Relative to figure 4, the simulations reproduce the experimental axial trends of electron density and electron temperature with 2 MHz voltage. Electron density changes from a symmetric double-peaked profile to a ‘bulk-uniform with a slightly centre-high’ pattern, while electron temperature becomes bulk uniform. The simulated transition range (150–300 V) is narrower than the experimental range (300–400 V), mainly because the measured voltage reflects the power-supply output rather than the true discharge voltage; losses in the matching network and external circuitry reduce the effective voltage applied to the plasma. Other discrepancies are similar to those noted in § 3.1.1.
3.2. Dust-cloud diagnostics and force analysis
After micrometre-sized dust particles are introduced into an RF-CCP discharge, they collect electrons, become negatively charged and form an observable dust cloud under the combined effects of gravity, electrostatic forces, ion drag, thermophoresis and neutral damping near the sheaths (Morfill & Ivlev Reference Morfill and Ivlev2009). For cases with a symmetric double-peaked plasma-parameter distribution, 3.9 µm SiO2 particles are introduced, and the resulting dust-cloud morphology is quantified from side-view images. To compare the dust-cloud characteristics across conditions, three quantities are defined: (i) the mean levitation heights of the top and bottom layers, h high and h low, measured from the lower electrode; (ii) the dust-layer thickness, Δh = h high − h low; and (iii) the void diameter, D void, defined as the equivalent side-view diameter of the nearly particle-free region inside the dust cloud.
In addition to diagnosing the dust-cloud morphology from the side-view images, the PIC/MCC simulation results were used to calculate the electric force
 $F_{e}$
and ion-drag force
 $F_{iD}$
acting on the particles in the vertical direction. It should be noted that the present PIC/MCC simulations are dust free and do not include electron/ion absorption by dust particles, dust space charge, dust charging feedback or the back reaction of dust on the RF sheath dynamics. Therefore, the simulation results are used only as dust-free background plasma parameters for a first-order estimate of the electric and ion-drag forces. Considering that the 3.9 μm SiO2 particles used in this work are mainly suspended near the sheath boundary above the lower electrode, rather than filling the entire bulk-plasma region, the back reaction of dust on the overall plasma parameters is expected to be limited (Killer et al. Reference Killer, Wegner, Melzer and Meichsner2015). It should be noted that h
low is used only as an approximate indicator of the lowest stable levitation region, rather than as the exact equilibrium position of an isolated particle. Interparticle interactions may affect the exact boundary position, but the present force-balance calculation is intended only as a reference estimate under the single-particle approximation.
To make estimates simple, we take into account that the particles are levitated in the (pre)sheath area of the discharge. This region is characterised by a strong superthermal ion flow towards the electrode. According to the Bohm criterion the ion drift velocity satisfies
 $u \gt c_{s}$
at the sheath edge, where
 $c_{s}=\sqrt{T_{e}/m_{i}}$
is the ion sound velocity, and
 $m_i$
is ion mass. Since
 $T_{e}\gg T_{i}$
in our discharge, near-sonic ions imply highly superthermal ions,
 $u\gg v_{Ti}$
, where
 $v_{Ti}=\sqrt{T_{i}/m_{i}}$
is the ion thermal velocity. In these conditions particle charging is affected by ion flow effects and potentially by ion–neutral collisions. The effective ion–neutral collision frequency is estimated as
 $\gamma _{\textit{eff}}=10^{7}$
s–1 using a practical expression proposed by Khrapak (Reference Khrapak2013). The ion collisionality index (Khrapak et al. Reference Khrapak, Thoma, Chaudhuri, Morfill, Zobnin, Usachev, Petrov and Fortov2013) is then estimated from
 \begin{align} \omega _{c}=\frac{a\,\gamma _{\textit{eff}}}{c_{s}}\approx 7.5\times 10^{-3}, \end{align}
where
 $T_{e}\,\approx \,3$
eV has been assumed, and
 $a$
is dust particle radius. At such low collisionality, ion–neutral collisions only marginally affect the particle charge for near-sonic ion flows (see figure 3 in Khrapak et al. Reference Khrapak, Thoma, Chaudhuri, Morfill, Zobnin, Usachev, Petrov and Fortov2013). In quasi-isotropic bulk-plasma conditions the effect of ion–neutral collisions would be more pronounced, but we do not consider this situation here. Combining the orbital motion limited expression for electrons
 \begin{align} J_{e}=\sqrt{8\pi }\,a^{2}n_{e}\left(\frac{T_{e}}{m_{e}}\right)^{1/2}\exp (-z)\end{align}
and flow-dominated expression for collisionless ions (Fortov et al. Reference Fortov, Ivlev, Khrapak, Khrapak and Morfill2005)
 \begin{align} J_{i}=\pi a^{2}n_{i}\left(\frac{T_{e}}{m_{i}}\right)^{1/2}\frac{M^{2}+2z}{M}. \end{align}
This yields a transcendental equation for the reduced particle charge
 $z= Ze^{2}/aT_{e}$
 \begin{align} z=\ln \left[\frac{n_{e}}{n_{i}}\left(\frac{8m_{i}}{{\pi}\kern-0.7pt{m}_{e}}\right)^{1/2}\frac{M}{M^{2}+2z}\right]\!, \end{align}
where
 $M=u/c_{s}$
is the ion Mach number.
For the ion-drag force, the fact that ions are highly superthermal also simplifies consideration. For highly superthermal collisionless ions, binary collision approach yields for the scattering contribution (collection contribution can normally be neglected except the ion flow velocity is extremely high, Khrapak et al. Reference Khrapak, Ivlev, Zhdanov and Morfill2005)
 \begin{align} F_{iD}=4\pi a^{2}n_{i}T_{e}\frac{z^{2}}{M^{2}}\Lambda, \end{align}
where
 $\Lambda$
is the Coulomb logarithm. For superthermal ions we can take
 $\Lambda =\ln (\lambda _{De}/a)$
in the first approximation (Khrapak et al. Reference Khrapak, Ivlev, Zhdanov and Morfill2005), where
 $\lambda _{De}=\sqrt{T_{e}/4\pi e^{2}n_{e}}$
is the electron Debye radius and a is the particle radius. The ion–neutral collisions can also affect the magnitude of the ion-drag force (Ivlev Reference Ivlev, Khrapak, Zhdanov, Morfill and Joyce2004a
,Reference Ivlev, Zhdanov, Khrapak and Morfill
b
; Hutchinson & Haakonsen Reference Hutchinson and Haakonsen2013; Schwabe & Graves Reference Schwabe and Graves2013). We have estimated the collisional correction factor F suggested by Hutchinson & Haakonsen (Reference Hutchinson and Haakonsen2013). It turns out that
 $F\gtrsim 1$
for the drift regime (ions are drifting in an external force field) and
 $F\lesssim 1$
for the shift regime (ions have shifted Maxwellian distribution). Since the deviation from unity is not large in both cases, we find it appropriate to neglect the effect of ion–neutral collisions for the present purpose.
3.2.1. Dust-cloud characteristics under single-frequency push–pull excitation
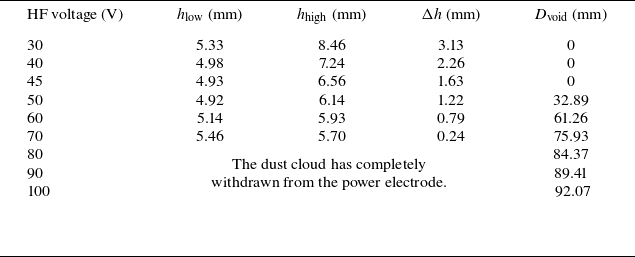
Figure 7 shows how the dust-cloud configuration evolves in the single-frequency (27.12 MHz) case as the RF voltage increases from 30 to 100 V, with the extracted quantities summarised in table 1. Statistics for h low, h high and Δh are computed using only the region above the powered electrode, whereas D void is evaluated over an extended region that also includes the area above the grounded electrode. Table 1 highlights three features: (i) h low varies only weakly, with a mean of 5.13 mm; (ii) Δh decreases monotonically from 3.13 mm at 30 V to 0.24 mm at 70 V; and (iii) a dust void appears only above a threshold voltage, after which D void increases rapidly with voltage.
Summary of dust-cloud characteristic parameters for single-frequency 27.12 MHz operation.

Table 1. Long description
A table summarizing dust-cloud characteristic parameters for single-frequency 27.12 MHz operation. The table has five columns and ten rows, including the header row. The columns are labeled as follows: HF voltage (V), hlow (mm), hhigh (mm), Δh (mm), and Dvoid (mm). The rows present data for HF voltages ranging from 30 V to 100 V. Row 1: HF voltage (V), 30; hlow (mm), 5.33; hhigh (mm), 8.46; Δh (mm), 3.13; Dvoid (mm), 0. Row 2: HF voltage (V), 40; hlow (mm), 4.98; hhigh (mm), 7.24; Δh (mm), 2.26; Dvoid (mm), 0. Row 3: HF voltage (V), 45; hlow (mm), 4.93; hhigh (mm), 6.56; Δh (mm), 1.63; Dvoid (mm), 0. Row 4: HF voltage (V), 50; hlow (mm), 4.92; hhigh (mm), 6.14; Δh (mm), 1.22; Dvoid (mm), 32.89. Row 5: HF voltage (V), 60; hlow (mm), 5.14; hhigh (mm), 5.93; Δh (mm), 0.79; Dvoid (mm), 61.26. Row 6: HF voltage (V), 70; hlow (mm), 5.46; hhigh (mm), 5.70; Δh (mm), 0.24; Dvoid (mm), 75.93. Row 7: HF voltage (V), 80; hlow (mm), not applicable; hhigh (mm), not applicable; Δh (mm), not applicable; Dvoid (mm), 84.37. The dust cloud has completely withdrawn from the power electrode. Row 8: HF voltage (V), 90; hlow (mm), not applicable; hhigh (mm), not applicable; Δh (mm), not applicable; Dvoid (mm), 89.41. Row 9: HF voltage (V), 100; hlow (mm), not applicable; hhigh (mm), not applicable; Δh (mm), not applicable; Dvoid (mm), 92.07. The table highlights three features: (i) hlow varies only weakly, with a mean of 5.13 mm; (ii) Δh decreases monotonically from 3.13 mm at 30 V to 0.24 mm at 70 V; and (iii) a dust void appears only above a threshold voltage, after which Dvoid increases rapidly with voltage.
Side-view image of the dust cloud. The glass insert, insulating ring and electrode symmetry axis are indicated by the blue horizontal, yellow and blue vertical dashed lines, respectively. The electrodes are outlined by white solid lines. Discharge conditions: single-frequency (27.12 MHz) push–pull excitation at p = 20 Pa.

The mean levitation height of the lowest layer, h low, is affected by the vertical force balance, including the sheath electric field, dust charging, gravity and ion flow. The sheath field provides upward electrostatic support; the dust charge depends on local plasma parameters (electron density and temperature) and thus on RF voltage; and ion flow accelerated in the sheath contributes ion drag that shifts the equilibrium position. Gravity is a steady downward force, while neutral damping mainly affects relaxation and does not set the steady levitation height. In single-frequency 27.12 MHz operation, h low typically lies in a region of strong sheath-field gradient that acts as a stable potential well, so deviations are countered by a restoring force from electrostatic and ion-drag contributions. As shown in table 1, h low changes only within a limited range before the dust cloud completely withdraws from the powered-electrode region, although a slight upward tendency can still be observed.
As the 27.12 MHz voltage increases, the sheath-field gradient strengthens, providing stronger vertical confinement and compressing the cloud. Meanwhile, discharge intensification increases ion drag; because ion drag varies with height, particles accumulate within a narrower equilibrium interval where gravity, electrostatic forces and ion-drag balance more readily, leading to a smaller Δh.
A dust void forms when outward ion drag overwhelms inward electrostatic confinement within the dust cloud, expelling particles from the centre. Increasing RF voltage strengthens the discharge, raising ion density and drift velocity and thereby increasing ion drag. At 27.12 MHz, a void appears when the voltage reaches 50 V, indicating that the ion-drag force exceeds the confining electrostatic force, and expands as the discharge voltage is further increased.
Figure 8 shows the negative charge, which a particle with the diameter of 3.9 µm acquires in the sheath region (not necessarily in the equilibrium position), calculated using (3.4) with the plasma parameters obtained from the PIC/MCC simulations. Going from the presheath to the vicinity of the electrode, the charge value first increases in absolute magnitude due to the increase in the ion Mach number M. It then decreases as M increases further and, in addition, as the electron-to-ion density ratio decreases owing to the formation of positive space charge in the sheath. This result also provides hints how the charge varies if a particle oscillates in the sheath (Ivlev, Konopka & Morfill Reference Ivlev, Konopka and Morfill2000) or how the charge is distributed in a monodisperse particle cloud with a certain volume (electron depletion not considered).
Two-dimensional spatial distributions of the particle charge Q near the lower-electrode sheath region in the r–z plane under single-frequency 27.12 MHz push–pull excitation. The plotted region is 0 < r < 45 mm, 0 < z < 6.5 mm. The red and green dashed segments indicate the particle equilibrium z-positions above the electrode and insulating ring, respectively (also see figure 9 for details).

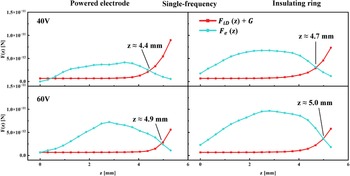
Vertical force balance acting on particles at different positions in the single-frequency discharge.

Figure 9 shows the height dependence of the vertical electrostatic force,
 $F_{e}(z)$
, and the combined force
 $F_{iD}(z)+G$
, i.e. the sum of the vertical ion-drag force and gravity, for particles at different positions in the single-frequency discharge at 27.12 MHz, based on the PIC/MCC simulation results. The voltages are 40 and 60 V from top to bottom, while the other conditions are identical to those used in the experiment. A height is taken as the particle equilibrium position when
 $F_{e}(z)$
equals
 $F_{iD}(z)+G$
, with
 $F_{e}(z)$
dominating below that point and
 $F_{iD}(z)+G$
dominating above it. Two positions are considered in the calculation: the region near the central glass insert on the powered electrode and the insulating ring outside the powered electrode; here, z denotes the distance from the lower electrode.
Above the powered electrode, the particle equilibrium height is 4.4 mm at 40 V and rises to 4.9 mm at 60 V, i.e. by 0.5 mm, in good agreement with the experimental results presented above. By contrast, above the insulating ring, the equilibrium position is higher than that above the powered electrode under both voltage conditions, which explains the arched dust-cloud structure observed experimentally. Moreover, the force gradient on either side of the equilibrium point is markedly lower above the insulating ring than above the powered electrode, indicating that the dust-cloud thickness, Δh, is larger in this region, again consistent with the experimental observations.
We also evaluated the horizontal force components acting on particles at the equilibrium height. The radial ion-drag force and the radial electrostatic force both remain close to zero and exhibit only small fluctuations, without showing a distinct monotonic outward trend. It should be noted that their magnitudes are only of the order of 10−2 of the vertical force components. Numerical uncertainties from grid discretisation, field interpolation, time averaging and local fluctuations may be comparable to these weak forces.
Side-view image of the dust cloud. Discharge conditions: dual-frequency push–pull excitation; HF voltage is fixed at 40 V; LF voltage is 40, 50, 60 and 100 V; p = 20 Pa.

3.2.2. Dust-cloud characteristics under dual-frequency push–pull excitation
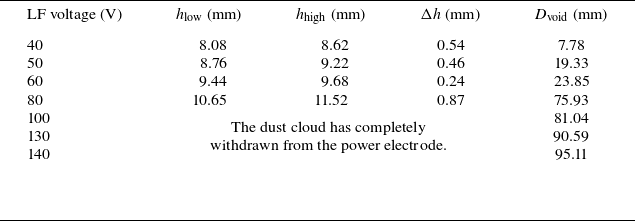
In dual-frequency RF-CCP operation, the 2 MHz component increases the sheath-voltage amplitude, leading to a higher h low than in the single-frequency case, and modifies the ion energy distribution, thereby changing ion-flow-driven drag on the dust as shown in figure 10. With increasing LF voltage, higher ion density and flow velocity enhance ion drag and strengthen outward dust expulsion. As a result, a void can form at a lower HF voltage; when LF reaches 60–80 V, the void expands rapidly and particles migrate beyond the powered-electrode region as shown in table 2.
Summary of dust-cloud characteristic parameters for dual-frequency discharge.

Table 2. Long description
A table summarizing dust-cloud characteristic parameters for dual-frequency discharge. The table has five columns and six rows, including the header row. The columns are labeled as follows: LF voltage (V), h_low (mm), h_high (mm), Δh (mm), and D_void (mm). The rows present the following data: Row 1: LF voltage (V), 40; h_low (mm), 8.08; h_high (mm), 8.62; Δh (mm), 0.54; D_void (mm), 7.78. Row 2: LF voltage (V), 50; h_low (mm), 8.76; h_high (mm), 9.22; Δh (mm), 0.46; D_void (mm), 19.33. Row 3: LF voltage (V), 60; h_low (mm), 9.44; h_high (mm), 9.68; Δh (mm), 0.24; D_void (mm), 23.85. Row 4: LF voltage (V), 80; h_low (mm), 10.65; h_high (mm), 11.52; Δh (mm), 0.87; D_void (mm), 75.93. Row 5: LF voltage (V), 100; h_low (mm), 81.04; h_high (mm), The dust cloud has completely withdrawn from the power electrode.; Δh (mm), ; D_void (mm), . Row 6: LF voltage (V), 130; h_low (mm), 90.59; h_high (mm), ; Δh (mm), ; D_void (mm), . Row 7: LF voltage (V), 140; h_low (mm), 95.11; h_high (mm), ; Δh (mm), ; D_void (mm), .
Two-dimensional spatial distributions of the particle charge Q near the lower-electrode sheath region in the r–z plane under dual-frequency push–pull excitation. The plotted region is 0 < r < 45 mm, 0 < z < 8.1 mm. The red and green dashed segments indicate the particle equilibrium z-positions above the electrode and insulating ring, respectively (also see figure 12 for details).

Figures 11 and 12 show calculations of the dual-frequency case with the 27.12 MHz high-frequency voltage fixed at 40 V and the 2 MHz voltage increasing from 40 to 60 V. The equilibrium height of the particles above the powered electrode shown in figure 12 increases from 6.4 to 7.3 mm, and that above the insulating ring increases from 6.8 to 7.9 mm. In comparison with the single-frequency discharge, the equilibrium heights are higher in the dual-frequency case. This trend agrees well with the experimental results and further supports the reliability of the experimental observations.
Vertical force balance acting on particles at different positions in the dual-frequency discharge.

4. Conclusions
This study combines 2-D OES-CRM diagnostics with geometry-matched 2-D PIC/MCC simulations to investigate an argon RF-CCP operated in push–pull mode at 20 Pa, under both single-frequency (27.12 MHz) and dual-frequency (2 MHz and 27.12 MHz) excitation.
In single-frequency operation, n e and T e exhibit symmetric double peaks near the sheath–bulk interfaces and a pronounced minimum in the central bulk. This behaviour is attributed to the relatively large electrode spacing, which causes most of the RF voltage to drop across the sheaths and concentrates power deposition and electron heating near the sheath regions, thereby limiting the transport of energetic electrons into the bulk centre. As the 27.12 MHz voltage increases, n e rises throughout the discharge and the central depletion weakens, whereas T e increases mainly near the sheath edges. The PIC/MCC simulations reproduce these trends, with discrepancies largely confined to sheath-adjacent regions, mainly due to electrode reflections and viewing-geometry effects in the CCD-based 2-D emission measurements.
In dual-frequency operation, with the 27.12 MHz voltage fixed at 40 V, increasing the 2 MHz voltage thickens the sheaths and enhances energetic-electron transport into the bulk. As a result, n e evolves toward a bulk-uniform, slightly centre-high profile, and the high-T e region extends inward from the sheaths. The PIC/MCC simulation also reproduced these trends, with the difference in transition voltage primarily attributed to the matching network and external circuit losses in the experiment.
After injecting 3.9 µm diameter SiO2 particles, the levitation height at the bottom of the dust cloud stays near 5 mm and remains stable under single-frequency excitation; the dust cloud compresses, and a void forms only above a threshold voltage before expanding rapidly. Under dual-frequency excitation, by contrast, voids appear at lower voltages, the levitation height increases with LF voltage, and the void diameter grows stepwise, eventually expelling particles from the powered-electrode region. Overall, dual-frequency push–pull operation enables effective control over plasma spatial uniformity and dust-cloud structure.
Acknowledgements
The author used ChatGPT (versions 5.2–5.4) during the period from 5 January 2026 to 9 March 2026 to assist in the translation and linguistic polishing of the manuscript. All scientific content, interpretation and final wording remain the responsibility of the authors.
Editor Edward Thomas, Jr. thanks the referees for their advice in evaluating this article.
Funding
The work is supported by the National Key R&D Program of China (No. 2025YFF0512000) and the National Natural Science Foundation of China (Nos. 12575212 and 12035003).
Declaration of interests
The authors report no conflict of interest.







 Open access

