INTRODUCTION
Rapid urbanization and population surge, especially in the developing world, has led to increasing food demand and subsequent cultivation of arable lands in and around cities. Urban and peri-urban vegetable production is a common practice that has received a lot of attention in the past decade with regard to food production under critical water-scarce semi-arid conditions of sub-Saharan West Africa (Barry, Reference Barry, Sally and Abernethy2002). In many developing regions of West Africa, urban cultivation is found on fallow land in cities either under a legal contract or on free land, situated along the course of city drainage canals or waterways (Drechsel et al., Reference Drechsel, Graefe, Sonou and Cofie2006). These sites and plots serve to intensively cultivate vegetables, thus providing employment opportunities to the urban dwellers (De Bon et al., Reference De Bon, Parrot and Moustier2010; Drechsel and Dongus, Reference Drechsel and Dongus2010). Reports show that urban and peri-urban agriculture (UPA) meet the urban demand for fresh vegetables by 10–90% and up to 70% of meat and 100% of poultry products (Cofie et al., Reference Cofie, Veenhuizen and Drechsel2003; Smith, Reference Smith2001), and highlighted its contribution to sustainable urban food supply. In view of the continuous growth of urban population and the economic benefits it offers, UPA will remain an important activity to support the livelihood of the urban poor farmer (Danso et al., Reference Danso, Drechsel, Wiafe-Antwi and Gyiele2002; Gyiele, Reference Gyiele2002).
Most of the UPA vegetable systems make use of urban resources such as labour, waste and wastewater, and operate in areas where access to proper waste disposal is minimal. Many cities are characterized by unchecked disposal of municipal and industrial wastes into urban rivers or streams, which raise concerns of food safety when this water is used for cultivation. In many West African cities, this wastewater serves as the main source of water for irrigation (Keraita et al., Reference Keraita, Drechsel, Huibers and Raschid-Sally2002), and as nutrient inputs to crops and vegetables, in addition to other sources of nutrients.
Despite the externalities associated with the UPA practice of wastewater irrigation (Abdu et al., Reference Abdu, Agbenin and Buerkert2010; Binns et al., Reference Binns, Maconachie and Tanko2003; Drechsel et al., Reference Drechsel, Keraita, Amoah, Abaidoo, Raschid-Sally and Bahri2008), a significant amount of nutrients is applied to crops and serves a cost-efficient method for the urban cultivators in crop production. For Kumasi, Ghana, Keraita et al., (Reference Keraita, Drechsel, Huibers and Raschid-Sally2002) reported yearly nutrient inputs from water amounting to 10–200 kg nitrogen (N), 130–300 kg phosphorus (P) and 240–470 kg potassium (K) per hectare of irrigated land. Similarly, in Pakistan yearly nutrient inputs of 864 kg N ha−1, 86 kg P ha−1 and 363 kg K ha−1 were reported by Van der Hoek et al., (Reference Van der Hoek, Ul Hassan, Ensink, Feenstra, Raschid-Sally, Munir, Aslam, Ali, Hussain and Matsuno2002) through wastewater irrigation. In a recent study, wastewater irrigation accounted for inputs of 2427 kg N ha−1, 376 kg P ha−1 and 1439 kg K ha−1 in the urban vegetable gardens of Niamey, Niger (Diogo et al., Reference Diogo, Buerkert and Schlecht2010). Ensink et al. (Reference Ensink, Van der Hoek, Matsuno, Munir and Aslam2002) stressed the win-win situation of wastewater use by urban farmers and city officials of Pakistan with respective benefits from nutrient supply for vegetable cultivation and a levy of US$3.50 ha−1 yr−1 charged to use such water. Intensification in UPA gardening will continue in order to increase production per unit area of scarce land (Lynch et al., Reference Lynch, Binns and Olofin2001). This is also driven by the increased demand for food and vegetables from the pressure of urbanization. High nutrient inputs to UPA gardening activities may create an imbalance in the soil-crop system (Diogo et al., Reference Diogo, Buerkert and Schlecht2010; Douxchamps et al., Reference Douxchamps, Humbert, Van der Hoek, Mena, Bernasconi, Schmidt, Rao, Frossard and Oberson2010; Mishima et al., Reference Mishima, Endo and Kohyama2010; Pathak et al., Reference Pathak, Mohanty, Jain and Bhatia2010; Wang et al., Reference Wang, Huang, Shi, Darilek, Yu, Sun, Zhao, Chang and Öborn2008) and thus, pose a potential threat to the environment through leaching and volatilization.
Nutrient balance studies (partial and full) have gained widespread application in the study of farming systems and either cover all components of the farm (Abdulkadir et al., Reference Abdulkadir, Leffelaar, Agbenin and Giller2013; Van Den Bosch et al., Reference Van Den Bosch, Gitari, Ogaro, Maobe and Vlaming1998) or sub-systems within a farm (Brouwer and Powell, Reference Brouwer and Powell1998; Diogo et al., Reference Diogo, Buerkert and Schlecht2010; Ramakrishna et al., Reference Ramakrishna, Win, Rego, Wani and Hla2004). Nutrient balance studies have been applied at different scales that range from plot-level to country and continental scales (Pathak et al., Reference Pathak, Mohanty, Jain and Bhatia2010; Smaling and Braun, Reference Smaling and Braun1996; Stoorvogel and Smaling, Reference Stoorvogel and Smaling1990). Nutrient balances, especially at the farm level, have been used to assess on-farm nutrient management (Öborn et al., Reference Öborn, Edwards, Witter, Oenema, Ivarsson, Withers, Nilsson and Stinzing2003) and sustainability of farming systems (He et al., Reference He, Chen, Jiang, Chen and Zhang2007) through evaluation of nutrient surpluses or deficits and its implication on soil nutrient stocks. The approach accounts for element balances through differences between inputs and outputs while taking changes in the soil pool into consideration (Færge et al., Reference Færge, Magid and Penning De Vries2001; Öborn et al., Reference Öborn, Edwards, Witter, Oenema, Ivarsson, Withers, Nilsson and Stinzing2003; Oenema et al., Reference Oenema, Kros and de Vries2003). This procedure to set up balances necessitates gathering quantitative information on the nutrient flows and serves as a basis to develop policies that could be adapted for sustainable production from agronomic, economic and environmental perspectives (Mishima et al., Reference Mishima, Endo and Kohyama2010). Several models have been used to quantify nutrient budgets in agricultural lands. Færge et al., (Reference Færge, Magid and Penning De Vries2001) developed a simple static inflow/outflow model to monitor the flow of N and P in Bangkok. A toolbox called NUTMON has been popularly used for quantitative assessments of nutrient flows and economic performance of tropical farming systems (Stoorvogel and Smaling, Reference Stoorvogel and Smaling1990; van Beek et al., Reference Van Beek, Onduro, Gachimbi and De Jager2009; Van den Bosch et al., Reference Van Den Bosch, Gitari, Ogaro, Maobe and Vlaming1998). The present study used the MonQI toolbox (MonQI, 2007) to quantify flows and balances of major nutrients as well as the economic performance of small-scale urban and peri-urban vegetable gardens in three West African cities, namely Kano (Nigeria), Bobo Dioulasso (Burkina Faso) and Sikasso (Mali). The objectives of the study are to (i) quantify N, P, K fluxes in UPA gardens of the three cities, (ii) gain insight into nutrient use efficiencies (NUE) in UPA vegetable production systems, (iii) assess the economic benefits of UPA gardening and (iv) infer the rate of nutrient accumulation in the soil from the nutrient budgets.
MATERIALS AND METHODS
Study sites and farm selection
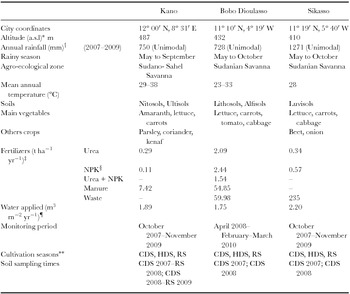
A total of 14 gardens were selected for this study across the three cities, six from Kano (Nigeria), two from Bobo Dioulasso (Burkina Faso) and six from Sikasso (Mali) (Table 1). They represent the secondary cities in each country with 3.6, 0.2 and 0.4 million inhabitants in Kano, Bobo Dioulasso (further called Bobo) and Sikasso, respectively. Gardens were selected following an initial baseline survey of UPA farmers across the three cities and followed by farm typology and characterization of identified farm types (Abdulkadir et al., Reference Abdulkadir, Dossa, Lompo, Abdu and Van Keulen2012; Dossa et al., Reference Dossa, Abdulkadir, Amadou, Sangare and Schlecht2011). Selected gardens represent vegetable production aspects of the identified farm types, which are similar in market-orientation across the three cities. A brief description of selected biophysical characteristics and fertilizer management of the UPA gardens in the three cities are given in Table 1.
Main characteristics of the selected gardens and study locations in the three West African cities.

*Above sea level.
†Rainfall record in the study years; (Sources: Bobo Dioulasso: Abdel-Rahman et al., Reference Abdel-Rahman, Seidhom, Talaat and Leopold2008).
‡Average of aggregated input of different fertilizers across all crops grown within a year.
§NPK = 15-15-15.
¶Average aggregated irrigated water applied across all crops grown within a year.
**CDS = cold dry season, HDS = hot dry season, RS = rainy.
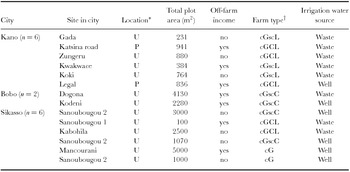
Two irrigation management systems exist within the UPA gardening systems in all three cities (Table 2). Vegetable cultivation takes place along the banks of the major river that runs through the city. The river serves as a main discharge point of domestic, municipal as well as industrial wastes (Mashi and Alhassan, Reference Mashi and Alhassan2007). Most of the gardeners are located in the urban areas and few in the peri-urban areas because of water ways. Five of the six selected gardens used wastewater for dry season irrigation and one garden used well water (Table 2). Garden areas are usually between <0.1 and 0.4 ha in Kano (Abdu et al., Reference Abdu, Abdulkadir, Agbenin and Buerkert2011), with larger garden sizes in Bobo and Sikasso (Abdulkadir et al., Reference Abdulkadir, Dossa, Lompo, Abdu and Van Keulen2012). A similar wastewater irrigation practice is found in Bobo and Sikasso, where cultivation also takes place along the rivers banks, although dug-up wells are common in the latter city. Cultivation of lettuce (Lactuca sativa L.) and carrots (Daucus carota L.) is common in all three cities, while vegetables such as cabbage (Brassica oleracea L.), amaranthus (Amaranthus caudatus L.), tomato (Lycopersicon esculentum MILL.), coriander (Coriandrum sativum L.), beet (Beta vulgaris L.), parsley (Petroselinum crispum Mill.), kenaf (Hibiscus cannabinus L.), and onion (Allium cepa L.) are specific to the cities. All the gardens selected are market-oriented from a preliminary farm typology and characterization of UPA households (Abdulkadir et al., Reference Abdulkadir, Dossa, Lompo, Abdu and Van Keulen2012; Dossa et al., Reference Dossa, Abdulkadir, Amadou, Sangare and Schlecht2011), and are representative of the two main irrigation systems in UPA vegetable production in all three cities.
Some basic information on selected garden households across 24 months monitoring period in the three West African cities.

*U = urban; P = peri-urban.
†cGscL = commercial gardening plus semi-commercial livestock keeping; cGCL = commercial gardening, field crop-livestock; cGscC = commercial gardening plus semi-commercial field cropping; cG = commercial gardening.
MonQI toolbox, data entry and quantification of nutrient flows
The study was conducted over a 2-year period in each city for different vegetable cycles. For each crop cycle, quantitative data on nutrient and cash flows were collected from regular monitoring through interviews with gardeners. Information on amounts of applied nutrients from mineral and organic sources into vegetable production per garden was collected, as well as the cost expended for each production activity. In MonQI toolbox (MonQI, 2007), imported materials include all the nutrient inputs applied to the garden plots (inflows; IN) and exported materials include all harvested products (outflows; OUT). These quantities were recorded as mineral fertilizer (IN1) and organic inputs (IN2), while harvested products were recorded as OUT1 and residues as OUT2. Monitoring and sampling took place from October 2007 to October 2009 in Kano and Sikasso, whereas it took place from April 2008 to February–March 2010 in Bobo, representing 2 study years in each city and across cultivation seasons. Vegetables were cultivated in the cold dry season (CDS) between October/November and February, in the hot dry season (HDS) between March and May, and in the rainy season (RS) between May and September. Quantities of inputs (IN1 and IN2) as well as harvested products (OUT1) and residues (OUT2) further referred to as manageable flows, were registered in farm-specific databases in the model. Atmospheric deposition from rain and dust (IN3) was calculated directly from measured nutrient content in rain and dust for Kano. Annual dust deposition was obtained by extrapolation from the map of dust distribution as 100 kg ha−1 for Sikasso and 400 kg ha−1 for Bobo, and nutrient contents were 3.8 g N, 0.79 g P and 18.7 g K kg−1 of dust (FAO, 2005). Using nutrient concentrations of 4.88 mg N, 0.63 mg P and 2.63 mg K mm−1 of rain for the latter two cities (FAO, 2005), site-specific amounts of precipitation were used to calculate nutrient inputs. Other (environmental) flows included non-symbiotic nitrogen fixation (IN4), leaching (OUT3), and volatilization (OUT4) all of which were calculated on the basis of transfer functions given by Lesschen et al. (Reference Lesschen, Stoorvogel, Smaling, Heuvelink and Veldkamp2007) and adapted by Abdulkadir et al. (Reference Abdulkadir, Leffelaar, Agbenin and Giller2013). These functions (Supplementary Appendix I, available online at http://dx.doi.org/10.1017/S0014479714000180) make use of data on soil organic matter, mineralization rate of organic matter, cation exchange capacity (CEC), exchangeable potassium, precipitation/irrigation water amounts, soil depths, etc., to estimate the respective flows. Soil erosion (OUT5) was calculated from the Universal Soil Loss Equation given by Vlaming et al. (Reference Vlaming, van den Bosch, van Wijk, de Jager, Bannink and van Keulen2001). Cash paid for garden operations, such as costs of seed, fertilizer, hired labour, and costs incurred for irrigation, pesticide application and unit cost of vegetable harvest products were entered into the model to assess economic flows following the approach of De Jager (Reference De Jager2007). Thus, prevailing market price of a unit of produced vegetables and costs of farm inputs were monitored across the different cultivation seasons. Quantities of inflows and outflows and ensuing costs were entered into the data entry module of the MonQI toolbox for each garden per city. Garden-specific soil data and nutrient contents of vegetable crops and nutrient inputs were stored in the database. In principle, nutrient contents from analysed materials were converted to quantities by multiplying these by the amount of dry matter of the materials imported to or exported from the garden in the calculation module of the software. Similarly, the unit price of each farming operation such as weeding was multiplied with total time used for that operation, while the unit price of a vegetable was multiplied by the total amounts of harvested product to obtain total amounts per operation or harvest.
Sampling of soils and crop
At the beginning of the study, soil samples were taken from five gardens in Kano, and one garden each in Bobo and Sikasso for physico-chemical analysis (Section titled Nutrient Input Sources). Each time, three replicates from three sub-plots (1–2 m2) in each garden at 0–20 cm depth were taken. Also, soil profiles were dug and sampled in five gardens in Kano to a depth of 1.5 m, and one profile each in Bobo and Sikasso, respectively (Abdu et al., Reference Abdu, Abdulkadir, Agbenin and Buerkert2011). Subsequent soil samples were collected at the beginning of each crop cycle or at harvest from the surface soil of the three sub-plots in each garden. These soil samples were pooled to form one composite sample per garden per cultivation season. However, soil samples were collected in the CDS of 2007–2008 and 2008–2009 in Bobo and Sikasso, respectively. Undisturbed soil cores at 0–20 cm were collected to determine bulk density at the initiation of the study in all three cities, according to the method of Blake and Hartge (Reference Blake, Hartge and Klute1986).
In all three cities, crops were sampled from the same garden sub-plots at each vegetable harvest. Crop sampling involved collection of 20–25 vegetable samples from the three sub-plots, and these were pooled into one sample per crop cycle to represent each harvest per garden. However, crop samples were analysed for all three replicates per harvest in Bobo gardens because of the few number of gardens involved in the study. Crop samples were separated into edible parts (leafy/root part) and non-edible parts (residues), to make up the total harvested biomass. Subsequently, fresh and dry weights were determined to calculate crop-specific dry matter.
Nutrient input sources
Information on amounts of nutrients applied with mineral fertilizers used by the farmer was derived from the applied fertilizer and its nutrient composition. Information on the type, frequency and quantity of crop-specific organic inputs such as manure and waste was also collected. Sub-samples of manure and wastes were collected and air-dried under an open-shaded surface, grinded and passed through a 2-mm sieve and kept in a clean polythene bag prior to chemical analysis. The manure and waste were subsequently analysed for N, P, K and organic carbon (OC). Samples were collected over the entire study period from the gardens studied and pooled for the different cultivation seasons.
Irrigation water sampling
Irrigation water (well and waste) were sampled for nutrient input quantification through irrigation. In Kano, wastewater was collected fortnightly (from January 2008 to March 2009) from the flowing stream adjacent to vegetable-irrigated sites in the morning and evenings to obtain representative nutrient concentrations. Similarly in Bobo, well and wastewater samples were collected once every week and pooled on a monthly basis. Two replicates of 100 ml irrigation water were collected in plastic bottles, labelled and stored in the refrigerator at freezing temperature prior to laboratory analysis. These water samples were analysed on seasonal basis. Nutrient input through waste and well water irrigation was quantified from measured concentrations of nutrients multiplied by quantities of water applied. In case of use of a watering can, information on the capacity of can, number of cans applied per plot and crop were recorded. In the case of irrigation pump, discharge rate of garden-specific pumps, duration of irrigation per application and frequency of irrigation in each vegetable crop cycle were recorded. Discharge rates of the irrigation pumps varied between 5.8 and 16 litre sec−1.
Rain water and dust collection
Rainfall data were collected from the weather station of the Institute for Agricultural Research (IAR) in Kano, while for Bobo and Sikasso, rainfall data from Farakoba Agricultural Research Station in Bobo (Abdel-Rahman et al., Reference Abdel-Rahman, Seidhom, Talaat and Leopold2008) and the Institute for Economic Research (IER) in Sikasso were used. Rain water samples were collected from every rainfall event of 2008 and 2009 in all three cities in a 100 ml bottle and stored in a refrigerator prior to chemical analysis. Dust was collected during cold dry (harmattan) periods of 2007–2008 and 2008–2009 with the aid of a dust trap. To this purpose, 0.1 m2 containers mounted on 2-m high tripod stands were installed in the studied gardens in Kano. Approximately 0.18 g of dust was collected per week from each container. Dust collection is based on methods described by Drees et al. (Reference Drees, Manu and Wilding1993) and similarly adopted by Abdu et al. (Reference Abdu, Abdulkadir, Agbenin and Buerkert2011). Extrapolated dust depositions from Harmattan distribution map of West Africa and nutrient concentrations in dust were obtained from FAO (2005), and were used to quantify nutrient inputs through dry deposition for Sikasso and Bobo. Similarly, nutrient concentrations in rain water from FAO (2005) were used to quantify N, P and K inputs to gardens in Bobo and Sikasso.
Sample preparation and chemical analysis
Soil samples were air-dried for 2–3 days, crushed and sieved through a 2-mm sieve. Crop samples were washed with tap water to get rid of adhered soil and small debris, drained of water and the fresh weights were assessed. Subsequently, they were placed in paper envelopes and oven-dried at 65 °C to a constant weight to determine the dry matter yield. Soil particle sizes were determined by the method described by Gee and Bauder (Reference Gee, Bauder and Klute1986) and bulk density was determined by the Blake and Hartge (Reference Blake, Hartge and Klute1986) method. Soil pH was measured in 1:2.5 soil to water solution with a glass electrode pH meter and CEC was determined by the silver-thiourea extraction method (Van Reeuwijk, Reference Van Reeuwijk1993). Soil OC was determined by the Walkley-Black wet oxidation method (Nelson and Sommers, Reference Nelson, Sommers and Sparks1986). For determination of total nitrogen (N), phosphorus (P) and potassium (K) in soil, water, plant and manure, samples were digested with H2SO4–salicylic acid–H2O2 with selenium as catalyst. N content was measured colorimetrically in the digest using the Bertholet reaction method (Chaney and Marbach, Reference Chaney and Marbach1962) with an N-auto-analyser (TECHNICON AAII, CA, USA) at 660 nm.
Colorimetric determination of total phosphorus (TP) was based on ascorbic acid reduction of phosphomolybdate complex described by Lowry and Lopez (Reference Lowry and Lopez1946) at 882 nm on a visible spectrometer (Van Reeuwijk, Reference Van Reeuwijk1993). Total K (TK) ion in the digest was determined with flame photometer.
Nutrient balance calculation and nutrient use efficiencies
Soil nutrient balances concern the soil-plant systems and relate to the changes between applied and extracted nutrients. Partial balances (Partbal X ) were calculated for each nutrient element (X) as the difference between nutrient input as fertilizers and output as harvested products:
 \begin{equation}
{\rm Partbal}_X = ({\rm IN}1 + {\rm IN}2) - ({\rm OUT}1 + {\rm OUT}2)\end{equation}
Full balances were calculated to include environmental flows such as IN3, IN4 and OUT3–5 together with those in the partial balance, given as:
 \begin{equation}
{\rm Fullbal}_X = \Sigma {\rm IN} - \Sigma {\rm OUT}\end{equation}
Equations (1) and (2) are an application of the law of mass conservation, where the left-hand side of the equation represents the change in soil pool with respect to the applied nutrients. A positive balance indicates that inputs exceed outputs and the reverse is the case if the balance is negative.
Nutrient use efficiency was calculated for the major elements N, P and K for the management-related flows using the partial balance method (Dobermann, Reference Dobermann2007) with components of equation (1) using:
 \begin{equation}
{\rm NUE}\;\;{\rm = }\;\;\frac{{\sum\nolimits_{i{\rm = 1}}^n {{\rm Output}_{Xi} } }}{{\sum\nolimits_{i{\rm = 1}}^n {{\rm Input}_{Xi} } }} \times 100,\end{equation}
where
Output Xi = output of nutrient X,
Input Xi = input of nutrient X, and
n = the total number of i nutrient input/output events.
In equation (3), the output accounts for nutrient (N, P, K) outflow from harvested products and their inflow as fertilizers (organic and inorganic).
Statistical analysis
For each garden, data for all the flows and balances of vegetables produced within 1 year were aggregated using Microsoft Excel pivot summation function. The data were further analysed with simple descriptive statistics across all the gardens in the three cities using SAS version 9.1 (SAS Institute, 2003). Aggregated flow variables were subjected to the Kruskal-Wallis non-parametric procedure for significant differences with city as independent variable, and means were later separated by the step-down Bonferroni multtest procedure (SAS Institute, 2003). Spearman's rank correlation was performed between all flow variables for each city using the same statistical program.
RESULTS
Nutrient and water inputs
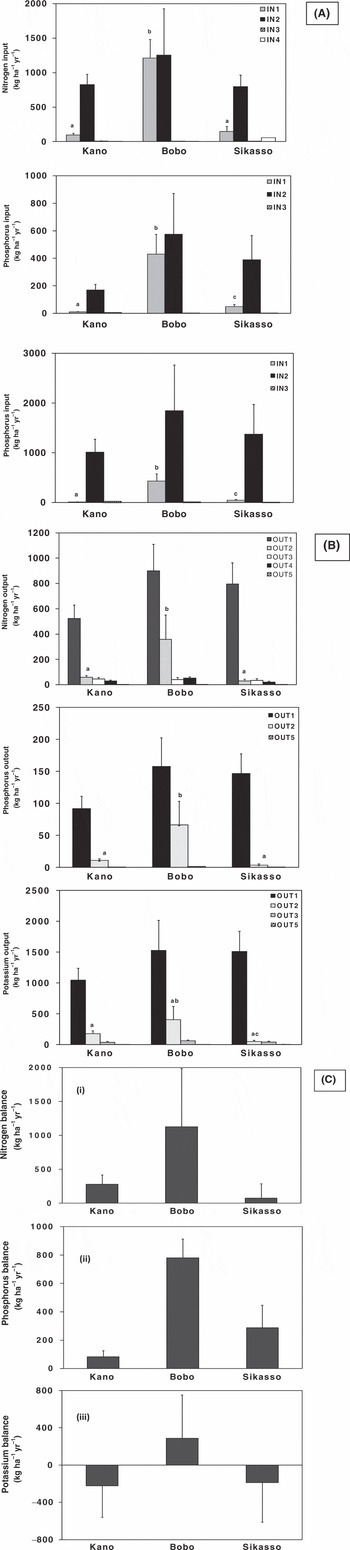
Mineral fertilizer (IN1) and organic fertilizer (IN2) constituted major nutrient inputs to the UPA gardens with organic inputs making up 89, 51 and 84% of applied fertilizer N in Kano, Bobo and Sikasso, respectively, and over 90% of P and K inputs in Kano and Sikasso. There was no statistical difference (p > 0.05) with organic N, P and K inputs among the three cities (Figure 1A). However, P and K mineral fertilizer inputs differed between all three cities (p < 0.05). Mineral fertilizers contributed 49, 43 and 19% of applied N, P and K in Bobo and differed statistically (p < 0.05) with Kano and Sikasso, showing higher use of mineral fertilizers in Bobo than the other cities. Nitrogen, P and K input through atmospheric deposition (IN3) was statistically different between Kano and the other two cities (p < 0.001), and also differed between Bobo and Sikasso for all three nutrients (p < 0.05). Nitrogen input through biological fixation (IN4) was similar (p < 0.05) across all three cities with annual inputs of 3–4 kg N ha−1.
Aggregated annual nutrient (A) input, (B) output and (C) full annual (i) nitrogen, (ii) phosphorus and (iii) potassium balances in UPA gardens of Kano (n = 6), Bobo (n = 2) and Sikasso (n = 6) during a 24-month-monitoring period. Data represent means plus one standard error. Bars with different letters are statistically different (the Kruskal-Wallis test and Bonferroni multtest, p < 0.05) across the three cities, and those without letters have no statistical difference between them. IN1 = mineral fertilizer; IN2 = organic fertilizer; IN3 = atmospheric deposition; IN4 = non-symbiotic N-fixation. OUT1 = harvested product (edible part); OUT2 = residue; OUT3 = leaching; OUT4 = volatilization; OUT5 = erosion losses. IN3, IN4 and OUT5 are hardly visible because of the large scale of the y-axis.

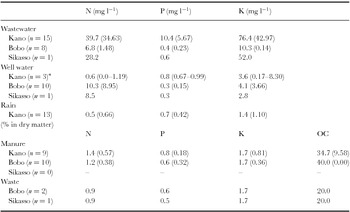
In Table 3, the mean nutrient concentration of different input sources used in cultivating vegetables is indicated. Organic inputs to UPA gardens differed across the three cities. Wastewater was the main source of organic input in Kano and constituted 89, 71 and 92% of applied N, P and K to UPA gardens, respectively. Manure and municipal waste were the main sources of organic nutrient input in Bobo, while municipal waste was the major organic input in Sikasso. Nutrient content in wastewater in Kano was higher than in the other cities and correlated significantly (p < 0.001) with N, P, and K inputs (r 2 = 0.608, 0.677 and 0.561, respectively). However, no statistical difference was observed between organic and inorganic nutrient inputs to UPA gardens under well- or wastewater-irrigated systems in all cities.
Mean of nitrogen (N), phosphorus (P), potassium (K) concentrations and organic carbon (OC) contents of different input sources applied to UPA gardens in Kano, Bobo and Sikasso during a 24-month monitoring period.

*Minimum and maximum values in parenthesis for n < 5, otherwise standard deviation.
Aggregated average annual N inputs were 937, 2478 and 958 kg ha−1 in Kano, Bobo and Sikasso, respectively. The high value in Bobo was due to high inputs of mineral fertilizers, manure and waste compared to Kano. In Kano, farmers applied an average of 7.4 t DM ha−1 yr−1 manure, whereas 55 t DM ha−1 yr−1 were used in Bobo. No application of waste was observed in the studied gardens of Kano, but 60 t DM ha−1 yr−1 of waste was applied to gardens in Bobo and four times more was applied in Sikasso.
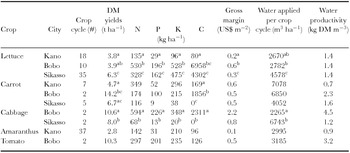
For applications at crop cycle and vegetable level, average N, P and K inputs to lettuce were significantly different (p < 0.05) across the three cities, but no difference was observed for all nutrients applied to carrots (Table 4). Nutrients applied to cabbage were different between Bobo and Sikasso (p < 0.05). The amount of water applied to lettuce was higher in Sikasso and differed from amounts applied to lettuce in Kano and Bobo, which were similar (p > 0.05). Dry matter produced from water applied per crop cycle indicated poor to good water productivity (range 0.7 to 4.5 kg DM m−3) and did not differ across the three cities (Table 4). Water applied to carrots per crop cycle was statistically similar (p > 0.05) across all three cities but differed for the other crops.
Nitrogen (N), phosphorus (P), potassium (K) and carbon (C) input, total DM yields, gross margin, water applied and water productivity per crop cycle of selected vegetables cultivated in the UPA gardens of the three cities.

Within columns, same crops with different letters across the cities are statistically different (the Kruskal-Wallis test and Bonferroni multtest, p < 0.05). Average number of days per crop cycle (± standard deviation) across all three cities for lettuce = 41 ± 3.6; carrot = 100 ± 12.6; cabbage = 96 ± 10.6; amaranthus = 28 ± 3.5; tomato = 90 ± 20.5; n = 6, 2 and 6 in Kano, Bobo and Sikasso, respectively.
Vegetable yields and nutrient outputs
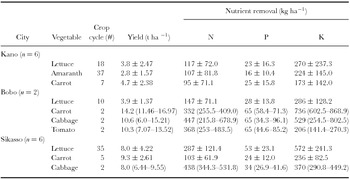
Only lettuce and carrot were found to be commonly grown in the three cities during the period of monitoring, although a diverse range of other vegetables were cultivated. Vegetable yields of different crops across the cities are given in Table 5. Dry matter yields of similarly cultivated vegetables were statistically similar for lettuce in Bobo and Kano and both differed statistically (p < 0.05) from yields in Sikasso. Carrot yield in Bobo was three times higher than in Kano, but similar to that of Sikasso. Carrot yields were statistically similar (p > 0.05) in Kano and Sikasso. Cabbage was present only in Bobo and Sikasso and their yields were not statistically different and ranged from 6.0 to 15.2 t DM ha−1 in Bobo and 6.44 to 9.55 t DM ha−1 in Sikasso. The largest average N outflow (Table 5) was observed in cabbage at Bobo (447 kg ha−1 per crop cycle) and Sikasso (438 kg ha−1). Aggregated annual average nutrient exports through harvested edible parts (OUT1) were 524, 899 and 795 kg N ha−1 in Kano, Bobo and Sikasso, making up 80, 67 and 90% of N outflow in the respective cities (Figure 1B). A similar trend was observed for P and K. Nutrient output via harvested products was statistically similar (p > 0.05) across all cities. Outflows of N through crop residues constituted 9, 26 and 3% of total N exports in Kano, Bobo and Sikasso, respectively. These trends, in terms of percentages, were similar for the other major nutrients, and these were similar in Kano and Sikasso, but differed in Bobo (p < 0.05). Dry matter yields of edible parts and residues were significantly correlated (p < 0.01) with nutrient outputs in the harvested parts (data not shown). Leaching contributed to 7% of N and 3% K output in Kano and 3% each of N and K outputs in Sikasso. Nitrogen and K output via leaching as well as gaseous N losses were not statistically different across the cities. The calculated erosion loss was negligible in Kano, Bobo and Sikasso showed annual losses of 2 kg N ha−1, 1 kg P ha−1, and 6 kg K ha−1, respectively.
Average dry matter yields and average nutrient removal (per crop cycle) of major vegetables cultivated in UPA gardens of the three studied cities.

Minimum and maximum values in parenthesis for n < 5, otherwise standard deviation. Average number of days per crop cycle (± standard deviation) across all three cities for lettuce = 41 ± 3.6; carrot = 100 ± 12.6; cabbage = 96 ± 10.6; amaranthus = 28 ± 3.5; tomato = 90 ± 20.5.
Nutrient balances
Except for K in Kano and Sikasso, partial balances of N and P in the three cities were positive (not shown). Taking all (manageable and environmental) flows into consideration, full balances were positive for N and P across all cities except K in Kano and Sikasso (Figure 1C). Average annual N surpluses were 279, 1127 and 74 kg N ha−1 in Kano, Bobo and Sikasso, respectively. Annual deficits of 222 and 187 kg K ha−1 were observed in Kano (range from –1793 to 2402) and Sikasso (range from –854 to 2028). Potassium output as harvested product and residue in both cities exceeded its input as fertilizer resulting in a negative partial as well as full K balance.
Nutrient use efficiencies
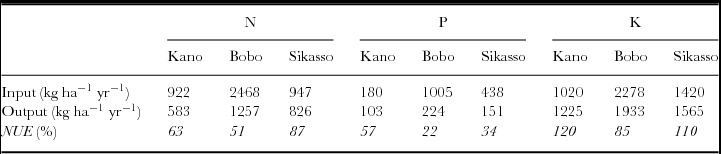
Calculated NUE were higher for N in Kano and Sikasso than in Bobo, because of higher N inputs in the latter city (Table 6). Phosphorus use efficiencies were moderate in Kano and low in Bobo and Sikasso as a result of higher P inputs in the two cities than Kano. Potassium use efficiency was very high in Kano (120%) and Sikasso (110%) due to high K outputs compared to their low input especially as mineral fertilizer. In general, the N and K were utilized more efficiently in Sikasso (87%) and Bobo (85%), respectively, than in Kano. This is because of the higher yields obtained per crop cycle, which almost balanced the N and K inputs in Sikasso and Bobo, respectively, than in Kano. This was further confirmed by a positive and significant correlation (p < 0.01) between total dry matter yields and the N OUT1 in Sikasso.
Nutrient (N, P, K) use efficiency (NUE) of UPA gardens in the three West African cities studied.

N = nitrogen, P = phosphorus, K = potassium. n = 6, 2 and 6 in Kano, Bobo and Sikasso, respectively.
Input as organic and inorganic fertilizers; output as harvested products and residue, i.e. IN1–IN2 and OUT1–OUT2. NUE was calculated from equation (3).
Economic performance indicators
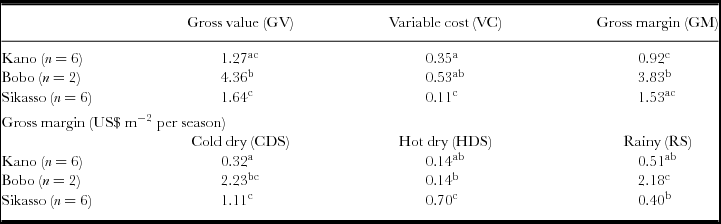
Vegetable production gave a positive gross margin in all three cities. Average annual gross values (GV) per square metre of vegetable production were statistically similar in Kano and Sikasso (Table 8). Variable costs (VC) were statistically similar in Kano and Bobo and both cities differed statistically from Sikasso. Gross margins (GM) were highest in Bobo at US$3.83 m−2 compared to US$0.92 m−2 realized in Kano. Gross margins were statistically similar (p > 0.05) in Kano and Sikasso, and both cities differed (p < 0.05) from Bobo. Across the different production seasons, gross margin differed statistically in the three cities and with the highest average return obtained in Bobo and Sikasso in the cold dry season. Gross margin was lowest in the hot dry season in all three cities (Table 7). Across all cities, cabbage and carrots were more profitable per square metre compared to other crops. Gross margin of cabbage was highest in Bobo (US$2.2 m−2) and did not statistically differ from that of Sikasso (Table 4). Farm gate prices of lettuce yielded significantly (p < 0.05) lower gross margin in Kano (US$ 0.2 m−2) than Bobo and Sikasso.
Average economic flows across 24 months monitoring periods (US$ m−2 yr−1) and gross margins across the different seasons in the three studied cities.

GM = GV−VC; Within columns and across cities, means with the different letters are statistically different (the Kruskal-Wallis test and Bonferroni multtest, p < 0.05).
1 US$ = 150 Nigerian Naira; 475 FCFA.
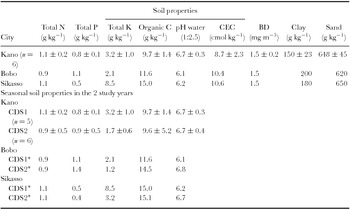
Soil properties (mean ± standard deviation) at the beginning of the study (upper part) and across a season (lower part) during the study in the 0–20 cm depth of the study UPA gardens.

N = nitrogen; P = phosphorus; K = potassium; OC = organic carbon; CEC = cation exchange capacity; BD = bulk density. Data for Kano represent average soil surface properties in 2007 for all gardens.
*Properties for Bobo and Sikasso represent the average data collected in cold dry seasons (CDS1) of 2007 and 2008 (CDS2) collected from one garden each.
Soil profile and surface properties; nutrient balance implications for soil nutrient pools
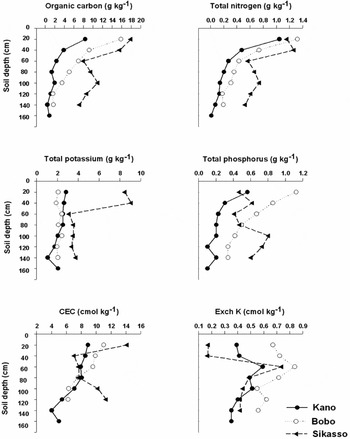
In all three cities, selected soil profile properties reveal decreasing nutrient concentrations from the upper soil layer to the deeper layers (Figure 2) particularly for N, P, K and OC, thus showing the accumulation of nutrients in the upper soil layer. There was a trend of decreasing soil pH with depth in Kano and Sikasso, but a slight increase was observed in Bobo (data not shown). Vertical distribution of CEC was similar to the other properties in Kano and Bobo but was different in Sikasso. For all cities, there was a sharp increase in exchangeable potassium between 40 and 80 cm soil depths but decreased thereafter with depth. Table 8 gives average soil properties for the 0–20 cm depth. All three cities had low to moderate soil fertility. Total nitrogen (TN) was 1.1 g kg−1 for gardens in both Kano and Sikasso, and 0.9 g kg−1 in Bobo. Total phosphorus ranged from 0.5 to 1.1 g kg−1 across the three cities, while OC in Kano was 9.7 g kg−1. Soil pH and bulk densities were within the range for ideal soil fertility across all three cities (USDA, 2008).
Soil profile properties in UPA gardens of Kano, Bobo Dioulasso and Sikasso.

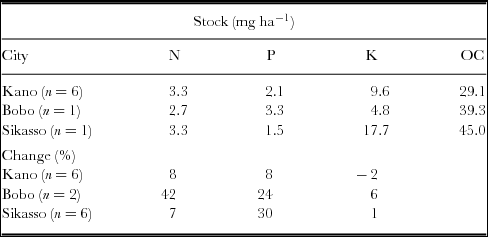
From the resulting balances, calculations show the annual change in the soil P pool to be 8, 24 and 19%, while for the K pool, it was –2, 6 and –1% in Kano, Bobo and Sikasso, respectively (Table 9). Nitrogen surplus in Bobo resulted in an annual N increase of 42%, which is not probably realistic given the complexity and processes that affect N transformation in the soil. Despite nutrient surpluses, changes in the soil nutrients were not so obvious in the cities for the 2 study years. In Kano, soil property changes were obvious in the cold dry seasons of the first (CDS1) and second (CDS2) monitoring periods with a slight decrease in TN (1.1–0.9 g kg−1). However, there was a slight increase in TP and a decrease in TK, while soil pH remained stable across the 2 years. For Bobo and Sikasso, slight changes were observed between the soil data collected for CDS1 and CDS2. Total N was stable in both years, although TP showed a slight increase in Bobo (from 0.9 to 1.4 g kg−1) and a slight decline in Sikasso in CDS2 (from 0.5 to 0.4 g kg−1). Total K declined in both cities, while OC content was slightly increased in Bobo but remained quite stable in Sikasso (Table 8).
Soil nutrient stocks (upper part) and projected annual change in soil nutrient stock in the 0–20 cm depth of UPA gardens in the three West African cities.

N = nitrogen; P = phosphorus; K = potassium; OC = organic carbon.
DISCUSSION
Nutrient balances and implications for soil fertility
Most UPA farmers sustain productivity with high nutrient inputs (Drechsel and Dongus, Reference Drechsel and Dongus2010). Nutrient management in UPA gardens of Kano, Bobo and Sikasso was characterized by large nutrient inputs mainly from organic sources and comprised of municipal waste, wastewater and manure. Use of large nutrient inputs in UPA gardening remains unregulated because it is not a legally recognized practice by the Governments (Drechsel et al., Reference Drechsel, Graefe, Sonou and Cofie2006). Recent studies in plot-level urban and peri-urban vegetable production showed that similar systems were characterized by large nutrient imports with large positive balances in Niger, Ghana, China and Vietnam (Diogo et al., Reference Diogo, Buerkert and Schlecht2010; Drechsel et al., Reference Drechsel, Giordano and Enters2004; Huang et al., Reference Huang, Jin, Bai and Yang2007; Khai et al., Reference Khai, Ha and Öborn2007; Wang et al., Reference Wang, Huang, Shi, Darilek, Yu, Sun, Zhao, Chang and Öborn2008). In addition to nutrients supplied by soils, nutrient requirements of most vegetables range from 40 to 120 kg N ha−1, 4 to 9 kg P ha−1 and 8 to 167 kg K ha−1 (Fox and Valenzuela, Reference Fox and Valenzuela2011; La Malfa, Reference La Malfa2011). Nutrients are further added as atmospheric depositions contributing up to 7–11 kg N ha−1 yr−1. Significant amounts of N can be added as symbiotic N – fixed by leguminous plants (Yusuf et al., Reference Yusuf, Iwuafor, Abaidoo, Olufajo and Sanginga2009) and up to 15 kg N in non-leguminous plants (Lesschen et al., Reference Lesschen, Stoorvogel, Smaling, Heuvelink and Veldkamp2007). Values of N-fixed non-symbiotically in this study were close to values of 2–5 kg N ha−1 yr−1 reported by Roy et al. (Reference Roy, Misra, Lesschen and Smaling2003). For the three cities, nutrient applications far exceeded the range of nutrient requirements with average inputs of 135–530 kg N ha−1, 29–203 kg P ha−1 and 96–646 kg K ha−1 per lettuce cycle, and similar trends were observed for the other vegetables cultivated in the three cities. Harvested products constituted the highest outflow of nutrients from the production systems studied in the three cities, removing more than 50% of applied N and K. One major factor for nutrient outflow is the nutrient concentration in crops, where high yields and nutrient concentrations resulted in large exports of nutrients in Bobo and Sikasso. Potassium output in Kano was higher than the other nutrients. Compared with Bobo, K input as mineral fertilizer was low in Kano and Sikasso. The negative K balance in the latter two cities was due to the large exports of K in the edible parts of the vegetables, especially the large concentrations of K in the leafy part of vegetables that were commonly cultivated in Kano such as amaranth and lettuce and several lettuce cycles grown in Sikasso. This points to the relevance of K in the nutrition of leafy vegetables (PPIC, 2003; Terbe et al., Reference Terbe, Slezák, Kappel and Orosz2010), and which is identified as a limiting nutrient in similar garden-related studies (Song et al., Reference Song, Wang, Han and Stirzaker2011; Wang et al., Reference Wang, Huang, Shi, Darilek, Yu, Sun, Zhao, Chang and Öborn2008). From our data (Table 8), negative K balances in Kano and Sikasso project long-term K depletions, considering low-to-moderate K status of the studied gardens soils. Similar negative K balances were reported in urban gardening systems in Sudan (Abdalla et al., Reference Abdalla, Predotova, Gebauer and Buerkert2012) and Afghanistan (Safi et al., Reference Safi, Predotova, Schlecht and Buerkert2011). Lower N and P efficiencies in Bobo were mainly through the use of large quantities of mineral and organic nutrient inputs compared to the other cities, with potentially huge environmental implications.
In this study, positive N balances could actually be smaller if N leaching losses could be accurately estimated because MonQI often underestimates leaching losses (Abdulkadir et al., Reference Abdulkadir, Leffelaar, Agbenin and Giller2013), even though up to 40% of total applied N could be lost to leaching (Janssen and De Willigen, Reference Janssen and Willigen2006; Zhao et al., Reference Zhao, Hu, Huang, Sun, Tan and Di2010).
Implications of current nutrient management on environmental sustainability
Nutrient balances imply long-term consequences for the soil nutrient stock. Total nitrogen concentration for gardens in the three cities was below the threshold level for good soil fertility of 2 g kg−1 (Muya et al., Reference Muya, Gitau, Obanyi, Ngutu, Kuria, Sharfi, Dub, Bulle, Miano, Muriethi, Keya, Sijali, Mamo, Maingi, Okoti, Omedi and Elisaba2011), while TP concentration was close to the range of optimal thresholds of 0.2–0.8 g kg−1. From these balances, the consequences for changes in the K pool seem not as severe as for P, because low P uptake by plants implies P build-up in the soils. The increasing trend in soil nutrient concentrations down the soil profiles in all three cities is an indication of potential migration of nutrients away from plant root zone to underground water reserves. Phosphorus saturation could result in P leaching to groundwater with a possible eutrophication effect. Nitrogen surpluses across all cities may have only huge implication for groundwater quality and human health because exposure to nitrate in water (NO3-N) has been implicated in stomach cancer and ‘blue-baby syndrome’ due to chemical suffocation because of the inability of blood to carry oxygen (Goulding, Reference Goulding2006). The studied soils are fairly low in N implying that the excess N applied may be lost beyond the root zone to the groundwater. In Bobo, N content in well water was higher than in wastewater. This could be due to leaching of applied N in the gardens to the ground water, although the depth of the water table is not known to confirm this point. Cissé and Mao (Reference Cissé and Mao2008) reported high concentrations of nitrate–N in well water of the Sikasso region in Mali and attributed this mainly to agricultural activities. Large amounts of N applied imply high losses to the environment. From a lysimeter study on intensively irrigated vegetables, Zhao et al. (Reference Zhao, Hu, Huang, Sun, Tan and Di2010) reported that 227 to 354 kg N leached per hectare from applications of 1110 and 1480 kg N ha−1, respectively. In another study, wastewater application increased N input to vegetable production and increased the potential of N leaching to groundwater (Karam et al., Reference Karam, Mounzer, Sarkis and Lahoud2002).
Although several studies have been conducted to assess fertilizer requirements of temperate vegetables for optimal yields (La Malfa, Reference La Malfa2011), limited work has been done to assess fertilizer requirements in tropical areas (Fox and Valenzuela, Reference Fox and Valenzuela2011). Furthermore, if these fertilizer requirements are formulated, these results have to be effectively disseminated for judicious application of nutrients. Maximal yields and economic returns may not always be the best production targets, because there will always be a trade-off with environmental losses (Kremen and Miles, Reference Kremen and Miles2012; Validivia et al., Reference Validivia, Antle and Stoorvogel2012) as well as farmers’ willingness to adopt alternative options. Wastewater, manure and solid municipal waste provide favourable sources of nutrients for production, but over-application leads to oversupply of nutrients. To find a balance between these nutrient sources for vegetable production and their supply in UPA is a big challenge for the government and other stakeholders, as UPA gardening is difficult to regulate because it largely occurs in the informal sector.
Variations of economic indicators in UPA gardening
Diversity of vegetables produced per city is often driven by seasonal suitability (mainly temperature) and farmers’ economic goals, because vegetables produced off season often bring higher economic returns (Diogo et al., Reference Diogo, Buerkert and Schlecht2011). This, however, requires extra labour accompanied by careful and good management to meet the desired production. When the three cities were compared, GM were higher in Bobo and Sikasso than in Kano. This may be attributed to higher yields and the cultivation of higher valued crops in the former two cities than Kano. Another factor is the lower VC of production in Bobo and Sikasso, where labour was offset on a monthly basis. In Kano, labour costs of weeding and land preparation were paid for each farm operation; this, and the extra costs of hiring and fuelling motor pumps used in irrigating crops, resulted in higher VC. Gross margins were lowest in the hot dry season in all three cities compared with cold and rainy seasons. These discrepancies can be deciphered from the cultivation of high priced vegetables of mainly temperate origin during the cold dry periods. In contrast, hot temperatures hinder the cultivation of high-value temperate vegetables and farmers are left with the option to grow indigenous vegetables of lower economic value. This is further driven by lower prices from the increased supply of the same vegetables when several UPA farmers decide to cultivate the same crops at the same time. Maximum temperatures were lower in Bobo and Sikasso than Kano, where a higher diversity of temperate vegetables was observed in the former two cities. These fluctuations show that UPA vegetable production systems are dynamic, and often driven by socio-economic and seasonal conditions (Drechsel and Dongus, Reference Drechsel and Dongus2010).
CONCLUSIONS
Quantitative assessment of nutrient flows in UPA gardens across three West African cities shows positive N and P balances but negative K balance in Kano and Sikasso. Although an economically viable activity, current UPA nutrient management carries huge environmental risks because of the surplus applications of N (74–1127 kg ha−1) and P (83–780 kg ha−1) for vegetable production in the three cities. Thus, site- and vegetable-specific fertilizer and wastewater application rates in UPA gardening is required to curtail nutrient losses and minimize groundwater pollution. Regretfully, UPA sector is not yet accorded any research priority in agricultural development in West Africa. Further studies on N, P and K dynamics in UPA are urgently needed to define appropriate soil fertilization practices to curtail oversupply of N and P for environmental sustainability.
Acknowledgements
The authors are grateful to the Volkswagen Stiftung, Hannover, Germany, for funding this research under the ‘Urban Food’ project within the collaborative programme ‘Resources, their dynamics, and sustainability-capacity-development in comparative and integrated approaches’ (No. I/82 189), the ‘Urban Food’ project coordinators, Profs. A. Buerkert and E. Schlecht, as well as supporting institutes in Africa. The first author gratefully acknowledges Ahmadu Bello University, Zaria, Nigeria, for a study fellowship at Wageningen University, The Netherlands; Contributions of Mr. Ilyassou Oumarou of ICRISAT Niamey, Niger, for the laboratory analysis of soil, crop, manure and water samples; IAR, A.B.U. Zaria, Kano Sub-station; Joost Vlaming of Envista Consultancy, Arnhem, The Netherlands, for his expertise and assistance with MonQI; Late Herman van Keulen, Peter Leffelaar, Nafiu Abdu and J.-D. Pascal Lompo for their contributions in all aspects of this work. Anonymous reviewers for their critical views and useful suggestions are duly acknowledged.