1. Introduction
When a strong shock wave releases at a free solid surface, micron-sized ejecta particles may be emitted at high speed from surface defects, e.g., pits, scratches or surface roughness (Asay Reference Asay1976; Buttler et al. Reference Buttler2012). For applications such as inertial confinement fusion (ICF), magnetised target fusion (MTF) and magnetised liner inertial fusion, the introduction of surface material into gas or plasma may significantly alter its properties and behaviour (Boudesocque-Dubois, Gauthier & Clarisse Reference Boudesocque-Dubois, Gauthier and Clarisse2008; Huneault, Plant & Higgins Reference Huneault, Plant and Higgins2019; Lewis et al. Reference Lewis, Knapp, Harding and Beckwith2022). Thus, to understand the dynamics of ejecta transport in converging gases, as well as the evolution of this particulate mixture, is of great importance in fields of implosion dynamics and fusion research.
Early research focused primarily on mechanisms of ejecta formation. Ejecta productions from solid and melted metals have been measured with experimental techniques including piezoelectric diagnostic probes and Asay foil (Asay Reference Asay1977; Hopson & Olinger Reference Hopson and Olinger1977; Vogan et al. Reference Vogan2005; Buttler et al. Reference Buttler, Routley, Hixson, King, Olson, Rigg, Rimmer and Zellner2007). Dynamic ejecta sizing was firstly reported with holographic techniques, and has been recently extended to more diagnostics, such as the dynamic Mie-scattering measurement (McMillan Reference McMillan1986; Monfared et al. Reference Monfared, Buttler, Frayer, Grover, LaLone, Stevens, Stone, Turley and Schauer2015; Schauer et al. Reference Schauer, Buttler, Frayer, Grover, LaLone, Monfared, Sorenson, Stevens and Turley2017). It was proven that the total ejected mass, as well as the particle size and velocity distributions, is extremely susceptible to the surface perturbations, shock loading conditions and the release state of the post-shock material (Germann et al. Reference Germann, Hammerberg, Holian, Furnish, Gupta and Forbes2006; Zellner et al. Reference Zellner2007; Zellner et al. Reference Zellner, Dimonte, Germann, Hammerberg, Rigg, Stevens, Turley and Buttler2009; Li et al. Reference Li, Zhao, Wu and Luo2014; He, Wang & Shao Reference He, Wang and Shao2015). Models based on Richtmyer–Meshkov instability (RMI) theory have been proposed to describe the evolution and quantity of material ejected from a shocked surface (Buttler et al. Reference Buttler2012; Dimonte et al. Reference Dimonte, Terrones, Cherne and Ramaprabhu2013; Hammerberg et al. Reference Hammerberg, Buttler, Cherne, Andrews, Karkhanis, Ramaprabhu, Stevens and Turley2017; Karkhanis et al. Reference Karkhanis, Ramaprabhu, Buttler, Hammerberg, Cherne and Andrews2017). Within the RMI framework, ejecta production is governed by the growth of unstable bubble and spike structures arising from initial surface perturbations, with the areal mass density linked to bubble saturation and the maximum ejecta velocity controlled by nonlinear spike acceleration (Dimonte & Ramaprabhu Reference Dimonte and Ramaprabhu2010; Buttler et al. Reference Buttler2012; Dimonte et al. Reference Dimonte, Terrones, Cherne and Ramaprabhu2013). Subsequent numerical and theoretical studies have demonstrated that extensions of classical RMI theory are required to capture elastic–plastic material response (He et al. Reference He, Liu, Liu and Wang2018) and non-sinusoidal surface morphologies (Cherne et al. Reference Cherne, Hammerberg, Andrews, Karkhanis and Ramaprabhu2015), which can be incorporated through modified growth rates and effective wavelength concepts. Together with detailed continuum and molecular dynamics simulations (Karkhanis et al. Reference Karkhanis, Ramaprabhu, Cherne, Hammerberg and Andrews2018; Wu et al. Reference Wu, Wu, Zhu, Wang, He and Wu2018; Stewart, Olles & Wood Reference Stewart, Olles and Wood2022; Soulard et al. Reference Soulard, Durand, Burie and Babilotte2024), these developments establish a unified, physics-based RMI framework for ejecta that provides predictive capability across a wide range of materials, loading conditions and surface geometries, superseding earlier phenomenological descriptions based solely on statistical surface roughness (Asay & Bertholf Reference Asay and Bertholf1978).
The transport and mixing of ejected particles in a gaseous environment involve complicated mechanisms, including inter-phase exchanges of mass, momentum and heat, as well as possible chemical interactions with reactive gases. Oró et al. (Reference Oró, Hammerberg, Buttler, Mariam, Morris, Rousculp and Stone2012) proposed a set of solutions for the transport of particles ejected from a shocked interface into gases, revealing that the evolution of the ejected material is a sophisticated process closely linked to the size and velocity distributions of ejecta. Furthermore, for liquid ejecta particles emitted from a fully melted surface, aerodynamic forces such as viscous drag not only cause particle deceleration but also induce droplet distortion, oscillation and eventual breakup into much smaller fragments (Eliasó et al. Reference Elias, Chapron and Mondot1990; Remiot et al. Reference Remiot, Elias, Chapron and Mondot1991; Theofanous et al. Reference Theofanous2011; Andrews et al. Reference Andrews and Preston2014; Shi et al. Reference Shi, Ma, Dang, Ma, Sun, He and Wang2021; Singh et al. Reference Singh and Narsimhan2022). The inherent size dispersion of ejecta, coupled with the hydrodynamic breakup of particles, distinguishes the transport dynamics of ejected material from that of monosized, unbreakable particles (Xue et al. Reference Xue, Miu, Li, Bai and Tian2023; Miao, Li & Xue Reference Miao, Li and Xue2024). Recently, there has been growing research interest in shock-induced transport and breakup of ejecta particles in reactive gases (Mance et al. Reference Mance, Manzanares, Martinez, Schauer, Schmidt, Stevens, Turley and Valencia2020; Wu et al. Reference Wu, Wu, Wang, He and Wu2020; Buttler et al. Reference Buttler2021; Lyu et al. Reference Lyu, Shi, Han, Ma, Ma, Sun, Sun and Wang2023). As noted by Buttler et al. (Reference Buttler2017), chemical reactions between micro-ejecta and the surrounding gas can also induce the breakup of particles under conditions where they would otherwise remain hydrodynamically stable in a non-reactive gas.
It should be noted that most of the previous studies on ejecta transport have focused on planar geometries. However, practical fusion and implosion systems often involve cylindrically or spherically converging geometries, where ejecta transport exhibits distinct characteristics that are not captured in planar investigations. First, the radial convergence of the flow leads to a continuous increase in gas density, which complicates the aerodynamic drag acting on ejecta particles as well as their subsequent deceleration, deformation and breakup behaviours. Unlike planar flows with consistent drag conditions that result in relatively homogeneous particle responses, the spatial and temporal density variations in converging geometries complicate aerodynamic interactions across the ejecta layer, thereby making the overall transport dynamics more intricate. Furthermore, the gas shock wave in a cylindrical system rebounds from the convergence axis and collides with the inward-converging ejecta. This collision triggers an abrupt shift in the interphase relative velocity, which may induce secondary breakup of previously stable particles. Meanwhile, the significant acceleration difference between the gas and ejecta phases amplifies unsteady forces that are typically negligible in low-speed incompressible flows, so explicit consideration of these forces is required for accurate modelling of transient particle motion (Britan et al. Reference Britan, Elperin, Igra and Jiang1995; Skews, Bredin & Efune Reference Skews, Bredin and Efune2007). Additionally, the direct collision between the rebounding gas shock wave and the ejecta layer can induce RMI in the particle-laden flow. This instability originates from the density contrast between ejecta particles and the surrounding gas, coupled with the shock-induced velocity jump at the ejecta–gas interface, and further modifies the ejecta distribution as well as the motion of individual particles. Moreover, the ejected material in an imploding system can be compressed to a state where inter-particle collisions and fluid-mediated waves govern the particle dynamics. This dilute-to-dense transition spans a broad range of ejecta volume fractions, making the modelling of inter-particle interactions essential for numerical analyses (Capecelatro et al. Reference Capecelatro and Wagner2024). In contrast, for ejecta transport in planar geometries, where ejecta particles naturally undergo velocity dispersion, the particle volume fraction rarely reaches such high levels. As a result, inter-particle collisions are typically negligible and can be omitted from simulations. Finally, the radial contraction of the imploding flyer introduces an additional compression mechanism for the particulate mixture layer width, which becomes more pronounced in the later stages of ejecta transport.
A notable study on the transport of particulate flows in converging geometries was reported by Rousculp et al. (Reference Rousculp, Oró, Morris, Saunders, Reass, Griego, Turchi and Reinovsky2015). In their damaged surface hydrodynamics experiments, micron-sized tungsten (W) powder particles pre-coated on the inner surface of an aluminium (Al) liner were shock launched into an increasingly dense gas medium within a converging system. The evolution of both the powder particle cloud and the gas shock wave was diagnosed using multi-frame proton radiography imaging, which provided valuable insight into the particulate flow dynamics. However, the dominating physics of W powder transport differs from those effective for ejecta particles. For one, manufactured powder particles have distinct initial size/velocity distributions compared with shock-ejected particles. For another, the tungsten powder particles are expected to remain solid during transport due to their high melting temperature, meaning the breakup dynamics particularly critical for ejecta evolution is absent. Consequently, the transport behaviour of actual ejected particles in shock-induced converging gases remains poorly understood and requires further investigation.
To this end, we integrate experiments and numerical simulations to investigate the transport dynamics of ejected particles in a cylindrically converging gas flow. A cylindrical system is employed because it offers an advantage that direct measurements of ejecta transport can be made by viewing along the axis while incorporating all the convergence effects. Using a magnetically driven implosion facility, we generate ejecta particles from a roughened tin (Sn) liner and track their evolution via X-ray radiography and optical schlieren imaging. Gases with identical initial pressures but different atomic weights, namely helium (He) and argon (Ar), are used to gain further insights into the effect of gas species. The ejecta transport and particle dynamics are numerically studied using four-way coupled Euler–Lagrange simulations. A compressible gas–particle flow model, including modelling of interphase coupling, inter-particle collisions and particle breakups, is developed and implemented to investigate the underlying physics controlling ejecta evolution. Building on understanding of the general process of ejecta transport, a theoretical model is established to predict the evolution of ejecta width in a converging system.
The paper is organised as follows: in § 2, we present the experimental configuration of the cylindrical implosion platform, including liner geometries and the implementation of diagnostics. The numerical method and set-up are elaborated in § 3. The general behaviours of ejecta transport in Ar gas are discussed in § 4.1 using both experimental and numerical results. The particle dynamics and mechanisms governing ejecta–gas coupling are further investigated in § 4.2. The effect of gas species on the ejecta transport is discussed in § 4.3. A theoretical model of ejecta width variations in a cylindrically converging system is established in § 5. Finally, the results are summarised in § 6.
2. Experimental set-up
Experiments were conducted using a standard liner-on-target shock experiment set up at the FP-1 pulsed power facility, located at the Institute of Fluid Physics, China Academy of Engineering Physics (Yang et al. Reference Yang, Sun, Liao and Hu2002; Zhang et al. Reference Zhang, Liu, Wang, Zhang, Sun, Zhang, Li, Chi and Zhang2019).
As shown in figure 1(a), a pulsed current passes through a cylindrical Al liner that is 0.5 mm thick, 30 mm diameter and 20 mm high. The current and the associated magnetic field set up Lorentz forces which implode the liner radially inward. As the imploding liner accelerates to a speed of approximately 1 km s−1, it impacts a co-axially positioned Sn target liner that is 0.95 mm thick with an outer diameter of 22.4 mm. When the impact-induced shock wave breaks out at the inner surface of Sn, ejecta particles are produced and emitted into inert gases, He or Ar; see figure 2(a). For all experimental shots, the initial gas pressure and temperature are controlled at 3.0 bar and 300 K, respectively, with the exception of a vacuum baseline experiment.
(a) Schematic of load configuration of the ejecta transport experiment on the FP-1 facility. (b) The measured contour of the inner surface of Sn target liner. (c) The roughness profile (black solid line) compared with a reconstructed curve (red dashed line),
 $ y(x) = 5.13 \text{sin}(2\pi x/39.3 - 0.025) + 2.19 \text{sin}(2\pi x/19.7 - 0.073)-0.22 $
.

(a) Schematic of shock wave propagation and interaction with the ejecta. (b) Maximum loading pressure versus outer radius of target liner under FP-1 driving conditions, where the present set-up is marked with a star symbol.

To effectively and stably generate ejecta particles under the present impact conditions, a predefined initial perturbation with ∼ 40 μm wavelength and ∼ 12.8 μm peak-to-valley amplitude is machined on the Sn inner surface, see figure 1(b). Based on Fourier analysis, two dominant modes with wavelengths λ 1 = 39.3 μm and λ 2 = 19.7 μm were identified, and the surface profile can be well reconstructed utilising these primary components, as shown in figure 1(c).
It should be noted that, in the current experiments, the selection of the radius and thickness for the Al liner and Sn target is based on a balanced consideration of multiple factors, including shock pressure, observational feasibility and gas-filling conditions. Figure 2(b) illustrates the variation of maximum loading pressure with target liner radius under FP-1 driving conditions. Given that the Lorentz force is inversely proportional to the square of the liner radius, increasing the target size will reduce the impact-induced shock strength. Extensive studies indicate that stable and reproducible ejecta products require an impact velocity no less than 1 km s−1, corresponding to a loading pressure about 10 GPa in Sn. Higher loading pressures lead to reductions in target size and observable time, which compromises experimental data acquisition. Consequently, the outer radius of the Sn target can be determined, enabling derivation of the matching dimensions for the Al liner. Regarding thickness selection, while geometric effects of the target liner slightly influence loading strength, current conditions prioritise gas-filling pressure and structural strength requirements. Preliminary test results demonstrate that further reduction in Sn target thickness may induce unexpected deformation and impair gas pressure retention, posing significant challenges to experimental integrity. Therefore, the target thickness employed is slightly greater than the actual physical requirement to ensure data accuracy.
Dynamic images of ejecta transport were captured using axial flash X-ray radiographic techniques. The X-ray source, with a diameter of approximately 1 mm and a pulse duration of ∼ 50 ns, is positioned at ∼ 1.1 m from the liners. Reduced X-ray scattering, improved source collimation, blur reduction and improved signal-to-noise ratio have been incorporated into this system. Figure 3(a) presents a typical radiographic image from a vacuum experiment, taken at 4.5 μs after the shock wave breakout at the inner surface. The Sn target, which is spalled due to the liner-on-target impact, exhibits great azimuthal symmetry, indicating effective control of the loading symmetry. The adjacent ejecta layer is more transparent to the backlighter X-rays. Its density can be evaluated from the light intensity using a relationship between mass per unit area of material and the intensities of X-ray transmission, calibrated by a set of Sn foil samples with specific thickness. Multi-frame optical schlieren imaging system was employed to capture detailed images of both the cylindrically converging gas shock wave and the ejecta front. Figure 3(b) shows one of four optical images obtained from a He gas experiment, where the position of the ejecta front is marked with a dashed circle. The roughness of the front edge of ejecta arises from the inherent velocity dispersion of the particles, while the prominent spike-like structures ahead of the ejecta front are associated with bow shocks generated by large, high-speed individual particles that are weakly coupled to the gas. The velocities of both the Al liner and Sn target were measured using a photon Doppler velocimetry (PDV) system in a series of independent experiments designed for dynamic data acquisition. Further details regarding diagnostics and experimental results are provided in Appendices A–C.
(a) An axial X-ray radiograph taken at t = 4.5 μs after the shock wave breakout of a vacuum experiment, where the ejecta and spalled Sn liner are evident. (b) An optical schlieren image taken at t = 1.86 μs of a He gas experiment.

3. Numerical set-up
3.1. Computational model
The transport of ejecta particles, along with gas and liner dynamics, was simulated using CELP, a two-dimensional multiphase hydrodynamic code developed to model shock hydrodynamics experiments involving multiple materials under high-strain rates and high-speed multiphase flows (Sun et al. Reference Sun, Wang, Chen and Qin2014; Pei et al. Reference Pei, Ma, Zhang, Shi, Ma, Pan and Wang2022). CELP solves continuum mechanics problems for compressible fluid and solid materials with a coupled Eulerian–Lagrangian method. To model particulate matter dynamics, such as the ejecta transport discussed here, a hybrid particle-continuum representation was used that allows for coupling with ambient continuum materials on bulk scales. Continuum hydrodynamics and particle transport are calculated separately as split steps. Coupling between the two representations, as well as the conservation of mass, momentum and energy, is achieved through an interphase coupling model, including modelling of interphase coupling, inter-particle collisions and hydrodynamic breakup of particles. Details of the multiphase mode are presented in Appendix D.
(a) Initial mesh and material layout of a gas-filled experiment simulation with CELP. Both liners are represented using Lagrangian meshes (green and red meshes), while the gas is modelled using a Eulerian mesh (grey mesh). (b) Snapshot at 2.7 μs after the shock wave breakout, in which ejecta particles (coloured by particle size) have been generated along the inner surface.

Calculation starts at the moment when the imploding Al liner arrives at the Sn outer surface, and thus the liner-on-target impact occurs at the very beginning of the simulation. Figure 4(a) shows the initial mesh and material layout of a gas-filled experiment. Note that both liners are depicted in Lagrange meshes with an initial spatial resolution of 12 μm/cell in the radial direction, and a contact surface (detachable slide line) is set between Al and Sn. An Eulerian mesh is used for the gas phase with a constant resolution of 40 μm/cell, with symmetric boundary conditions implemented at x = 0 and y = 0. A standard Courant-Friedrichs-Lewy number C = 0.1 is employed to ensure numerical stability in computations. Material properties are obtained with the wide regime equation of state (Liu et al. Reference Liu, Song, Zhang, Zhang and Zhao2016) and a constitutive model at high-strain rate (Steinberg, Cochran & Guinan Reference Steinberg, Cochran and Guinan1980).
Ejecta particles are assumed to be produced instantaneously when the shock wave releases at the Sn inner surface, and the breakout time is defined as t ≡ 0. Since the spatial and temporal scales of present interest are much larger than those of emitted materials, ejecta particles are treated as point masses and are represented in CELP as computational super-particles, i.e. parcels. Each parcel represents a certain number of physical particles with identical properties, including position, velocity, particle size and temperature. Figure 4(b) shows a snapshot at t = 2.7 μs, where numerical particles have been generated along the Sn inner surface and coexists with the continuum hydrodynamics mesh.
3.2. Initial status of the impactor liner
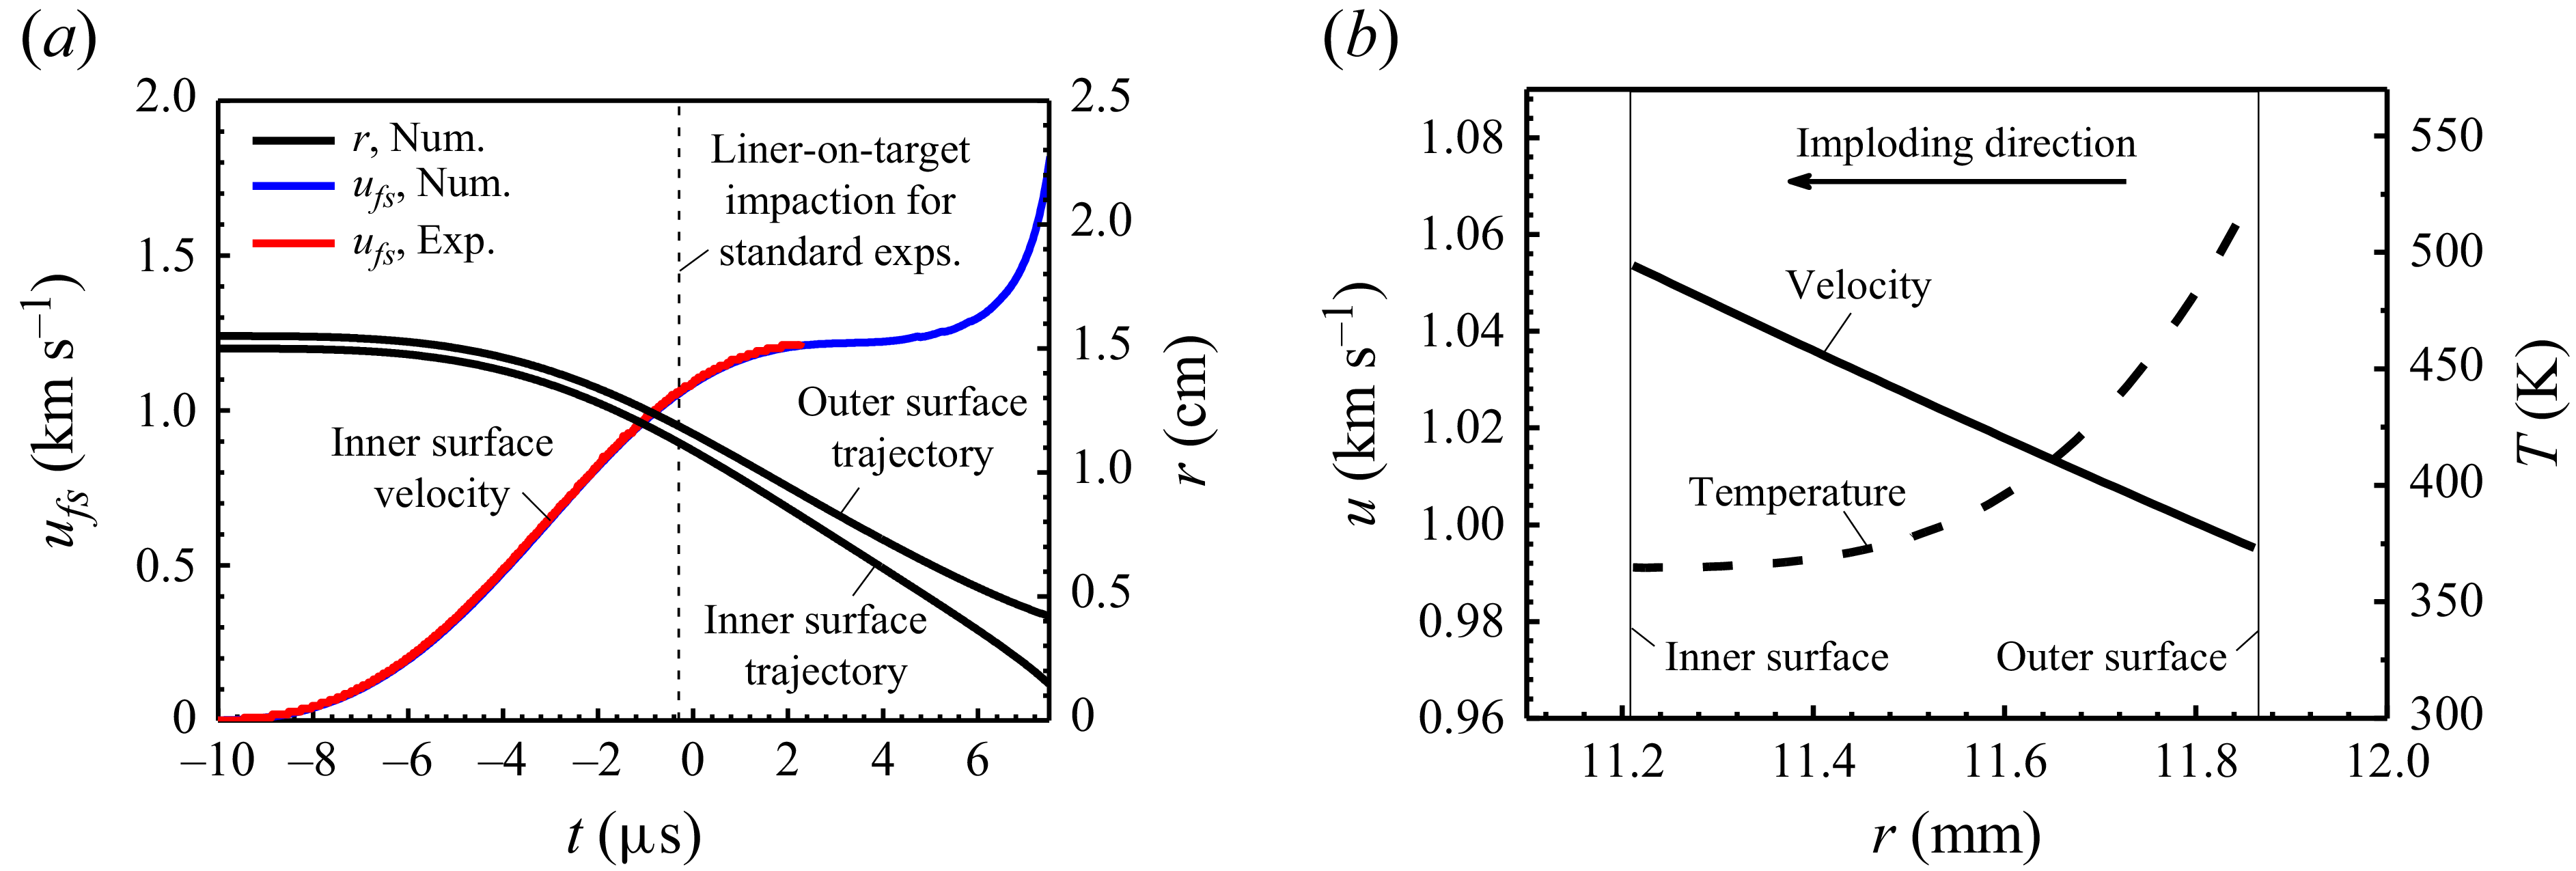
The implosion of Al liner is simulated with MADE-1D, a one-dimensional magnetohydrodynamics code developed for the numerical design and analysis of magnetically driven experiments, such as cylindrical and quasi-spherical liner implosions, Z pinches and isentropic compression experiments (Zhang et al. Reference Zhang2015; Zhang et al. Reference Zhang, Zhang, Wang, Ding and Xue2018). Figure 5(a) presents a comparison between the calculated velocity of the Al inner surface and the PDV measurement from an experiment without target liner. For a standard shot, the expected liner-on-target impact occurs approximately 10 μs after current discharge. The radial velocity and temperature distributions of the Al liner at the impact moment are shown in figure 5(b), which serve as the initial conditions for the CELP simulations. It should be noted that the Al temperature increases monotonously with the radius and reaches a peak of 530 K at the outer surface due to Joule heating. Thus, most of the imploding Al liner, especially its inner surface, remains solid when it collides with the Sn target.
(a) Calculated trajectories (black lines) of the Al imploding liner, and the inner surface velocity (blue line) compared with the PDV measurement (red line) in an experiment without target liner. (b) Velocity (solid line) and temperature (dashed line) radial distributions of the imploding Al liner prior to the liner-on-target impact.

3.3. Initial ejecta distributions
In the present study, the total mass of the ejected material and its velocity distribution were extracted from the X-ray radiographic image of the vacuum experiment (see figure 3
a). Since the time scale of ejecta generation is much shorter than that of transport, it is reasonable to assume that all particles are ejected instantaneously. Assume that particle velocities remain constant in the absence of gas, and the effect of inter-particle collisions during this process is negligible. Thus, particle velocity u
p
is simply determined by the distance between the initial Sn inner radius
 $ r_{\textit{inner},0} $
and the instant particle position
 $ r_{t} $
over the time interval
 $ \Delta t $
, i.e.
 $ u_{p} \equiv (r_{\textit{inner},0} - r_{t})/\Delta t $
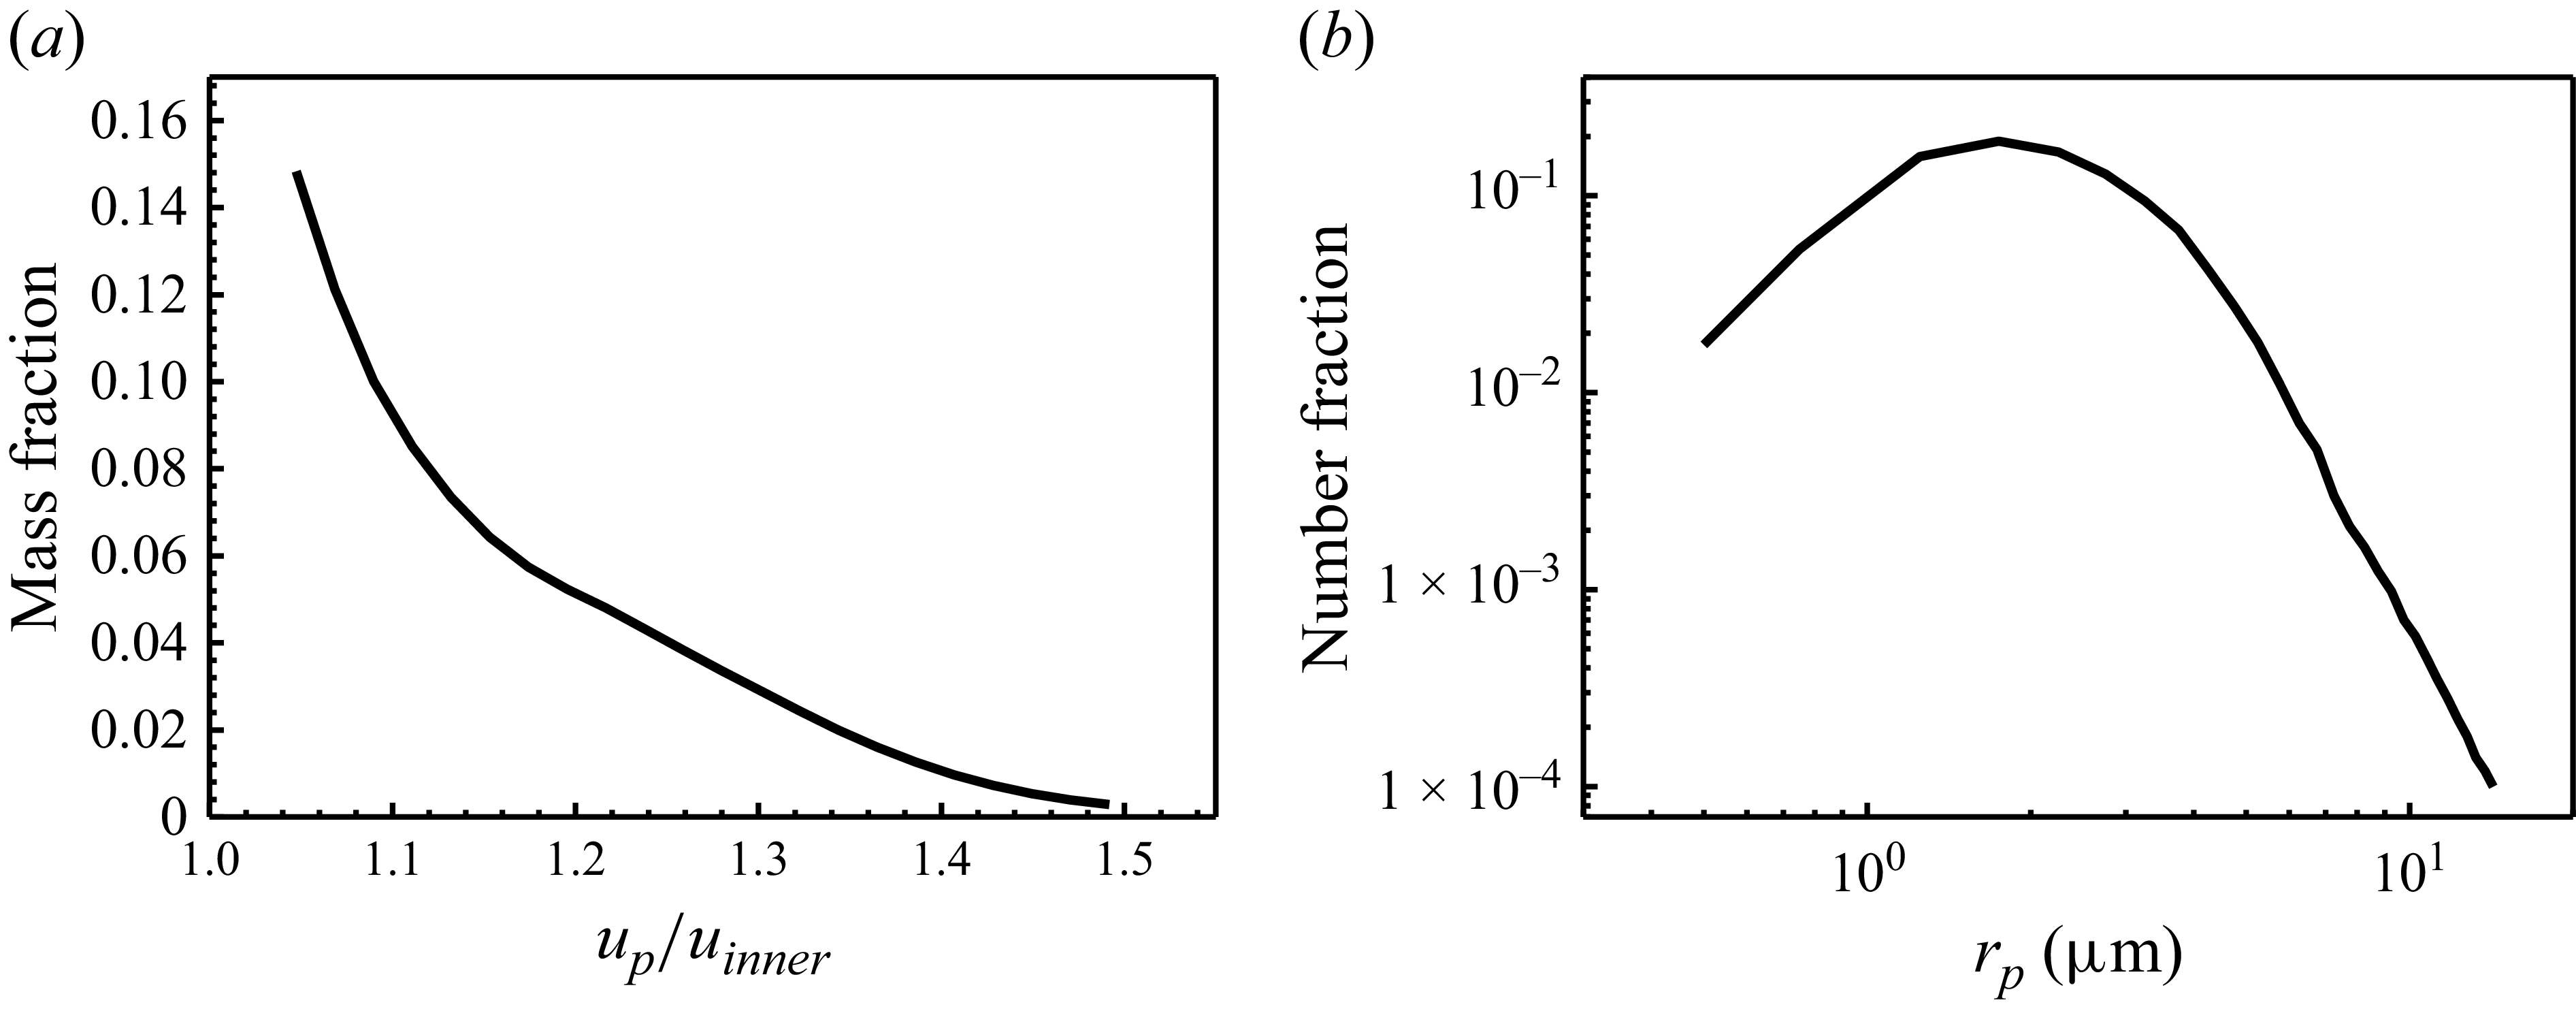
. Combined with the density profile extracted from the X-ray radiograph, a mass–velocity distribution of the ejecta was established, as shown in figure 6(a). The maximum velocity at the ejecta front is 1.32 km s−1, corresponding to a relative ratio of ∼ 1.5 to the inner-surface jump velocity u
inner
. By integrating the density distribution over space, a total ejecta mass per unit area of 30.6 mg cm−2 is obtained.
Initial particle distributions used in the multiphase calculation: (a) velocity distribution plotted as particle mass fraction versus velocity ratio (particle velocity/inner-surface velocity,
 $ u_{p}/u_{\textit{inner}} $
), (b) size distribution plotted as particle number fraction versus particle radius r
p
.

The dynamic sizing of ejecta from shock-loaded materials has been studied experimentally using diagnostics such as holography and Mie scattering (Sorenson et al. Reference Sorenson, Malone, Frogget, Ciarcia, Tunnell and Fleur1997; Monfared et al. Reference Monfared, Buttler, Frayer, Grover, LaLone, Stevens, Stone, Turley and Schauer2015). Size distributions of Sn ejecta have been measured over a wide range of shock strength and surface finishes. Based on the log-normal function proposed by Sorenson et al. (Reference Sorenson2014; Reference Sorenson2017), particles were categorised into groups with radii ranging from 0.5 to 14 μm, with a peak at 2.0 μm, as shown in figure 6(b).
4. Results analysis
4.1. General behaviour
When the liner-on-target shock wave breaks out at the inner surface of Sn target, ejecta particles, as well as a converging shock wave in the Ar gas, are generated. Initially, the gas shock wave propagates radially inward at a speed of D = 1.3 km s−1 (Mach number Ma ∼ 4.1), comparable to that of the ejecta front. However, it is strengthened due to the cylindrical convergence effect. As the shock wave rebounds from the axis, it recompresses the gas and collides with the ejecta–gas mixture. Figure 7 presents a sequence of X-ray radiographs from the Ar gas experiments, compared with CELP simulation results. The first two images were captured while ejecta particles were travelling behind the converging gas shock wave, and the third was taken just before the rebounding shock wave impinged on the ejecta front. During this period, the grey scale of the ejecta layer darkens progressively, and a distinct circular structure with lower transmission emerges at the ejecta front at 7.3 μs, indicating a density profile variation happens during the transport. At the same time, the spalled Sn layer expands due to the convergence effect, reaching a thickness nearly 1.5 times of that observed in the first two images. The last two images were obtained after the rebounding gas shock wave has collided with the ejecta. The X-ray transmission at the ejecta front is further reduced, and the radiographic contrast between the circular leading edge and the rest of the ejecta increases significantly.
Axial radiographic images captured from Ar gas experiments, compared with simulation results of CELP. According to the simulation, the gas shock wave converges radially inward in (a) and (b), while it has rebounded from the axis in (c). In (d) and (e), the rebounding shock wave (not illustrated) has collided with the ejecta and its strength is attenuated by coupling with particles.

Additionally, millimetre-scale non-uniform structures appear in both the ejecta layer and the Sn layer. As shown in figure 7(a), azimuthally periodic non-uniform structures in the ejecta are distinguishable since the early stage of implosion. Similar periodic structures (with a mode number n = 20) were also reported in the proton radiography images of shock-launched powder clouds in cylindrically converging gases by Rousculp et al. (Reference Rousculp, Oró, Morris, Saunders, Reass, Griego, Turchi and Reinovsky2015). Through two-phase flow simulations, Pei et al. (Reference Pei, Ma, Zhang, Shi, Ma, Pan and Wang2022) demonstrated that intense particle collisions during shock launching in such systems induce microstripe-like structures, which subsequently merge and evolve into macroscopic non-uniformities during particle transport. Notably, the characteristic scale of these microstripe-like structures is comparable to the prefabricated perturbation on the Sn surface, suggesting that groove-induced ejecta may exhibit similar growth kinetics. Furthermore, the direct interaction between the rebounding gas shock and the ejecta triggers RMI in the particle-laden flow, which further amplifies the perturbations and modifies the ejecta distribution, as shown in figure 7(b–e) (Hosseini & Takayama Reference Hosseini and Takayama2005; Biamino et al. Reference Biamino, Jourdan, Mariani, Houas, Vandenboomgaerde and Souffland2015; Ding et al. Reference Ding, Si, Yang, Lu, Zhai and Luo2017; Vandenboomgaerde et al. Reference Vandenboomgaerde, Rouzier, Souffland, Biamino, Jourdan, Houas and Mariani2018; Luo et al. Reference Luo, Li, Ding, Zhai and Si2019; Zhao et al. Reference Zhao, Wang, Liu and Lu2020; Li et al. Reference Li, Xue, Zeng, Tian and Guo2022; Chen et al. Reference Chen, Xing, Wang, Zhai and Luo2023; Xu et al. Reference Xu, Wang, Zhai and Luo2023; Yuan et al. Reference Yuan, Zhao, Liu, Wang, Liu and Lu2024; Liang & Luo Reference Liang and Luo2025; Xing et al. Reference Xing, Chen, Li, Wang, Zhai and Luo2025), For the Sn layer, while the influence of the pre-machined surface grooves is worthy of attention, the shock-induced spallation of the Sn target inevitably introduces larger-scale and randomly distributed initial perturbations. These perturbations are likely a more direct source of the observed macroscopic non-uniformities in Sn, and will be amplified during the implosion under dynamic buckling mechanism.
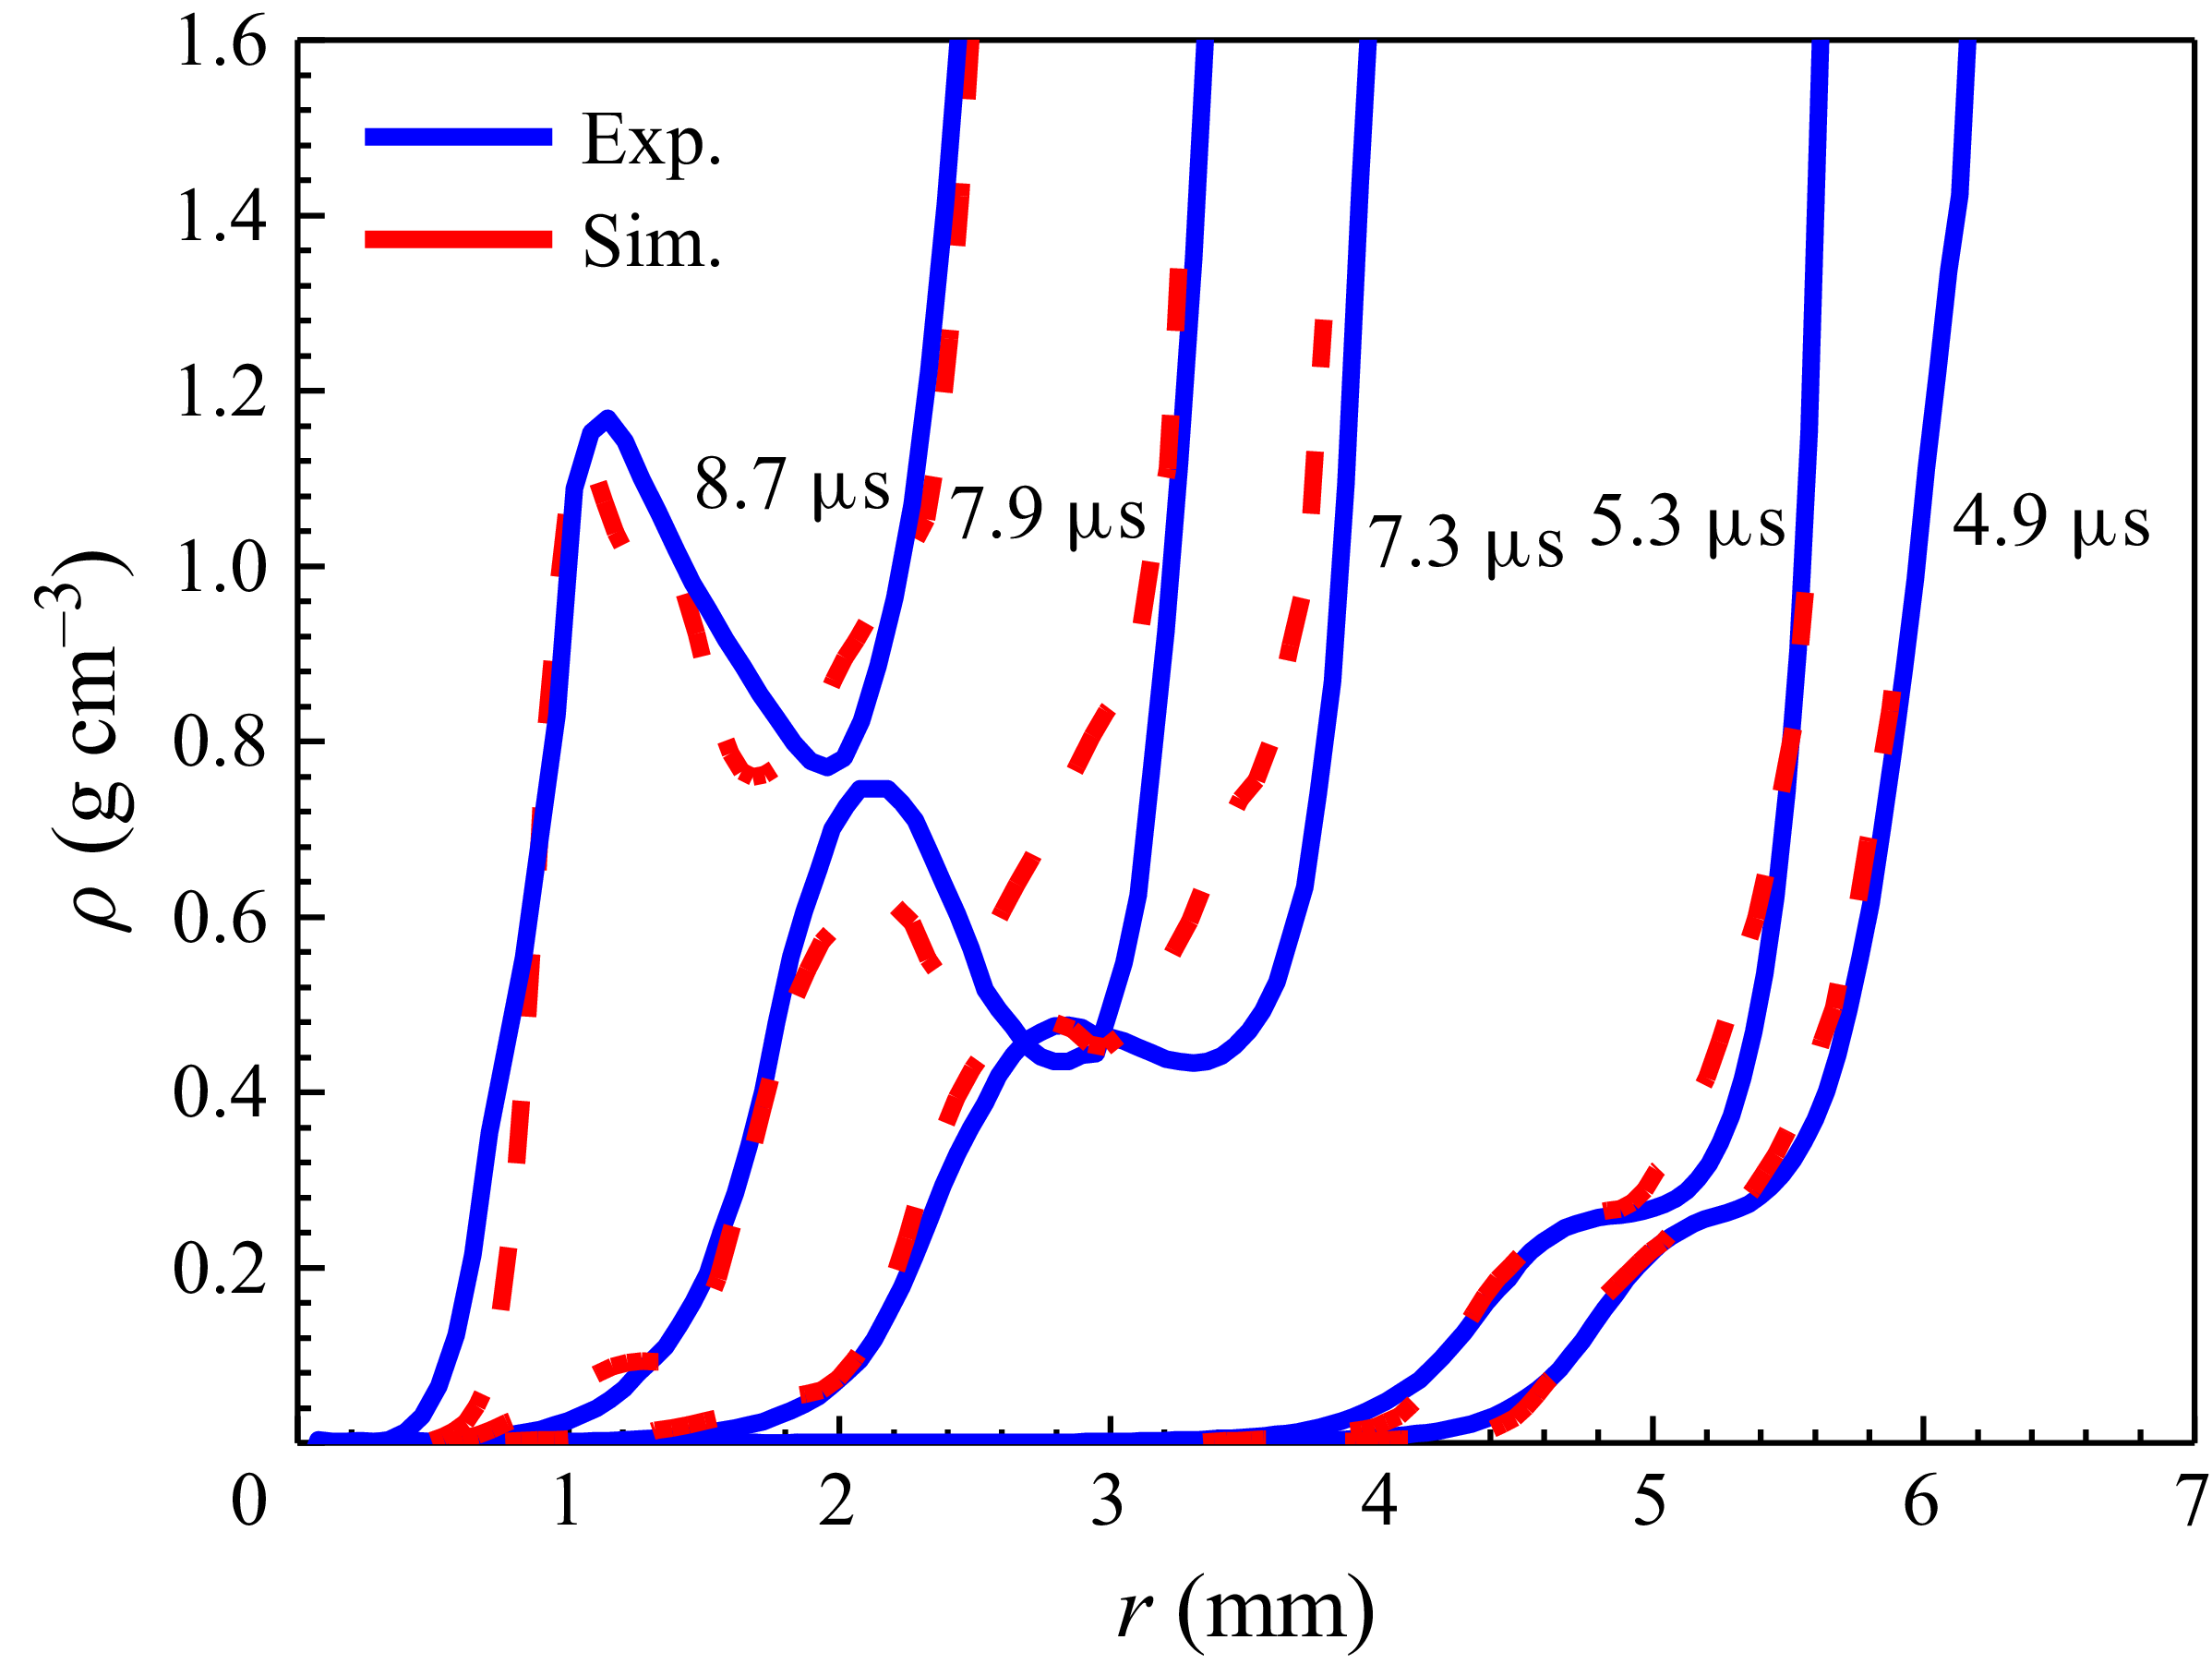
The ejecta density was extracted from the light intensity recorded in the radiographic images. Figure 8 presents the azimuthally averaged radial profiles for the Ar gas cases, where r = 0 mm denotes the central axis of the cylindrical target. At t = 4.9 μs and t = 5.3 μs, the ejecta exhibits a smooth density distribution that increases gradually from the inner leading edge toward the outer rear. By t = 7.3 μs, the ejecta continues to converge inward, and a broad density peak of approximately 0.48 g cm−3 emerges at r = 2.8 mm, which is attributed to the drag-induced particle accumulation at the ejecta front. A distinct transition occurs when the rebounding gas shock impinges on the ejecta front. From t = 7.3 μs to t = 8.7 μs, the radial width of the ejecta shrinks significantly, and the previously smooth distribution is replaced by a sharp, intense high-density concentration at the converging front, which matches the ejecta feature observed in figure 7.
The azimuthally averaged radial profiles of ejecta density extracted from X-ray radiographs for the Ar gas experiments (blue solid lines) at t = 4.9 μs, 5.3 μs, 7.3 μs, 7.9 μs and 8.7 μs, compared with simulation results (red dashed lines).

As shown in figure 8, the calculated ejecta density profiles are in qualitative agreement with experimental data across all moments, capturing the drag-dominated gradual evolution in the early phase, as well as the shock-induced abrupt density concentration in the late stage. However, simulations underestimate the density in the front half of the ejecta while overestimating it in the rear half, indicating that the drag effect and subsequent mass transfer within the ejecta layer (from the front to the rear) are weaker than expected. This discrepancy may stem from an underestimation of large particles in the initial simulation set-up, as these particles are more resistant to drag and contribute more to front-side density in the experiments. The liner-on-target shock pressure is approximately 11.0 GPa, below the melting threshold for Sn. According to Sorenson’s measurement, shock-induced ejecta particles larger than 100 μm were observed in unmelted aluminium samples, suggesting that the proportion of large particles in the size distribution could be higher for ejecta generated from unmelted metals (Sorenson et al. Reference Sorenson, Minich, Romero, Tunnell and Malone2002). Additionally, the application of the particle breakup model and the selection of key parameters should be further validated with experiments for conditions of present interest, as inaccuracies in these aspects could significantly affect the particles’ size evolution, and their motions as well.
Figure 9(a) presents the calculated trajectories of the Sn inner surface, the ejecta front and the gas shock front for the Ar gas experiment, while the gas shock positions extracted from optical schlieren images are also shown as a comparison. Figure 9(b) illustrates evolutions of ejecta width and averaged ejecta density throughout the entire transport process in Ar. It is indicated that, after being generated from the inner surface, the ejecta experiences a long-period and continuous spreading out due to its high initial velocity, although particles are decelerated by the drag force. The ejecta width expansion is halted at 7.6 μs when its front collides with the rebounding gas shock wave. The subsequent shock-particle interaction (SPI) lasts approximately 1.0 μs, resulting in rapid particle deceleration and compression of the ejecta front to a higher density. As will be shown in the next section, interaction with the recompressed gas flow triggers rapid changes in particle size and motion, leading to the establishment of inter-phase dynamic equilibrium by the end of this short period. Once the penetrating gas shock wave is attenuated by the particle-laden flow, the ejecta–gas mixture undergoes sustained compression by the imploding Sn liner. The volume fraction of particulate ejecta and its equivalent density continue to increase until the effect of inter-particle collisions becomes strong enough to counteract aerodynamic forces. Therefore, it is convenient to divide the ejecta transport into three time-sequential stages: the post-shock transport (PST) stage, the SPI stage and the dense ejecta compression (DEC) stage. The inter-phase coupling and dominant mechanisms of the particle dynamics at each stage will be discussed in the following section.
(a) Calculated trajectories of the Sn inner surface (black solid line), the ejecta front (red solid line), and the gas shock front (blue dashed line) for the Ar gas experiment, where the gas shock positions (blue circles) extracted from optical schlieren images are also shown as a comparison. (b) Evolution of ejecta width in Ar gas (red solid line) compared with that in vacuum (black dashed line), and averaged ejecta density variation (blue solid line) during transport. Three time-sequential stages are identified: the PST stage, the SPI stage and the DEC stage.

4.2. Particle dynamics and ejecta evolution
In this section, the dynamics of ejecta transporting in Ar gas is discussed with numerical results from CELP simulations.
Within a time period of ∼ 7.6 μs subsequent to the shock wave breakout at the Sn surface, ejecta particles are in transport in the increasingly dense post-shock gas. The inherent velocity distribution of particles leads to ejecta width expansion, and the decreasing particle volume fraction makes the contribution of inter-particle collision negligible. Thus, the hydrodynamic drag force and particle breakup dominate the particle dynamics and ejecta evolution during this period. Figure 10(a) shows the velocity histories of a set of individual particles with different initial radii and velocities in the PST stage. Note that, all particles start with initial speeds higher than the surrounding gas, and slow down due to aerodynamic drag forces. Since the effect of gas drag increases with the interphase relative velocity, high velocity particles born at the ejecta front will lose their velocity quicker than those at the rear.
(a) Velocity histories of particles with different initial velocities and radii in the PST stage. (b) The relationship between the maximum stable particle radius and gas–particle relative velocity for the critical Weber number We cri = 4.0 in Ar (red) and in He (blue). Parameter space covered by the initial value of ejecta particles is circled with dashed lines.

Considering only aerodynamic drag force, the equation of motion for a particle moving in a gas with velocity u g is
 \begin{align}\frac{4}{3}\pi r_{p}^{3}\rho _{p}\frac{\mathrm{d}u_{p}}{\mathrm{d}t}=\frac{1}{2}\pi C_{D}r_{p}^{2}\rho _{g} | u_{g}-u_{p}| \big(u_{g}-u_{p}\big),\end{align}
The drag coefficient takes the standard form with finite particle volume fraction correction
 \begin{align}C_{D}=\frac{24}{Re}\left(1+\frac{1}{6}Re^{2/3}\right)\left(1-\alpha \right)^{2.65}.\end{align}
The Reynolds number is defined by
 \begin{align}Re=\frac{2\rho _{g}r_{p} | u_{g}-u_{p}| }{\mu _{g}}.\end{align}
In the above equations, ρ g , μ g , ρ p , r p and α p are the gas density, gas kinematic viscosity, particle density, particle radius and particle-phase volume fraction, respectively. Then we get
 \begin{align}\frac{\mathrm{d}u_{p}}{\mathrm{d}t}=\frac{9}{2}\frac{\mu _{g}}{r_{p}^{2}\rho _{p}} \left(1+\frac{1}{6}\mathit{Re}^{2/3} \right)(1-\alpha)^{2.65}\big(u_{g}-u_{p}\big)=\frac{1}{\tau _{p}}\big(u_{g}-u_{p}\big), \\[-28pt] \nonumber \end{align}
 \begin{align}\tau _{p}=\frac{2}{9}\frac{\rho _{p}r_{p}^{2}}{\mu _{g}\left(1+\frac{1}{6}Re^{2/3}\right)}\frac{1}{\big(1-\alpha _{p}\big)^{2.65}}. \\[0pt] \nonumber\end{align}
Here, τ p is the aerodynamic response time, characterising the rate of the velocity relaxation process between the particle and gas. For a high-speed particle with an initial radius of 10.0 μm and a relative Reynolds number Re ∼ 104 (corresponding to α p = 0.005 and u p = 1.21 km s−1), over 90 μs would be required to reach dynamic equilibrium with the surrounding gas. Actually, liquid particles of this size will break up during transport, significantly accelerating the inter-phase coupling process. As shown in figure 10(a), the breakup of a large particle leads to an immediate increase in the drag force, causing rapid particle deceleration.
For the case presented here, the gas shock temperature estimated from the hydrodynamic simulation is approximately 1700 K, making it reasonable to assume that all ejecta particles melt into a liquid state shortly after ejection. We define the particle Weber number as We ≡ ρ
g
r
p
|
u
g
–
u
p
|2/σ
p
, where σ
p
represents the particle surface tension coefficient. According to the Taylor analogy breakup (TAB) model, surface tension stabilises liquid the particles when We
 $ \leqslant $
4.0 (O’Rourke et al. Reference O’Rourke and Amsden1987; Buttler et al. Reference Buttler2017). Figure 10(b) illustrates the maximum stable radius r
p,stable
(corresponding to We = 4.0) for relative velocity |
u
g
−
u
p
| ranging from 0.1 to 2.0 km s−1. The initial values of the ejected particles are circled with dashed lines. In the Ar case, particles with r
p
 $ \leqslant $
0.8 μm remain unbroken during the PST stage, even at the maximum relative velocity of ∼ 440 m s−1.
Under the combined effects of aerodynamic breakup and size-dependent aerodynamic drag, unstable large particles deform and break up into smaller fragments that decelerate more rapidly. As a result, among all particles, only the largest ones that satisfy the aerodynamic stability criteria dominate the ejecta front. Figure 11 illustrates calculated particle distributions at t = 5.9 μs, demonstrating the impact of this aerodynamic size-sorting mechanism on the ejecta state. After over 5 μs transport in the PST stage, the high-speed particles at the front undergo at least one aerodynamic breakup event, thereby achieving aerodynamic stability. The ejecta front now is dominated by particles with a radius r
p
∼ 1.0 μm, corresponding to a Weber number We ∼ 3.5 that lies just below the critical threshold. Meanwhile, smaller particles and breakup products with r
p
∼ 0.5 μm lag behind as a result of more pronounced aerodynamic deceleration. In contrast, particles with r
p
 $ \geqslant $
2.0 μm are predominantly concentrated in the rear region of the ejecta, where the relative velocity diminishes to a magnitude sufficient to ensure the stability of large particles even in the absence of breakup.
Simulated distributions of (a) gas–particle relative velocity, (b) particle radius r p , (c) number of particle breakups and (d) particle Weber number of Ar gas experiment at t = 5.9 μs in the PST stage.

Figure 12 shows the temporal evolution of ejecta profiles along the radial direction during the PST stage, where the gas–particle relative velocity
 $ \langle \Delta u \rangle $
, particle radius
 $ \langle r_{p} \rangle $
and Weber number
 $ \langle \textit{We} \rangle $
are calculated as number-averaged values. It is evident that the reduction of particle size primarily occurs within the first 3 μs, with the majority of high-speed particles achieving aerodynamic stability through breakup during this period. The aerodynamic size-sorting process and the mass transport along the gas flow are progressively completed within the subsequent 4 μs. At the end of the PST stage, the relative velocity at the ejecta front decreases from an initial 440 to approximately 240 m s−1, with the average particle radius below 1 μm. Decelerated small particles and breakup fragments accumulate in the ejecta’s central region, elevating the density distribution to form a distinct peak that disrupted the initially monotonic density profile.
Evolutions of ejecta profiles in the PST stage: (a) ejecta density ρ
ejecta
, (b) number-averaged gas–particle relative velocity
 $ \langle \triangle u \rangle $
, (c) number-averaged particle radius
 $ \langle r_{p} \rangle $
and (d) number-averaged Weber number
 $ \langle \textit{We} \rangle $
.

Snapshots of Ar gas experiment simulation and radial profiles for ejecta and gas properties at (a) t = 7.5 μs, (b) t = 7.9 μs and (c) t = 8.5 μs.

Simulated distributions of (a) particle Weber number, (b) number of particle breakups, (c) particle radius and (d) ejecta density of Ar gas experiment at t = 8.1 μs.

When the rebounding gas shock wave collides with the ejecta, rapid interphase exchanges of momentum and energy exert significant influence on both particles and the gas flow. This SPI is a key feature of ejecta transport in converging flows, distinguishing it from those in planar systems. Figure 13 shows the radial profiles of ejecta and gas flow during the SPI stage, including ejecta and gas density ρ, velocity u, averaged particle radius
 $ \langle r_{p} \rangle $
and averaged particle accelerations
 $ \langle \textrm{d}u_{p}/\textrm{d}t \rangle $
induced by three key force components, aerodynamic drag, pressure-gradient force and inter-particle collision force. The rebounding shock wave recompresses the Ar gas and reverses its flow direction from inward to outward. The sudden increases in gas density and interphase relative velocity lead to a rapid rise in Weber number, causing particles that were already stable in the converging gas flow to break up again shortly after shock wave impingement. Figure 14 illustrates the spatial distribution of particle properties at t = 8.1 μs, while the rebounding gas shock is propagating within the ejecta. According to the simulation result, particles swept over by the rebounding shock wave have an average radius of ∼ 0.2 μm, much smaller than their pre-impact size. Particles of this size are light enough to move with the ambient gas, enabling rapid establishment of inter-phase velocity equilibrium. Consequently, the ejecta front is further compressed to higher density due to the shock wave impact. During the SPI stage, the gas pressure-gradient force does contribute to the particle dynamics, but this effect is relatively weak and dissipates quickly after the shock wave passes. Thus, the dominant mechanisms of inter-phase coupling at this stage are still hydrodynamic particle breakup and drag forces from the gas recompressed by the rebounding shock wave. On the other hand, coupling with particles modifies the shock wave structure. As the shock wave propagates through the ejecta, it rapidly loses energy and momentum, with a noticeable decay in shock strength evident from the decrease in post-shock velocity. Before the penetrating shock wave is fully dispersed, the ejecta–shock interaction lasts approximately 1.0 μs. Within this short period, the ejecta width decreases by more than 30 %, and the averaged ejecta density increases from 0.55 g cm−3 to a value about 0.9 g cm−3. In addition to the penetrating shock wave, reflected converging waves are generated by the ejecta–shock interaction, propagating radially inward to help confine and compress the gas to higher density. As reported by Ling et al. (Reference Ling, Wagner, Beresh, Kearney and Balachandar2012) and Xue et al. (Reference Xue, Miu, Li, Bai and Tian2023), new reflected shock waves are generated when a gas shock wave impinges on a dense particle layer. However, under the present experimental conditions, the ejecta exhibits relatively low particle concentration and a gradual density increase from the front to the rear. For the gas shock wave propagating through such low-density ejecta, SPIs result in continuously reflected compression waves rather than shock waves (see figure 2
a).
In the last stage of ejecta transport, the particulate mixture is highly compressed to a state where inter-particle interactions must be considered. Figure 15 illustrates the radial profiles of ejecta and gas flow at three typical times. As shown in the bottom subfigure, the effect of the inter-particle collision force becomes comparable to that of aerodynamic drag, and even locally exceeds it. Notably, at the ejecta front, the accelerations induced by inter-particle collisions and aerodynamic drag are equal in magnitude but opposite in direction. This counterbalancing effect is critical for driving the further centripetal convergence of particles. In addition, the inter-particle collision prevents excessive particle stacking, ensuring the particle volume fraction and ejecta density are maintained within a reasonable range. For the present case, the ejecta density increases to ∼ 2.5 g cm−3 at 9.7 μs, corresponding to a particle volume fraction of approximately 35 %, and maintains this value until the particulate front reaches the axis of symmetry. Thus, high-frequency inter-particle collisions emerge as one of the key mechanisms governing particle motion and the dynamic evolution of ejecta width during the DEC stage. Additional simulation results indicate that the equilibrium volume fraction depends in part on the modelling of inter-particle collisions and the parameters used, which will require further validation with data from future specially designed experiments.
Snapshots of Ar gas experiment simulation and radial profiles for ejecta and gas properties at (a) t = 8.9 μs, (b) t = 9.3 μs and (c) t = 9.7 μs.

4.3. Effect of gas species
To investigate the effect of different gas species, experiments were carried out with identical loading condition and target design, but filled with 3.0 bar He gas. Considering that the shock loading process and the Sn surface roughness conditions remain consistent, it is reasonable to conclude that the ejecta source shows no significant change compared with Ar cases. Thus, the primary factor affecting the ejecta transport evolution process stems from the variation in gas species.
Figure 16(a) shows the calculated trajectories of the He case, which are consistent with those extracted from optical schlieren images. The He shock wave converges at a speed of D = 1.7 km s−1 (Ma ∼ 1.67), much higher than that of the ejecta front. The rebounding shock wave collides with the ejecta at 6.1 μs, approximately 1.5 μs earlier than the Ar case. Figure 16(b) illustrates the ejecta width evolution in He gas with stage divisions of the process, alongside comparative results in Ar gas and in vacuum. No evident slowdown of the ejecta front is observed throughout the PST stage, suggesting that the drag force exerted by He is far less than that by Ar gas. Equations (4.3)–(4.5) indicate that, under conditions of identical particle size, interphase relative velocity and comparable gas viscosity, aerodynamic deceleration is positively correlated with gas density. For the present situation, the initial density of He gas is only approximately 1/10th of that of Ar, resulting in lower particle Reynolds numbers, reduced aerodynamic effects and prolonged time to achieve velocity equilibrium with the gas flow field. Furthermore, the reduction in aerodynamic drag enhances the aerodynamic stability of particles.
(a) Calculated trajectories of the Sn inner surface (black solid line), the ejecta front (red solid line) and the gas shock front (blue dashed line) for the He gas experiment, compared with those extracted from optical schlieren images (red and blue circles). (b) Calculated ejecta width evolution in He gas with stage divisions of the process (blue solid line), compared with results in Ar gas (red solid line) and in vacuum (black dashed line).

Simulated particle distributions at different time in the He gas. (a) Number of particle breakups and (b) particle radius at t = 5.9 μs. (c) Number of particle breakups and (d) particle radius at t = 6.5 μs.

Ejecta density profiles extracted from radiographs of He gas experiments (blue solid lines) compared with CELP simulation results (red dashed lines).

Figure 17 presents the spatial distributions of particle radius and number of breakups at 5.9 and 6.5 μs, respectively. According to the simulations, all particles remain hydrodynamically stable until swept over by the rebounding shock wave. In contrast, a significant number of high-speed particles have already broken up into sizes below 1 μm in Ar gas during the PST stage, as shown in figure 11(b). After shock wave passage, previously stable particles undergo one to two consecutive aerodynamic breakups, reducing the average particle radius from 3.5 to ∼ 0.2 μm. As will be shown in the next section, although such small particles couple more effectively with the gas flow, they require a longer time to achieve velocity equilibrium than in Ar gas. These gas-dependent differences in aerodynamic deceleration and particle breakup lead to divergent ejecta width evolutions. Specifically, Ar gas causes significant ejecta width reduction during the SPI stage, while He gas permits continued but slower expansion. Radial density profiles of the ejecta, extracted from experimental radiographs, are shown in figure 18. There is no evident variation of density profiles for the first three images, until a density enhancement appears in the last image at the ejecta front due to shock wave collision. X-ray radiographs and optical images of He gas experiments are provided in Appendix B.
5. Model of ejecta width evolution
In this section, a theoretical model for the temporal evolution of ejecta width in a shock-induced cylindrically converging flow is established based on the following assumptions and approximations:
-
(i) Drag force is the dominant mechanism governing particle dynamics at the ejecta front for the PST and SPI stages, while the effects of the pressure-gradient forces on particle motion is ignored.
-
(ii) Particles are either ejected in a liquid state or, if ejected as solids, melt rapidly due to gas–particle heat transfer.
-
(iii) Particles with Weber number We>4.0 will break up instantly into small fragments.
-
(iv) The position of the ejecta front is defined by a critical particle volume fraction, i.e. α p,front = 0.005 for the present study (the subscript front denotes values at the ejecta front).
-
(v) The gas is assumed to follow the ideal-gas law.
The ejecta width δ ejecta is defined as
 \begin{align}\delta _{\textit{ejecta}}=r_{\textit{inner}}-r_{\textit{front}},\end{align}
where r
front
and r
inner
are the radii of the ejecta front and target liner inner surface, respectively. Assuming the liner is incompressible during the implosion, then its cross-sectional area remains constant, i.e.
 $\pi (r_{\textit{outer}}^{2}-r_{\textit{inner}}^{2})=\textit{const}$
. The velocity of any point of the liner is
 $ u(r) = r_{\textit{inner}} u_{\textit{inner}} /r $
. Therefore, the total kinetic energy of the target liner can be written as
 \begin{align}E_{k}=\int _{r_{\textit{inner}}}^{r_{\textit{outer}}}\pi rh\rho _{\textit{liner}}\frac{r_{\textit{inner}}^{2}}{r^{2}}u_{\textit{inner}}^{2}\mathrm{d}r=\pi r_{\textit{inner}}^{2}u_{\textit{inner}}^{2}h\rho _{\textit{liner}}\mathit{\ln } \frac{r_{\textit{outer}}}{r_{\textit{inner}}},\end{align}
where h, ρ liner , r outer are the height, density and outer radius of the liner, respectively. Since the effect of gas pressure on the liner dynamics is negligible with finite convergence ratio (CR, initial radius/final radius), i.e. CR<10, the motion of target liner is only influenced by the strength of unmelted metal and the geometric effect of cylindrical convergence. Assuming the liner is rigid plastic, the change in kinetic energy comes entirely from the plastic work done during the implosion. Therefore, we have
 \begin{align}\frac{\mathrm{d}E_{k}}{\mathrm{d}t}=\int _{0}^{\varepsilon _{p}}\sigma d\varepsilon _{p}=2\pi nYh\int _{r_{\textit{inner}}}^{r_{\textit{outer}}}u\left(r\right)\mathrm{d}r=2\pi nYhr_{\textit{inner}}u_{\textit{inner}}\mathit{\ln } \frac{r_{\textit{outer}}}{r_{\textit{inner}}},\end{align}
where σ and ε
p
are the equivalent stress and equivalent plastic strain. Parameter
 $n = 2/\sqrt{3}$
represents the Mises yield criterion. If only the influence of material plastic strain hardening is considered, the dynamic yield strength can be approximately calculated by Y = Y
0(1 + βε
p
)
m
, where m and β are material constants of strength model given by Steinberg (Reference Steinberg1996). From equations (5.2) and (5.3), we get
 \begin{align}\frac{\mathrm{d}u_{\textit{inner}}}{\mathrm{d}t}=\left[\frac{r_{out}^{2}-r_{\textit{inner}}^{2}}{2r_{out}^{2}\mathit{\ln } \left(r_{out}/r_{\textit{inner}}\right)}-1\right]\frac{u_{\textit{inner}}^{2}}{r_{\textit{inner}}}+\frac{nY_{0}}{\rho _{\textit{liner}}r_{out}}\left(1+\beta \varepsilon _{p}\right)^{m}.\end{align}
The trajectory of the inner surface is obtained by the integration
 \begin{align}r_{\textit{inner}}(t)=r_{\textit{inner},0}+\int _{0}^{t}u_{\textit{inner}}\left(\tau \right)\mathrm{d}\tau .\end{align}
Figure 19(a) presents the results of (5.4) and (5.5) using initial conditions of the Ar gas experiment, along with their comparison with the hydrodynamic simulation results. The deviation in liner trajectories and velocities at large CRs arises from the absence of gas pressure effect.
The model results and simulation solutions of (a) trajectory and velocity of Sn liner’s inner surface, (b) trajectory and velocity of gas shock wave, for the Ar case.

Since the drag effect decreases with increasing particle size, it is reasonable to assume that the ejecta front is composed with largest particles that are hydrodynamically stable against the gas flow, as shown in figure 11(b). Using the definition of critical Weber number, the upper limit of the particle radius at the ejecta front r p,front can be obtained by
 \begin{align}r_{p,\textit{front}}=\frac{We_{cri}\sigma _{p}}{\rho _{g} | u_{p}-u_{g}| ^{2}}.\end{align}
According to the assumption that only the drag force contributes to the particle motion for the first two stages, the movement of ejecta front with finite volume fraction can be expressed as
 \begin{align}\frac{\mathrm{d}u_{\textit{front}}}{\mathrm{d}t}=\frac{u_{bal,\textit{front}}-u_{\textit{front}}}{\left(1-\chi _{p.\textit{front}}\right)\tau _{p,\textit{front}}}, \\[-28pt] \nonumber \end{align}
 \begin{align}\chi _{p,\textit{front}}=\frac{\alpha _{p,\textit{front}}\rho _{p}}{\alpha _{p,\textit{front}}\rho _{p}+(1-\alpha _{p,\textit{front}})\rho _{g,\textit{front}}}, \\[-28pt] \nonumber \end{align}
 \begin{align}u_{bal,\textit{front}}=\chi _{p.\textit{front}}u_{p,\textit{front}}+(1-\chi _{p.\textit{front}})u_{g,\textit{front}}, \\[0pt] \nonumber \end{align}
where χ p,front is the mass fraction of particles, u bal,front is the balanced velocity when the two phases are in dynamic equilibrium and τ p,front is the response time due to the drag force given by (4.5). The post-shock values, ρ g,front and u g,front , can be obtained with the self-similar converging shock solution in a cylindrical geometry. For an ideal gas with a gamma law equation of state, the shock wave motion is of the form
 \begin{align}\hspace{0pt}r_{\textit{shk}}=A\left| \tau _{\textit{shk}}-t\right| ^{\alpha } , \\[-28pt] \nonumber \end{align}
 \begin{align}D=-\frac{\alpha }{\left| \tau _{\textit{shk}}-t\right| }r_{\textit{shk}}, \\[0pt] \nonumber \end{align}
where r shk and D are the shock wave position and velocity and A is a constant related to the initial radius. Parameter α takes the simple form α = 3(γ +1)/[3(γ +1) + γ] given by Teipel (Reference Teipel1976). The time when the shock wave converges at axis τ shk can be obtain by
 \begin{align}\tau _{\textit{shk}}=\frac{\alpha }{\left| D_{0}\right| }r_{\textit{inner},0}, \\[-28pt] \nonumber \end{align}
 \begin{align}\frac{2}{\gamma +1}D_{0}^{2}-u_{g}^{1}D_{0}=\frac{2\gamma }{\gamma +1}\frac{p_{g}^{0}}{\rho _{g}^{0}}, \\[0pt] \nonumber \end{align}
where D
0 is the initial value of shock wave speed, p
0
g
and ρ
0
g
are the initial pressure and density of gas and
 $ u_{g}^{1} $
is the post-shock gas velocity. It is convenient to take
 $ u_{g}^{1} $
≈ u
inner
when the effect of CR is negligible. Taking A = 0.189, α = 0.8276 and t
shk,0
= 6.81 μs for the Ar case, the derived shock wave trajectory and velocity match the simulation results well in figure 19(b).
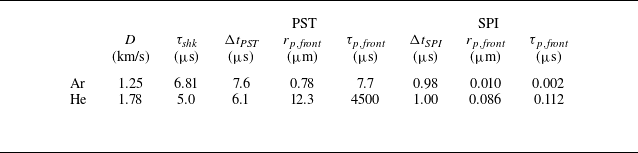
Equation (5.6) yields a value of r p,front = 0.78 μm for front particles travelling in the post-shock Ar gas, with response time τ p,front = 7.7 μs, that is comparable to the duration of the PST stage. This suggests that interphase dynamic equilibrium is nearly established before interaction with the rebounding gas shock wave. For the He case, the maximum radius of stable particles is approximately 12 μm, meaning most particles do not break up during this stage. The drag force is small relative to the particle inertia, and the response time due to aerodynamic forces is nearly two orders of magnitude longer than the transport duration. Figure 20 compares results for different gas species and initial gas pressures, including the temporal evolutions of ejecta width and front velocity during the PST stage. It is indicated that the deceleration of the ejecta front is very limited in the He gas, while noticeable slowdowns are presented for Ar cases and become more evident as the gas pressure increases.
We assume that the duration of the SPI stage has the same scale as the traversal time of the rebounding shock wave passing over the ejecta, and is defined as
 \begin{align}\Delta t_{SPI.}\equiv \frac{\delta _{\textit{ejecta}}}{\left| D-u_{\textit{inner}}\right| }.\end{align}
Here, velocities D and u inner take the values at the moment when the rebounding shock wave collides with the ejecta front. The stable radius for front particles and the corresponding response time can also be obtained by (5.6) and (4.5), but using gas properties recompressed by the rebounding shock wave. Parameters calculated for both the PST and SPI stages are shown in table 1. The maximum stable radii at the SPI stage for the Ar and He cases are ∼ 0.01 and ∼ 0.09 μm, respectively. For both cases, the interphase balance time is far less than the stage duration, and thus it is convenient to set u front = u bal , or otherwise (5.7) should be integrated numerically.
Calculated parameters for both the PST stage (PST) and the SPI stage (SPI).

Temporal evolutions of (a) the ejecta width and (b) front velocity at the PST stage for different gas species and initial gas pressures.

In the final DEC stage, the rebounding shock wave has already dissipated within the ejecta. Other distinct flow structures, such as the reflected compression waves generated by SPIs, decay rapidly due to the short wave-traversal time of the system. Therefore, a dynamic equilibrium hypothesis is proposed for the gas phase, and the gas velocity can be expressed as
 \begin{align}u_{g}\left(r,t\right)=\frac{r}{r_{\textit{inner}}}u_{\textit{inner}}(t).\end{align}
For small particles where τ p is much shorter than the duration of the third stage, their motion is fully coupled with the gas flow. Thus, the front velocity of the ejecta is derived using (5.15) until the average volume fraction reaches a critical value, α p,cri , that accounts for the effect of inter-particle collisions and prevents excessive particle packing. For particles with a finite τ p,front , the motion of ejecta front should be calculated by (5.7).
Figure 21 shows the temporal evolutions of ejecta width for both the Ar and He cases under different initial gas pressures, with experimental measurements and multiphase flow simulations included for comparison. The model successfully predicts the ‘expansion–compression’ variation of the particulate mixture, and the ejecta width is in good agreement with both numerical and experimental results for a gas pressure of 3.0 bar. For higher initial gas pressures, however, the model slightly overestimates the deceleration and compression of the ejecta front caused by shock wave impact. One possible reason is the one-way coupling assumption adopted in the present model, which assumes particles have a negligible effect on the carrier phase. In reality, ejecta particles with a finite volume fraction do accelerate the ambient gas, reducing interphase relative velocity and thereby weakening the drag effect. Another factor contributing to the width deviation could be of that the ejecta front velocity is underestimated by using the values of particles with maximum stable radius. The present model assumes that particles unstable to hydrodynamic forces break up instantaneously when the Weber number exceeds critical value. In fact, large particles undergo a significant period of deformation before breakup, during which these large but unstable particles occupy the ejecta front positions, rather than the smaller, stable particles given by (5.6).
Model predictions of ejecta width evolutions in a cylindrically converging system filled with Ar and He gases, compared with multiphase flow simulation and experimental results.

To further investigate the specific effects on ejecta width evolution, multiphase flow simulations were conducted under different conditions, including: implementation of the one-way coupling assumption in CELP simulations, wherein particles undergo deceleration in the gas phase without exerting momentum or energy feedback on the surrounding gas; adoption of the instantaneous particle breakup assumption in CELP simulations, wherein particles undergo immediate breakup upon satisfying
 $ \textit{We} \gt 4.0 $
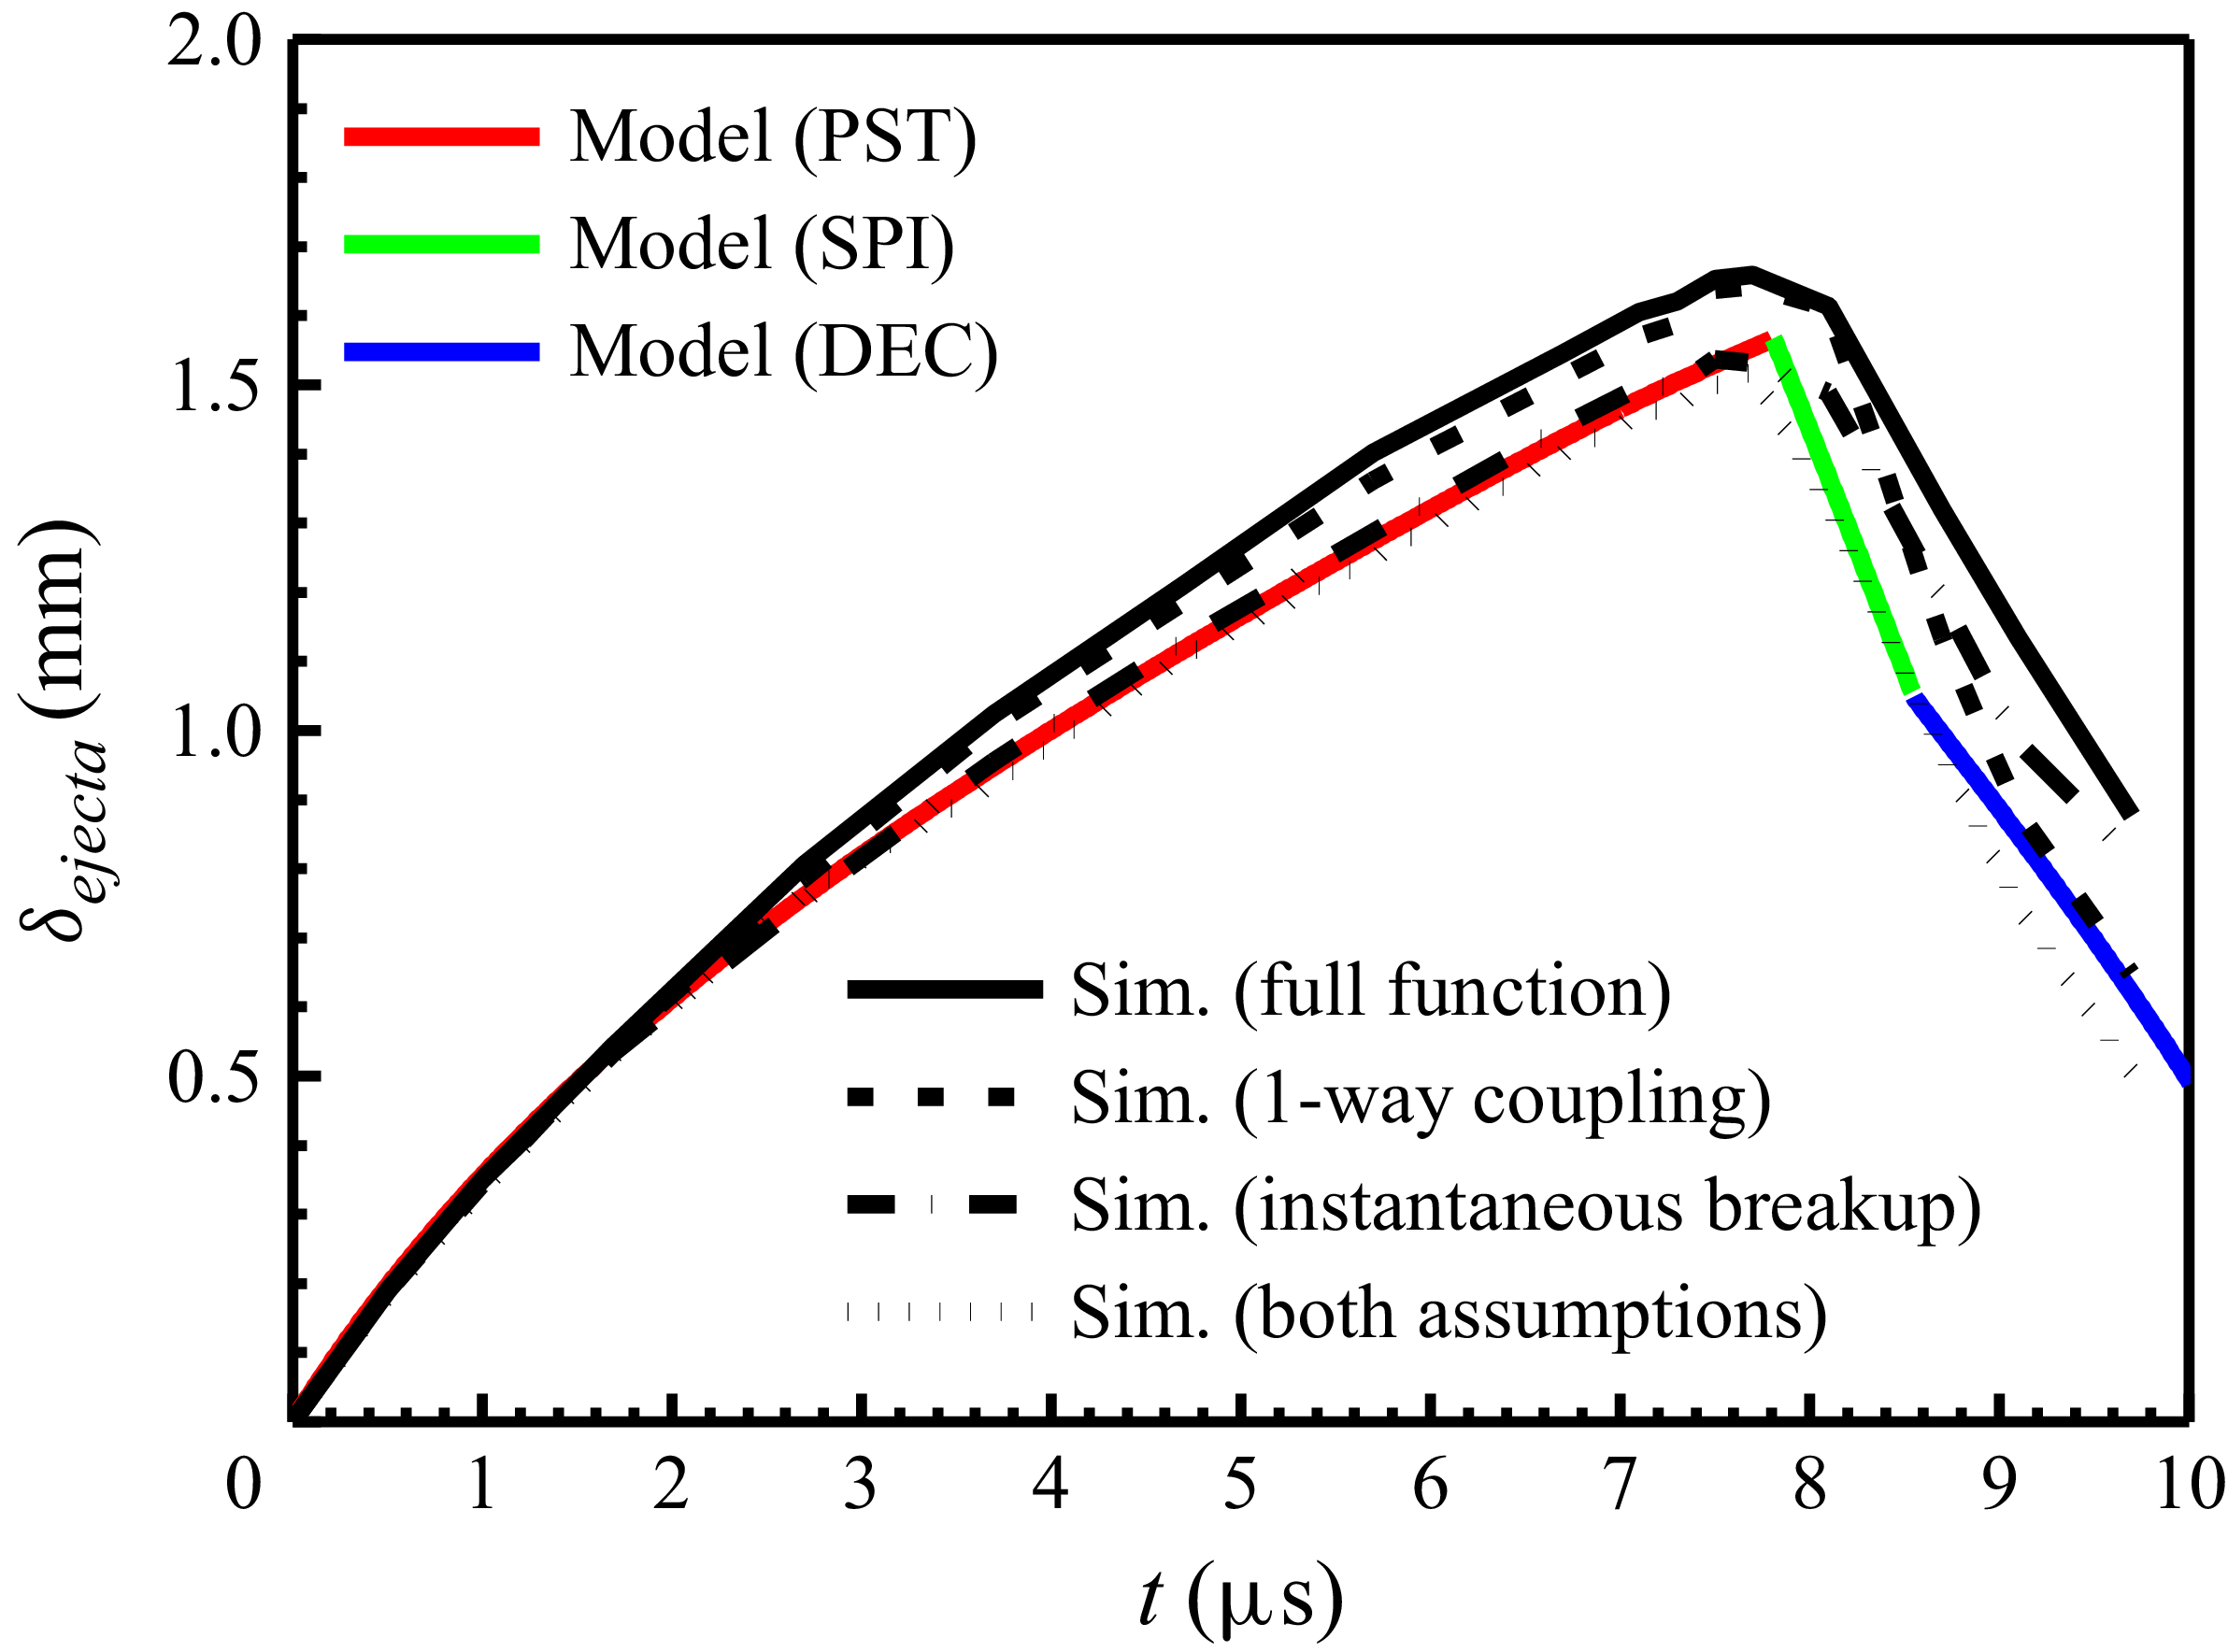
, bypassing particle oscillation and deformation; concurrent integration of both the one-way coupling assumption and the instantaneous breakup assumption. Simulated ejecta width evolutions in 5.0 bar Ar are compared with the model prediction, as shown in figure 22. It is revealed that the one-way coupling assumption leads to a more rapid reduction in ejecta width during the SPI stage. This behaviour stems from the neglect of particle-induced shock dissipation, which allows shock wave intensity to remain insufficiently attenuated as it propagates through the ejecta, resulting in overestimated particle deceleration. The instantaneous breakup assumption accelerates the breakup process, particularly for large unstable particles that would otherwise require microsecond-scale deformation periods. The resultant reduction in particle radius significantly enhances aerodynamic drag during the PST stage, suppressing the ejecta expansion rate. However, during the SPI stage, the inherent brevity of particle deformation under intense shock impingement minimises the influence of the instantaneous breakup assumption on particle size evolution. Thus, deviations in ejecta width evolutions do not further increase during the SPI stage. When both assumptions are implemented concurrently, appreciable changes in ejecta width are observed in both the PST and SPI stages, with predictions showing enhanced agreement with the theoretical model, thus verifying the proposed discrepancy mechanism.
Comparison of the model prediction (coloured lines) of ejecta width evolutions in 5.0 bar Ar gas with simulation results under various assumptions: result from the full functional multiphase flow simulation (black solid line), with one-way coupling assumption (black dashed line), with instantaneous breakup assumption (black dash dot line) and with both of the assumptions (black dotted line).

6. Conclusions
In the present work, the dynamic evolution of ejected particles in shock-induced converging gases is investigated through magnetically driven experiments, four-way coupled multiphase flow simulations and theoretical modelling. It is revealed that ejecta transport in cylindrically converging geometries differs significantly from that in planar systems, primarily due to features such as interaction with the rebounding gas shock wave and continuous compression by the imploding liner.
Based on numerical and experimental results, ejecta transport in converging gas can be divided into three sequential stages: PST, SPI and DEC. In the PST stage, particles undergo a drag-dominated deceleration in the post-shock gas, during which they slow down and break up into smaller fragments that are more easily coupled with the gas flow. Most particles reach interphase equilibrium before colliding with the rebounding gas shock wave. In the subsequent SPI stage, shock wave impingement causes the median particles to further break up into fragments of ∼ 0.1 μm or less, which can be fully coupled with the gas. This leads to rapid deceleration of the ejecta front and significant compression of the particulate mixture over a short period. In the final DEC stage, the rebounding gas shock wave has been fully dissipated. The ejected materials, along with the gas, are compressed into a dense state where inter-particle collisions cannot be ignored. Gas properties exert a significant effect on ejecta dynamics: Ar generates stronger drag and shock-particle coupling effects, leading to ejecta width contraction during the SPI stage, while the weaker aerodynamic effects in He allow sustained ejecta expansion within both the PST and SPI stages. Integrating self-similar converging shock solutions and particle–gas coupling dynamics, the established theoretical model successfully predicts the three-stage width evolution of ejecta, showing good agreement with experimental and simulation results. The development of this theoretical model provides valuable reference for predicting ejecta mixing evolution in converging geometry applications such as ICF and MTF, and contributes to the optimisation of target structures and loading conditions in fusion-related applications.
However, ejecta generation and its aerodynamic transport in shock flow are complex multi-scale coupling problems. To capture the main physical mechanisms while reducing problem complexity, the numerical model adopts multiple simplifying assumptions, such as neglecting particle rotation and tangential forces, which may introduce subtle deviations in dense particle flow scenarios. The established theoretical model employs one-way coupling and instantaneous breakup assumptions that fail to consider the particle feedback to the surrounding gas. Analysis results indicate that the model can well predict the ejecta width evolution for low-pressure light gases, but it overestimates the ejecta compression for high-pressure heavy gases.
To address these aspects and deepen the mechanistic understanding of ejecta transport in converging gases, future work will focus on several interconnected directions. First, refined numerical modelling will be performed to establish quantitative correlations between gas parameters and key ejecta characteristics. Second, dedicated investigations will be conducted to elucidate the RMI growth mechanism at the ejecta–gas interface under shock impingement. Recent advancements in planar and converging shock tube experimental technologies Luo et al. (Reference Luo, Li, Ding, Zhai and Si2019), Xu et al. (Reference Xu, Wang, Zhai and Luo2023), Jiang et al. (Reference Jiang, Cai, Xie, He, Wang, Si and Luo2024) and Si et al. (Reference Si, Jiang, Cai, Wang and Luo2025) provide robust technical support for this research. Furthermore, the newly developed FP-2 facility, featuring enhanced shock strength, improved loading symmetry, expanded target size and high-time-resolution diagnostic capabilities, will be fully utilised to capture the complete dynamic process of the DEC stage, a phase not fully resolved in the present experiments. This will enable in-depth studies on the dynamics of highly compressed ejecta, including inter-particle collision mechanisms and dense-phase coupling effects with the ambient gas and imploding liner. Specifically, the analytical method for shock attenuation in dense granular media proposed by Han & Xue (Reference Han and Xue2025), which establishes the correlation between particle layer structure and shock propagation characteristics, can provide valuable technical support for the quantitative analysis of dense ejecta dynamics and inter-particle collision mechanisms in subsequent studies.
Funding
This work is supported by the Science Challenge Project (TZ2025016), the National Natural Science Foundation of China (12402293, 12202070, 12402458, 11975054), National Key laboratory of Shock Wave and Detonation Physics (JCKYS2024212110, 2024CXPTGFJJ06410), Presidential Foundation of China Academy of Engineering Physics (YZJJZL2024159, YZJJZL2024014).
Declaration of interests
The authors report no conflicts of interest.
Appendix A. Current repeatability and loading symmetry
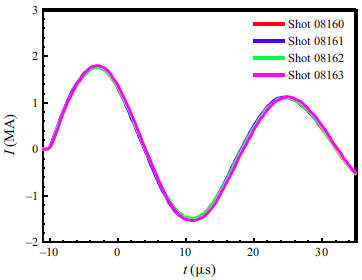
Load currents passing through the liner were collected using Rogowski coils mounted in the load section of the FP-1 facility. Figure 23 shows four measured currents from the Ar gas experiments, with a peak value ∼1.8 MA and a rise time ∼7 μs. Since each shot can only produce one X-ray radiographic image, repeated experiments with identical load geometry, surface finishing, gas pressure, but different image timing were conducted for better understanding of the whole process of eject transport. According to the Rogowski coil data, shot-to-shot current fluctuations are well controlled within ± 2 %, indicating that the FP-1 facility is a highly reliable driver and that the loading process is reproducible.
Load currents of Ar gas experiments measured by Rogowski coils on the FP-1 facility, where the shot-to-shot peak current fluctuations are within ± 2 %.

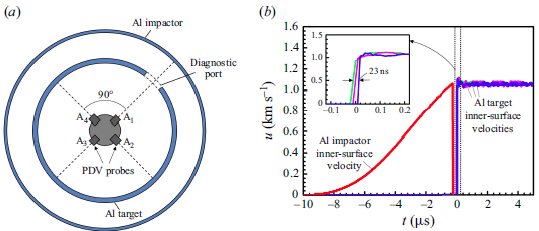
(a) Schematic of load configuration and PDV probes layout for an Al target velocity diagnostics experiment. Probe A1 aimed at the inner-surface velocity of the impactor liner, and probes A2–A4 measured velocities at different positions on the inner surface of the target liner. (b) The PDV velocity profiles of the impactor liner and the target liner, with the inset showing a zoomed-in view of the time axis. The maximum difference in velocity jump-off times at different positions on the target liner is 23 ns.

The loading symmetry of the magnetically driven liner-on-target shock experiment was verified through a standard velocity measurement experiment. The load maintained the same structure and dimensions as previous configurations, with only the target liner material changed from Sn to Al. As shown in figure 24, the set-up employed a built-in four-point PDV system, with probes arranged at 90° intervals. Probe A1 aimed at the inner surface of the impactor through a diagnostic port, while probes A2 to A4 measured velocities at different positions on the target inner surface. Comparative results demonstrated good consistency in liner velocities across measurement points, with the maximum interval of jump-off times not exceeding 23 ns, which is much smaller than the ejecta transport time of interest.
Appendix B. Multi-frame optical images
Figure 25 presents a sequence of four laser backlit optical schlieren images captured in a single shot using He gas as the fill. The first image was taken at 1.86 μs after the shock breakout at the target inner surface, with subsequent images captured at constant intervals of 1 μs. Each image shows a circular gas shock wave with good symmetry, which converges radially toward the axis at approximately 5.1 μs. Since the particulate flow is opaque to visible light even at low volume fractions, the ejecta front can also be identified from the shadowgraph.
Laser backlit multi-frame optical schlieren images obtained at (a) t = 1.86 μs, (b) t = 2.86 μs, (c) t = 3.86 μs and (d) t = 4.86 μs in a He gas experiment, where ejecta fronts are circled with dashed lines.

Figure 26 illustrates four optical schlieren images captured in an Ar experiment. Due to the small distance between the ejecta front and Ar shock wave, the exact position of the ejecta front under the Ar-filled condition cannot be accurately extracted. Therefore, only the positions of the gas shock front are shown in figure 9(a).
Laser backlit multi-frame optical schlieren images obtained in an Ar gas experiment at (a) t = 3.38 μs, (b) t = 5.38 μs, (c) t = 6.38 μs and (d) t = 6.88 μs. The ejecta front in the first image is circled with dashed lines.

Appendix C. X-ray radiographic images of He gas experiments
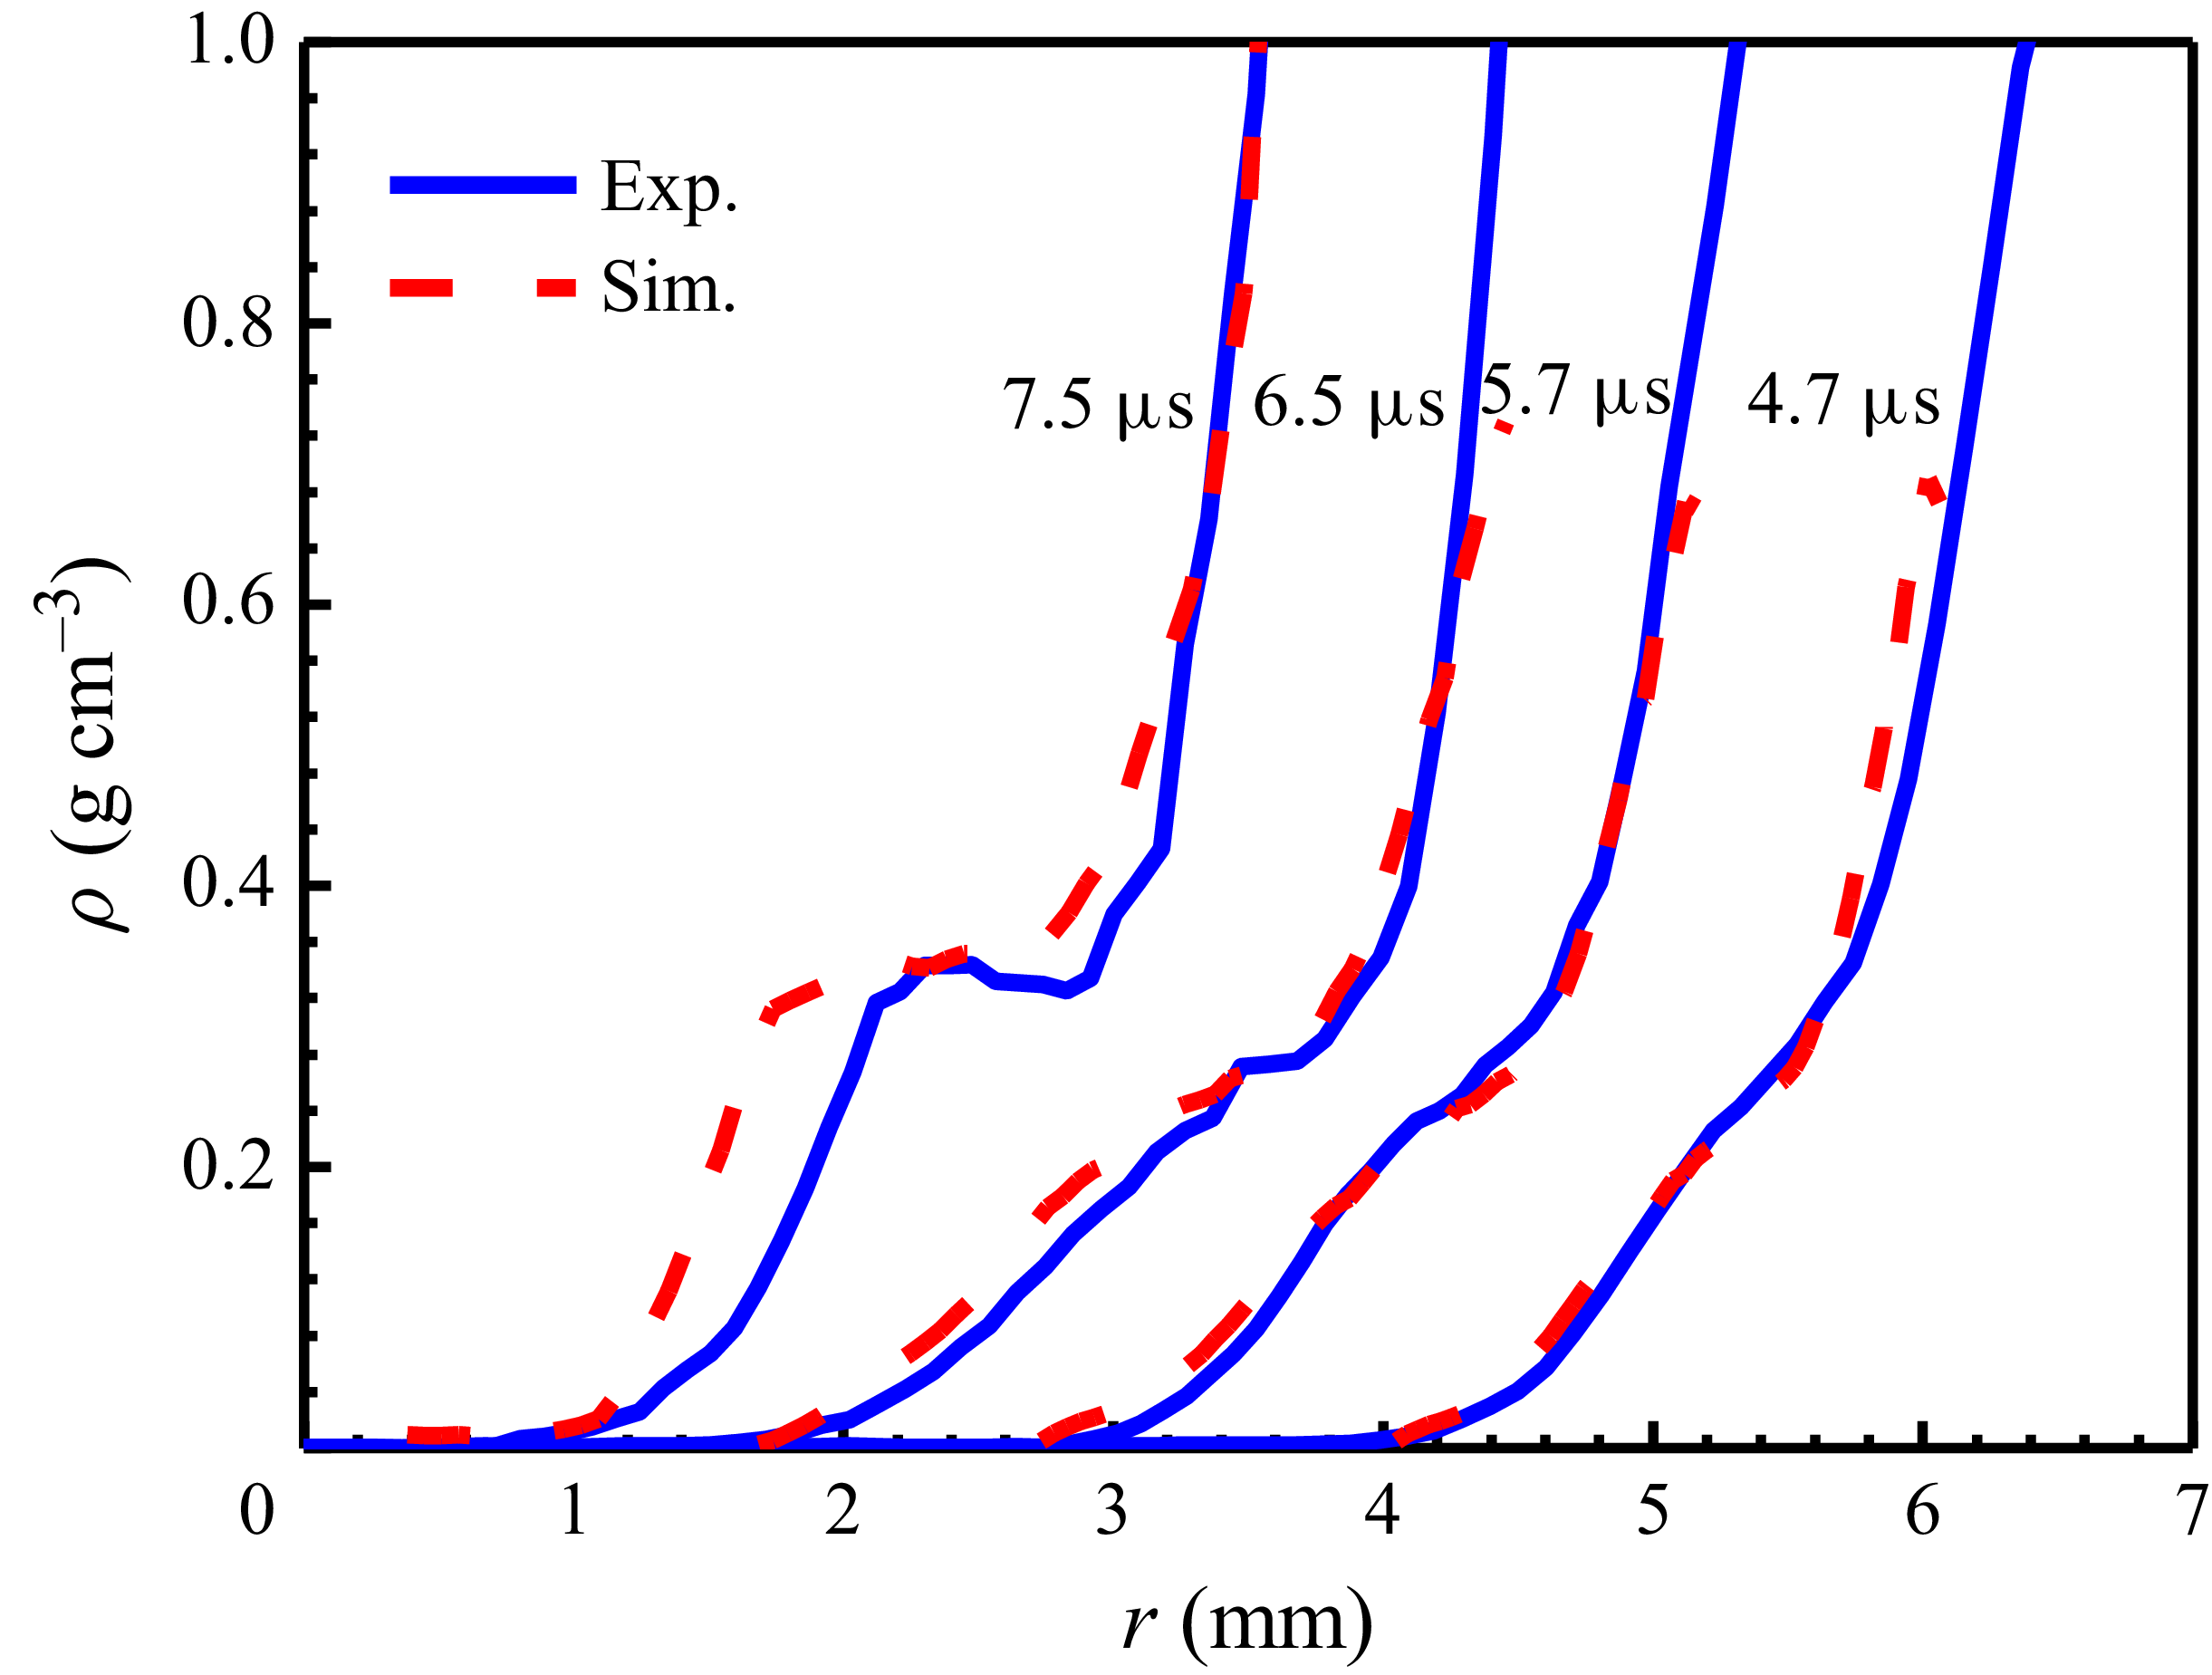
Figure 27 shows X-ray radiographic images obtained from He gas experiments. In the first two images, the ejecta is travelling within the post-shock gas, while the third image captured at 6.5 μs corresponds to the moment when the rebounding shock wave has just passed over the ejecta front. In the last image, a high-density layer appears at the ejecta front as a result of the SPI.
A sequence of four axial X-ray radiographic images captured at (a) t = 4.7 μs, (b) t = 5.7 μs, (c) t = 6.5 μs and (d) t = 7.5 μs in He gas experiments.

Appendix D. Multiphase model
D.1. Governing equations
Since the representative size of ejecta particles is much less than the spatial scales of ejecta transport, particles are treated as point masses and tracked in a Lagrangian framework, while the gas phase uses an Eulerian continuum description (Ling et al. Reference Ling, Wagner, Beresh, Kearney and Balachandar2012; Liao et al. Reference Liao, Lin, Liu, Liu and Lu2025). No chemical reaction is expected between particles and inert gases, and thus the inter-phase coupling only happens via momentum and energy transfer. The governing equations for the gas phase are
 \begin{align}\frac{\partial \left(\alpha _{g}\rho _{g}\right)}{\partial t}+\boldsymbol{\nabla }\boldsymbol{\cdot }\left(\alpha _{g}\rho _{g}\boldsymbol{u}_{g}\right)=0, \\[-28pt] \nonumber \end{align}
 \begin{align}\frac{\partial \left(\alpha _{g}\rho _{g}\boldsymbol{u}_{g}\right)}{\partial t}+\boldsymbol{\nabla }\boldsymbol{\cdot }\left(\alpha _{g}\rho _{g}\boldsymbol{u}_{g}\boldsymbol{u}_{g}\right)=-\boldsymbol{\nabla }\big(\alpha _{g}p_{g}\big)-\frac{1}{V_{cell}}\sum _{i}\boldsymbol{F}_{gp,i}, \\[-28pt] \nonumber \end{align}
 \begin{align}\frac{\partial \left(\alpha _{g}\rho _{g}E_{g}\right)}{\partial t}+\boldsymbol{\nabla }\boldsymbol{\cdot }\left(\alpha _{g}\rho _{g}E_{g}\boldsymbol{u}_{g}\right)=-\boldsymbol{\nabla }\boldsymbol{\cdot }\left(\alpha _{g}p_{g}\boldsymbol{u}_{g}\right)-\frac{1}{V_{cell}}\sum _{i}\left(Q_{gp,i}+K_{gp,i}\right), \\[0pt] \nonumber \end{align}
where ρ g , p g , E g , α g and u g are the density, pressure, total specify energy, volume fraction and velocity of gas. The overall aerodynamic force exerted on a particle from the surrounding gas is represented by F gp,i , and the corresponding work done by it is K gp,i , where the subscript i denotes the particle sequence number. The heat transfer from gas to a particle is represented by Q gp,i . To get the rate of inter-phase momentum and energy exchange per unit volume, F gp,i , K gp,i and Q gp,i are summed over all the particles in a cell and divided by the volume of the computational cell V cell . The gas pressure and density are related by the ideal-gas law
 \begin{align}\frac{p_{g}}{\rho _{g}^{\gamma }}=\text{constant},\end{align}
where γ is the gas specific heat ratio, and a value of γ = 5/3 is used in this paper.
Particle dynamics is calculated by individual trajectory, momentum and energy equations, given as
 \begin{align}\frac{\mathrm{d}x_{p,i}}{\mathrm{d}t}=\boldsymbol{u}_{p,i},\\[-28pt] \nonumber \end{align}
 \begin{align}\frac{4}{3}\pi r_{p,i}^{3}\rho _{p,i}\frac{\mathrm{d}\boldsymbol{u}_{p,i}}{\mathrm{d}t}=\boldsymbol{F}_{gp,i}+\sum _{i\neq j}\boldsymbol{F}_{pp,\textit{ij}}, \\[-28pt] \nonumber \end{align}
 \begin{align}\frac{4}{3}\pi r_{p,i}^{3}\rho _{p,i}C_{p,i}\frac{\mathrm{d}T_{p,i}}{\mathrm{d}t}=Q_{\mathrm{gp},i}, \\[0pt] \nonumber \end{align}
where x p,i , u p,i , r p,i , ρ p,i , C p,i and T p,i , are the position, velocity, radius, density, thermal capacity and temperature of the ith particle, and F pp,ij is the inter-particle contact force exerted on the ith particle from the jth particle.
D.2. Modelling of gas–particle interaction
In the present study, the overall aerodynamic force for an isolated particle is given by
 \begin{align}\boldsymbol{F}_{gp,i}=\boldsymbol{F}_{d,i}+\boldsymbol{F}_{p,i},\end{align}
where F d,i and F p,i are the drag force and pressure-gradient force, respectively,
 \begin{align}\boldsymbol{F}_{d,i}=\frac{\pi }{2}C_{D}r_{p,i}^{2}\rho _{g,i} | \boldsymbol{u}_{g,i}-\boldsymbol{u}_{p,i}| \left(\boldsymbol{u}_{g,i}-\boldsymbol{u}_{p,i}\right), \\[-28pt] \nonumber \end{align}
 \begin{align}\boldsymbol{F}_{p,i}=-\frac{4}{3}\pi r_{p,i}^{3}\frac{\mathrm{d}p_{g,i}}{\mathrm{d}x}.\\[0pt] \nonumber \end{align}
For the converging particulate flow considered here, the particle volume fraction increases during the transport, and the flow becomes non-dilute at high convergent ratio. Interaction of particles with compressible flow features, such as the rebounding shock wave from the axis, will take great importance to the ejecta transport. Therefore, the effects of finite particle volume fraction and finite Mach number should be taken into account for the modelling of the drag coefficient C D,sphere . The resulting expression is given by
 \begin{align}C_{D,\textit{sphere}}=C_{D,std}\left(Re\right)\xi\big(\alpha _{p,i}\big)\zeta\left(Ma,Re\right),\end{align}
where C D,std (Re) is the standard drag coefficient for an isolated particle by (Clift & Gauvin Reference Clift and Gauvin1970)
 \begin{align}C\frac{24}{Re}\left(1+0.15Re^{0.687}\right)\left(1+\frac{42500}{Re^{1.16}}\right)_{D,std}.\end{align}
The Reynolds number and Mach number are defined in terms of the relative velocity between the gas and particle, Re = 2ρ g | u g,i −u p,i | r p,i / μ g,i and Ma = | u g,i −u p,i | / c g,i , where μ g,i and c g,i are the gas-phase kinematic viscosity and speed of sound, respectively. The correction function ξ(α p,i ) = (1+2α p,i )/(1 −α p,i )2 of Sangani, Zhang & Prosperetti (Reference Sangani, Zhang and Prosperetti1991) is used here for the effect of finite particle volume fraction α p,i . Function ζ(Ma, Re) of Parmar, Haselbacher & Balachandar (Reference Parmar, Haselbacher and Balachandar2010) accounts for the dependence on finite particle Mach number. In above equations, subscript i for gas variables means the values in the vicinity of the ith particle.
A liquid ejecta particle travelling in an ambient gas flow is subjected to aerodynamic forces that tend to disrupt the particle surface, while the surface tension tends to retain the spherical shape. When the aerodynamic force is large enough, the particle deforms and finally breaks up into a number of smaller fragments. The phenomenon has been extensively studied in the literature. Several models have been proposed, among which the most well known are the TAB (O’Rourke et al. Reference O’Rourke and Amsden1987), drop deformation breakup (Ibrahim, Yang & Przekwas Reference Ibrahim, Yang and Przekwas1993) and Clark models (Clark Reference Clark1988). The TAB model is adopted in the present study to predict the particle breakup by solving the following particle deformation equation:
 \begin{align}\frac{\mathrm{d}^{2}y}{\mathrm{d}t^{2}}=\frac{C_{F}}{C_{b}}\frac{\rho _{g,i}}{\rho _{p,i}}\frac{\left(u_{p,i}-u_{g,i}\right)^{2}}{r_{p,i}^{2}}-C_{k}\frac{\sigma _{p,i}}{\rho _{p,i}r_{p,i}^{3}}y-C_{d}\frac{\mu _{p,i}}{\rho _{p,i}r_{p,i}^{2}}\frac{\mathrm{d}y}{\mathrm{d}t}.\end{align}
Here,
 $\mu$
p,i
and σ
p,i
are the particle viscosity and surface tension coefficient, and y = x/(C
b
r
p,i
) is the dimensionless deformation factor, where x is the displacement of the equator of the liquid particle from its equilibrium position. Dimensionless constants take the values given by O’Rourke et al. (Reference O’Rourke and Amsden1987), viz. C
k
= 8, C
d
= 5, C
b
= 1/2, and C
F
is derived from the relationship C
F
= 0.5C
k
C
b
/ We
cri
. The drag coefficient is assumed to be correlated with the magnitude of particle deformation, as follows:
 \begin{align}C_{D}=C_{D,\textit{sphere}}(1+2.632y),\end{align}
as proposed by Liu, Mather & Reitz (Reference Liu, Mather and Reitz1993) and Liu & Reitz (Reference Liu and Reitz1993).
According to the TAB model, particles break up when y > 1. In CELP, product particles inherit the computational parcel from their parent particles, and take identical values of velocity
 ${u_{p,i}}^{\prime}$
and radius
 ${r_{p,i}}^{\prime}$
 \begin{align}u_{p,i}'=u_{p,i}, \\[-28pt] \nonumber \end{align}
 \begin{align}r_{p,i}'=\frac{r_{p,i}}{1+\frac{2K}{5}+\frac{\rho _{p,i}r_{p,i}^{3}\left(\mathrm{d}y/\mathrm{d}t\right)^{2}}{\sigma _{p}}\left(\frac{6K-5}{120}\right)}, \\[0pt] \nonumber \end{align}
which are obtained by solving an equation of energy conservation that equates the energy of the parent particle before breakup to the combined energies of the product particles after breakup. The energy distribution ratio K is set to 10/3, consistent with the recommended value in the original TAB model. To conserve mass, the number of product particles
 ${N_{i}}^{\prime}$
associated with the computational parcel is adjusted according to
 \begin{align}N_{i}'=\left(\frac{r_{p,i}}{r_{p,i}'}\right)^{3}N_{i}.\end{align}
Interphase heat transfer will influence the gas properties and shock propagation, which in turn affects the particle motion. On the other hand, an elevated particle temperature will decrease the surface tension, which makes it easier to break up. Therefore, it is necessary to modelling the inter-phase heat transfer for the long-term transport simulation. The heat transferred from gas to the ith particle Q gp,i is expressed as
 \begin{align}Q_{gp,i}=Nu2\pi r_{p,i}k_{g,i}(T_{g,i}-T_{p,i}),\end{align}
where T g,i and T p,i are the gas and particle temperature, respectively. Nu is the Nusselt number having an expression of Nu = 2 + 0.555Re 1/2 Pr 1/3 / (1+1.232 / Re / Pr 4/3)1/2. The dimensionless coefficient of heat conductivity k g,i is defined as k g,i = μ g,i C g,i / Pr, where Pr is the Prandtl number with the empirical expression of Pr = 4γ / (9γ −5).
D.3. Modelling of inter-particle interaction
In converging systems, particles could be compressed to a state where effect of inter-particle interactions, such as particle–particle collisions, should be considered. The classic model of Harris & Crighton (Reference Harris and Crighton1994) has been extensively used in dense particulate matter, in which an effective stress defined based on particle volume fraction is used to model the inter-particle interaction. However, the inherent size and velocity distributions of ejected particles challenge the isentropic stress assumption. Instead, interactions between Lagrangian particles are calculated directly with a soft-sphere collision model. In this approach, the overlap between two particles is represented as a system of springs and dashpots. Assuming the inter-particle contact is dominated by force in normal direction, the rolling friction force and tangential force are expected to be of secondary importance and not considered here. Thus the contact force between the ith and the jth particle is represented by
 \begin{align}\boldsymbol{F}_{pp,\textit{ij}}=\left[-k_{n,\textit{ij}}\delta _{n,\textit{ij}}-\eta _{n,\textit{ij}}\left(\boldsymbol{u}_{p,i}-\boldsymbol{u}_{p,j}\right)\boldsymbol{\cdot }\boldsymbol{n}_{ij}\right]\boldsymbol{n}_{ij},\end{align}
where k n,ij and η n,ij are the normal spring stiffness and dashpot damping coefficient, δ n,ij is the displacement between particles and n ij represents the unit vectors along the normal directions. The nonlinear Hertz contact model (Tsuji, Tanaka & Ishlda Reference Tsuji, Tanaka and Ishlda1992; Fan et al. Reference Fan and Zhu1998) is used to describe the normal spring stiffness, given by
 \begin{align}k_{n,\textit{ij}}=\frac{4}{3}\frac{E_{i}E_{j}\sqrt{a_{ij}}}{E_{i}\left(1-\nu _{j}^{2}\right)+E_{j}\left(1-\nu _{i}^{2}\right)}\delta _{n,\textit{ij}}^{1/2},\end{align}
where E i stands for Young’s modulus, ν i represents the Poisson ratio of the particle and a ij is the relative radius calculated as
 \begin{align}a_{ij}=r_{p,i}r_{p,j}/\left(r_{p,i}+r_{p,j}\right).\end{align}
The normal dashpot damping coefficient η n,ij is related to the normal coefficient of restitution e n , and can be obtained as
 \begin{align}\eta _{n,\textit{ij}}=\frac{2\sqrt{m_{eff}k_{n,\textit{ij}}}\left| \mathit{\ln } e_{n}\right| }{\sqrt{\pi ^{2}+\mathit{\ln }^{2} e_{n}}},\end{align}
where m eff = m p,i m p,j / ( m p,i + m p,j ) is the effective mass. Here, the coefficients of restitution equivalently represent the energy dissipation during the collision.