


%20--%3e%3c!DOCTYPE%20svg%20PUBLIC%20'-//W3C//DTD%20SVG%201.0//EN'%20'http://www.w3.org/TR/2001/REC-SVG-20010904/DTD/svg10.dtd'%3e%3csvg%20version='1.0'%20id='Layer_1'%20xmlns='http://www.w3.org/2000/svg'%20xmlns:xlink='http://www.w3.org/1999/xlink'%20x='0px'%20y='0px'%20width='64px'%20height='64px'%20viewBox='5.5%20-3.5%2064%2064'%20enable-background='new%205.5%20-3.5%2064%2064'%20xml:space='preserve'%3e%3cg%3e%3ccircle%20fill='%23FFFFFF'%20fill-opacity='0'%20cx='37.785'%20cy='28.501'%20r='28.836'/%3e%3cpath%20fill='%23595959'%20d='M37.441-3.5c8.951,0,16.572,3.125,22.857,9.372c3.008,3.009,5.295,6.448,6.857,10.314%20c1.561,3.867,2.344,7.971,2.344,12.314c0,4.381-0.773,8.486-2.314,12.313c-1.543,3.828-3.82,7.21-6.828,10.143%20c-3.123,3.085-6.666,5.448-10.629,7.086c-3.961,1.638-8.057,2.457-12.285,2.457s-8.276-0.808-12.143-2.429%20c-3.866-1.618-7.333-3.961-10.4-7.027c-3.067-3.066-5.4-6.524-7-10.372S5.5,32.767,5.5,28.5c0-4.229,0.809-8.295,2.428-12.2%20c1.619-3.905,3.972-7.4,7.057-10.486C21.08-0.394,28.565-3.5,37.441-3.5z%20M37.557,2.272c-7.314,0-13.467,2.553-18.458,7.657%20c-2.515,2.553-4.448,5.419-5.8,8.6c-1.354,3.181-2.029,6.505-2.029,9.972c0,3.429,0.675,6.734,2.029,9.913%20c1.353,3.183,3.285,6.021,5.8,8.516c2.514,2.496,5.351,4.399,8.515,5.715c3.161,1.314,6.476,1.971,9.943,1.971%20c3.428,0,6.75-0.665,9.973-1.999c3.219-1.335,6.121-3.257,8.713-5.771c4.99-4.876,7.484-10.99,7.484-18.344%20c0-3.543-0.648-6.895-1.943-10.057c-1.293-3.162-3.18-5.98-5.654-8.458C50.984,4.844,44.795,2.272,37.557,2.272z%20M37.156,23.187%20l-4.287,2.229c-0.458-0.951-1.019-1.619-1.685-2c-0.667-0.38-1.286-0.571-1.858-0.571c-2.856,0-4.286,1.885-4.286,5.657%20c0,1.714,0.362,3.084,1.085,4.113c0.724,1.029,1.791,1.544,3.201,1.544c1.867,0,3.181-0.915,3.944-2.743l3.942,2%20c-0.838,1.563-2,2.791-3.486,3.686c-1.484,0.896-3.123,1.343-4.914,1.343c-2.857,0-5.163-0.875-6.915-2.629%20c-1.752-1.752-2.628-4.19-2.628-7.313c0-3.048,0.886-5.466,2.657-7.257c1.771-1.79,4.009-2.686,6.715-2.686%20C32.604,18.558,35.441,20.101,37.156,23.187z%20M55.613,23.187l-4.229,2.229c-0.457-0.951-1.02-1.619-1.686-2%20c-0.668-0.38-1.307-0.571-1.914-0.571c-2.857,0-4.287,1.885-4.287,5.657c0,1.714,0.363,3.084,1.086,4.113%20c0.723,1.029,1.789,1.544,3.201,1.544c1.865,0,3.18-0.915,3.941-2.743l4,2c-0.875,1.563-2.057,2.791-3.541,3.686%20c-1.486,0.896-3.105,1.343-4.857,1.343c-2.896,0-5.209-0.875-6.941-2.629c-1.736-1.752-2.602-4.19-2.602-7.313%20c0-3.048,0.885-5.466,2.658-7.257c1.77-1.79,4.008-2.686,6.713-2.686C51.117,18.558,53.938,20.101,55.613,23.187z'/%3e%3c/g%3e%3c/svg%3e)
%20--%3e%3c!DOCTYPE%20svg%20PUBLIC%20'-//W3C//DTD%20SVG%201.0//EN'%20'http://www.w3.org/TR/2001/REC-SVG-20010904/DTD/svg10.dtd'%3e%3csvg%20version='1.0'%20id='Layer_1'%20xmlns='http://www.w3.org/2000/svg'%20xmlns:xlink='http://www.w3.org/1999/xlink'%20x='0px'%20y='0px'%20width='64px'%20height='64px'%20viewBox='5.5%20-3.5%2064%2064'%20enable-background='new%205.5%20-3.5%2064%2064'%20xml:space='preserve'%3e%3cg%3e%3ccircle%20fill='%23FFFFFF'%20fill-opacity='0'%20cx='37.637'%20cy='28.806'%20r='28.276'/%3e%3cg%3e%3cpath%20fill='%23595959'%20d='M37.443-3.5c8.988,0,16.57,3.085,22.742,9.257C66.393,11.967,69.5,19.548,69.5,28.5c0,8.991-3.049,16.476-9.145,22.456%20C53.879,57.319,46.242,60.5,37.443,60.5c-8.649,0-16.153-3.144-22.514-9.43C8.644,44.784,5.5,37.262,5.5,28.5%20c0-8.761,3.144-16.342,9.429-22.742C21.101-0.415,28.604-3.5,37.443-3.5z%20M37.557,2.272c-7.276,0-13.428,2.553-18.457,7.657%20c-5.22,5.334-7.829,11.525-7.829,18.572c0,7.086,2.59,13.22,7.77,18.398c5.181,5.182,11.352,7.771,18.514,7.771%20c7.123,0,13.334-2.607,18.629-7.828c5.029-4.838,7.543-10.952,7.543-18.343c0-7.276-2.553-13.465-7.656-18.571%20C50.967,4.824,44.795,2.272,37.557,2.272z%20M46.129,20.557v13.085h-3.656v15.542h-9.944V33.643h-3.656V20.557%20c0-0.572,0.2-1.057,0.599-1.457c0.401-0.399,0.887-0.6,1.457-0.6h13.144c0.533,0,1.01,0.2,1.428,0.6%20C45.918,19.5,46.129,19.986,46.129,20.557z%20M33.042,12.329c0-3.008,1.485-4.514,4.458-4.514s4.457,1.504,4.457,4.514%20c0,2.971-1.486,4.457-4.457,4.457S33.042,15.3,33.042,12.329z'/%3e%3c/g%3e%3c/g%3e%3c/svg%3e)
%20--%3e%3c!DOCTYPE%20svg%20PUBLIC%20'-//W3C//DTD%20SVG%201.0//EN'%20'http://www.w3.org/TR/2001/REC-SVG-20010904/DTD/svg10.dtd'%3e%3csvg%20version='1.0'%20id='Layer_1'%20xmlns='http://www.w3.org/2000/svg'%20xmlns:xlink='http://www.w3.org/1999/xlink'%20x='0px'%20y='0px'%20width='64px'%20height='64px'%20viewBox='5.5%20-3.5%2064%2064'%20enable-background='new%205.5%20-3.5%2064%2064'%20xml:space='preserve'%3e%3cg%3e%3ccircle%20fill='%23FFFFFF'%20fill-opacity='0'%20cx='36.924'%20cy='28.403'%20r='28.895'/%3e%3cpath%20fill='%23595959'%20d='M37.442-3.5c8.99,0,16.571,3.085,22.743,9.256C66.393,11.928,69.5,19.509,69.5,28.5c0,8.992-3.048,16.476-9.145,22.458%20C53.88,57.32,46.241,60.5,37.442,60.5c-8.686,0-16.19-3.162-22.513-9.485C8.644,44.728,5.5,37.225,5.5,28.5%20c0-8.762,3.144-16.343,9.429-22.743C21.1-0.414,28.604-3.5,37.442-3.5z%20M12.7,19.872c-0.952,2.628-1.429,5.505-1.429,8.629%20c0,7.086,2.59,13.22,7.77,18.4c5.219,5.144,11.391,7.715,18.514,7.715c7.201,0,13.409-2.608,18.63-7.829%20c1.867-1.79,3.332-3.657,4.398-5.602l-12.056-5.371c-0.421,2.02-1.439,3.667-3.057,4.942c-1.622,1.276-3.535,2.011-5.744,2.2%20v4.915h-3.714v-4.915c-3.543-0.036-6.782-1.312-9.714-3.827l4.4-4.457c2.094,1.942,4.476,2.913,7.143,2.913%20c1.104,0,2.048-0.246,2.83-0.743c0.78-0.494,1.172-1.312,1.172-2.457c0-0.801-0.287-1.448-0.858-1.943l-3.085-1.315l-3.771-1.715%20l-5.086-2.229L12.7,19.872z%20M37.557,2.214c-7.276,0-13.428,2.571-18.457,7.714c-1.258,1.258-2.439,2.686-3.543,4.287L27.786,19.7%20c0.533-1.676,1.542-3.019,3.029-4.028c1.484-1.009,3.218-1.571,5.2-1.686V9.071h3.715v4.915c2.934,0.153,5.6,1.143,8,2.971%20l-4.172,4.286c-1.793-1.257-3.619-1.885-5.486-1.885c-0.991,0-1.876,0.191-2.656,0.571c-0.781,0.381-1.172,1.029-1.172,1.943%20c0,0.267,0.095,0.533,0.285,0.8l4.057,1.83l2.8,1.257l5.144,2.285l16.397,7.314c0.535-2.248,0.801-4.533,0.801-6.857%20c0-7.353-2.552-13.543-7.656-18.573C51.005,4.785,44.831,2.214,37.557,2.214z'/%3e%3c/g%3e%3c/svg%3e)
%20--%3e%3c!DOCTYPE%20svg%20PUBLIC%20'-//W3C//DTD%20SVG%201.0//EN'%20'http://www.w3.org/TR/2001/REC-SVG-20010904/DTD/svg10.dtd'%3e%3csvg%20version='1.0'%20id='Layer_1'%20xmlns='http://www.w3.org/2000/svg'%20xmlns:xlink='http://www.w3.org/1999/xlink'%20x='0px'%20y='0px'%20width='64px'%20height='64px'%20viewBox='5.5%20-3.5%2064%2064'%20enable-background='new%205.5%20-3.5%2064%2064'%20xml:space='preserve'%3e%3cg%3e%3ccircle%20fill='%23FFFFFF'%20fill-opacity='0'%20cx='36.944'%20cy='28.631'%20r='29.105'/%3e%3cg%3e%3cpath%20fill='%23595959'%20d='M37.443-3.5c8.951,0,16.531,3.105,22.742,9.315C66.393,11.987,69.5,19.548,69.5,28.5c0,8.954-3.049,16.457-9.145,22.514%20C53.918,57.338,46.279,60.5,37.443,60.5c-8.649,0-16.153-3.143-22.514-9.429C8.644,44.786,5.5,37.264,5.5,28.501%20c0-8.723,3.144-16.285,9.429-22.685C21.138-0.395,28.643-3.5,37.443-3.5z%20M37.557,2.272c-7.276,0-13.428,2.572-18.457,7.715%20c-5.22,5.296-7.829,11.467-7.829,18.513c0,7.125,2.59,13.257,7.77,18.4c5.181,5.182,11.352,7.771,18.514,7.771%20c7.123,0,13.334-2.609,18.629-7.828c5.029-4.876,7.543-10.99,7.543-18.343c0-7.313-2.553-13.485-7.656-18.513%20C51.004,4.842,44.832,2.272,37.557,2.272z%20M23.271,23.985c0.609-3.924,2.189-6.962,4.742-9.114%20c2.552-2.152,5.656-3.228,9.314-3.228c5.027,0,9.029,1.62,12,4.856c2.971,3.238,4.457,7.391,4.457,12.457%20c0,4.915-1.543,9-4.627,12.256c-3.088,3.256-7.086,4.886-12.002,4.886c-3.619,0-6.743-1.085-9.371-3.257%20c-2.629-2.172-4.209-5.257-4.743-9.257H31.1c0.19,3.886,2.533,5.829,7.029,5.829c2.246,0,4.057-0.972,5.428-2.914%20c1.373-1.942,2.059-4.534,2.059-7.771c0-3.391-0.629-5.971-1.885-7.743c-1.258-1.771-3.066-2.657-5.43-2.657%20c-4.268,0-6.667,1.885-7.2,5.656h2.343l-6.342,6.343l-6.343-6.343L23.271,23.985L23.271,23.985z'/%3e%3c/g%3e%3c/g%3e%3c/svg%3e)
Introduction
Most transmission of Neisseria meningitidis occurs amongst carriers; therefore vaccinating carriers is the only way to generate herd protection. Experience with conjugate vaccines has shown that with the correct age-specific strategy, such indirect effects make a profound contribution to disease control [Reference Trotter and Maiden1]. To this end, it is important to understand the distribution of meningococcal carriage to allow for efficient targeting of individuals who account for the most transmission. The age distribution of meningococcal carriers in industrialised countries has been described and synthesised; this showed that prevalence peaks around 19 years of age [Reference Christensen2]. Patterns of carriage are however known to differ in the African meningitis belt, a region that experiences the highest burden of meningococcal disease in the world. Meningococcal carriage is a common occurrence compared to invasive disease, although the overall prevalence is highly variable, ranging from 0% to 30% [Reference Trotter and Greenwood3,4]. Although the distribution of carriage prevalence by age also appears more variable in the African meningitis belt than in high-income countries, some studies have shown that carriage is most prevalent in children [Reference Trotter and Greenwood3].
Studies of meningococcal carriage in the African meningitis belt have identified a number of risk factors apart from age. A multi-site cross-sectional study found increased odds of meningococcal carriage in rural areas vs. urban and higher prevalence in males [4]. Household crowding and pollution from tobacco and indoor kitchen facilities also increased the odds of carriage significantly [4]. The association between respiratory infection and meningococcal carriage remains unclear, but some studies indicate a positive relationship between carriage acquisition and symptoms of respiratory disease, like sore throat or rhinitis [Reference Mueller5]. Localised epidemics of meningococcal meningitis occur frequently in the belt, but there is no clear relationship between epidemic status and the prevalence of carriage. One study found higher rates of serogroup W carriage in a district experiencing a group W epidemic compared to a neighbouring non-epidemic district, prompting speculation that it may be dominance of a strain rather than overall prevalence that links carriage and epidemics [Reference Raghunathan6].
Season is an important risk factor for carriage in the African meningitis belt. Meningitis epidemics in the meningitis belt occur in the dry season and mathematical models of meningococcal transmission dynamics currently require substantial ‘seasonal forcing’ of transmission to reproduce the observed patterns of disease [Reference Irving7]. One study found higher odds of carriage of capsular meningococci during the dry season; [4] this has not been demonstrated consistently but is compatible with the idea that the capsule protects the bacterium from drying during aerosol transmission. Carriage of unencapsulated strains does not appear to have any association with season [4].
Previous reviews of the literature on meningococcal carriage in Africa have not been systematic in nature and have not examined age-specific patterns in any quantitative way. The aim of this paper was to conduct a systematic literature review of meningococcal carriage prevalence by age and season in the African meningitis belt and to synthesise these data in order to inform future vaccination strategies.
Methods
Search and study selection
This paper was prepared in accordance with the meta-analysis of observational studies in epidemiology (MOOSE) and PRISMA guidelines [Reference Stroup8,Reference Liberati9]. The literature searches were performed by one author (LVC) in January 2017 and updated in September 2017. PubMed, Web of Science, the Cochrane Library and the grey literature were searched for papers reporting carriage of N. meningitidis in defined age groups in locations within the African meningitis belt, using the following search terms: ‘(‘Neisseria meningitidis’ OR ‘N meningitidis’ OR meningitis OR meningococcal OR meningococci OR meningococcus OR meningitidis) AND (carriage OR carrier OR carriers) AND (Africa OR ‘meningitis belt’ OR Gambia OR Senegal OR Guinea-Bissau OR Mauritania OR Guinea OR Ghana OR ‘Burkina Faso’ OR ‘Upper Volta’ OR ‘Cote d'Ivoire’ OR ‘Ivory Coast’ OR Togo OR Benin OR Nigeria OR Niger OR Chad OR Tchad OR Cameroon OR ‘Central African Republic’ OR Sudan OR ‘South Sudan’ OR Eritrea OR Ethiopia OR Uganda OR Kenya OR ‘Democratic Republic of Congo OR Zaire)’.
Studies were eligible for inclusion if they reported pharyngeal carriage of all meningococcal serogroups in defined age groups in generalisable populations in the African meningitis belt. Longitudinal, cross-sectional and serial cross-sectional study designs were included. Studies reporting carriage rates among household contacts of Hajjis or other known carriers were excluded. Studies in both English and French were included in the systematic review. Two studies in Russian were excluded because abstracts could not be obtained. The reference lists of included papers were hand-searched to identify any papers that were missed by the electronic search.
Data extraction and classification
We contacted authors for additional information if studies reported age groups wider than 10 years and the median age was not reported or if the time period of the study was not reported. Where carriage prevalence was reported in age groups of range 10 years or less, we used the midpoint age for analysis. For open-ended age groups, we calculated a midpoint with an upper age limit of 60 years. Using additional data from the African Meningococcal Carriage Consortium cross-sectional studies, we divided the oldest age group previously reported as 30 plus years into two groups, 30–44 years and 45 plus years.
For papers that included results from several populations or studies, data were extracted only for observations meeting the inclusion criteria. Extracted data included the study location, time period, design, any mention of an outbreak or epidemic of meningitis coinciding with the study period, whether the study occurred before or after the MenAfriVac mass campaigns in the study region, use of random sampling, laboratory used to culture the pharyngeal swabs, time between sampling and plating, age range of the individuals, median age of individuals in each age group, number of individuals swabbed and the number of individuals positive for capsulated meningococcal carriage. We excluded individuals carrying capsule-null isolates from our definition of capsulated meningococcal carriage but isolates characterised as non-determinate or non-groupable were included.
Studies were assigned to the dry or rainy season on the basis of the month in which the study took place, defining the dry season as December–June and the rainy season as July–November. Additional data from the studies by Kristiansen and colleagues in Burkina Faso and Ethiopia were used to divide prevalence estimates from these studies into dry and rainy season measures.
Studies were classified as having used random sampling if this was specifically reported; otherwise ‘no’ was recorded.
Data were extracted independently by LVC and AK and differences were checked by CLT.
Data analysis
For the meta-analysis, we excluded data from age bands wider than 20 years. For longitudinal studies, only the first observation in the time series was used to avoid over-representing a particular population in the meta-analysis.
A natural cubic spline (a piecewise cubic polynomial function with linear tails) was used to model group median age [Reference Christensen2,Reference Marsh and Cormier10]. The basis matrix for the spline was generated using the ‘ns()’ function in the R core package ‘splines’. Boundary knots (points in the spline below and above which the function is defined to be linear) were placed at 0 and 30 years because of the low density of sampling in older age groups. The number of internal knots was selected by comparing the AIC of models with two and three internal knots, placing knots at appropriate quantiles (inner tertiles for two knots, inner quartiles for three knots. Optimal placement of these knots was determined by evaluating the AIC of models with every possible combination of knots drawn from the set of ages equidistant from every consecutive observed age between 0 and 30 years. Internal knots placed at 9.25, 9.75 and 28.5 years of age gave the best model fit.
We modelled season and outbreak status as a three-tiered fixed effect and a nested interaction term of location and year of swabbing as random effects. We used fixed effects for factors that had a constant effect in all studies and random effects for factors for which only a subset of all possible levels had been observed. We tried using the physical laboratory as a proxy for differences in ambient temperature, growth medium, swab type and other unreported factors which might affect the likelihood of isolating meningococci from a sample, but this did not improve model fit. Other factors that were considered but did not improve model fit included mass group A conjugate vaccination, country, decade, latitude, time to plating and study.
We started with a simple logistic regression because this is the traditional model for analysing prevalence data. However, when we found that a low proportion of observations fell within the bootstrapped 95% CI, we investigated three additional models which are commonly used to capture overdispersion: an observation-level random effects model, a beta-binomial or hierarchical model and a zero-inflated binomial model [Reference Harrison11]. We found that the simple logistic regression captured more of the variability in the data than the observation-level random effects model and provided a better fit than the beta-binomial and zero-inflated binomial models, so we used a logistic structure for our final model.
All candidate models allow overall carriage prevalence to vary but constrain the distribution of prevalence by age to be the same across all years and locations.
Models were fit using the lme4, spaMM and glmmADMB packages in R [Reference Bates12–Reference Rousset and Ferdy15]. To generate confidence intervals for the model predictions and random effects, 10 000 iterations of bootstrapping with replacement were performed and bias-corrected 95% confidence intervals were calculated [Reference Efron16]. Profile confidence intervals for fixed effects parameters were calculated using the lme4 package [Reference Bates12]. We assessed model fit by AIC and by performing leave-one-out cross-validation, whereby the model is refit on the full dataset excluding a single observation and this new model is used to predict prevalence in the excluded observation. This prediction is then compared to the true value. To check the results of the spline model, we identified the age group with the highest carriage prevalence for each study measuring carriage in more than one age group and performed a one-way proportion test between this peak value and prevalence in all other age groups. To adjust for repeated significance testing, we used an upper P-value cut-off of 0.0005, yielding an overall confidence of >95%.
We checked our season definition against average monthly rainfall anomalies in each site using publicly available data from the National Oceanic and Atmospheric Administration (Fig. S1). In a sensitivity analysis, we excluded data from four sites with non-characteristic rainfall patterns. These sites all fell on the edges of the meningitis belt: Butajira, Ethiopia (2 sub-sites), Arba Minch, Ethiopia (4 sub-sites) and Kpalkpalgbeni, Bring-Ahafo District, Ghana.
For the visual presentation of the fixed-effects portion of the model, we adjusted the observed carriage prevalence (P observed) to account for the random effects in the full model as follows: P adjusted = exp(log (Pobserved)-σLocation-σLocation-year), where σ Location and σ Location -year are the random effects intercept for location and year for a given observation.
To estimate the proportion of carriers that would be targeted in a mass vaccination campaign covering four age groups (0–15 years, 0–17 years, 0–19 years and 0–29 years) we assumed a population structure consistent with that of Niger in 2017 and used the fitted estimate of carriage prevalence for the rainy season (although results are consistent across seasons) [17]. We accounted for uncertainty in this estimate by simulating 100 000 draws from a uniform distribution with boundaries at the 2.5th and 97.5th percentile of the fitted prevalence, using these draws as the rates for a random binomial draw with population size corresponding to each single year age cohort in Niger 2017 and then taking the 2.5th and 97.5th percentiles of the proportion covered to yield a 95% confidence interval.
Assessment of study quality and heterogeneity
We assessed the role of study design by comparing a model with and without sampling procedure (random vs. non-random) and with and without time to plating of swabs as fixed-effect variables.
Role of the funding source
The sponsor of the study had no role in study design, data collection, data analysis, data interpretation, or writing of the report. The corresponding author had full access to all the data in the study and had final responsibility for the decision to submit for publication.
Results
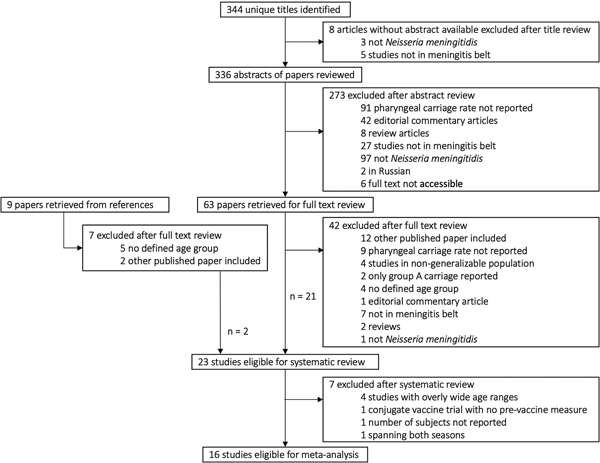
We identified 23 relevant articles that reported unique studies of carriage by age in generalisable populations in the African meningitis belt representing eight countries: Burkina Faso, Chad, Ethiopia, Ghana, the Gambia, Mali, Nigeria and Niger. Eleven were cross-sectional studies; five serial cross-sectional, four longitudinal and three were vaccine trials (two polysaccharide and one conjugate vaccine). Twelve of 23 articles did not report randomisation in participant selection. Sixteen studies were eligible for inclusion in the meta-analysis (Table 1). Seven of these 16 did not report random sampling. Eighteen of 23 studies in the systematic review and 15 of 16 eligible for inclusion in the meta-analysis reported information on the serogroups or genogroups of the carriage isolates (Table 2). See Figure 1 and Tables S1 and S2 for further details of search and reasons for exclusion.
Carriage studies included in meta-analysis. Summary of studies of meningococcal carriage by age in the African meningitis belt included in meta-analysis

a Observations excluded in sensitivity analysis–climactic outlier sites.
Meningococcal serogroup distribution. Summary of the serogroup distribution of N. meningitidis isolated from carriers in the African meningitis belt

a Excluded from meta-analysis.
b Climactic outliers excluded from meta-analysis in sensitivity analysis.
c Two group E and five group B carriers also reported.
d Percentages do not sum to 100 because full serogroup data not reported.
Selection of studies on meningococcal carriage prevalence for systematic review and meta-analysis. For full details of all the papers that were reviewed, including reasons for exclusion, please contact the corresponding author.

Systematic review
Longitudinal studies
Longitudinal studies reported high variation in carriage rates over time (1–35%), but no significant differences in carriage prevalence between age groups, probably because of smaller sample sizes [Reference Leimkugel18–Reference Etienne21]. Prevalence recorded around the time of meningococcal outbreaks was high in recent studies (2000s and 2010s), with two studies showing particularly high rates in ages 5–29 years (16–38%) [Reference Mueller22–Reference Sié24]. Two early studies (1970s) of carriage during a single group A meningococcal outbreak found lower rates of carriage (2–5%) [Reference Blakebrough and Gilles25,Reference Blakebrough26].
Studies of seasonal change
Most studies which specified months comprising the dry and rainy seasons placed the beginning of the dry season between November and January and the beginning of the rainy season between April and July. One study also included a Harmattan season (October–January) between the rainy and dry seasons [Reference Emele, Ahanotu and Anyiwo27]. Early studies documented the variability of carriage prevalence in the African meningitis belt but found little support for consistent differences in prevalence by season. A year-long study in Burkina Faso found a wide variation in carriage rates but no significant changes associated with the onset of the rainy season [Reference Etienne21]. Two other studies found similarly variable results with no obvious seasonal patterns [Reference Emele, Ahanotu and Anyiwo27,Reference Blakebrough28]. One study in rural northern Nigeria displayed remarkably stable prevalence over the year, with carriage ranging from 2.1% to 2.7% at four sampling intervals [Reference Blakebrough28]. These early studies may have been limited by their relatively short duration or small sample sizes.
An 8-year longitudinal study of a cohort (n ~ 300) in Northern Ghana measured carriage twice annually, in April and November. Although this was not noted in associated publications, the average carriage rate in November (4.4%) was substantially lower than that in April (7.9%) [Reference Leimkugel18]. This was the first study to produce evidence supporting the hypothesis that carriage prevalence increases during the dry season.
A multi-site serial cross-sectional study in Burkina Faso measuring carriage four times annually in 2009 and 2011 found significantly higher carriage prevalence in dry season surveys than in rainy [Reference Kristiansen29,Reference Kristiansen30]. Finally, a serial cross-sectional study across seven countries of the meningitis belt found significantly elevated odds of carriage during the dry season as compared with the rainy (adjusted OR, 1.54; 95% CI, 1.37–1.75) [4].
Laboratory methods
All studies relied on culture for the initial identification of meningococcal isolates. Between one and ten colonies were selected for further testing, most commonly serogrouping. Fourteen of 23 studies (all published after 2000) reported using molecular methods for confirmation and further characterisation of culture isolates.
Meta-analysis
Data from 16 papers, comprising 114 331 individual swabs, were available for quantitative data synthesis.
The four model variants tested did not vary greatly in their parameter estimates and goodness of fit (Table S3). We selected the simple logistic regression model because the greatest proportion of observations fell within the 95% confidence interval of bootstrapped predictions and the leave-one-out cross-validation correlation was greatest for this model. This best-fitting model had season as a fixed effect and location and year as random effects.
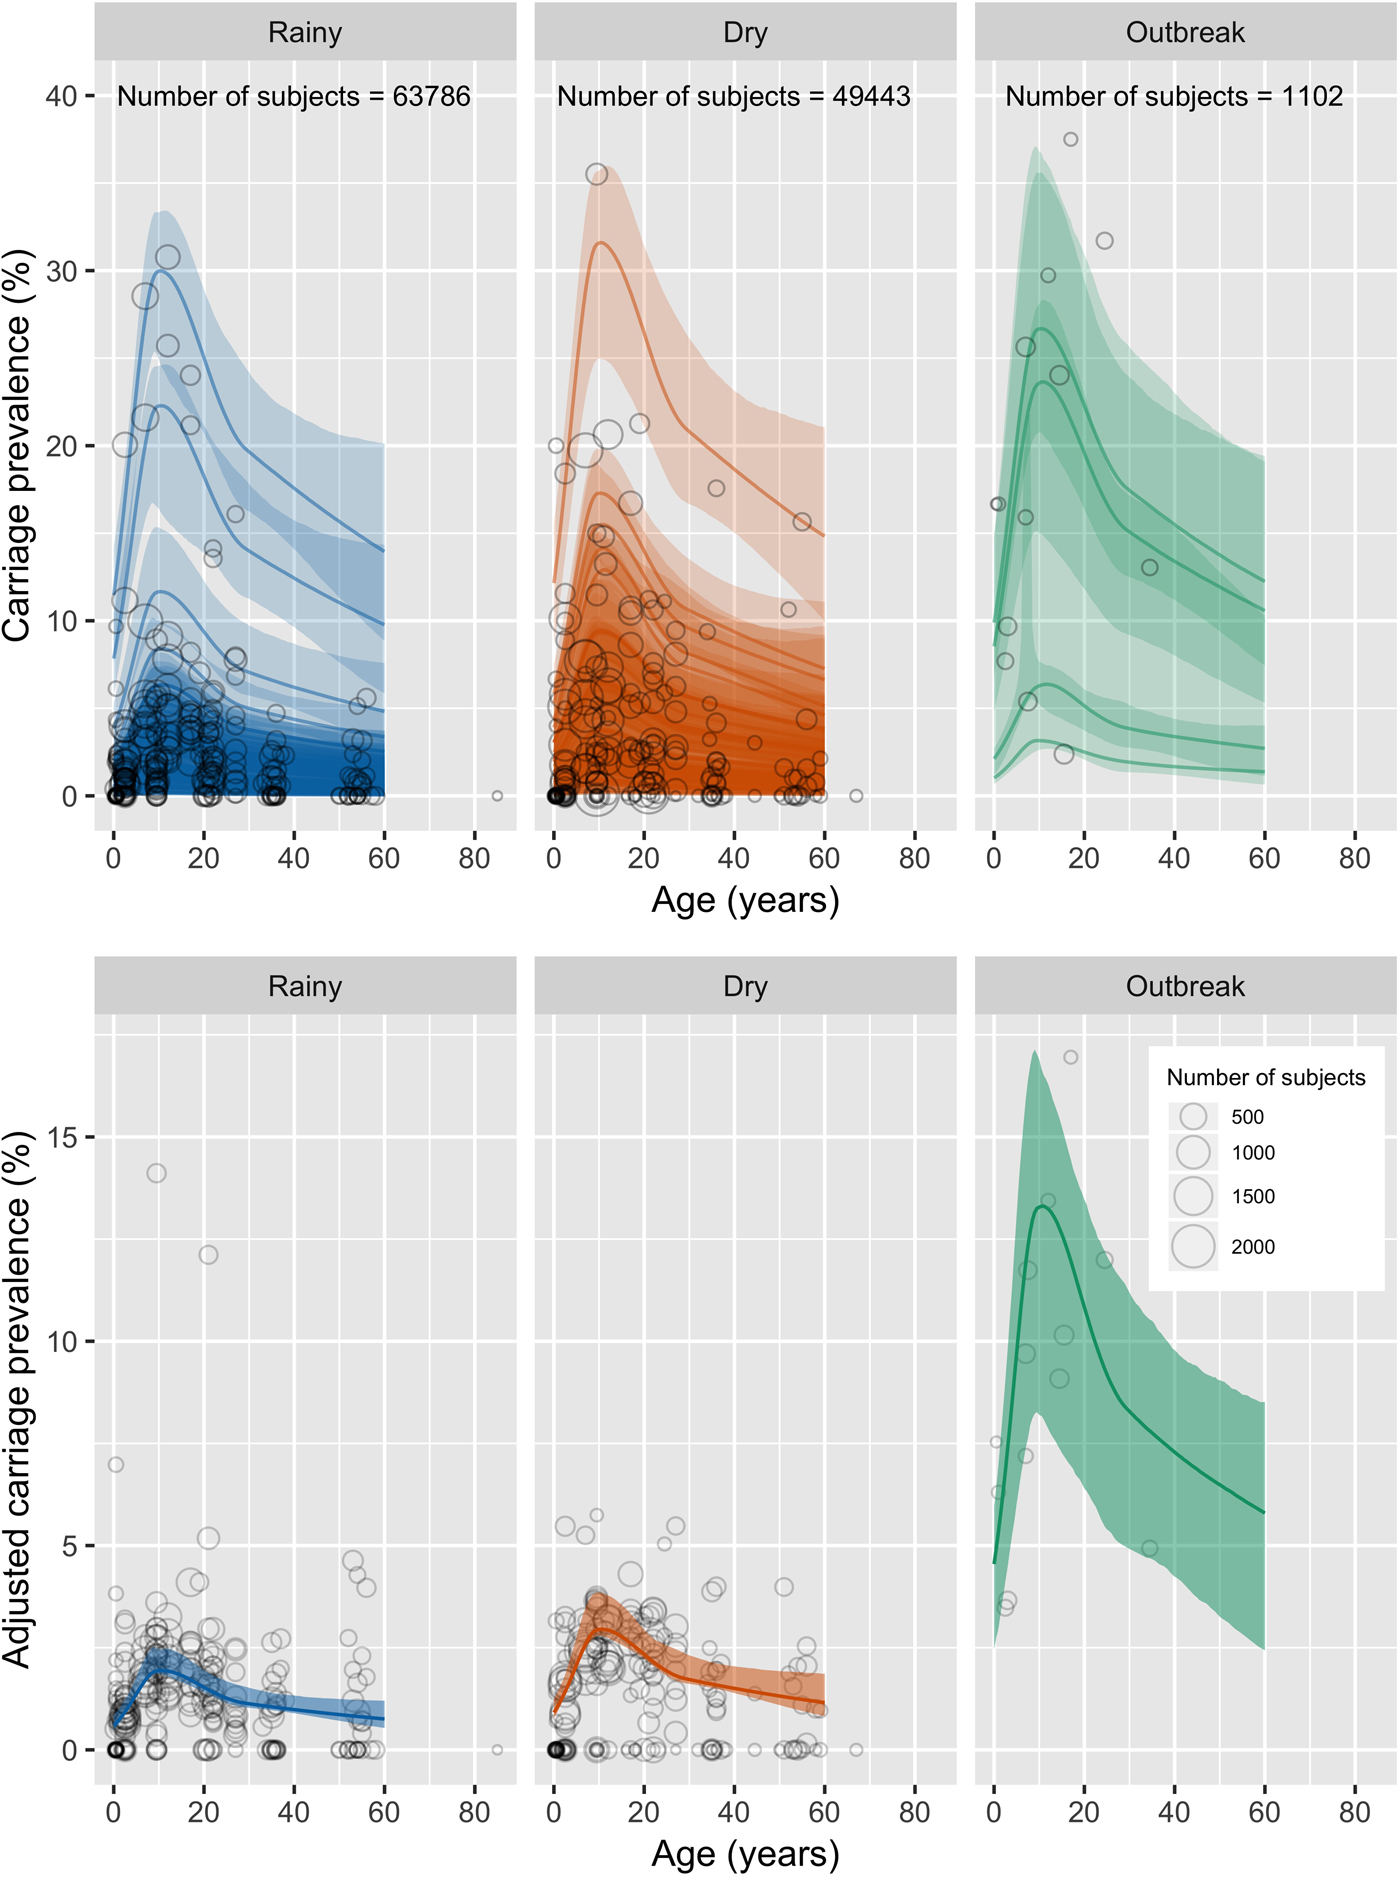
The fixed effects parameters of the final model are shown in Table 3. The model suggests that meningococcal carriage prevalence in the African meningitis belt increases rapidly in childhood, peaks at 10 years of age (1.94% in the rainy season, 95% CI 1.87–2.47%) and gradually declines after this point (Fig. 2). In a country with the same population structure as Niger, our model estimates that 58% of carriers are under the age of 16 and 84% are under the age of 30 (Table 4). Odds of carriage were significantly increased for studies taking place during the dry season (1.5 95% CI 1.4–1.7) as compared with the rainy season and further increased for studies taking place during outbreaks (OR 6.7 95% CI 1.6–29), though the uncertainty in the latter estimate is high as limited data on carriage during outbreaks are available. No other risk factors were found to significantly impact the odds of carriage.
Fixed effects parameters. Predicted odds ratios and profile confidence intervals and median bootstrapped odds ratios and 95% bootstrapped confidence intervals for fixed effects parameters from fit on full dataset and on dataset excluding climactic outliers

Observed carriage prevalence measures and model predictions. Top panel: Circles show the data points included in the meta-analysis, with the larger circles representing a larger sample size. Solid line shows model predictions including random effects. Shaded ribbon shows 95% bias-corrected confidence intervals. Bottom panel: Circles show the data points included in the meta-analysis, with carriage prevalence adjusted for random effects intercept. Solid line shows model predictions excluding random effects. Shaded ribbon shows 95% bias-corrected confidence intervals. Dry season predictions are shown in red; rainy season in blue; outbreak in green.
Target age for vaccination. Proportion of carriers under 60 years of age directly targeted by vaccination of different age groups

Predicted carriage prevalence by age is shown in Figure 2, incorporating only fixed effects.
One-way proportion testing between peak reported carriage prevalence and prevalence in all other age groups confirmed age-related trends, with four of 13 studies showing a peak in age groups containing 10 years of age (the peak age identified by the spline regression model) and the remaining nine showing no significant difference between peak prevalence and the prevalence in the age group containing 10 years of age (Table S4).
Predicted carriage prevalence was not significantly different when excluding data from sites that were climactic outliers (Table 3, Figure S3).
Location and year contributed to substantial variation in overall carriage rates. Random effects intercepts are given in Tables S5 and S6. Figure S2 shows model predictions including random effects. The variance for the location-year interaction intercept was greater than that for the location intercept (1.02 vs. 0.55). Neither location nor year alone was a consistent determinant of the location-year intercept (Table S6).
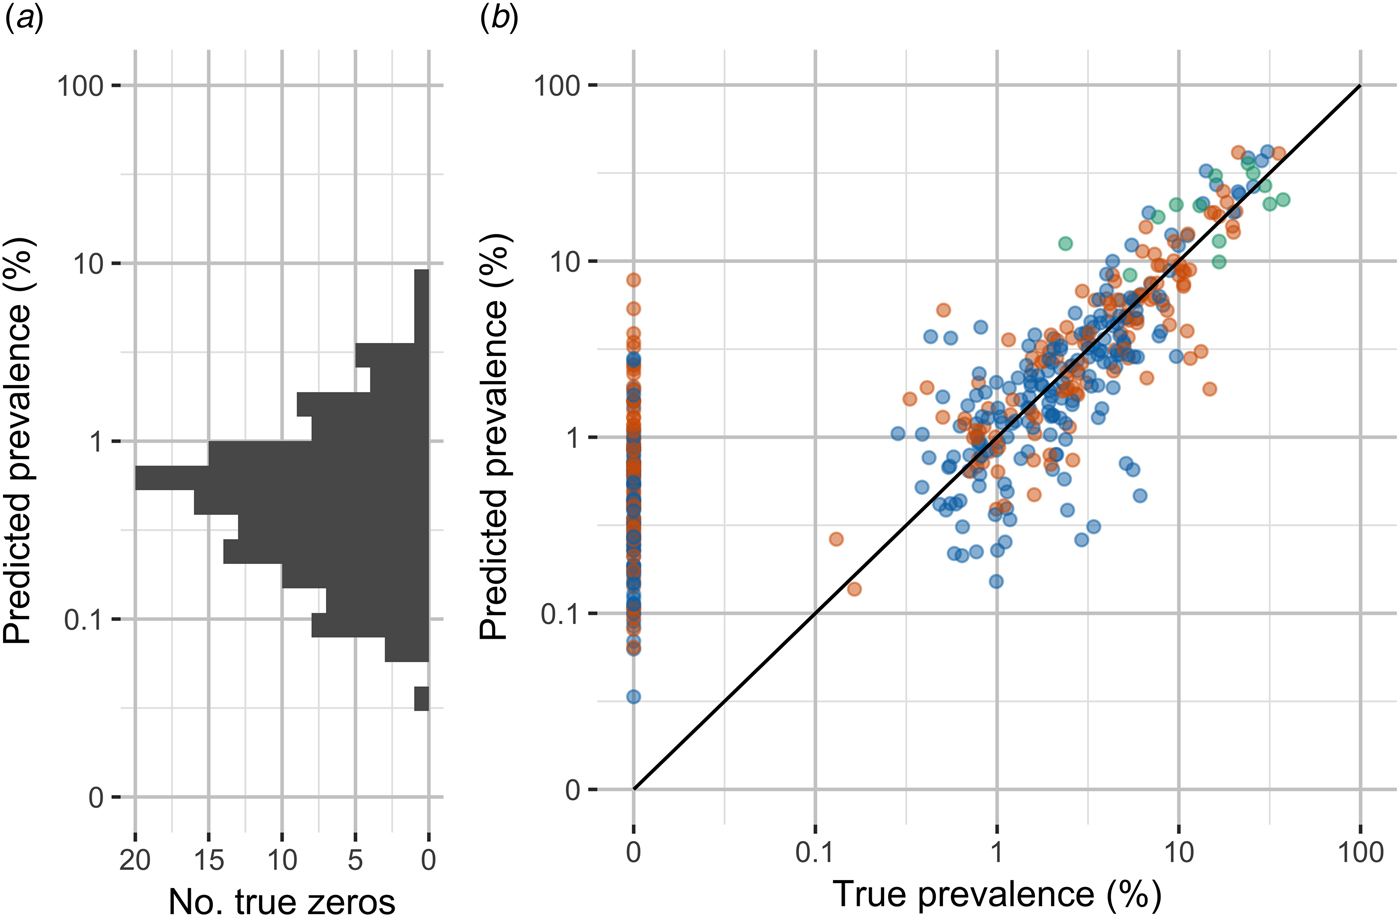
Shown in Figure 3, leave-one-out cross-validation predicted values were moderately correlated with true values (Pearson's rho 0.89). However, the median percent error for non-zero values was substantial, 34%. The model performed poorly at predicting observations of 0% carriage. More than half of all observations were outside the 95% confidence intervals for the model predictions (64%).
Observed carriage prevalence and model predictions by leave-one-out cross-validation. (A) Distribution of model predictions for true zero observations. (B) True prevalence and prevalence predicted by leave-one-out cross-validation. Note the discontinuous scale to emphasise zero observations and the use of log scale for non-zero observations.
Discussion
We found that meningococcal carriage rates in the African meningitis belt were significantly higher in individuals aged 5–19 than in age groups outside this range. A logistic regression showed that carriage prevalence increases from a minimum in infants to a broad peak in children centered at age 10 (1.94% in the rainy season, 95% CI 1.87–2.47%), then gradually decreases in later adolescence and adulthood. The trends in prevalence by age captured by the model are broadly consistent with contact studies in the sub-Saharan Africa, which find the highest intensity of contacts in 5–15-year-olds, especially close physical contacts and contacts with individuals outside of the household [Reference le Polain de Waroux41]. In the context of future strategies for use of the pentavalent meningococcal conjugate vaccine, this work shows that a substantial proportion of meningococcal carriers could be targeted while lowering the upper threshold for vaccination from 29 years of age to 17 or 19 years of age. However, we note that 17% of carriers in the data that informed our model carried non-groupable strains, which would not be targeted by a pentavalent vaccine.
The dry season in the African meningitis belt is characterised by low humidity, high temperatures, increased wind speed and high levels of airborne dust. We found that the odds of carriage were significantly increased during the dry season and further increased during outbreaks, all of which occurred during the dry season. This is consistent with mathematical modelling which has shown that seasonal forcing in transmissibility of carriage is necessary to reproduce the extreme variability and scale of meningitis incidence characteristic of the African meningitis belt [Reference Irving7]. This finding is also consistent with in vivo studies in mice and in vitro studies of human neutrophils which have shown that exposure to dust is associated with reduced bacterial killing and increased bacterial load in the nasopharynx [Reference Jusot31].
However, it is important to emphasise that the increased odds of carriage during the dry season and during outbreaks are not sufficient to fully account for the dramatic increase in disease incidence observed during these periods. There is evidence that individual susceptibility to invasive disease also increases during the dry season and during outbreaks [Reference Koutangni, Boubacar Maïnassara and Mueller32].
Mass group A conjugate vaccination has no significant effect on overall carriage prevalence in the model. Serogroup A meningococci accounted for just 10% of all carriage isolates in pre-vaccine studies (Table 2), so it is not surprising that the model did not capture any change due to vaccine-related reductions in group A carriage. Carriage of group A meningococci did substantially decrease from 0.4% overall before mass campaigns to <0.005% overall after.
This model has some limitations. Cross-validation predictions are well correlated with true prevalence (Pearson's rho 0.89), but substantial variability in carriage prevalence remains unexplained, with fewer than half of observations falling within the 95% confidence intervals for model predictions.
The model is principally informed by two large serial cross-sectional studies carried out between 2009 and 2012, one based in Burkina Faso (50 810 subjects) [Reference Kristiansen29,Reference Kristiansen30,Reference Kristiansen33] and the multi-country African Meningococcal Carriage Consortium study (48 405 subjects) [4]. These are both high-quality characteristic multi-site studies, but this dependence may mean that our model is more representative of recent epidemiological trends in the African meningitis belt.
Gender was not included in the model because this was not consistently reported, but the age distribution of carriage may be modified by gender because of differences in social behaviour [Reference Hassan-King34]. A number of studies have also shown a higher prevalence of carriage in males overall, but this would not be expected to bias the results of this analysis unless the gender distribution of participants were substantially different between age groups [4,Reference Mueller5].
Because of the sparseness of sampling in older age groups, a linear relationship between carriage prevalence and age above 30 years was assumed. As a result, carriage appears to decline steadily throughout middle and later adulthood. However, in reality, carriage may increase in the elderly as immunity wanes. Further study of this age group will be important as older people comprise an increasing proportion of the population in the African meningitis belt.
Despite these shortcomings, we conclude that older children in African meningitis tend to be the age group in which carriage is most prevalent. The odds of carriage are significantly higher during the dry season and during outbreaks and carriage of group A meningococci has substantially decreased in countries where mass MenAfriVac vaccination has been implemented. This meta-analysis may help to guide vaccination policy, both to maintain control of group A disease and in the implementation of affordable multivalent vaccines.
Supplementary material
The supplementary material for this article can be found at https://doi.org/10.1017/S0950268819001134
Author ORCIDs
L. V. Cooper, 0000-0002-2942-3627.
Acknowledgements
We thank Nicole Basta, Judith Mueller, Ryan Novak, Gerd Pluschke and Pratima Raghunathan for further information on published work. We thank the MenAfriCar Consortium for providing additional unpublished data. We also thank Brian Greenwood for his thoughtful comments on the manuscript.
LVC was supported by a studentship from Trinity Hall, University of Cambridge. AK and CLT received salary support from the Vaccine Impact Modelling Consortium (www.vaccineimpact.org). The views expressed are those of the authors and not necessarily those of the Consortium or its funders. HC was supported by the NIHR Health Protection Research Unit in Evaluation of Interventions at University of Bristol. The views expressed are those of the author(s) and not necessarily those of the NHS, the NIHR, the Department of Health or Public Health England.
Conflict of interest
None.






 Open access

