1. INTRODUCTION
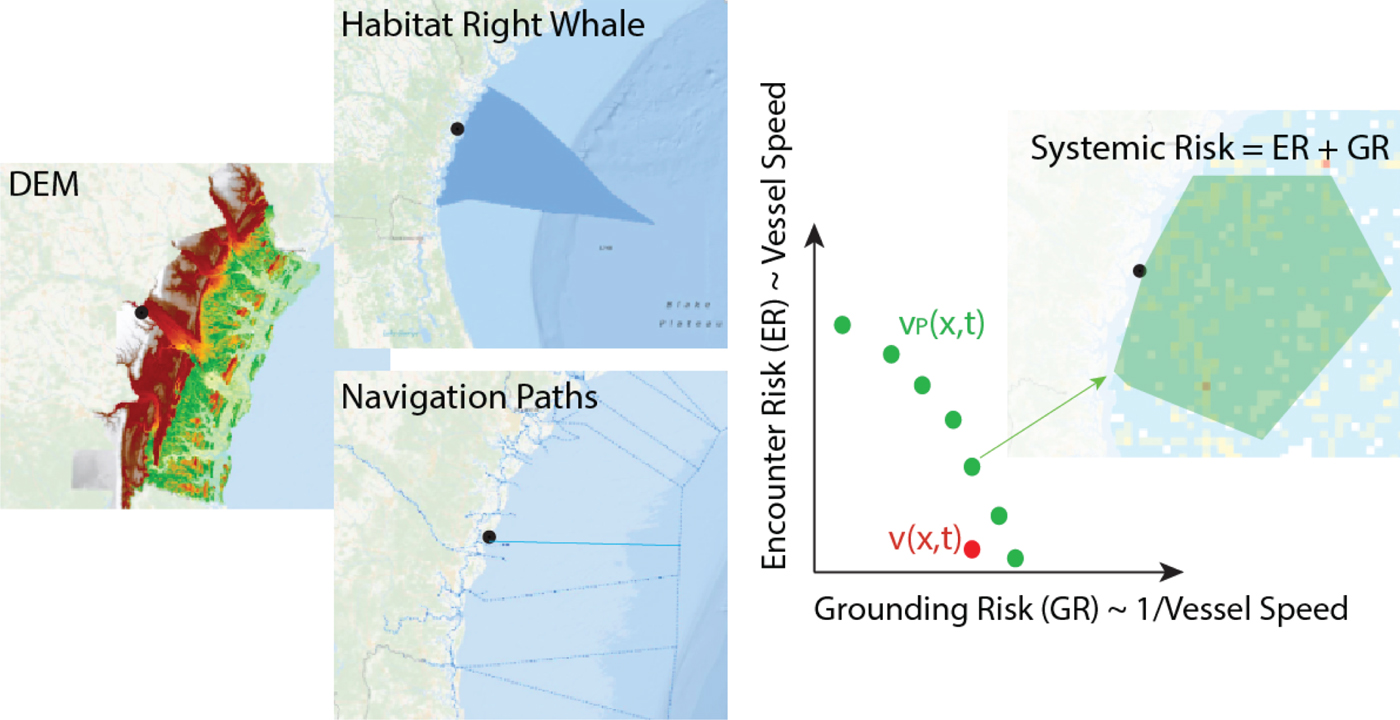
Policymakers in the maritime domain often plan and act in situations and contexts where conflicting objectives must be carefully balanced. It is often the case, for example, that policymakers must endeavour to balance a range of economic and commercial interests against safety and environmental concerns. In the maritime context, an important example of this aspect of what we shall call the “policymakers’ dilemma” (see Figure 1) is the Right Whale Sighting Advisory System (RWSAS), a National Oceanic and Atmospheric Administration (NOAA) Fisheries programme that is designed to reduce collisions between vessels and critically endangered North Atlantic Right Whales (Eubalaena glacialis) (Vanderlaan and Taggart, Reference Vanderlaan and Taggart2007; Wiley et al., Reference Wiley, Thompson, Pace and Levenson2011; Redfern et al., Reference Redfern, Mckenna, Moore, Calambokidis, Deangelis, Becker, Barlow, Forney, Fiedler and Chivers2013; Gende et al., Reference Gende, Hendrix, Harris, Eichenlaub, Nielsen and Pyare.2011; Van der Hoop et al., Reference Van der Hoop, Vanderlaan, Cole, Henry, Hall, Mase-Guthrie, Wimmer and Moore2014; Laist et al., Reference Laist, Knowlton and Pendleton2014; Silber et al., Reference Silber, Adams and Fonnesbeck2014). Analysis of reported vessel-whale strikes worldwide, between 1999 and 2002, reveals that there is an estimated 50% chance of 14 or more strikes annually (Vanderlaan et al., Reference Vanderlaan, Corbett, Green, Callahan, Wang, Kenney, Taggart and Firestone2009). In this context, United States (US) policymakers have sought to implement regulations aimed at minimising right whale deaths that are caused by ship collisions along the East Coast. In late 2008, the RWSAS was re-engineered to support new regulations aimed at reducing the risk of vessel-whale collisions. These new regulations stipulate a Right Whale Rule (RWR) — a speed restriction of 10 knots for all vessels 65 ft (19·8 m) in length or greater within ten Seasonal Management Areas (SMAs). The SMAs encompass high-risk areas along the US Atlantic seaboard, where right whale sightings occur with predictable regularity each year. When three or more right whales are sighted outside of an SMA, a Dynamic Management Area (DMA) is put in place for two weeks, encompassing an area that is commensurate with the number of whales present. Mariners are notified of DMAs via email, Broadcast Notice to Mariners, NOAA Weather Radio, and the Mandatory Ship Reporting system, and are required to reduce their speed when transiting through a given DMA. Recent studies assess the likelihood of the RWR's efficacy in eliminating right whale deaths from vessel strikes as ranging from ~60% (Vanderlaan et al., Reference Vanderlaan, Corbett, Green, Callahan, Wang, Kenney, Taggart and Firestone2009) to ~100% (Laist et al., Reference Laist, Knowlton and Pendleton2014). From a policy-efficacy perspective, then, the RWR has been an effective instrument for achieving its conservation-oriented goals and objectives.
Graphical representation of the policymakers’ dilemma, where (in the simplest case) two risks — the risk of grounding of vessels (GR) and the risk of vessel-whale encounters (ER) — must be managed simultaneously.
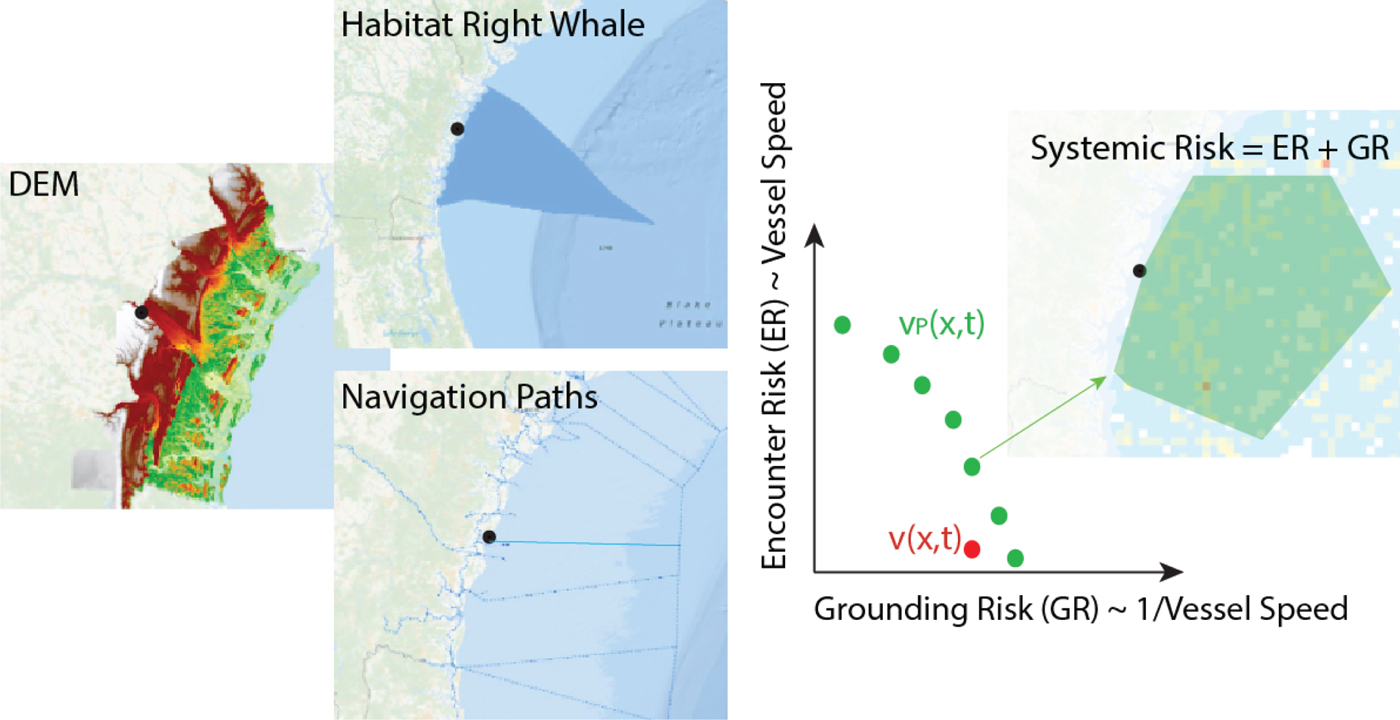
A rational approach to maritime policy requires that the conservation-related benefits of the RWR be weighed and contrasted against the relevant risks and costs of implementing and enforcing the vessel speed restriction. From the outset, it is important to note that, in the case of the RWR, navigational safety concerns have been voiced by the US Coast Guard and other stakeholders, especially as it relates to the potential adverse influence that the speed restriction has on collision and ship grounding risks in the proximity of ports. As we discuss below, at the maximum velocity that the RWR allows, large vessels are less controllable, and any errors in manoeuvring or corrections related to right whale sightings can appreciably increase the likelihood of ship grounding accidents or collisions (Laist et al., Reference Laist, Knowlton and Pendleton2014).Footnote 1
In confronting these challenges, policymakers require a rational and consistent means by which to characterise and evaluate all of the attendant risks, costs and benefits that are associated with complex policies like the RWR, including the ability to evaluate and consider a plurality of trade-offs (e.g., safety versus commerce versus conservation, etc.). As an incremental step towards this end, in what follows, we present a risk analytic framework for exploring important aspects of the RWR's navigational safety implications. To ground the discussion, we focus our analysis on the assessment of ship grounding risk for the Charleston Entrance Channel. Our analysis makes use of probabilistic risk assessment techniques — specifically, fault and event tree analysis — to estimate the causation and failure probabilities associated with ship grounding. Bayesian network analysis is then used to assess the a priori probability of system failure, and to model the probabilistic influence that alternative vessel speed restrictions have on the assessed likelihood of ship grounding.
Our discussion is organised along the following lines. We begin by sketching a general risk assessment framework that provides an overarching structural and logical basis for our analysis. As part of this discussion, we explore the challenges entailed in estimating the frequencies of accidental events or processes that give rise to ship grounding accidents. We then outline the key elements of a high-level fault tree model, derived from published grounding studies, which provides the basis for a probabilistic risk assessment of grounding accidents in the Charleston Entrance Channel. Event progression for the fault tree's main stochastic elements is then modelled via probabilistic event trees; the endpoint causation probabilities that emerge from this analysis are used to fully enumerate the fault tree model. The enumerated fault tree model is then mapped to a Bayesian network model, which provides a flexible and robust computational environment for performing several risk analysis computations. For this portion of our analysis, we focus on the representation and modelling of sequentially dependent failures, with specific emphasis on the probabilistic influence that the vessel speed restriction has on the risk of grounding in the 10-knot area. Our analysis suggests that the speed restriction can, under certain reasonable assumptions, be seen to adversely impact the risk of ship grounding accidents in the Charleston Entrance Channel. We conclude with a summary of our findings, together with recommendations for future research.
2. RISK ASSESSMENT FRAMEWORK
Within the realm of maritime transportation, it is well understood that culture, economics, regulatory constraints and other factors interact with one another in sometimes complex and unpredictable ways to give rise to errors and accidents. For its part, navigational safety is seen to be driven by numerous factors, including human factors, vessel specifications, route characteristics, and atmospheric/weather conditions (Dunne, Reference Dunne1972; Wennink, Reference Wennink1992; Montewka et al., Reference Montewka, Hinz, Kujala and Matusiak2010; Ramos Martins and Coelho Maturana, Reference Ramos Martins and Coelho Maturanam2013; Mazaheri et al., Reference Mazaheri, Montewka and Kujala2014; Reference Mazaheri, Montewka, Kotilainen, Edvard Sormunen and Kujala2015; Reference Mazaheri, Montewka and Kujala2016; Montewka et al., Reference Montewka, Goerlandt, Innes-Jones, Owen, Hifi and Puisa2017). Within the maritime domain, it is common to explore these factors in a structured manner that allows for the characterisation and evaluation of all the attendant safety risks. In this section, we make use of probabilistic risk assessment techniques — specifically, fault and event tree analysis — to estimate the causation and failure probabilities that are associated with ship grounding.
Recent modelling efforts centred around grounding risk are found in Mazaheri et al. (Reference Mazaheri, Montewka, Kotilainen, Edvard Sormunen and Kujala2015) and Mazaheri et al. (Reference Mazaheri, Montewka and Kujala2016), which explore correlations between different variables in determining grounding likelihoods in complex waterway systems. Here, we propose a more in-depth modelling approach that looks to logically integrate multiple methodologies, with a view towards informing an overarching causal understanding of various possible ship grounding scenarios. As we discuss below, we utilise fault tree methodology (with models derived from published grounding and collision studies) to provide a logical basis for a probabilistic risk assessment of grounding and collision accidents in the Charleston Entrance Channel. Event progression for the fault tree's main stochastic elements is modelled via probabilistic event trees, and the endpoint causation probabilities that emerge from this analysis are used to fully enumerate our fault tree model.
2.1. Grounding and Collision Frequencies
Grounding and collision accidents are among the most common types of ship disasters. In fact, global statistics indicate that ship grounding incidents account for more than 40% of all commercial ship accidents and that ship collisions account for nearly a third (Soares and Teixeira, Reference Soares and Teixeira2001). Risk and reliability engineers have long explored ways to estimate the frequencies associated with ship grounding and collision accidents. In exploring the logical structure of such accidents, it is common to decompose these accidents, in a top-down manner, from the deleterious events themselves (e.g., a ship grounding), to its causes (e.g., piloting error, crew error, etc.), until failures of so-called “basic” events, components, or processes are reached (e.g., propulsion failure).
Consistent with this line of reasoning, fault tree analysis is often used to evaluate the risk and reliability of safety-critical systems. The logical structure of a fault tree provides a sound mathematical basis for estimating the likelihood of an undesired event or accident, typically called the “Top Event” (TE). The events represented in a fault tree are assumed to be binary in nature (i.e., working/not-working, failed/not-failed, etc.), and the relationships between events and causes are represented by logical AND and OR gates. In applying this technique numerically, probabilities are assigned to the basic events, and the probability of the TE is characterised as a mathematical function of the logical relationships depicted in the fault tree.
2.1.1. Fault Tree Analysis
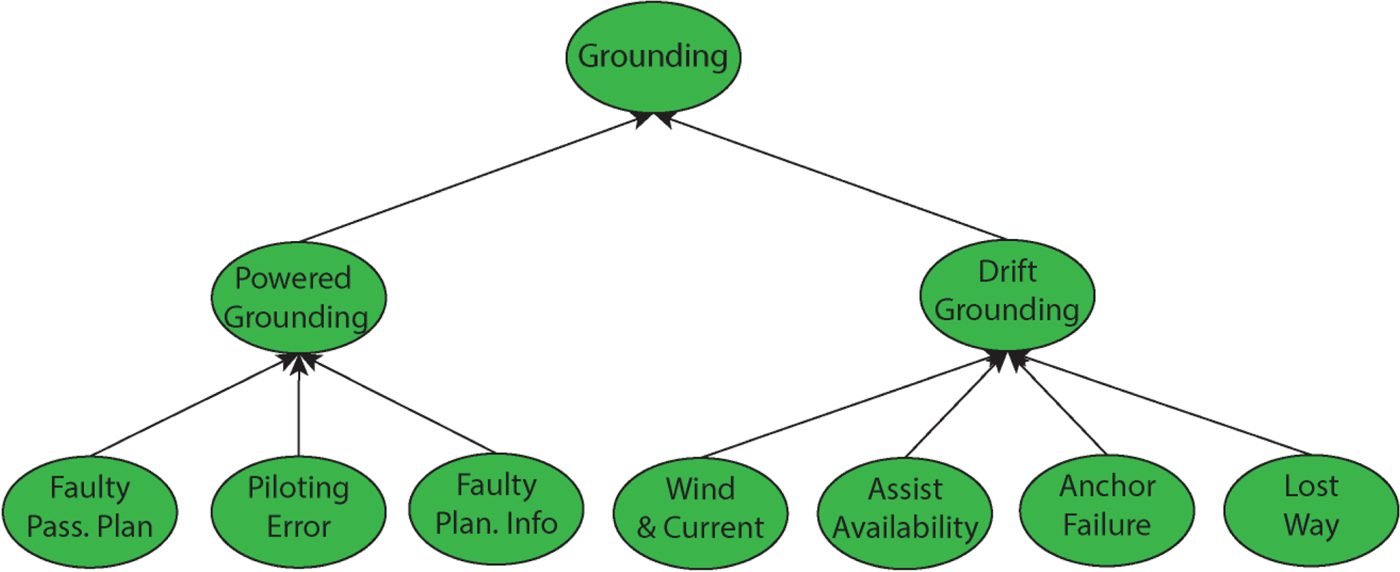
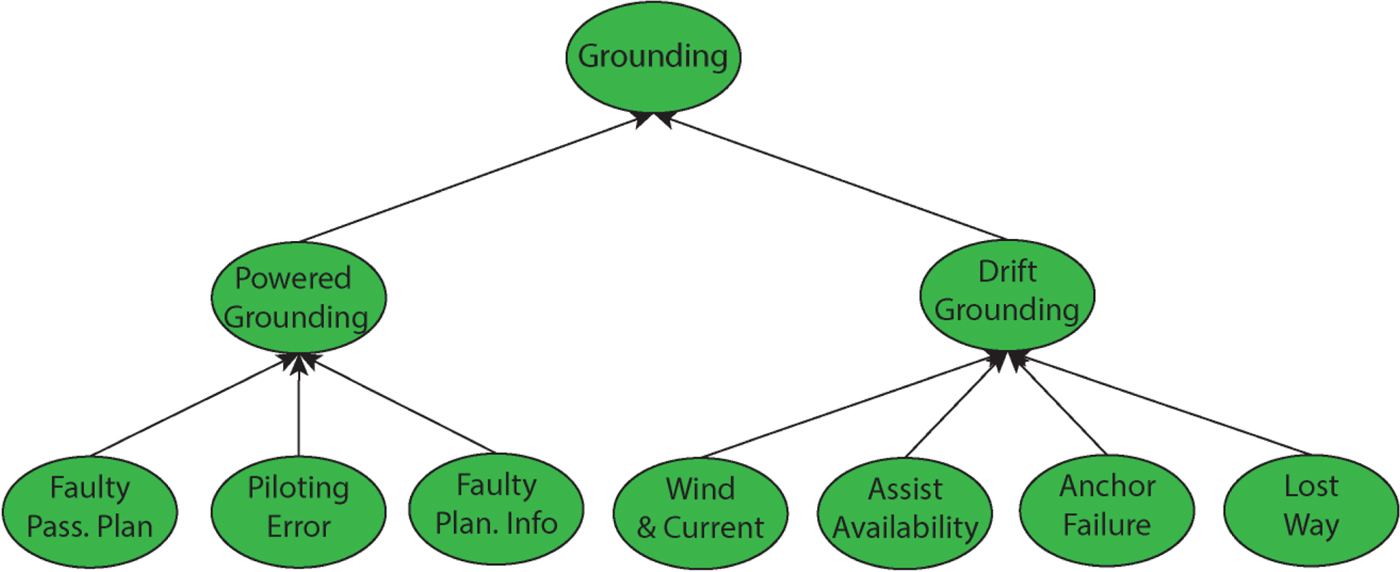
Since the early 1990s, navigation specialists have used fault trees to estimate grounding and collision frequencies.Footnote 2 Here, we follow Amrozowicz et al. (Reference Amrozowicz, Brown and M1997) and Mazaheri (Reference Mazaheri2009) in assuming that ship grounding accidents can occur in one of two ways: (i) Powered Grounding; and (ii) Unpowered Grounding. Globally, powered grounding accidents constitute the greatest proportion of total groundings. Statistical analysis reveals that voyage planning and piloting, combined with potentially faulty planning information, are the key factors affecting the risk of grounding. Accordingly, we assume that a powered grounding can occur in one of three ways: (i) Faulty Passage Planning; (ii) Faulty Planning Information; and (iii) Faulty Piloting.
In the case of an unpowered grounding, four conditions must hold in order for an accident to occur (Mazaheri, Reference Mazaheri2009; Amrozowicz et al., Reference Amrozowicz, Brown and M1997):
-
1. Presence of Unsafe Wind or Current. Wind and/or current are almost invariably seen as critical factors in unpowered grounding accidents;
-
2. Assistance Failure. A failure to request assistance (at all, or in a timely manner), or the assistance fails to tend the vessel away from a grounding occurrence;
-
3. Anchor Failure. The anchor is either deployed in a timely manner, or if deployed, it fails to prevent the grounding event from occurring;
-
4. Lost Way. The ship loses most or all of its directional stability due to either a loss of propulsion or steering.
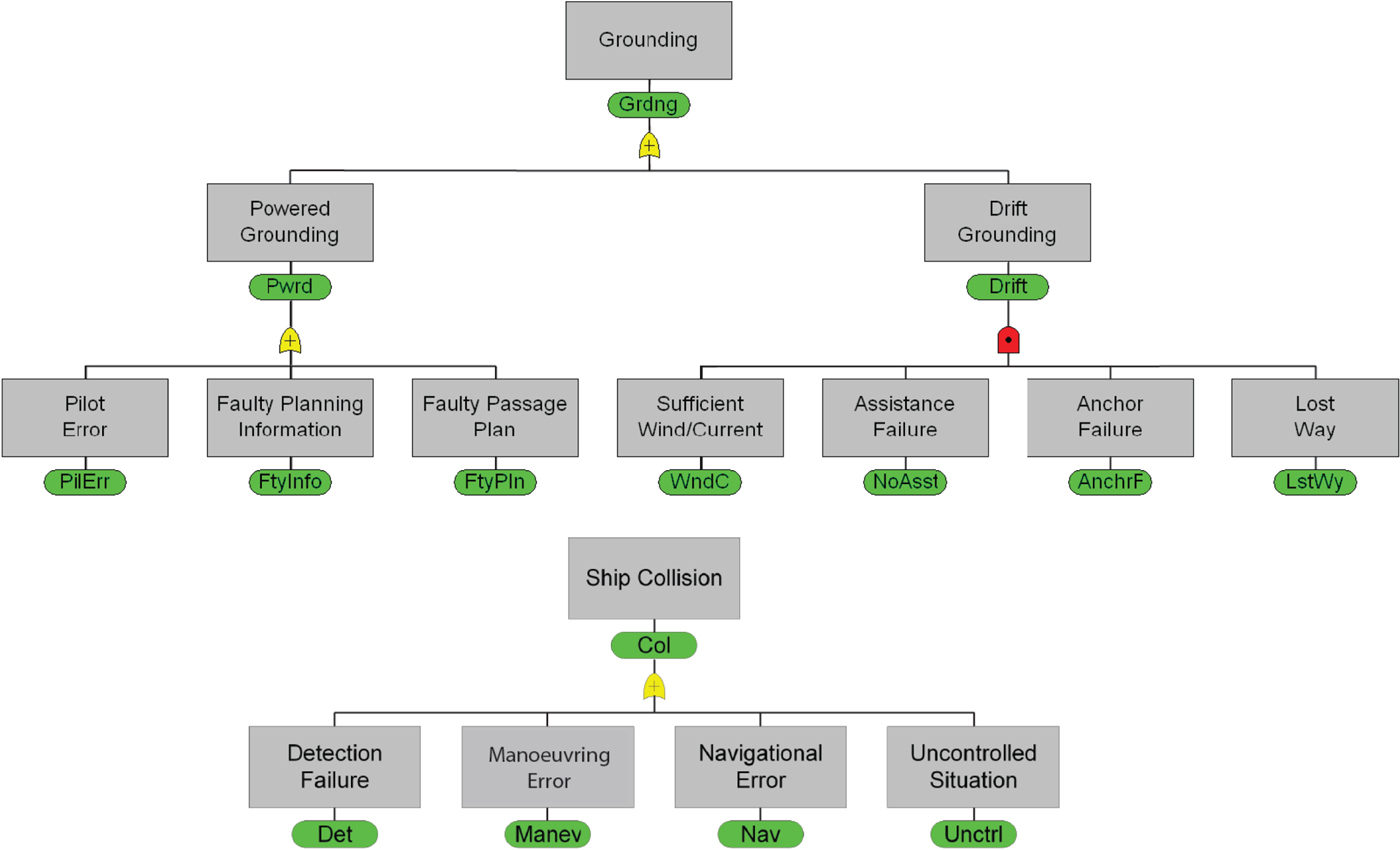
The logical structure of the ship grounding failure modes described above can be depicted in the form of a fault tree, as shown in the top-portion of Figure 2. Following a similar line of reasoning, we can specify a fault tree for ship collision accidents, as shown in the bottom portion of the figure.Footnote 3 The remainder of our analysis focuses on the ship grounding case. Analysis of the collision scenario would proceed along similar lines, and would likely yield comparable results.Footnote 4
Top: Ship Grounding Fault Tree - High-Level view. Bottom: Ship Collision Fault Tree - High-Level view.
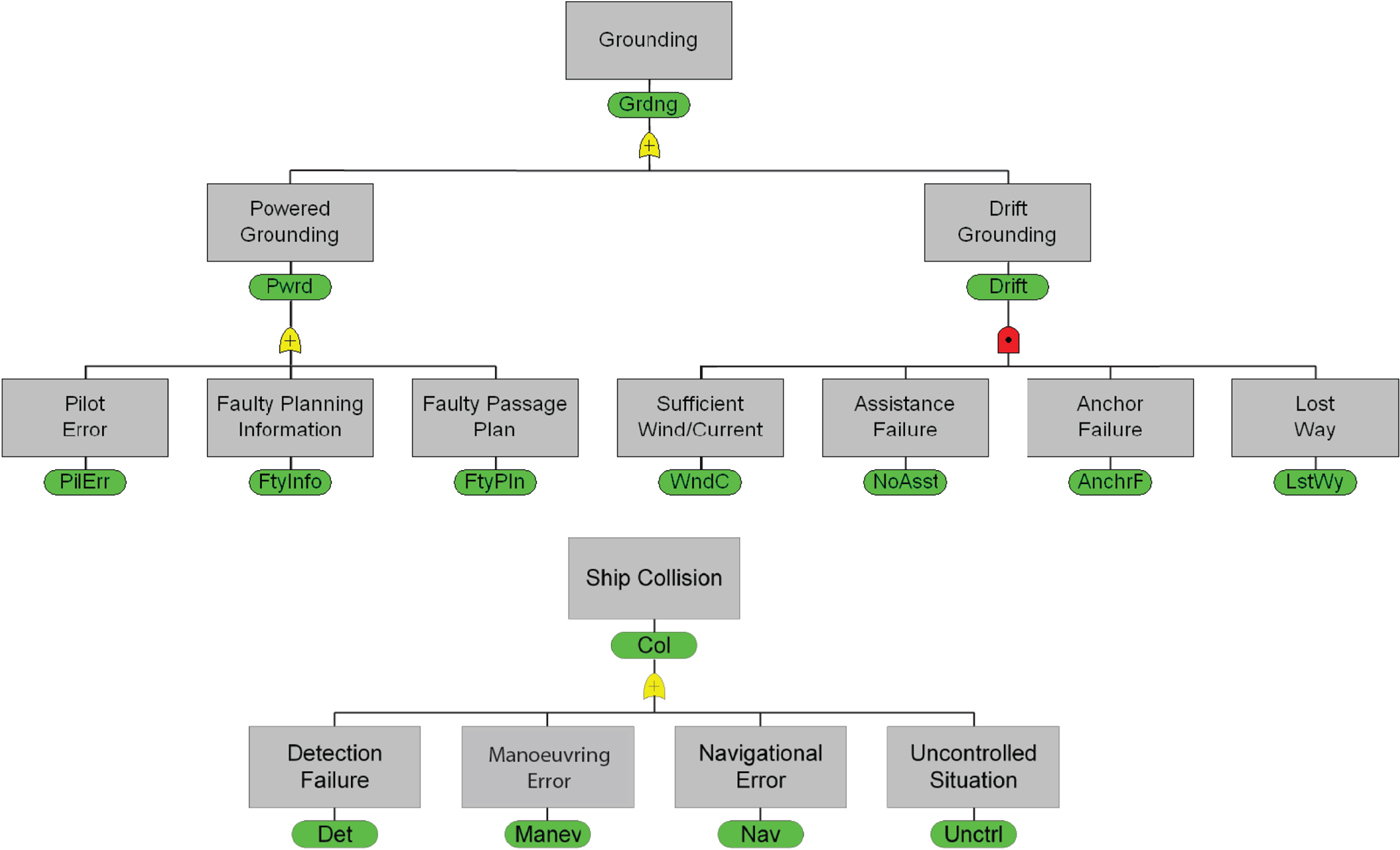
The ship grounding fault tree in Figure 2 is a high-level representation of a more detailed model presented by Amrozowicz (1997), and it is consistent with other studies found in the grounding risk analysis literature (Friis-Hansen et al., Reference Friis-Hansen, Ravn and Engberg2009). In what follows, we utilise this model as the basis for a risk assessment framework that is quantified using probabilistic event trees to estimate the uncertain quantities (highlighted in green) depicted in the fault tree. The logical structure of the fault tree, together with the assessed causation probability distributions that underlie it, provide the basis for a subsequent Bayesian network analysis (presented in Section 3) of the influence of the vessel speed restriction on the overall accident risk.
2.1.2. Event Tree Analysis
Event tree analysis is often used to model the dynamic or sequential nature of accident progression. Here, we follow Amrozowicz et al. (Reference Amrozowicz, Brown and M1997) in delineating a set of probabilistic event trees that provide first-order estimates for two of the stochastic elements of the ship grounding fault tree shown in Figure 2, namely, for faulty passage planning and for faulty piloting. Passage planning necessarily entails several interrelated steps, all of which are subject to potential human error and/or miscalculation (Leva et al., Reference Leva, Friis-Hansen, Sonne Ravn and Lepsoe2006; Ramos Martins and Coelho Maturana, Reference Ramos Martins and Coelho Maturana2010; Graziano et al., Reference Graziano, Teixeira and Guedes Soares2016). The probabilistic event tree for faulty passage planning focuses on five factors:
-
1. Check Publications for Accuracy/Reliability. Vessel crews make use of various sources of information to ensure a safe and efficient passage. Human errors can arise in situations where the process of verifying the accuracy/reliability of navigational charts is potentially compromised and yields information that is not up-to-date;
-
2. Plot Changes. Any relevant changes found in the publications must be correctly entered and accounted for as part of the planning process;
-
3. Lay Down Track. Plotting the course and highlighting any identified or known hazards to navigation is a central element of the planning process;
-
4. Recognition of Faulty Track. Recovery is possible if the faulty track is recognised. Here, the focus is on meeting all the relevant constraints required for safe passage through the channel;
-
5. Captain Properly Verifies Plan. We assume an approval process that requires the Captain to verify the validity of the track. Successful verification in this step assumes that the Captain recognises and does not approve a faulty plan.
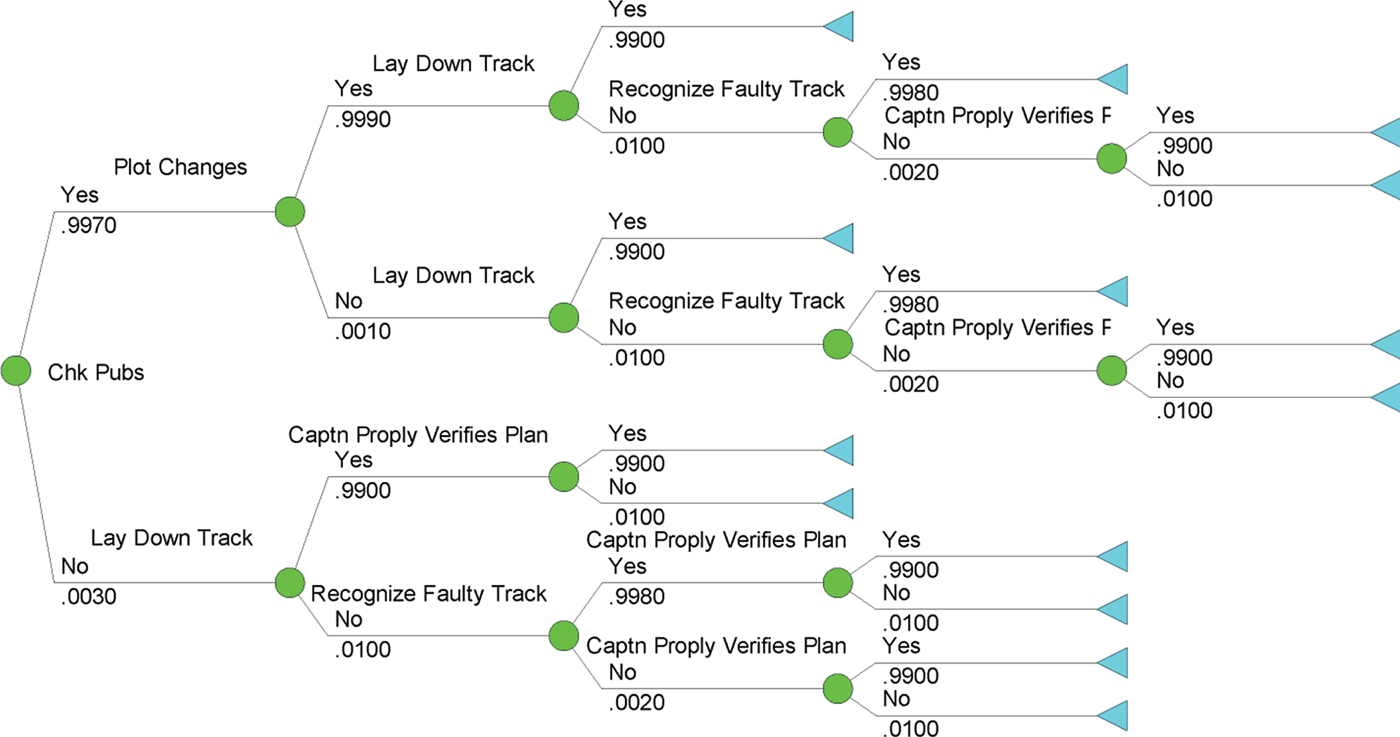
In the context of passage planning, if we assume that each of these individual factors is either “Succeed = Yes” or “Fail = No”, then a binary event tree (shown in Figure 3) can be constructed that delineates a discrete set of probabilistic scenarios where a faulty plan is approved. Following Amrozowicz et al. (Reference Amrozowicz, Brown and M1997), the probabilities used in this event tree are so-called “human error probabilities”, and are estimated using methods and values found in Dougherty and Fragola (Reference Dougherty and Fragola1988) and Gertman and Blackman (Reference Gertman and Blackman1994).Footnote 5
Faulty Passage Planning Event Tree.
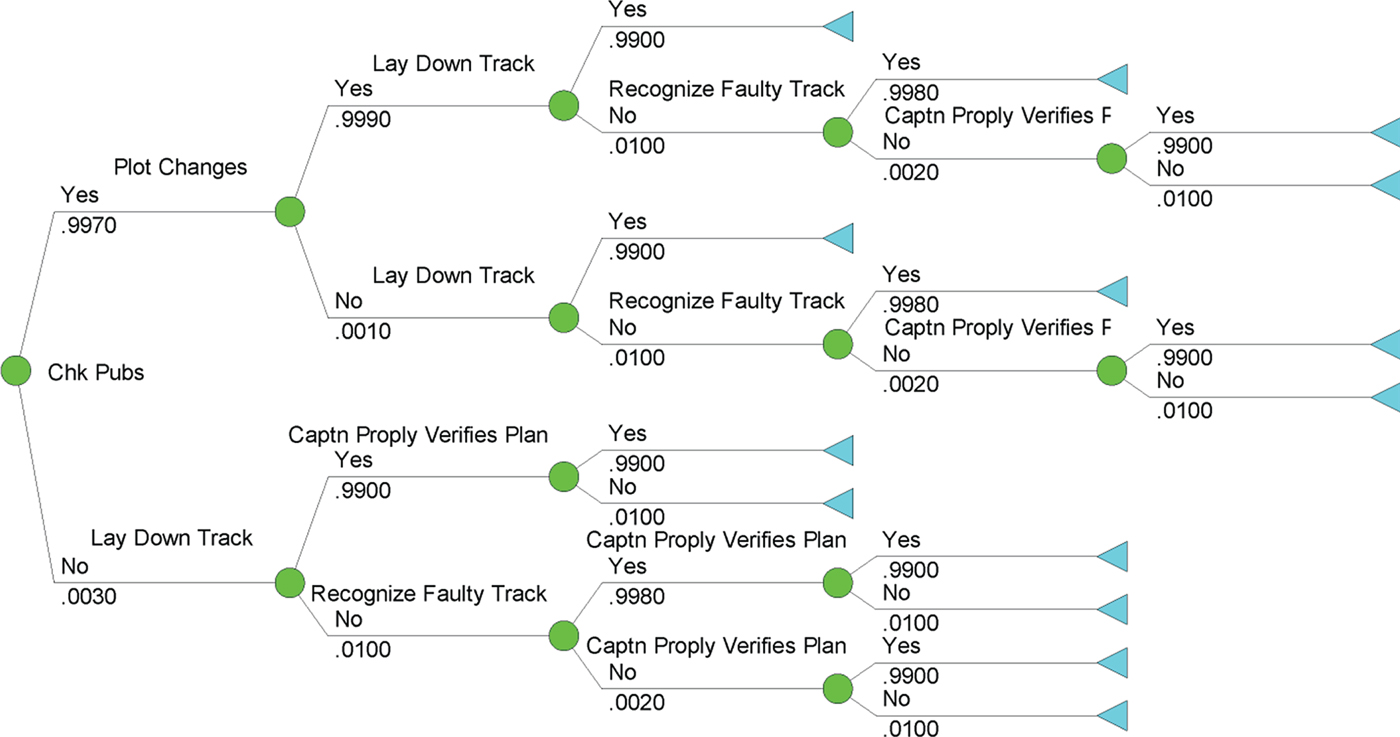
The planning event tree shown in Figure 3 delineates 14 separate path-dependent scenarios, five of which concern us here, since they each give rise to the implementation of a faulty plan. The endpoint probabilities associated with these 14 scenarios are computed as the product of the probabilities associated with each individual branch in the tree. There are five paths through the event tree that give rise to a faulty plan being approved, and the total probability of a faulty plan being approved (3·0199E-05) is obtained by summing these values.
We now address the second factor in the Powered Grounding portion of our fault tree model, namely the risks associated with Faulty Planning Information. For this portion of the analysis, we follow Amrozowicz et al. (Reference Amrozowicz, Brown and M1997) in assuming that the probability of failure is in the order of 1·0E-04.
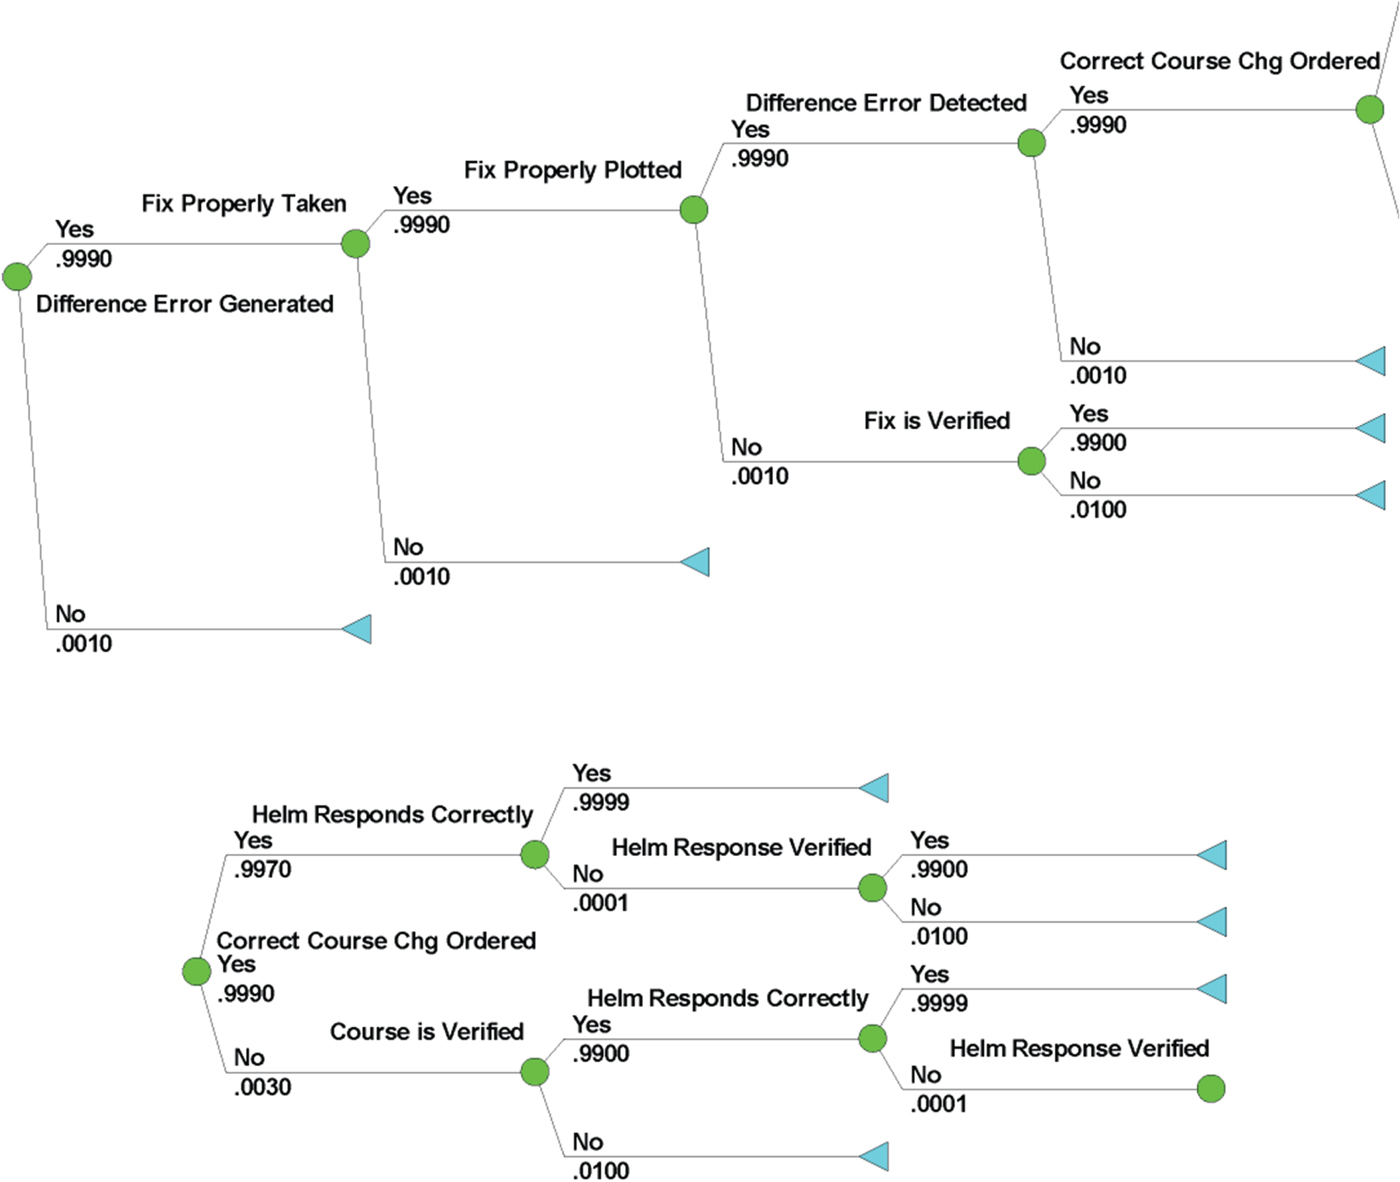
The final stochastic element in the Power Grounding portion of the Grounding fault tree focuses on Faulty Piloting. As before, we specify a sequence of events that lead, ultimately, to a range of possible piloting errors. Specifically, our analysis focuses on the following nine factors (Amrozowicz et al., Reference Amrozowicz, Brown and M1997):
-
1. Difference Error Between Actual Course and Planned Track is Generated. Information concerning the actual path being traversed is provided to the crew. Two control-loops are at play in this situation: one focused on direction, and the other focused on speed. If the desired and actual paths do not coincide, then this information is provided to the crew, creating the opportunity to modify the helm in a direction that will correct the path error;
-
2. Fix is Properly Taken. Requires the appropriate use of navigational aids/technologies (Global Positioning System (GPS), radar, etc.) to obtain the ranges;
-
3. Fix is Properly Plotted. The ranges obtained above are subsequently plotted correctly, thereby providing the crew with an estimate of the ship's position at the time the ranges were determined;
-
4. Fix is Verified. The position estimate obtained above is subject to uncertainty and requires verification;Footnote 6
-
5. Difference Error is Detected. Once the fix is plotted and verified, the navigator assesses whether the actual traversed path coincides with the desired path or trajectory;
-
6. Correct Course Change is Ordered. Once the difference error is detected, a course change is ordered;
-
7. Course is Verified. Once a course change is ordered, the course is verified;
-
8. Helm Responds Correctly. Once a course change is ordered and verified, the helm must respond properly to the order;
-
9. Helm Response is Verified. Final verification that the steering gear has been activated, thereby changing the rudder position.
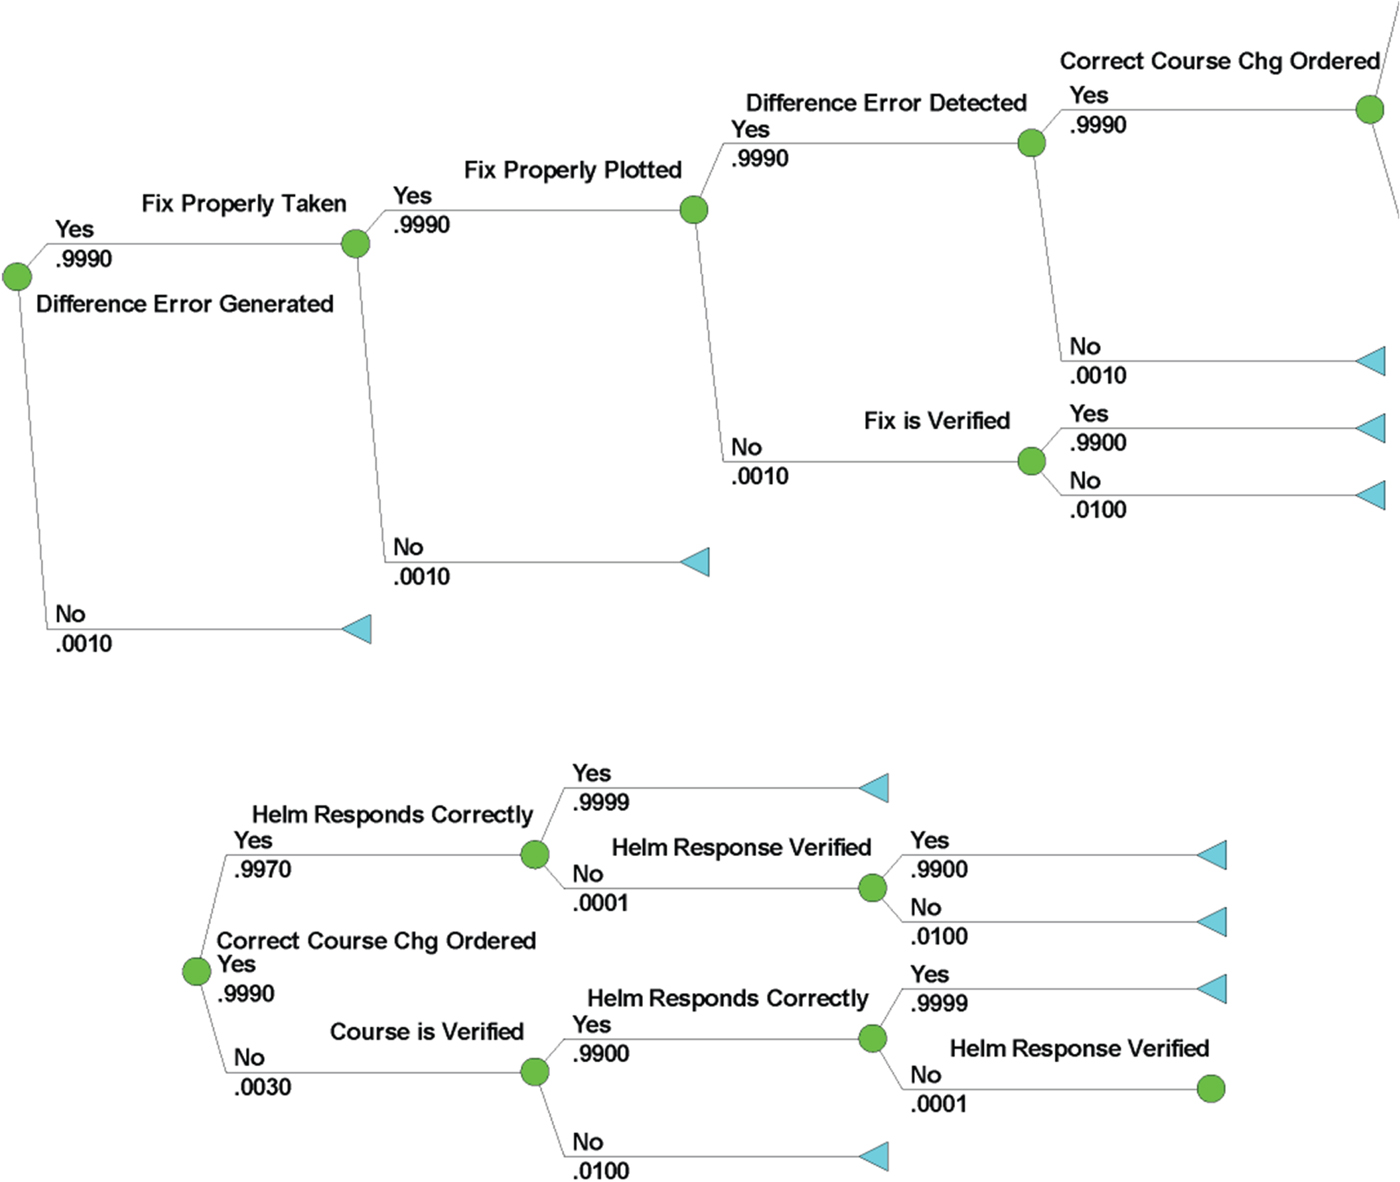
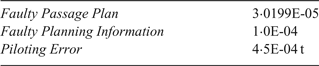
Consistent with our previous formulation, we assume that each of the factors enumerated above is binary in nature, and that, viewed in sequence, they give rise to the event tree shown in Figure 4. As before, we are interested in singling out those paths through the event tree that lead to a piloting error. This particular event tree has 12 paths, seven of which result in a piloting error; summing the probability values associated with these seven paths yields a total probability for piloting error of 0·0030. Given this failure probability, we follow Amrozowicz et al. (Reference Amrozowicz, Brown and M1997) in assuming a static error detection factor of 0·0050, which when multiplied by the probability of the piloting error, yields the probability for the compound event that the piloting sequence fails and that error fails to be detected (yielding a failure probability value of 1·5E-05). If we now divide this value by a presumed cycle time of two minutes for crews manoeuvring in the Charleston Channel, we obtain a relative rate of failure of 4·5E-04 failures per hour. The Power Grounding causation probabilities are summarised in Table 1.
Faulty Piloting Event Tree. The decision tree is split into two trees from the node “Correct Course Chg Ordered” (continued below the first tree) for visualisation purposes.
Powered Grounding Causation Probabilities.

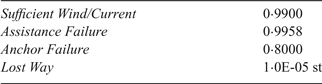
We now turn our attention to the Drift Grounding portion of the Ship Grounding fault tree. Consistent with our discussion above, in order to quantify this portion of the fault tree, we must assess failure probabilities for four factors: (i) Unsafe Wind/Current; (ii) Assistance Failure; (iii) Anchor Failure; and (iv) Loss of Propulsion/Steerage. In the case of the Charleston Entrance Channel, we draw upon historical data to conclude that it is virtually certain that sufficient wind/current exists to give rise to an unpowered grounding. Consequently, the causation probability for Unsafe Wind/Current is assumed to be 0·99. Wind also factors into the Loss of Propulsion risk assessment, as we discuss below.
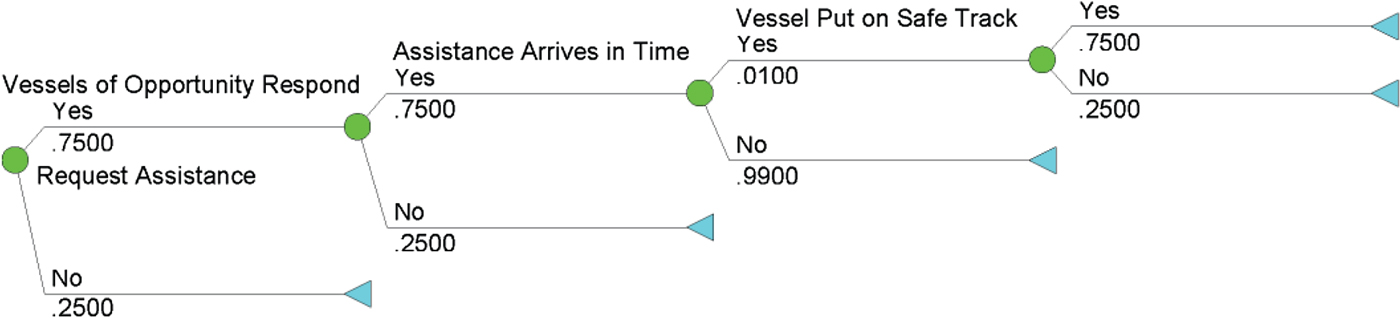
Looking now at the Assistance Failure factor, in Charleston, the entrance channel has limited potential for so-called “vessels of opportunity” to provide assistance if called upon. Ultimately, the situation is driven by the availability and capability of the tugs within the response area. The Assistance Failure event tree for the entrance channel is shown in Figure 5. In the best case scenario, vessels of opportunity are 7–20 Nautical Miles (NM) away from possibly affected vessels; in the worst case, vessels of opportunity can be as far away as 14–27 NM. In truth, then, the readiness capability for tugs to provide assistance is poor, and even in those instances where vessels of opportunity make the attempt to provide assistance, the time required to reach the distressed vessel will be in the order of 1·5 hours.
Assistance Failure Event Tree.
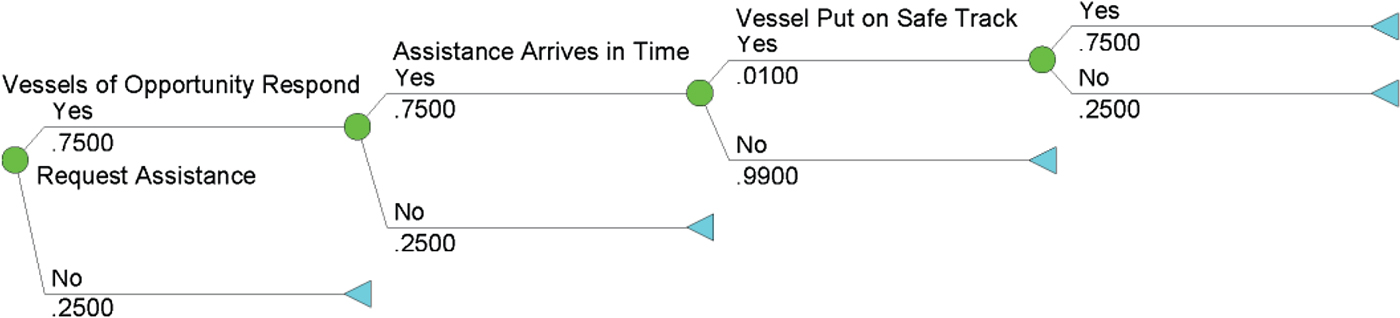
Given these considerations, the Assistance Failure event tree models the following factors: (i) Request Assistance; (ii) Vessels of Opportunity Respond; (iii) Responding Vessel(s) Arrive(s) in Time to Provide Accident Mitigation Assistance; and (iv) Vessel Put on Safe Track. As before, summing the relevant endpoint probabilities associated with this event tree yields an Assistance Failure probability of 0·9958.
We now address the topic of Anchor Failure. We begin by noting that ships typically have two anchors, one on each side of the bow. Anchors are primarily designed to hold the ship in place in situations where there is no dock. Ships at anchor are not stationary; they are merely restricted by the bow of the ship, or wherever the anchor is connected. They swing with the wind and the current. Consequently, prior to anchoring, it is important to know how the ship will ultimately behave once it is at a steady state, as influenced by wind and current. Ships also surge in line with the anchor chain according to the strain on the anchor. There must be enough water within the “watch circle”, wherever the ship may lay, or the ship could go aground and suffer a breach of the hull, even though the ship is technically anchored.
As part of this study, the Charleston Pilots were consulted on the five loss of propulsion channel incidents recorded among Coast Guard casualty records. In two of these incidents, an anchor was deployed as a mitigating measure during the event. In one incident, the anchor was deployed after the ship was hard aground, to keep it in position as the tide rose. In the other two cases, the ships remained under control for a sufficient period for the engineers on board to rectify the failure. In the two cases where the anchor was deployed for a beneficial purpose during the event, the ships had drifted down to being nearly stopped. The anchors were deployed to hold the bows where the pilots had intentionally placed them. In the first case, the ship was outbound with three ships behind. All were confined to the channel due to their draft. The first ship lost engine power. The pilot drifted the ship using only the rudder to get to a location where the water beyond the channel was deep enough for the ship to leave the channel. Once out of the channel, the pilot positioned the ship where it could not swing into the channel, and he dropped the anchor to hold it there until the engine was repaired. The ship never grounded.
In the second case where the anchor was deployed for a beneficial purpose during the event, the ship was inbound and confined to the channel. The ship's engine also failed, and the pilot maintained control using only the rudder and brought the ship further along the channel to where it was inside the breakwaters protecting the entrance to the port. Once inside the breakwaters, the ship was in a better location to sustain a grounding, where it would not be subjected to pounding forces by ocean waves. The ship was steered to be along the side of the channel where the wind was likely to hold the vessel against the bank, rather than where it could potentially blow the ship across the channel. Once at slow speed (so the anchor chain would not break), and with the ship positioned as it would eventually lay with the wind and current off to one side of the channel, the pilot ordered the anchor deployed. The ship lay there aground, though in the most fortuitous available location and orientation, until tugs arrived to take the ship to the dock. That ship also had another ship following it, and the second ship had sufficient room to safely pass the grounded vessel, thereby avoiding a forced grounding to avoid collision.
While perhaps anecdotal, it is important to note that in both instances, the anchor was essential, not to gain additional control of a stricken vessel, but rather to hold a vessel where it was in a relatively safer location. In the first of these two cases, the ship did avoid grounding, and the anchor was ultimately critical to keeping the ship in a safe anchorage, precluding continued drift to an eventual grounding, or into the path of another vessel. Though this is a small number of incidents from which to draw statistically meaning inferences or conclusions, in one of five cases occurring in the dredged entrance channel described here, the anchor was instrumental in preventing the ship from grounding.
As noted above, this set of data is limited in size, though it is representative of five years of activity in one of the nation's major ports. From a frequency perspective, the numerical outcome is that the anchor was useful in 20% of the cases to prevent grounding, and failed to be of use in 80% of the cases. Therefore, for our purposes here, Anchor Failure is assumed to characterised by a likelihood value of 0·80.
The final element required for the complete enumeration of our fault tree model is Loss of Propulsion/Steerage. In a scenario where a ship loses propulsion power, the only remaining control is with the rudder, which is dependent on the flow of water over the rudder that results from the residual speed of the vessel. The vessel will still be beset by ambient wind and current, and the rudder angle that is required to maintain course within the channel will necessarily increase as the ship loses speed. The rate of deceleration will increase with increased rudder, due to the drag that accompanies lift to induce change in the ship's heading.
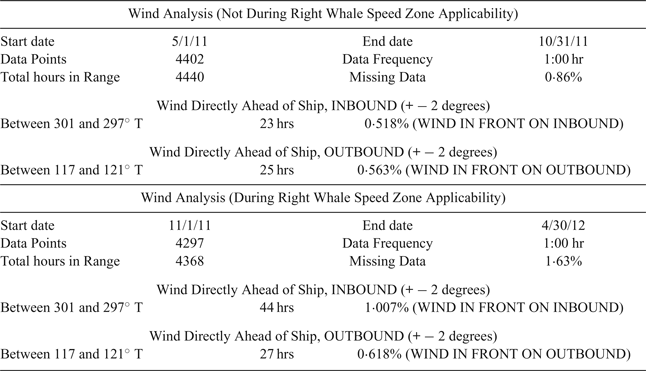
A longer duration of steering control affords more options to mitigate the outcome of the incident and it affords the engineers aboard more time to restore the engine's operation. Accordingly, as part of this study, we explored numerous data sources to support the probability estimate for the fault tree model's Lost Way element. In order to better understand the nature of loss of propulsion power incidents on ships entering or leaving the Port of Charleston while in the exposed Entrance Channel, one year of archived sustained wind data for the Edisto Weather Buoy was analysed (Table 2). Specifically, empirical research captured one year of wind data from May 2011 through April 2012, recorded hourly, and then broken out into the six months that were within the annual Right Whale Seasonal Management Area period of applicability (1 November 2011 through 30 April 2012), and for the six month period in which the SMA was not applicable (1 May 2011 through 31 October 2011). The data that is summarised in Table 2 is from the NOAA National Buoy Data (NOAA, 2017).
Analysis of wind data near Charleston Entrance Channel. Data Source: http://www.ndbc.noaa.gov/station_history.php?station=41004 (NOAA, 2017) compiled by the Charleston Branch Pilots Association.

Should a ship experience a loss of propulsion power that endures longer than steering control can be maintained, it is almost certain that the ship will go aground unless the ship can lay at anchor in line with the channel. This scenario is only possible when the wind happens to be directly opposing the vessel's course in the Entrance Channel. Should the incident occur while the vessel is outbound, the wind would have to be from the southeast, specifically from the true heading of 119°. An inbound vessel would need the aid of winds from the northwest, specifically from a true heading of 299°, to remain in line with the channel after dropping anchor. To account for the width of the channel, the wind data was culled to count the prevalence of winds 2° in either direction from these bearings, or 117–121° for the outbound scenario, and from 297–301° for the inbound scenario. If this is a possible outcome, a pilot or ship master would likely drop the anchor and take advantage of the favourable wind to keep the vessel in line and in the deep water of the channel.
Having lost power and, eventually, losing steering control, a grounding is highly likely, unless the ship can anchor and lay in line with the channel. This is only possible if the wind is coming from the direction into which the ship was heading, while either inbound or outbound in the channel. According to the wind data collected, during the six-month period that the Right Whale speed rule is applicable, the wind was found to be in the proper direction to hold an inbound vessel in the channel at anchor 1·007% of the time, and in the proper direction to hold an outbound ship at anchor in the channel 0·618% of the time.
In addition to the wind data described above, data from the US Coast Guard on loss of power reports for commercial ships in the Charleston Harbour in the last five years is useful for our purposes. Analysis of this data indicates that, over the five-year period, there was a 0·15% incidence of a propulsion failure anywhere in the port's channels or waters, and of these, there was an incidence of 0·13% for voyages inside the harbour, and of 0·025% in the Entrance Channel itself.
To utilise this propulsion failure incidence data as a first-order approximation for the Lost Way element of our fault tree model, we note, first, that the observed failure rate is a function of time in transit and transit length. Empirical data for the Charleston Harbour shows that the average transit length for 4,300 out of 4,440 voyages during the last year was approximately 25 NM. Consequently, the probability per NM of having a loss of propulsion/steerage accident is 2·5E-04 / 25 = 1·0E-05 accidents per NM. If we now multiply this value by the ship's speed, s, we obtain a hazard rate, λ. It is common to assume that the unreliability of this component is characterised by the unreliability function
 $$F (t) = 1 - \exp (-\lambda t)$$
in which case the unreliability over time for loss of propulsion/steerage is approximately 1·0E-05 × s × t, where t denotes time in hours. In the Charleston Harbour, ships are inbound or outbound within the entrance channel for 0·6 to 1·0 hours (average 0·8 hours) when the speed rule is not in effect (May–October); ships are inbound or outbound within the entrance channel for 0·8 to 1·3 hours (average 1·0 hours) when the speed rule is in effect (November–April). A ship applying the 10 knot rule, without deviating to a higher speed, will be inbound or outbound in the entrance channel for approximately 1·3 hours. A summary of the Drift Grounding causation probabilities is summarised in Table 3.
Drift Grounding Causation Probabilities.

3. PROBABILISTIC ANALYSIS OF THE VESSEL SPEED RESTRICTION
Fault trees are useful qualitative and quantitative vehicles for exploring the logical structure of accidents and failure modes. There are, however, two important drawbacks associated with this methodology, namely, the inability to represent complex probabilistic dependencies, and the inability to incorporate multi-state variables into the analysis. As we discuss below, capturing knowledge and information about complex functional relationships and interdependencies is an important element of any reasoned effort to address the potential navigational safety implications of the vessel Speed Restriction (hereafter denoted SR).
From the vantage point of the risk assessment framework presented earlier in Section 2, we now pose the question, “what influence does the SR have on the assessed ‘baseline’ navigational safety risks?” An important first step towards answering this question requires that we begin by acknowledging that the SR's influence on navigational safety - here, viewed through the “proxy lens” of just one important and prevalent accident type, namely, ship grounding - is likely to influence and interact in complex ways with the risk factors considered in our risk assessment framework.
Central to meeting the modelling challenge described above is the ability to represent local conditional dependencies. While fault trees are inherently limited in their ability to represent probabilistic dependencies, Bayesian Networks (BNs) are particularly well-suited to this task. In this section, we sketch the rudiments of a BN framework for analysing the influence of the vessel speed restriction on navigational safety. Our analysis proceeds in three parts. First, we map our previously specified and enumerated Ship Grounding fault tree model into an equivalent BN representation. Second, we augment the BN system representation to include the probabilistic influence that the SR has on specific risk-related aspects of the overall system. Finally, the baseline navigational safety risks assessed previously are then compared against alternative SR policy choices, using the multi-state variable capability of the enumerated BN model.
3.1. Fault Tree Mapping into Bayesian Networks
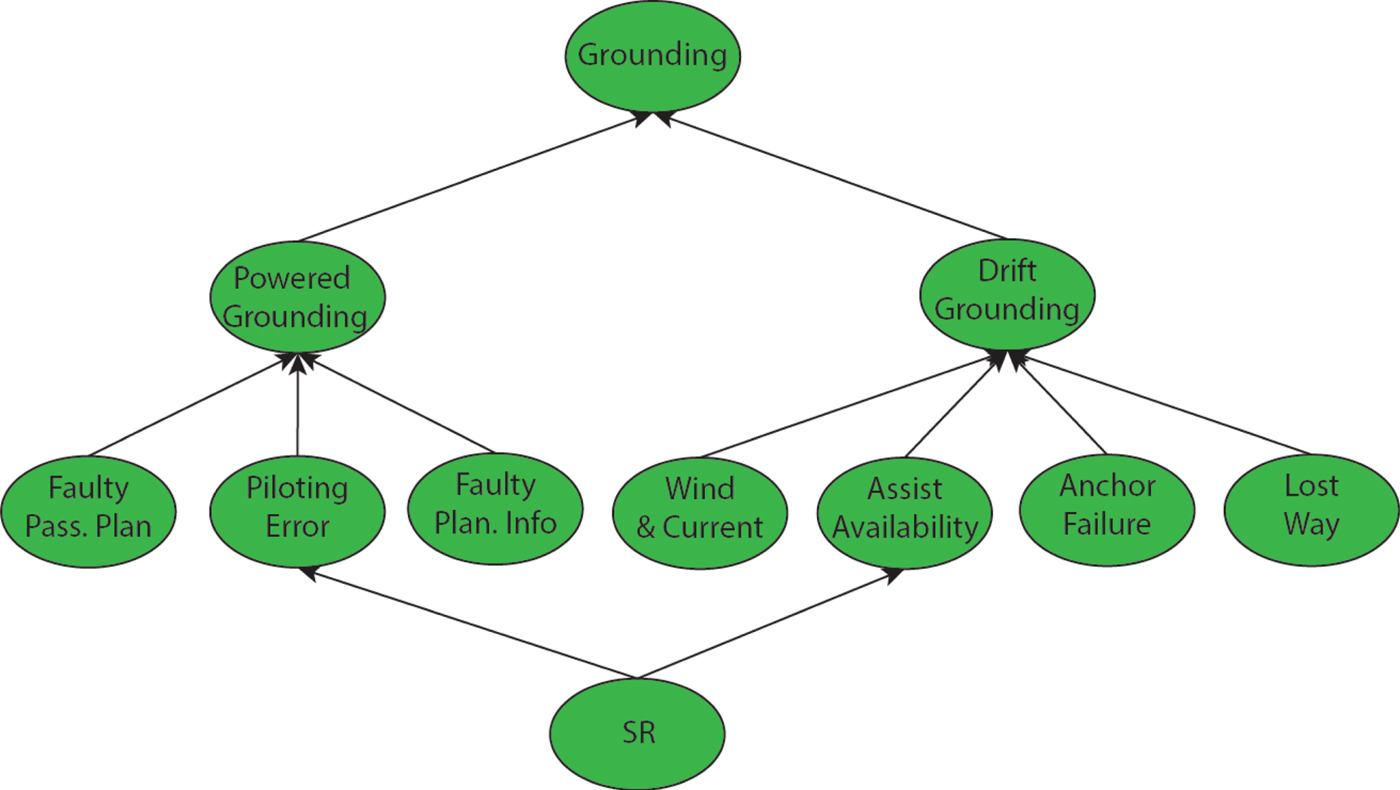
Using quantitative methodology presented by Bobbio et al. (Reference Bobbio, Portinale, Minichino and Ciancamerla2001), it is possible to map our enumerated Ship Grounding fault tree model into a corresponding BN model, as shown in Figure 6. The BN formulation of our enumerated fault tree model provides a powerful vehicle for computing a number of useful risk-related measures. For example, forward propagation through this BN allows us to compute the unreliability of the Top Event (“Ship Grounding”) as the a priori probability of system failure, i.e., Pr(Grounding = Yes). Performing the required numerical computations within the enumerated BN model yields a value for this probability of 7·7719E-04.Footnote 7 Also useful in this regard is the ability to compute the marginal posterior fault distributions associated with each basic component in our framework, e.g., Pr(Piloting Error | TE), which is the conditional probability of Piloting Error, given that the Top Event, Grounding, occurs. These posterior probability values provide valuable information about the criticality of each basic component Bobbio et al. (Reference Bobbio, Portinale, Minichino and Ciancamerla2001). Performing these calculations on the BN model specified above yields the posterior failure probabilities shown in Table 4. These numerical results indicate that the factors Wind and Current, Assist Avail, and Anchor Fail are the top-three critical elements of the overall system, if the system is faulty.
Belief Network Representation of Ship Grounding Fault Tree.
Posterior Failure Probabilities - Grounding.

3.2. Modelling the Influence of the Vessel Speed Restriction
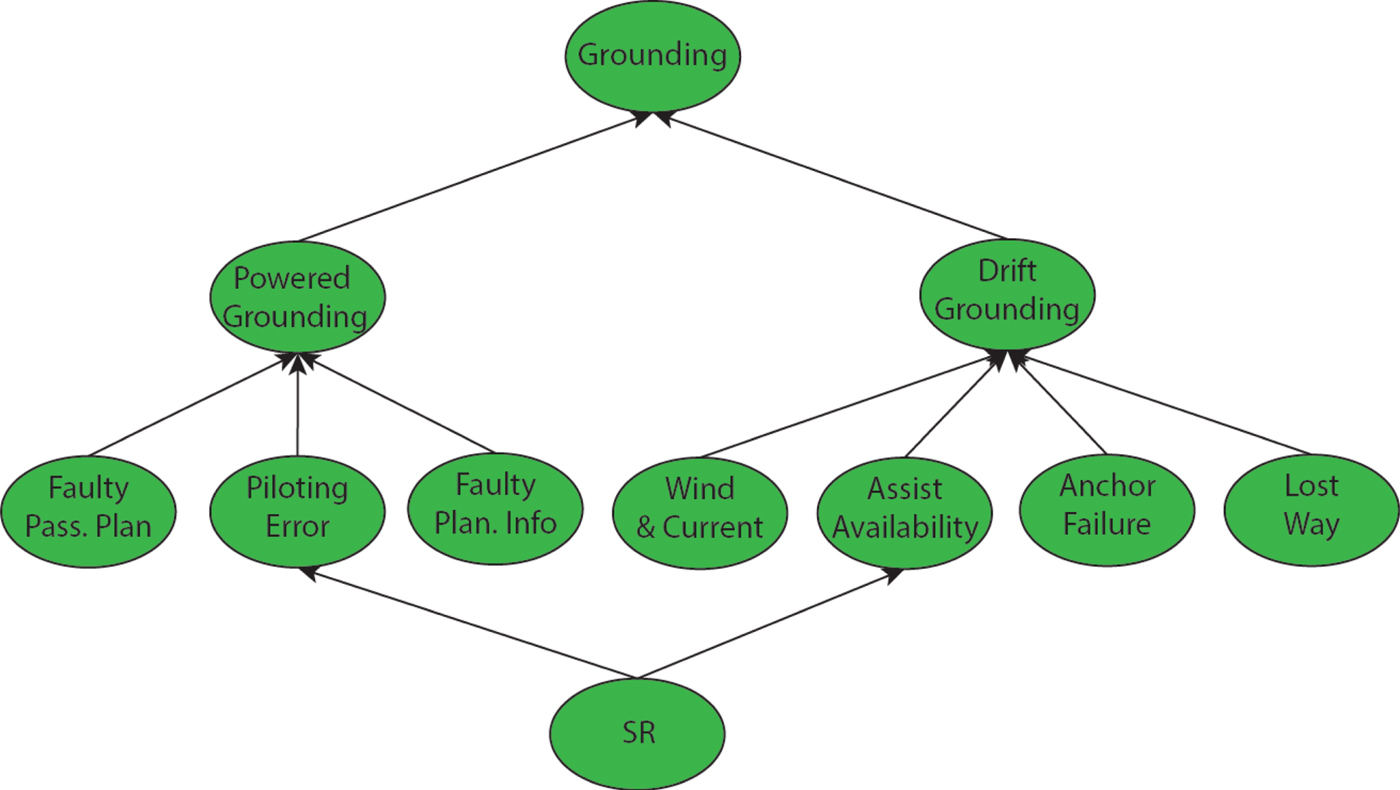
We now augment our BN model formulation to explicitly account for the probabilistic influence that the SR has on specific components within the overall system, using the criticality results obtained above. Consider first the modified BN shown in Figure 7. Structurally, we note that the network now includes a stochastic node labelled SR, representing the vessel speed restriction itself, plus two other (hypothetical, though realistic, given the context) speed restrictions (15 and 20 knots), with arcs leading into two of the network's stochastic nodes: Piloting Error and Assist Avail. Other such modifications to our initial BN model are possible, denoting different characterisations of the SR's influence, and different kinds of assumptions regarding sequentially dependent failures (e.g., an arc from Wind and Current to Anchor Fail would capture some of the complex dependencies associated with anchor failures).
Modified BN to Include Influence of SR and Dependent Failures.
For the purposes of illustration, using experts drawn from the Charleston Branch Pilots association and the US Coast Guard, we enumerated the modified BN using the following set of assumptions:
-
• Empirical records indicate that the typical speed applied in the entrance channel during the speed-restricted months is greater than ten knots (as allowed by the rule's deviation clause); weather, seas and the narrow dimensions of the channel demand the deviation clause on nearly every voyage; consequently, greater probability weight is given to the alternative speed restriction values considered in the model.
-
• Consistent with our earlier discussion concerning propulsion and manoeuvrability, we assume that the likelihood of the event “Assist Fail = Yes” is greatest (and, in fact, virtually certain) at 10 knots, and diminishes by ~30% at 20 knots.
-
• The 10-knot rule is assumed to increase the likelihood of a piloting error by 20%, due to the fact that manoeuvrability is diminished (by a quantifiable amount, given assumptions about wind, current, and a host of other factors) and reaction/response times are severely curtailed at 10 knots (in the order of 1–2 min.); at 15 knots, we assume the baseline failure rate computed previously, since manoeuvrability is increased, as are average reaction/response times (in the order of 5 minutes); and at 20 knots, we assume that the risk of failure is reduced by 20%.
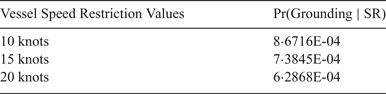
If we now re-evaluate the system's failure probability, this time computing Pr(Grounding | SR), i.e., now accounting for the influence the speed rule has on the overall system, the revised failure probabilities that emerge from this analysis are shown in Table 5.
Posterior Failure Probabilities for Grounding Analysis.

4. DISCUSSION AND CONCLUDING REMARKS
The risk assessment presented here provides a first-order analysis of the navigational safety risks associated with the Charleston Entrance Channel, with specific emphasis on ship grounding accidents. Our analysis utilised fault and event tree models - enumerated with published maritime industry statistics, together with Charleston Harbour and Entrance Channel-specific data - to arrive at a baseline characterisation of powered and unpowered grounding causation probabilities. The enumerated elements of the fault tree analysis were then used to specify a numeric mapping to a Bayesian network model which, subsequently, provided a convenient computational vehicle for reasoning under uncertainty about key aspects of system failure within Charleston Harbour. In this latter portion of our analysis, we illustrated how the vessel speed restriction can be seen to influence and interact with the key factors driving the likelihood of ship grounding accidents in the channel. The probabilistic analysis presented suggests that the speed restriction can, under certain assumptions, be seen to adversely impact the risk of ship grounding accidents in the Entrance Channel. Numerically, the speed restriction is seen to give rise to an 11·58% increase in ship grounding risk (relative to the assessed baseline risk), whereas at 20 knots, those same risks are reduced by almost 20%. Ship manoeuvrability lies at the core of this issue, for the simple reason that manoeuvring ships involves complex interactions between two control loops: a directional control loop and a speed control loop. Of course, the human reliability dimensions of navigational safety complicate the interplay between these two control loops, especially in restricted or congested waters such as in the Charleston channel, where these control loops interact with one another in tightly coupled ways, typically within severely constrained timeframes.
These considerations lead us to conclude that the very nature of the influence that the vessel speed restriction has on the navigational safety risks assessed here is, itself, both complex and uncertain, and deserving of further study. From a holistic perspective, it is difficult to ignore the fact that grounding and collision risks are increasingly aggravated by the insufficient size of port channels (in terms of size and depth), together with the larger size of new ships (e.g., Post Panamax).Footnote 8 Indeed, on average, ships are now 30–50% larger than in 2006 (when the US Coast Guard first expressed concerns about the RWR), meaning that safety margins are greatly reduced since the inception of the vessel speed restriction. Moreover, the current operational definitions for SMAs and DMAs leave 25% of recorded right whale sightings unprotected.
By way of closing, we reiterate the basic theme that we began with, namely, that the topic of navigational safety is fraught with conflicting objectives and complex value trade-offs. In the post-9/11 era, policymakers have had to confront the difficult challenges associated with balancing safety and security concerns against desires pertaining to economic production and prosperity. In the case of Charleston Harbour and the Entrance Channel speed restriction, policymakers are faced with a difficult set of trade-offs involving a host of factors, including safety, environment, nature conservancy, and commerce. There can be little doubt that all the stakeholders involved have a shared interest in ensuring that the system operates efficiently, while concomitantly sustaining population health, safety, and the environment.
ACKNOWLEDGMENTS
This work was supported, in part, by the US Army Corps of Engineers (USACE) and the US Army Engineer Research and Development Center (ERDC). We are grateful to Dr. Todd Bridges (ERDC), Mr. John Cameron (Charleston Branch Pilots Association), and Mr. Joseph Wilson (USACE) for their assistance and support. The views and opinions expressed herein do not necessarily state or reflect those of the United States Government or any agency thereof.