Nomenclature
- ACLS
-
Air Cushion Landing System
- BM
-
baseline model
- CFD
-
computational fluid dynamics
-
 ${C_L}$
,
${C_D}$
,
${C_M}$
-
coefficient of lift, drag and pitching moment
-
${C_{{D_0}}}$
-
drag coefficient at zero angle-of-attack
-
${C_L}/{C_D}$
-
lift to drag ratio or aerodynamic efficiency
-
${C_{{L_\alpha }}}$
-
lift versus angle-of-attack slope,
${\rm{de}}{{\rm{g}}^{ - 1}}$
-
${C_L}/{C_D}$
-
aerodynamic efficiency
-
${C_{{L_{{\rm{max}}}}}}$
-
maximum lift coefficient
-
${C_M}$
-
coefficient of pitching moment
-
${C_{{M_\alpha }}}$
-
moment versus angle-of-attack slope,
${\rm{de}}{{\rm{g}}^{ - 1}}$
-
${C_P}$
-
coefficient of pressure
-
${D_{{\rm{max}}}}$
-
maximum lobe diameter,
${\rm{m}}$
-
$f$
,
$g$
,
$h$
-
distance between neigboring lobe nose centres in longitudinal, lateral and normal directions, respectively
- FEA
-
finite element analysis
- HP
-
high pressure
- ICAO
-
International Civil Aviation Organisation
-
${U_\infty }$
-
freestream velocity,
${\rm{m}}/{\rm{s}}$
- HAs
-
hybrid airships
-
${L_h}$
,
${V_h}$
,
${D_{{\rm{max}}}}$
-
length, volume and maximum diameter of hull
- LP
-
low pressure
- LTA
-
lighter-than-air
- LTV
-
lighter-than-air vehicles
-
$Ma$
-
Mach number
- NS
-
Navier-Stokes equations
-
$\bar x$
-
non-dimensional longitudinal distance on hull
-
$\bar y$
-
non-dimensional lateral distance on hull
- OpenFOAM®
-
Open-source Field Operation and Manipulation®
-
$p$
-
pressure of flow,
$Pa$
- RANS
-
Reynods-averaged Navier Stokes
-
$Re$
-
Reynolds number
-
$t$
-
time of flow,
${\rm{s}}$
-
${\tau _{ij}}$
-
Reynolds’ stresses
- SST
-
shear-stress-transport turbulence model
- SIMPLE
-
Semi-implicit Pressure Linked Equation
-
$SL\_Lo$
,
$SL\_Zi$
-
single-lobed LOTTE and Zhiyuan-1 bare hull
- SA
-
Spalart-Allmaras turbulence model
-
$TL\_Lo$
-
baseline tri-lobed hull based on LOTTE bare hull
-
$k$
-
turbulence kinetic energy,
${{\rm{m}}^2}/{{\rm{s}}^2}$
-
${U_x}$
-
frestream velocity component,
${\rm{m}}/{\rm{s}}$
- MP, SP
-
vertical longitudinal plane on middle-lobe and side-lobe, respectively
-
${y^ + }$
-
non-dimensional cell-wall distance


Greek symbol
-
$\alpha $
-
angle-of-attack,
${\rm{deg}}$
-
$\rho $
-
density of air,
${\rm{kg}}/{{\rm{m}}^3}$
-
${\nu _\infty }$
-
freestream kinematic viscosity,
${{\rm{m}}^2}/{\rm{s}}$
-
$\omega $
-
turbulence specific dissipation,
${{\rm{s}}^{ - 1}}$


1.0 Introduction
Owing to the increased globalisation demands, the transportation industry has been witnessing a steep annual growth and is poised to expand at a rate of
 $5.8{\rm{\% }}$
within the next five years [1]. A 2020 report presented by the U.S. Environmental Protection Agency concluded a stark
 $7{\rm{\% }}$
year-on-year increment of global CO
 ${{\rm{\;}}_2}$
emissions [2] with road transportation contributing to more than
 $84{\rm{\% }}$
of the total greenhouse emissions. Emissions pertaining to medium and heavy trucks increased by more than
 $84{\rm{\% }}$
during the same period. Cargo ships present the highest range with lower emissions at the expense of significantly steeper delivery times (see Appendix A.1). Thus, there is a need to reinvigorate the overall transportation sector to bridge this ongoing speed versus cost gap. The aviation sector, due to its fastest delivery, presents a viable option. This hard-to-abate sector, accounts for more than
 $35{\rm{\% }}$
of the global trade [3]. Despite, the technological advancements in this field leading to mitigated greenhouse gas emissions, implementation of new sustainable flight technologies, especially for long-haul flights (
 $80{\rm{\% }}$
of the fuel CO
 ${{\rm{\;}}_2}$
emissions [3]), would be paramount to achieving the goal of a truly carbon-neutral mode of aerial transportation whilst solving the speed-cost lacuna. Additionally, reliance on the current transportation technology driven by fossil fuels, is amenable to global fuel prices, which is further a function of ongoing socio-economic circumstances. For instance, April 2020–2022 [Reference Guénette and Khadan4] witnessed a hike of more than
 $350{\rm{\% }}$
due to the COVID-19 pandemic. To that end, lighter-than-air (LTA) aircraft variants like hybrid airships (HAs) are being widely recognised as the most viable option to meet the conflicting requirements of being fast, eco-friendly and cost-effective for aerial transportation [Reference Carichner and Nicolai5–Reference Dron7]. Owing to the inherent static lift generation characteristic of LTA systems, these could lead to reduced emissions compared to an airplane by an order of ten [6], which could be further reduced by integrating electric technology with these vehicles in the form of electric airships (see Appendix A.1). A study carried out by Boeing and Goodyear, inferred the advantages of HAs compared to conventional airplane especially for short-range and long-range freight missions [Reference Ardema8]. Thus, HAs while providing significantly lower (
 $25{\rm{\% }}$
) power consumption [9], could also lead to increased payload carrying capacity [Reference Ardema8], higher speeds [Reference Carichner and Nicolai5] and reduced pollution footprint [Reference Stockbridge, Ceruti and Marzocca10, Reference Carichner and Nicolai5]. Owing to these advantages alongside the parallel development of new safety measures, the advancement of material technology and the evolution of electrical propulsion for LTA technology [Reference Murugaiah, Theng, Khan, Sebaey and Singh11, Reference Koziol12], HAs are bound to become a safer and economical mode of aerial transport. In fact, these are also asserted to be less costly to manufacture and would not require a complex infrastructure to carry out ground operations [Reference Jiron13].
In view of the aforementioned advantages associated with airships, the aviation sector is witnessing a steep renaissance towards development of more efficient LTA vehicles (LTVs) since the mid-1990s [Reference Carichner and Nicolai5] and a number of companies across the globe have ventured into this technology [Reference Liao and Pasternak14, Reference Nayler15]. Their inherent sustainability characteristics, as well as long endurance capabilities, make them a viable candidate for several aerial applications including freight transport, commercial advertisements, telecommunications, pseudo-satellite and high altitude platforms to carry out weather monitoring [Reference Elfes, Bueno, Bergerman and Ramos16–Reference Choudhary and Khaitan nee Gupta22]. LTVs comprise a gas filled envelope called the hull, control surfaces and gondola as the main components [Reference Madmud19]. Lift generated by these complex aero-mechanical lifting systems can be apportioned into buoyancy lift, aerodynamic lift and vectored thrust lift generated due to the buoyancy, control surfaces or shape of the hull and propellers fixed on the hull, respectively. A unique variant of LTVs, that is HAs are characterised by generation of less than
 $80{\rm{\% }}$
of their lift from buoyancy [Reference Pope and Cooksey23–Reference Zhang, Lv, Meng and Du25]. The additional lift is linked to the aerodynamic forces generated by the hull (aerofoil shaped), wing attached to the hull or through thrust vectoring mechanisms like rotors [Reference Stockbridge, Ceruti and Marzocca10, Reference Manikandan and Pant26]. HAs collegiate the advantages pertaining to heavier-than-air vehicles and LTVs by providing improved controllability [Reference Jiron13], better ground handling [Reference Prentice and Knotts27] along with reduced fuel consumption, increased payload carrying capacity [Reference Liao and Pasternak14], susceptibility to side-wind loads because of ameliorated lateral stability [Reference Carichner and Nicolai5], reduced weight penalty, and a larger surface-to-volume ratio [Reference Manikandan and Pant26]. Considering these advantages, a number of companies across the globe including those in USA (United States of America), UK (United Kingdom), Russia and many more have been developing their respective HA variant since the 1980s. Some noteworthy examples include the winged-hybrid being developed and used by USA’s Worldwide Aeros Corporation, Moscow’s Augur Aeronautical Center, multi-lobed HAs developed by UK’s hybrid air vehicles (HAV), USA’s Lockheed Martin, Argentina’s Aero Vehicles Inc. and France’s Voliris company [Reference Stockbridge, Ceruti and Marzocca10, Reference Manikandan and Pant26–28].
Multi-lobed HAs consist of multiple conventional hulls (Fig. 1(a)) placed side-by-side which may or may not be parallel to each other (Fig. 1(b)). These lobes make use of an interconnecting surface [Reference Spearman and Feigh29] or are conjoined by virtue of overlapping the lobes (Fig. 1(b)). The later has been the accepted form of HA designing since 1998 because of a number of characteristics [Reference Carichner and Nicolai5] and most of the applications make use of two-three lobes considering a balance between the desired aerodynamic benefits (described henceforth) and the associated structural constraints [Reference Zhang, Lv, Meng and Du25]. Altering a conventional single lobe design into a multi-lobed design while retaining the same volume leads to the reduction of lobe radius, and hence the reduced material stress leading to reduced material weight. Additionally, the wide stance of these hybrids enable efficient integration of the Air Cushion Landing Systems (ACLS) to provide safe, equitable and flexible flight in remote locations without the need of a paved runway [Reference Carichner and Nicolai5, 30]. These HAs are linked with a larger surface-to-volume ratio, while providing a flatter upper surface, leading to a more efficient integration of solar arrays for long duration high altitude flights [Reference Manikandan and Pant31]. Some other advantages related to these HA variants include lower sensitivity to lateral winds, reduced length of the airship hull, as well as additional aerodynamic lift generation due to the hull cross-section [Reference Carichner and Nicolai5].
Comparison of multi-lobed airship versus conventional single lobe hull.

Number of publications related to hybrid airships per five years between 1975–2023.

Given the current push towards LTA technology [Reference Dron7, Reference Koziol12, Reference Dumas, Trancossi, Madonia and Giuliani32, Reference Lig33], the aerospace industry is witnessing a surge in research pertaining to airship variants. For instance, the period 2000–2023 accounts for more than
 $88{\rm{\% }}$
of the overall research publications related to HAs, as seen in Fig. 2. In the case of multilobed HAs, a 2001 survey by Manikandan et al. [Reference Manikandan and Pant26] emphasised that the period 1975-2020 accounted for more than
 $28{\rm{\% }}$
of the overall publication count. To that end, there has been a constant surge in airship designing investigations encompassing multi-disciplinary problems including structural mechanics [Reference Stockbridge, Ceruti and Marzocca10], material science [Reference Rana, Mandlekar, Tomar, Joshi and Ali34], flight control and dynamics [Reference Suvarna, Chung, Sinha and Pant35], thermal analysis [Reference Alam, Pasha, Jameel and Ahmed21], energy and propulsion system [Reference Murugaiah, Theng, Khan, Sebaey and Singh11] as well as aerodynamics [Reference Nippress36–Reference Carrión, Biava, Steijl, Barakos and Stewart40]. A recent study carried out by Manikandan et. al demonstrated the usage of novel airship designing methods for multi-lobed airships [Reference Manikandan, Shah, Priyan, Singh and Pant41]. Notably, airships operate in the low subsonic and high Reynolds number (
 $Re$
) range. A flow involving such low speeds and increased turbulence effects lead to the development of several non-linear, coupled flow characteristics including vortical structures related to three dimensional flow and secondary flow vortices [Reference Carrión, Biava, Steijl, Barakos and Stewart40], flow transitions due to the presence of sharp protrusions, wake formation, flow interference between hull and the appendages [Reference Carrión, Steijl, Barakos and Stewart38], boundary layer separation [Reference Lutz, Funk, Jakobi and Wagner42], laminar-to-turbulent flow transition [Reference Magar, Gulawani, Babu and Pant43], non-linearity up to very high angles of attack and the added mass phenomena [Reference Carichner and Nicolai5]. The flow-physics becomes even more complex for the multi-lobed HAs due to the increased number of geometric parameters (described later) as well as, three dimensionality associated with their low aspect ratio hulls [Reference Nippress36]. A feasibility study carried out by NASA’s Ames Research Center [Reference Ardema8] indicated the need to enhance aerodynamic understanding related to these aerospace vehicles whilst implementing novel boundary-layer control methods for drag mitigation [Reference Tripathi, M, Pandey and Pant44]. A study convened by UK’s Hybrid Air Vehicles indicated the increased influence of HA’s dependence on the reduced aspect ratio [Reference Nippress36]. Thus, an elaborate understanding of the complex aerodynamics would play a key role in increasing the world-wide acceptance of HAs in the cargo industry as well as the high altitude applications.
Drag associated with airships is one of the most important aerodynamic parameter [Reference Fei and Zhengyin45]. Since airship hull contributes to more than
 $60{\rm{\% }}$
of the overall drag [Reference Carichner and Nicolai5, Reference Shields18], and is also responsible for
 $60 - 80{\rm{\% }}$
of the lift for HAs [Reference Zhang, Lv, Meng and Du25], numerous aerodynamic studies involving airships have involved optimisation of the hull envelope for drag reduction. However, most of these studies involved modification of the conventional hulls [Reference Lutz and Wagner46–Reference Ma, Li, Yang, Wang and Zhang48]. Studies related to drag mitigation for the multi-lobed HAs through envelope modifications have been scarce [Reference Tripathi, M, Pandey and Pant44]. Most studies involving multi-lobed HAs included aerodynamic prediction of coefficients using the a priori empirical relations derived for conventional hulls [Reference Buerge24, Reference Hoerner49]. Aerodynamic estimation for airships using wind tunnel experimentation is a logistically expensive and cumbersome task, as it would require the usage of an expensive infrastructure as well as an appropriate scaled-down model [Reference Ul Haque, Amri Hafiz, Kashif, Asrar, Omar, Sulaeman and Ali50] to capture the true flow behaviour. Moreover, due to the flow complexities associated with their high
 $Re$
flow [Reference Meng, Li, Zhang, Lv and Liu51], wind tunnel experiments related to HAs have been limited to winged airships [Reference Ul Haque, Asrar, Omar and Suleiman52]. Given these challenges related to wind tunnel experiments and the limitation associated with analytical techniques, the advancement of computational power has spurred renewed interest of using numerical techniques to carry out aerodynamic analysis of airships. Consequently, a number of studies related to conventional hulls [Reference Ma, Li, Yang, Wang and Zhang48, Reference Kanikdale, Marathe and Pant53, Reference Gupta, Tripathi and Pant54], winged airships [Reference Haque, Asrar, Omar, Sulaeman and Ali55] as well as multi-lobed HAs [Reference Carrión, Steijl, Barakos and Stewart38, Reference Carrión, Biava, Barakos and Stewart39, Reference Zhang, Lv, Zhu, Du, Meng and Li56] made use of computational fluid dynamics (CFD) to carry out the required aerodynamic analysis.
A CFD tool provides numerous advantages like the ability to implement post-processing tools for deeper insights into the underlying flow-physics, and incorporate baseline model modifications without the need to setting-up up a different infrastructure. Hitherto studies related to multi-lobed HAs have been related to establishing the efficiency of different numerical solvers to capture flow-physics related to baseline generic HA models [Reference Carrión, Biava, Barakos and Stewart39, Reference Carrión, Biava, Steijl, Barakos and Stewart40, Reference Meng, Li, Zhang, Lv and Liu51, Reference Zhang, Lv, Zhu, Du, Meng and Li56]. A study by Carrión et al. carried out a detailed study on the effects of secondary lifting surfaces like fins, and leading-edge root extensions on the aerodynamics of Airlander airships [Reference Carrión, Steijl, Barakos and Stewart38]. A 2023 study investigated the usage of webbed airship hull to mitigate pressure drag [Reference Tripathi, M, Pandey and Pant44] pertaining to tri-lobed hull based on LOTTE airship hull [Reference Funk, Lutz and Wagner57]. However, as per the authors’ knowledge aerodynamic study encompassing the effect of different geometrical parameters related to a multi-lobed airship hull is not present. Given the fact that the hull contributes to more than two-thirds of the total lift [Reference Lancaster58], and aerodynamic understanding of the underlying flow-physics could play a vital role in ameliorating the shortcomings related to HAs for the future of wide-spread implementation [Reference Ardema8], the current study makes use of numerical analysis to comprehend the effect of side-lobe displacement on the overall aerodynamics of a tri-lobed airship hull in subsonic flow for different angle-of-attack (
 $\alpha $
) conditions.
The paper is structured as follows. After the current introductory section, the paper provides details related to the numerical methodology adopted during the current study. This section includes details related to the baseline model, description of geometrical parameters of the tri-lobed geometry being investigated and also illustration of the skewed tri-lobed airship hull variants investigated in this study. Subsequently, the results and discussion section begins by elaborating the solver validation process followed by a brief description of differences between a conventional single-lobed and a baseline tri-lobed airship hull. Further, the paper discusses aerodynamic impacts of varying the relative placement of side-lobes with respect to middle-lobe through comparison of the associated aerodynamic coefficients. This section will further make use of two-dimensional and three-dimensional flow-field plots to delineate the underlying flow-physics. The final conclusion section provides key-insights into the aerodynamic considerations that need to be addressed while fine-tuning the skewed tri-lobed geometry based on pre-determined aerodynamic requirements, with respect to relative placement of the neighbouring lobes.
2.0 Numerical Methodology
2.1 Geometry and flow conditions
2.1.1 Conventional airship hull: LOTTE hull [Reference Funk, Lutz and Wagner57]
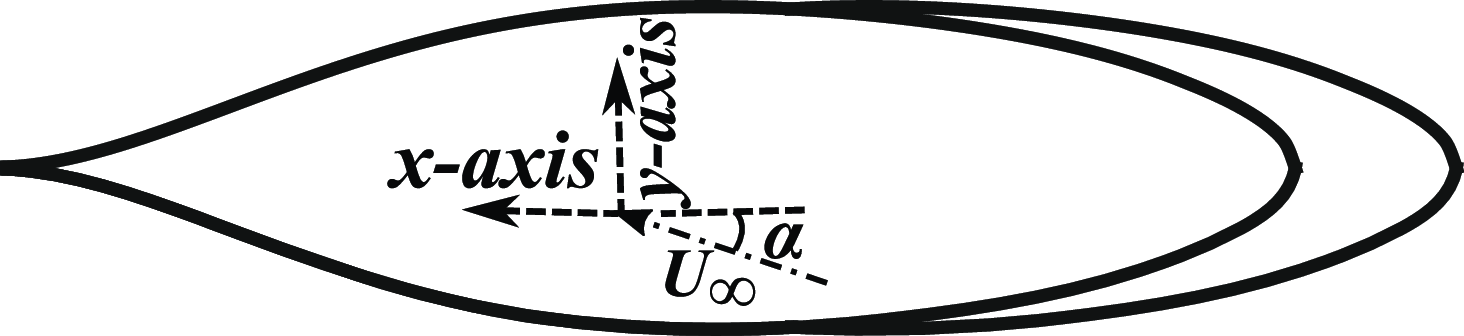
Numerical investigations with respect to the tri-lobed geometry were preceded by carrying out numerical simulations related to the conventional single-lobed airship hull, namely the LOTTE airship envelope. In fact, the associated numerical simulations were also used as benchmark to carry out the necessary solver validation. The LOTTE-based conventional single-lobed hull (also notated as SL_Lo) was based on generatrix of the standard LOTTE profile. LOTTE was the first ever autonomously operated solar airship designed in 1992 by a research team at the University of Stuttgart (Germany). This solar airship consisted of a number of on-board instruments, viz camera and on-board sensors to provide continuous data-feed to assist in autonomous flight operations. Owing to its high-quality precision control, it was utilised across numerous missions including forest fire monitoring, border surveillance, aerial photography and several research projects as a reference configuration [59]. Based on the extensive application of this profile as a benchmark for numerical studies [Reference Tripathi, M, Pandey and Pant44, Reference Ma, Li, Yang, Wang and Zhang48], the current study also makes use of this hull for carrying out solver validation. Its hull generatrix (Fig. 3(a)) is based on the combination of a root function near the nose portion and a polynomial function near the stern portion presented in Equation (1), with the associated coefficients tabulated in Table 1. These equations have been normalised using length of the airship (
 ${L_h}$
). Thus, the dimensions along the axial (
 $x$
) and lateral directions (
 $y$
) have been nondimensionalised as
 $\bar x = x/{L_h}$
and
 $\bar y = y/{L_h}$
, respectively.
 \begin{align}\bar y\left( {\bar x} \right) =\begin{cases} {c\sqrt {\bar x} } &\quad {}{{\rm{for}}} \quad {}{0.0 \le \bar x \le 0.08}\\ {{c_0} + {c_1}\bar x + {c_2}{{\bar x}^2} + {c_3}{{\bar x}^3} + {c_4}{{\bar x}^4} + {c_5}{{\bar x}^5}} &\quad {{\rm{for}}} \quad {}{0.08 \le \bar x \le 1.0} \end{cases} \\[-30pt] \nonumber \end{align}
Coefficients of polynomial function

Two dimensional profile and scaled down model of LOTTE airship used for simulations: SL_Lo.

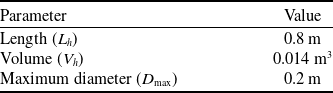
Solver validation for the current numerical methodology made use of the LOTTE-based 1:20 scaled down model (Fig. 3(b)) used in the experimental investigations described in Ref. (Reference Funk, Lutz and Wagner60) with the model specifications given in Table 2. Notably, simulations carried out in this paper made use of the bare hull models only (Fig. 1). The referenced experimental investigations were carried out in the Medium Wind Tunnel (MWT) facility based at the University of Stuttgart, that made use of a lattice downstream of the nozzle to create a fully turbulent flow across the airship hull [Reference Funk, Lutz and Wagner60].
LOTTE baseline model specifications

2.1.2 Tri-lobed hull variants
The tri-lobed geometries used for geometric characterisation were derived from LOTTE’s bare hull model. Thus, the subsequent models made use of three overlapping LOTTE hulls to generate the required tri-lobed geometry, while placing the lobes parallel to each other (Figure 4). Addition of these side-lobes resulted in the introduction of additional geometric parameters, and hence the increased flow complexity. These parameters include distance between the neighbouring lobes in the longitudinal direction (
 $f$
), lateral direction (
 $g$
) and normal directions (
 $h$
), which can be gleaned in the sub-figures of Fig. 5. Some of the other parameters that can be scrutinised include profile of the three lobes, as well as relative size of the three lobes. However, aim of the current study is limited to deciphering the aerodynamic effects related to variation of distance between centre of the three lobes by varying
 $f$
,
 $g$
and
 $h$
. The baseline tri-lobed model designated as TL_Lo (Fig. 5(a)) in this study was based on a previous study carried out by the authors in Ref. [Reference Tripathi, M, Pandey and Pant44). This baseline model made use of three overlapping LOTTE-based hulls such that the overall volume of the tri-lobed hull was equivalent to that of the conventional single-lobed LOTTE hull (
 ${V_h} = 0.014\;{{\rm{m}}^3}$
). The same volume was retained across all the tri-lobed hull variants shown in Fig. 5. This was carried out to ascertain dynamic similarity of the entire set of problems by retaining the same volumetric Reynolds number (
 $Re = {U_\infty }V_h^{1/3}/{\nu _\infty }$
), where,
 ${\nu _\infty }$
and
 ${U_\infty }$
are the freestream kinematic viscosity and freestream velocity, respectively.
Three dimensional render of a tri-lobed airship hull.

Tri-lobed geometries being investigated.

It was established earlier in Ref. [Reference Tripathi, M, Pandey and Pant44) that the tri-lobed hull led to a significant rise in the aerodynamic efficiency because of the increased lift coefficient (
 ${C_L}$
) compared to single-lobed hulls. On the other hand, the biggest disadvantage related to this modification was the significantly high drag coefficient (
 ${C_D}$
) due to reduced three-dimensional relieving effect [Reference Anderson61] and the increased base drag. In order to ameliorate this shortcoming, current study makes use of a sequence of modified tri-lobed geometries called the skewed airship hull variants, wherein the side-lobes are shifted in the aft, fore, upward and downward directions as seen in Fig. 5(b), (c), (d), and (e), respectively. This is done by varying only one of the parameters while retaining the other values same as that of the TL_Lo. Some noteworthy definitions based on these geometric modifications are described henceforth:
Definitions:
-
• Skewed aft tri-lobed hull : Hulls corresponding to side-lobes shifted in the aft direction (Fig. 5(b))
-
• Skewed fore tri-lobed hull : Hulls corresponding to side-lobes shifted in the fore direction (Fig. 5(c))
-
• Skewed up tri-lobed hull : Hulls corresponding to side-lobes shifted in the upward direction (Fig. 5(d))
-
• Skewed down tri-lobed hull : Hulls corresponding to side-lobes shifted in the downward direction (Fig. 5(e))
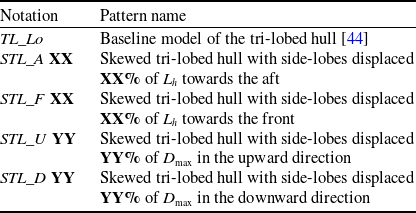
Notations pertaining to these variants indicated in Fig. 5 are further elaborated in Table 3. The symbols
 $XX$
and
 $YY$
in Table 3 are notations for the values pertaining to displacement of side-lobes with respect to the middle-lobe along the longitudinal axis (x-axis) and normal directions (z-axis), respectively. Here
 $XX$
represents percentage of side-lobe displacement in terms of
 ${L_h}$
, whereas
 $YY$
represents percentage displacement in terms of maximum lobe diameter (
 ${D_{{\rm{max}}}}$
). For instance, STL_A10 represents a tri-lobed hull variant corresponding to displacement of the side-lobes in the aft direction by
 $10{\rm{\% }}$
of
 ${L_h}$
, whereas STL_U05 represents the tri-lobed hull pertaining to a side-lobe displacement of
 $5{\rm{\% }}$
of
 ${D_{{\rm{max}}}}$
in the upward direction.
Pattern notation and description

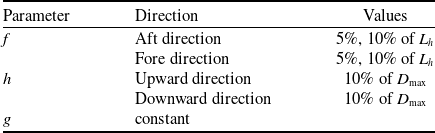
The values of f and h, were varied as shown in Table 4.
Variation of distance between neighbouring lobes

Given the fact that the increase in
 $g$
would lead to increased bluntness (leading to increased pressure drag), whereas a reduced
 $g$
would lead to reduced surface area, its value was retained constant at
 $g = 0.3 \times {D_{{\rm{max}}}}$
throughout the study. Length of the lobes were adjusted such that the overall volume was retained at
 ${V_h} = 0.014{\rm{\;}}{{\rm{m}}^3}$
whereas, the fineness ratio of each lobe was kept constant at
 $3$
.
2.1.3 Flow conditions
Simulations pertaining to all the cases were carried out at low subsonic and high
 $Re$
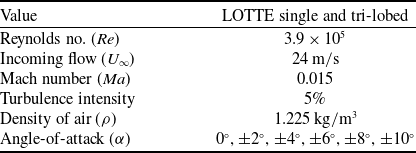
flow conditions. Specifications pertaining to the flow conditions associated with the LOTTE-based conventional and tri-lobed hull models were derived from the experimental conditions given in Ref. (Reference Funk, Lutz and Wagner60). Values pertaining to the different flow parameters attributed to these simulations are given in Table 5. The value of
 $\alpha $
was varied by keeping the geometry constant with the symmetry plane aligned with the
 $x - y\;plane$
, while the flow rotated about the
 $z - axis$
as shown in Fig. 6.
Simulated flow conditions

Description of the flow direction with respect to the tri-lobed geometry.

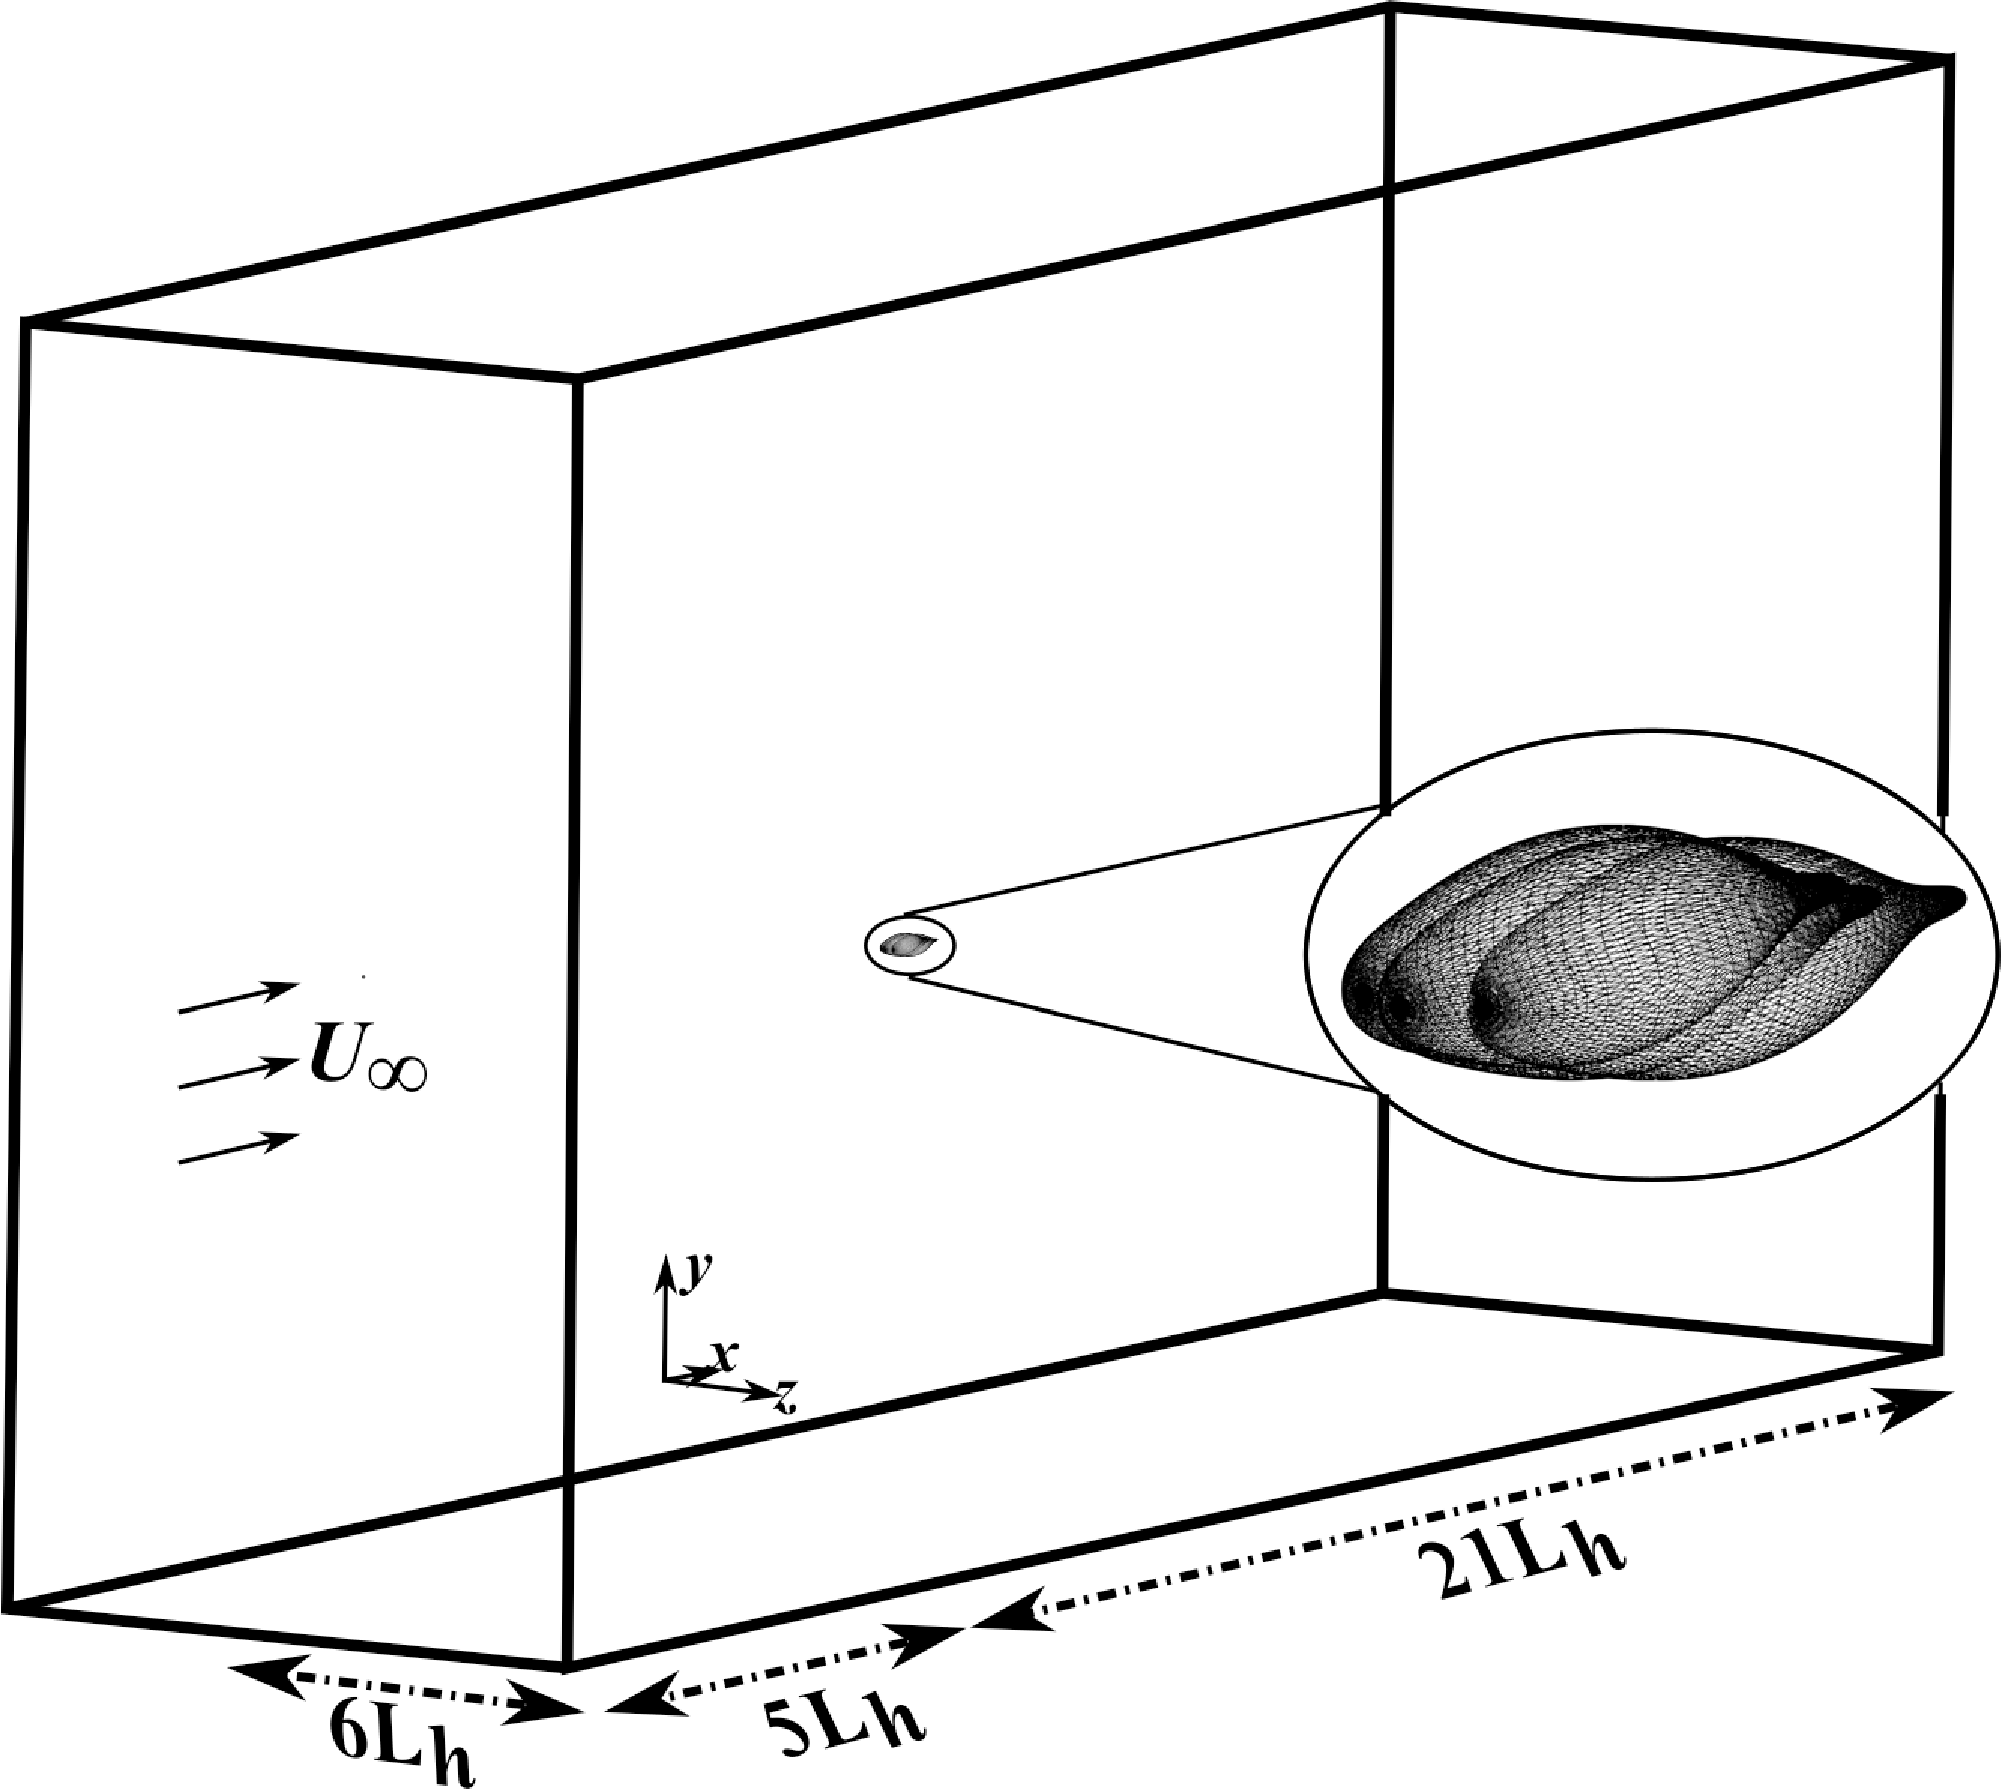
The computational domain utilised in this study was a rectangular box comprising of the inlet and outlet walls, placed
 $5 \times {L_h}$
and
 $21 \times {L_h}$
from the origin in the upstream and downstream directions of the hull, respectively (Fig. 7). Furthermore, side walls of the domain were placed at a distance of
 $6 \times {L_h}$
to avoid interference between the domain boundaries and boundary layer flow gradients. Numerous studies have delineated the presence of axi-symmetric nature of flow for the conventional [Reference Zhang and Guo62] and hybrid hulls [Reference Carrión, Steijl, Barakos and Stewart38]. Thus, the present investigations make use of only one half of the domain leading to a reduction of computational power and time requirements.
Computational domain used for numerical simulations.

2.2 Governing equations and solver configuration
Three dimensional flow related to a continuum flow can be represented by a set of five non-linear, coupled differential equations called the Navier-Stokes (NS) equations. Investigations in this study involved an incompressible flow regime that is
 $Ma \le 0.3$
[Reference Anderson63]. Thus, simulations during the current study were limited to making use of the incompressible flow equations, which leads to the reduction of original NS equations to a single mass conservation (Equation 2) equation and three momentum conservation equations (Equation 3).
Mass Continuity
 \begin{align}\frac{{\partial {u_i}}}{{\partial {x_i}}} = 0\end{align}
Equations of Motion
 \begin{align}\frac{{\partial {u_j}}}{{\partial t}} + \frac{\partial }{{\partial {x_i}}}\left[ {{u_i}{u_j} + p{\delta _{ij}}/\rho - {\tau _{ij}}} \right] = 0, i = 1,2,3\end{align}
Here,
 ${i^{th}}$
component of spatial and velocity vectors are symbolised by
 ${x_i}$
and
 ${u_i}$
, respectively. The terms
 $t$
,
 $p$
,
 $\rho $
,
 ${\tau _{ji}}$
correspond to time, pressure, density and viscous shear stress variables, respectively. The fact that a recent study by Carrión et al. [Reference Carrión, Steijl, Barakos and Stewart38], emphasised negligible variations between the steady and unsteady simulations for a multi-lobed hull up-to
 $\alpha \le {20^ \circ }$
, the current study also made use of steady-state simulations to capture the flow variations. This was done by making use of the Reynolds-averaged Navier-Stokes (RANS) equations. This numerical framework involves the replacement of flow variables in the NS equations with a sum of their time averaged and fluctuating component values [Reference Gupta, Tripathi and Pant64]. The new equations are time averaged to obtain the final set of RANS equations. These mathematical operations lead to the introduction of new variables called the Reynolds’ stresses (shown as
 $\overline {{\tau _{ij}}} $
in Equation 4).
 \begin{align}\overline {{\tau _{ij}}} = - \rho {u_i}{\rm{'}}{u_j}{\rm{'}} \\[-15pt] \nonumber \end{align}
The introduction of these additional variables warrant the need to make use of additional equations called the turbulence model equation(s). These transport equation(s) are based on semi-empirical formulations that encapsulate one, two or three equations to achieve closure, and hence obtain values of
 $\overline {{\tau _{ij}}} $
. Owing to the subsonic nature of this analysis, flow associated with the current study is dominated by viscous boundary layer flow fluctuations as well as adverse pressure gradient conditions. Moreover, the high
 $Re$
nature of this flow makes it amenable to flow transition and turbulence flow variations. Due to these complexities, selection of turbulence model and the associated solver framework was critical in carrying out accurate simulations. The two equation shear stress transport (SST)
 $k - \omega $
model has been erstwhile found to present good accuracy for high
 $Re$
flows pertaining to wind turbines [Reference Rezaeiha, Montazeri and Blocken65], as well as airships [Reference Shields18, Reference Carrión, Steijl, Barakos and Stewart38, Reference Yanxiang, Yanchu, Jianghua and Xiangqiang66]. Owing to its widespread implementation and applicability across adverse flow gradient conditions [Reference Menter67], this model was implemented in the current numerical setup. Moreover, a study presented in Ref. (Reference Gupta, Tripathi and Pant64) involving comparison between the SST
 $k - \omega $
model and the one-equation Spalart-Allmaras (SA [Reference Spalart and Allmaras68]) model for a Zhiyuan-1 hull, further emphasised the enhanced accuracy of SST
 $k - \omega $
for airship flow aerodynamics.
2.2.1 Solver setup: OpenFOAM®
Simulations in the current study were carried out using the Open Source Field Operation and Manipulation (OpenFOAM) software [Reference Greenshields69]. This open source computational framework is based on C++ libraries and encapsulates a number of solver methodologies enabling its utility across a number of engineering disciplines including aerodynamic flows, chemical and thermal reactions, structural mechanics, and much more. Apart from this, the software comes bundled with a suit of mesh generation, and post-processing modules to carry out suitable pre-processing and data analysis. Its blockMesh and snappyHexMesh® utilities are primarily used for mesh generation whereas, a separate module called ParaView® is used to carry out the necessary data analysis and flow-field visualisation. ParaView features a number of filters as well as user-defined script functions to analyse large datasets. OpenFOAM provides parallel functionality for all its utilities leading to reduced time consumption and memory requirements. Moreover, through its software integration, users can design their own solvers to conform with the specific flow problem being investigated. Owing to these attributes, OpenFOAM was used to carry out investigations in the current study. These simulations were performed in parallel on a Linux-based computational workstation at the Indian Institute of Technology Bombay. This 32 core Ubuntu workstation was powered by a AMD Ryzen 9 processor along-with a 128 GB RAM. The pertinent parallel simulations made use of the scotch based domain decomposition method and the MPICH algorithm for efficient message passing between the different cores.
Steady-state simulations in this study were obtained using the incompressible simpleFoam methodology. This solver is based on the SIMPLE algorithm [Reference Greenshields69] (Semi-Implicit Method for Pressure Linked Equations) to solve the momentum and pressure coupling. It makes use of iterative steps including a momentum predictor step and a pressure correction step, wherein the former predicts velocity using the momentum equations, whereas later makes use of the continuity equation and application of the required pressure correction. The discretisation scheme implemented a cell-centred finite volume method based Guassian integration scheme while implementing the linear interpolation scheme for the gradient terms. Advection terms pertaining to the velocity flux made use of the second order, upwind-biased interpolation scheme whereas, other advective terms incorporated the gradient limiter scheme to prevent overshoots. On the other hand, discretisation of the divergence terms within the equations made use of second order upwind-biased scheme for the velocity convection terms, first order Guassian upwind scheme for turbulence variables and second order central differencing scheme for the diffusive terms. To avoid spurious oscillations of the turbulence terms, the implemented schemes were applied a limiting procedure to maintain numerical stability. The diffusive terms incorporated the second order scheme with non-orthogonal correctors owing to the unstructured mesh. Interpolation of cell-centred value to faces was achieved using the second order linear scheme, whereas the surface-normal gradient implemented non-orthogonal correctors for increased stability and accuracy.
The solver further incorporated the geometric-algebraic multi-grid methodology to solve the pressure matrix, followed by the Guass Siedel methodology to solve the velocity and turbulence terms. Furthermore, the solver incorporated ramping of the under-relaxation factors to assist in solution convergence while maintaining numerical stability. As noted above, RANS simulations in this study made use of the two equation SST
 $k - \omega $
turbulence model to evaluate the turbulence parameters. The solver incorporated a convergence criteria of five orders of magnitude for all the primitive flow variables that is,
 $p$
,
 ${u_i}$
as well as
 $k$
and
 $\omega $
, wherein
 $k$
and
 $\omega $
were the turbulence kinetic energy and turbulence specific dissipation rate, respectively.
Boundary conditions pertaining to the different walls and surfaces played a critical role in obtaining an accurate and stable numerical simulation at different
 $\alpha $
. Considering the domain indicated earlier in Fig. 7, the inlet, outlet and top-bottom walls were assigned the freestream boundary conditions. On the other hand, airship walls were assigned the no-slip boundary condition. Owing to the axi-symmetric nature of the flow related to airships [Reference Carrión, Steijl, Barakos and Stewart38, Reference Zhang and Guo62], computations were performed for only one half of the domain, with the symmetry plane being assigned the symmetry boundary condition.
Workflow of procedure used for meshing through blockMesh and snappyHexMesh.

2.2.2 Mesh generation procedure
The low subsonic and high
 $Re$
characteristic of simulated flow resulted in increased influence of the boundary layer gradients as well as flow separation phenomena. Thus, setting up the appropriate three-dimensional mesh configuration played a critical role in obtaining an accurate numerical solution. The process followed to acquire the required mesh configuration(s) is described in the flowchart presented in Fig. 8. This process was initiated by creating a clean surface mesh file (.stl) file, which was further processed using the surfaceFeaturesExtract utility to extract surface features of the airship geometry. The extracted features including edges, vertices and corners were used to carry out further mesh refinements. The blockMesh utility was used to generate the required three-dimensional hexahedral background mesh. The snappyHexMesh utility was used to import the geometry, and make use of the aforementioned features to carry out mesh refinement in the following three steps that is, region refinements, surface snapping and boundary layer generation. This utility makes use of the background mesh to conform to the surface by iteratively splitting, refining and snapping the resulting mesh onto the surface. Owing to flow complexities close to the walls and the stern region, region refinement in the present study made use of three refinement zones called Zone-1, Zone-2 and Zone-3 (Fig. 9a), with the mesh density increasing from Zone-1 through to Zone-3 (Figure 9b). Zone-1 corresponded to the background mesh, Zone-2 made use of a cylindrical refinement zone, whereas Zone-3 made use of a refinement sphere centred at the stern of the airships. The diameter of this sphere varied based on the hull size. Furthermore, the mesh was refined on the surface of the airship such that the refined cell size was
 $0.8{\rm{\% }}$
of the background mesh. Inflation layers close to the airship walls were generated for the single lobed and tri-lobed hulls such that, the non-dimensional cell wall distance (
 ${y^ + }$
) was less than
 $1$
(Fig. 9c). The snappyHexMesh and checkMesh operations were carried out in a parallel computational setup across eight parallel cores. The meshing was carried out for only one-half of the geometry to alleviate computational time and throughput.
Three-dimensional mesh used to carry out numerical simulations generated using blockMesh and snappyHexMesh.

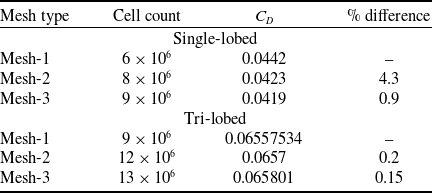
Owing to the diverse surface area of tri-lobed and single-lobed geometries, mesh count associated with the two models were significantly different. Thus, mesh independent studies were carried out for both the geometries by varying the background mesh sizing, while retaining the same mesh refinement and inflation layer settings. The mesh independence was accomplished by comparing the drag coefficient (
 ${C_D}$
) results at
 $\alpha = {0^ \circ }$
for the two baseline models using three different mesh configurations identified as Mesh-1, Mesh-2 and Mesh-3, elaborated in Table 6. In the table, last column was determined by taking the percentage difference between finer mesh to the coarser mesh
 ${C_D}$
value. Difference between the subsequent mesh values reduced as the mesh refinement increased from Mesh-2 to Mesh-3. Considering the balance of acceptable accuracy and computational resource requirements, Mesh-2 configration was used for both the models. The overall mesh for the two cases were segregated into hexahedral (
 $90{\rm{\% }}$
), polyhedral (
 $9{\rm{\% }}$
) and prismatic (
 $0.15{\rm{\% }}$
) cells. Notably, the increased number of lobes related to the tri-lobed hull led to the significant increase in cell count pertaining to increased inflation layer formation.
Mesh independence study for single-lobed and tri-lobed hull geometries

3.0 Results and discussions
3.1 Solver validation
As mentioned earlier, single lobe bare hull models pertaining to the LOTTE [Reference Funk, Lutz and Wagner57] profile was used to carry out the solver validation process. This validation was accomplished by comparing the numerical lift and drag coefficient (
 ${C_L}$
and
 ${C_D}$
) results with the pertinent experimental results. Notably, the non-dimensional force coefficients were obtained by making use of
 $V_h^{2/3}$
and
 $V_h^{1/3}$
as the reference area and reference length, respectively.
3.1.1 Solver validation for single-lobed LOTTE airship hull
The tri-lobed geometries being simulated were based on combining three LOTTE airship hulls, while retaining the same volume as their single lobe counterpart. Thus, in order to ascertain validity of the aerodynamic inferences acquired for the tri-lobed models from current study, a comprehensive analysis is carried out in this section by comparing the numerical and experimental [Reference Funk, Lutz and Wagner57] results of SL_Lo between
 $\alpha = {0^ \circ }$
to
 ${20^ \circ }$
in Fig. 10. The sub-figures in Fig. 10(a) include the numerical results that were derived during an earlier phase of this study using SimScale® solver [Reference Tripathi, M, Pandey and Pant44]. As noted in the Fig. 10(a), both the solvers were able to capture the aerodynamic trends up-to
 $\alpha = {10^ \circ }$
. However, the OpenFOAM results showed an improvement of
 $ \approx 6{\rm{\% }}$
in the case of
 ${C_D}$
and
 $24{\rm{\% }}$
in the case of
 ${C_L}$
. Moreover, owing to the available computational resources, the simulations related to cloud based SimScale solver were only limited to
 $\alpha $
variations up-to
 ${10^ \circ }$
. The differences in these results were attributed to the usage of a fairly coarse mesh for the SimScale case leading to a
 ${y^ + }$
value of more than 30, and hence the boundary layer variations were not captured accurately, leading to significant disparity. The OpenFOAM results were within
 $1.6{\rm{\% }}$
for
 ${C_D}$
and
 $1.9{\rm{\% }}$
for
 ${C_L}$
compared to the experimental results.
Solver validation through comparison of numerical and experimental aerodynamic coefficients for LOTTE bare-hull [Reference Funk, Lutz and Wagner57].

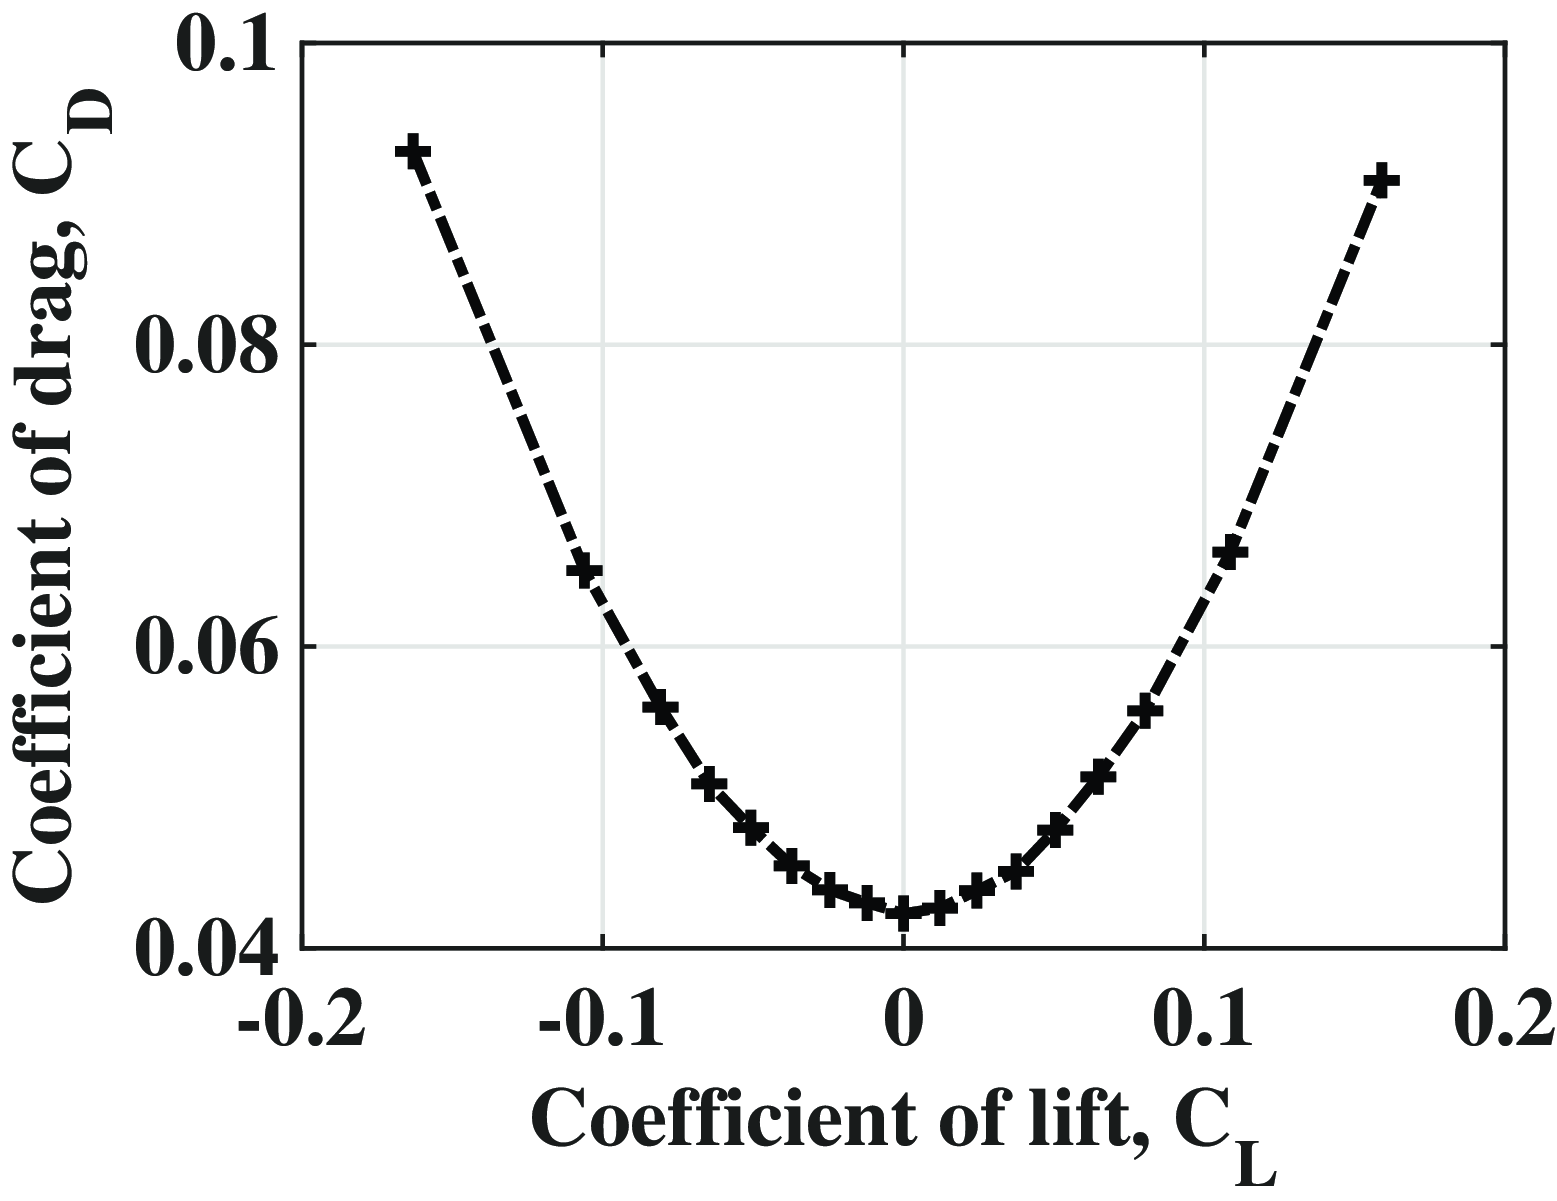
Figure 11 makes use of a drag polar plot to further validate the accuracy of employed numerical solver. The drag polar plot demonstrates the presence of similarity across the y-axis as well as a parabolic variation. These aerodynamic trends are at par with the expected trends as the low-aspect ratio and symmetrical geometry of SL_Lo, should lead to flow similarity across the positive and negative angles of attack whilst following a parabolic trend.
Drag polar plot for LOTTE airship hull.

Qualitative validation with respect to the solver being able to capture the actual flow-physics can be gleaned from the axial pressure coefficient (
 ${C_P}$
) distribution along the lower and upper surface contours (Fig. 12(a)). As seen in Fig. 12(b), the
 ${C_P}$
distribution plot is similar for both the upper and lower surface plots with a negligible difference. Owing to the axi-symmetry nature of the hull as well as
 $\alpha $
being zero, this trend is at par with the expected trends. This further indicates the efficacy of current solver to capture
 ${C_P}$
distribution plots for the LOTTE airship. These investigations indicated the accuracy of employed solver and mesh configuration to capture aerodynamic trends related to LOTTE profile and its variants across the prescribed flow conditions that is,
 $\alpha \le {10^ \circ }$
and low subsonic flow. Hence, further investigations related to the tri-lobed geometries also made use of similar mesh and solver setup to carry out the required aerodynamic investigations.
Solver validation through comparison of lower and surface plots of LOTTE single lobe hull at zero angle.

A preliminary step towards setting up the solver configuration implemented in this study involved numerical investigations related to the Zhiyuan-1 airship hull [Reference Liu, Fu, Zhu and Wang70]. Specifics related to this study have been elaborated in Appendix A.2. This study demonstrated increased corroboration between the experimental and numerical results especially
 ${C_L}$
values. Although some differences associated with the drag forces were observed at lower angles – linked with limitations in simulating flow transition – this study provided critical insights for setting up the final computational model. The increased accuracy of this solver in the case of SL_Lo simulations compared to SL_Zi results could be attributed to the fact that the experimental setup related to SL_Lo made use of a fully turbulent flow, enabling increased similarity of experimental and numerical flow conditions leading to increased accuracy.
3.2 Comparison of single lobe and baseline tri-lobed hull
This section carries out a preliminary comparison between the SL_Lo and TL_Lo models by comparing the aerodynamic coefficients up to
 $\alpha = {10^ \circ }$
. Notably, the authors were part of a similar analysis [Reference Tripathi, M, Pandey and Pant44] inferring similar conclusions. Nevertheless, the aim of this section is to emphasise current solver’s ability in capturing the aerodynamic variations between single-lobed and tri-lobed hulls, while also providing a strong foundation for the geometric variations of the baseline tri-lobed hull model discussed in later sections.
Comparison of the
 ${C_L}$
trends in Fig. 13(a) indicates a significant increase (more than
 $400{\rm{\% }}$
) in the
 ${C_L}$
value for TL_Lo. This can be attributed to the increased surface area leading to increased potential lift, and hence the increased
 ${C_L}$
value. Investigations in a prior study carried out by the authors [Reference Tripathi, M, Pandey and Pant44] revealed the presence of increased pressure difference between the upper surface and lower surface
 ${C_P}$
value for TL_Lo at higher angles leading to heightened
 ${C_L}$
value. The subdued tendency of lower surface flow to intermix with upper surface flow for TL_Lo because of its wider length in the lateral direction was linked to the increased disparity at high angles between the two models.
Comparison of aerodynamic coefficient pertaining to single lobe and baseline tri-lobed hulls at different angles of attack.

Notably, drag at such low speeds for an airship hull is composed of skin friction due to viscosity and pressure drag attributed to flow separation and bluntness of the hull profile at nose portion. The increased base drag of TL_Lo that is
 ${C_{{D_0}}}$
(
 ${C_D}$
at
 $\alpha = {0^ \circ }$
) as seen in Fig. 13(b) is attributed to the increased bluntness of TL_Lo leading to reduced three-dimensional flow relieving effect and increased adverse pressure gradient. A notable difference between the SL_Lo and TL_Lo trends is the significantly higher increment in its
 ${C_D}$
value with increasing
 $\alpha $
for the TL_Lo hull, especially beyond
 $\alpha = {2^ \circ }$
. The overall average increment between subsequent
 $\alpha $
iterations beyond
 $\alpha = {2^ \circ }$
is 14.5% for TL_Lo compared to a variation of 4.8% in the case of SL_Lo. Consequently,
 ${C_D}$
related to TL_Lo demonstrates an increase in
 ${C_D}$
value by
 $93{\rm{\% }}$
. It is noteworthy that this steep rise in
 ${C_D}$
for TL_Lo is an indicator of increased effect of the pressure drag component, whereas subdued enhancement of
 ${C_D}$
related to SL_Lo is a result of increased influence of the skin friction drag. This discrepancy can be explained by the fact that aspect ratio of the airship hull has a heightened impact on its overall aerodynamics [Reference Nippress36]. Thus, the higher aspect ratio of TL_Lo leads to reduced flow intermixing at the stern portion, and hence the increased base drag value. Given this increased
 ${C_D}$
value for TL_Lo, there is a need to implement design modifications to the baseline tri-lobed hull to alleviate the pressure drag shortcoming associated with its bluntness.
The lift-to-drag ratio (
 ${C_L}/{C_D}$
) also termed as aerodynamic efficiency is one of the most important parameters related to any flight vehicle. It has been erstwhile suggested that HAs could be most advantageous for the long-range freight missions [Reference Ardema8], thus, optimising the
 ${C_L}/{C_D}$
is a key parameter in delineating the performance of airships from an application stand-point. As seen in the Fig. 13(c),
 $C_{L}/C_{D}$
pertaining to TL_Lo is significantly higher at
 $166{\rm{\% }}$
compared to SL_Lo. Owing to the higher
 ${C_L}$
(Fig. 13(a)), TL_Lo presents itself as a better alternative from an aerodynamic efficiency point-of-view, despite the higher
 $C_{D}$
. Moreover, the pitching moment coefficient (
 ${C_M}$
) is also similar for both the hulls (Fig. 13(d)). Thus, both the airship hulls are statically unstable with the inclusion of multiple lobes having a minuscule impact on the overall longitudinal stability of the hull.
Based on this preliminary evaluation, it can be ascertained that the tri-lobed geometry presents a productive step towards increasing the net aerodynamic lift produced by airships leading to increased aerodynamic efficiency. However, the presence of higher
 ${C_D}$
indicates the need to carry out design modifications to the baseline model so that the underlying pressure drag can be mitigated. One of the measures taken by the authors in Ref. (Reference Tripathi, M, Pandey and Pant44) was to close the gap between the side-lobes called the webbed lobe. However, this modification led to a significant reduction in
 ${C_L}$
, and hence the reduced
 ${C_L}/{C_D}$
value. The following sections present a different approach for drag mitigation by displacing the middle-lobe in the aft, forward, upward and downward directions with respect to the middle-lobe and has been called the skewed tri-lobed hull.
3.3 Comparison of skewed tri-lobed hull with baseline tri-lobed hull: aerodynamic coefficients
Before proceeding onto this section, the reader must re-visit the tri-lobed geometry section (Section 2.1.2) to understand the symbols used for different tri-lobed hull variants in the following section(s).
3.3.1 Effect of forward skewness on the aerodynamics of tri-lobed hull
It can be seen in Fig. 14(a) that the overall
 ${C_L}$
undergoes a significant reduction (averaged at
 $57{\rm{\% }}$
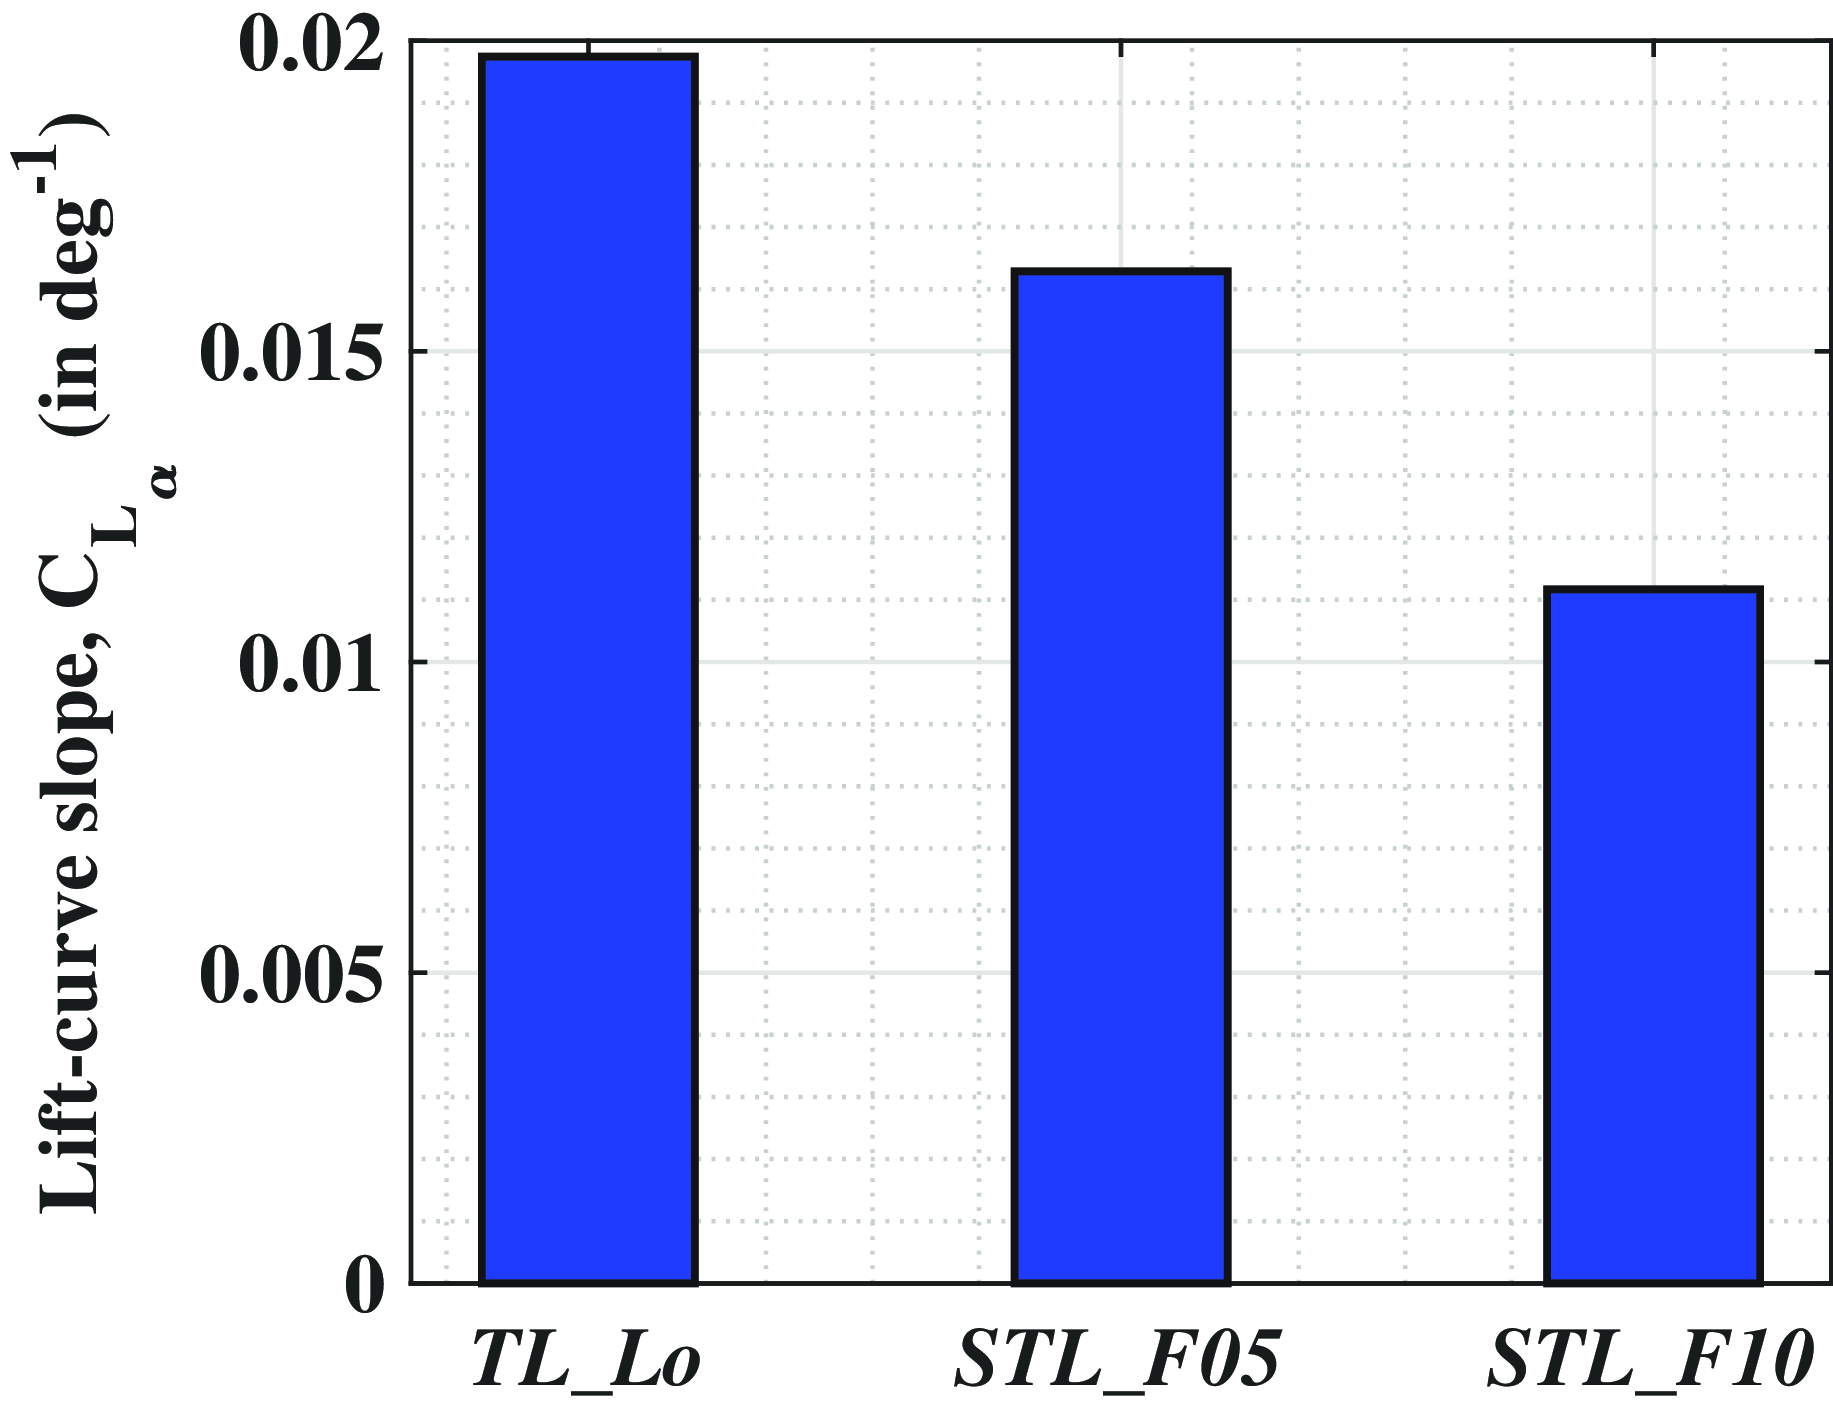
) for skewed fore tri-lobed hulls. In-fact, lift curve slope (
 ${C_{L_{\alpha}}}$
) of the skewed hull also reduces by an average of
 $69{\rm{\% }}$
leading to the reduced
 ${C_L}$
value. Moreover, this reduction is higher as the skewness angle increases (Fig. 15). It can also be noted that the overall trend for both the skewed variants is non-linear, whereas the plot pertaining to TL_Lo is more linear. This is indicative of increased effects pertaining to flow intermixing as well as wake vortices for the skewed fore airship hull STL_F10. Since flow intermixing would lead to a reduction in pressure differential across the upper and lower surfaces, this would explain their reduced
 ${C_L}$
values. In fact, this effect is maximum for STL_F10 as indicated by its higher deviation from the baseline model. Thus, as the stern portion of the side-lobes move upstream, hindrance to the flow escaping towards the upper surface as well as towards the sides is altered leading to flow-intermixing, and hence the reduced
 ${C_L}$
value. Further assertions regarding the change in flow intermixing pattern leading to this reduced
 ${C_L}$
will be established in a later section using the flow-field and
 ${C_P}$
distribution plots (Section 3.5.1).
Comparison of aerodynamic coefficients pertaining to different skewed fore tri-lobed hull variants at different angles of attack.

Comparison of lift-curve slope of skewed fore tr-lobed hull against the baseline tri-lobed hull.

Skewing the side-lobes in forward direction leads to a reduction in
 ${C_D}$
value at all angles for both the variants as seen in Fig. 14(b). The averaged reduction between baseline and STL_F05 is
 $6.23{\rm{\% }}$
, which enhances to
 $10.6{\rm{\% }}$
in the case of STL_F10. The presence of lower
 ${C_D}$
at
 $\alpha = 0^ \circ $
(
 ${C_{{D_0}}}$
) is indicative of lowered pressure drag at zero angle. Thus, upstream placement of side-lobes leads to reduced base drag value, and hence the lower
 ${C_D}$
at all angles. Explanation regarding the underlying reasons will be carried out later through
 ${C_P}$
distribution and flow-field plots. The trend associated with STL_F05 indicates a higher
 ${C_D}$
enhancement with
 $\alpha $
increment beyond
 $\alpha = {2^ \circ }$
, indicating the onset of increased pressure drag for the tri-lobed hull with lower skewness. The underlying reasons associated with increased intermixing related to this
 ${C_D}$
reduction trend will be further discussed in the flow-field visualisation plots.
Despite the reduced
 ${C_D}$
value, aerodynamic efficiency for both the skewed fore tri-lobed hull variants is significantly lower compared to TL_Lo with the depletion being higher at
 $ \approx 39{\rm{\% }}$
for the STL_F10 variant. Thus, the effect of mitigated
 ${C_L}$
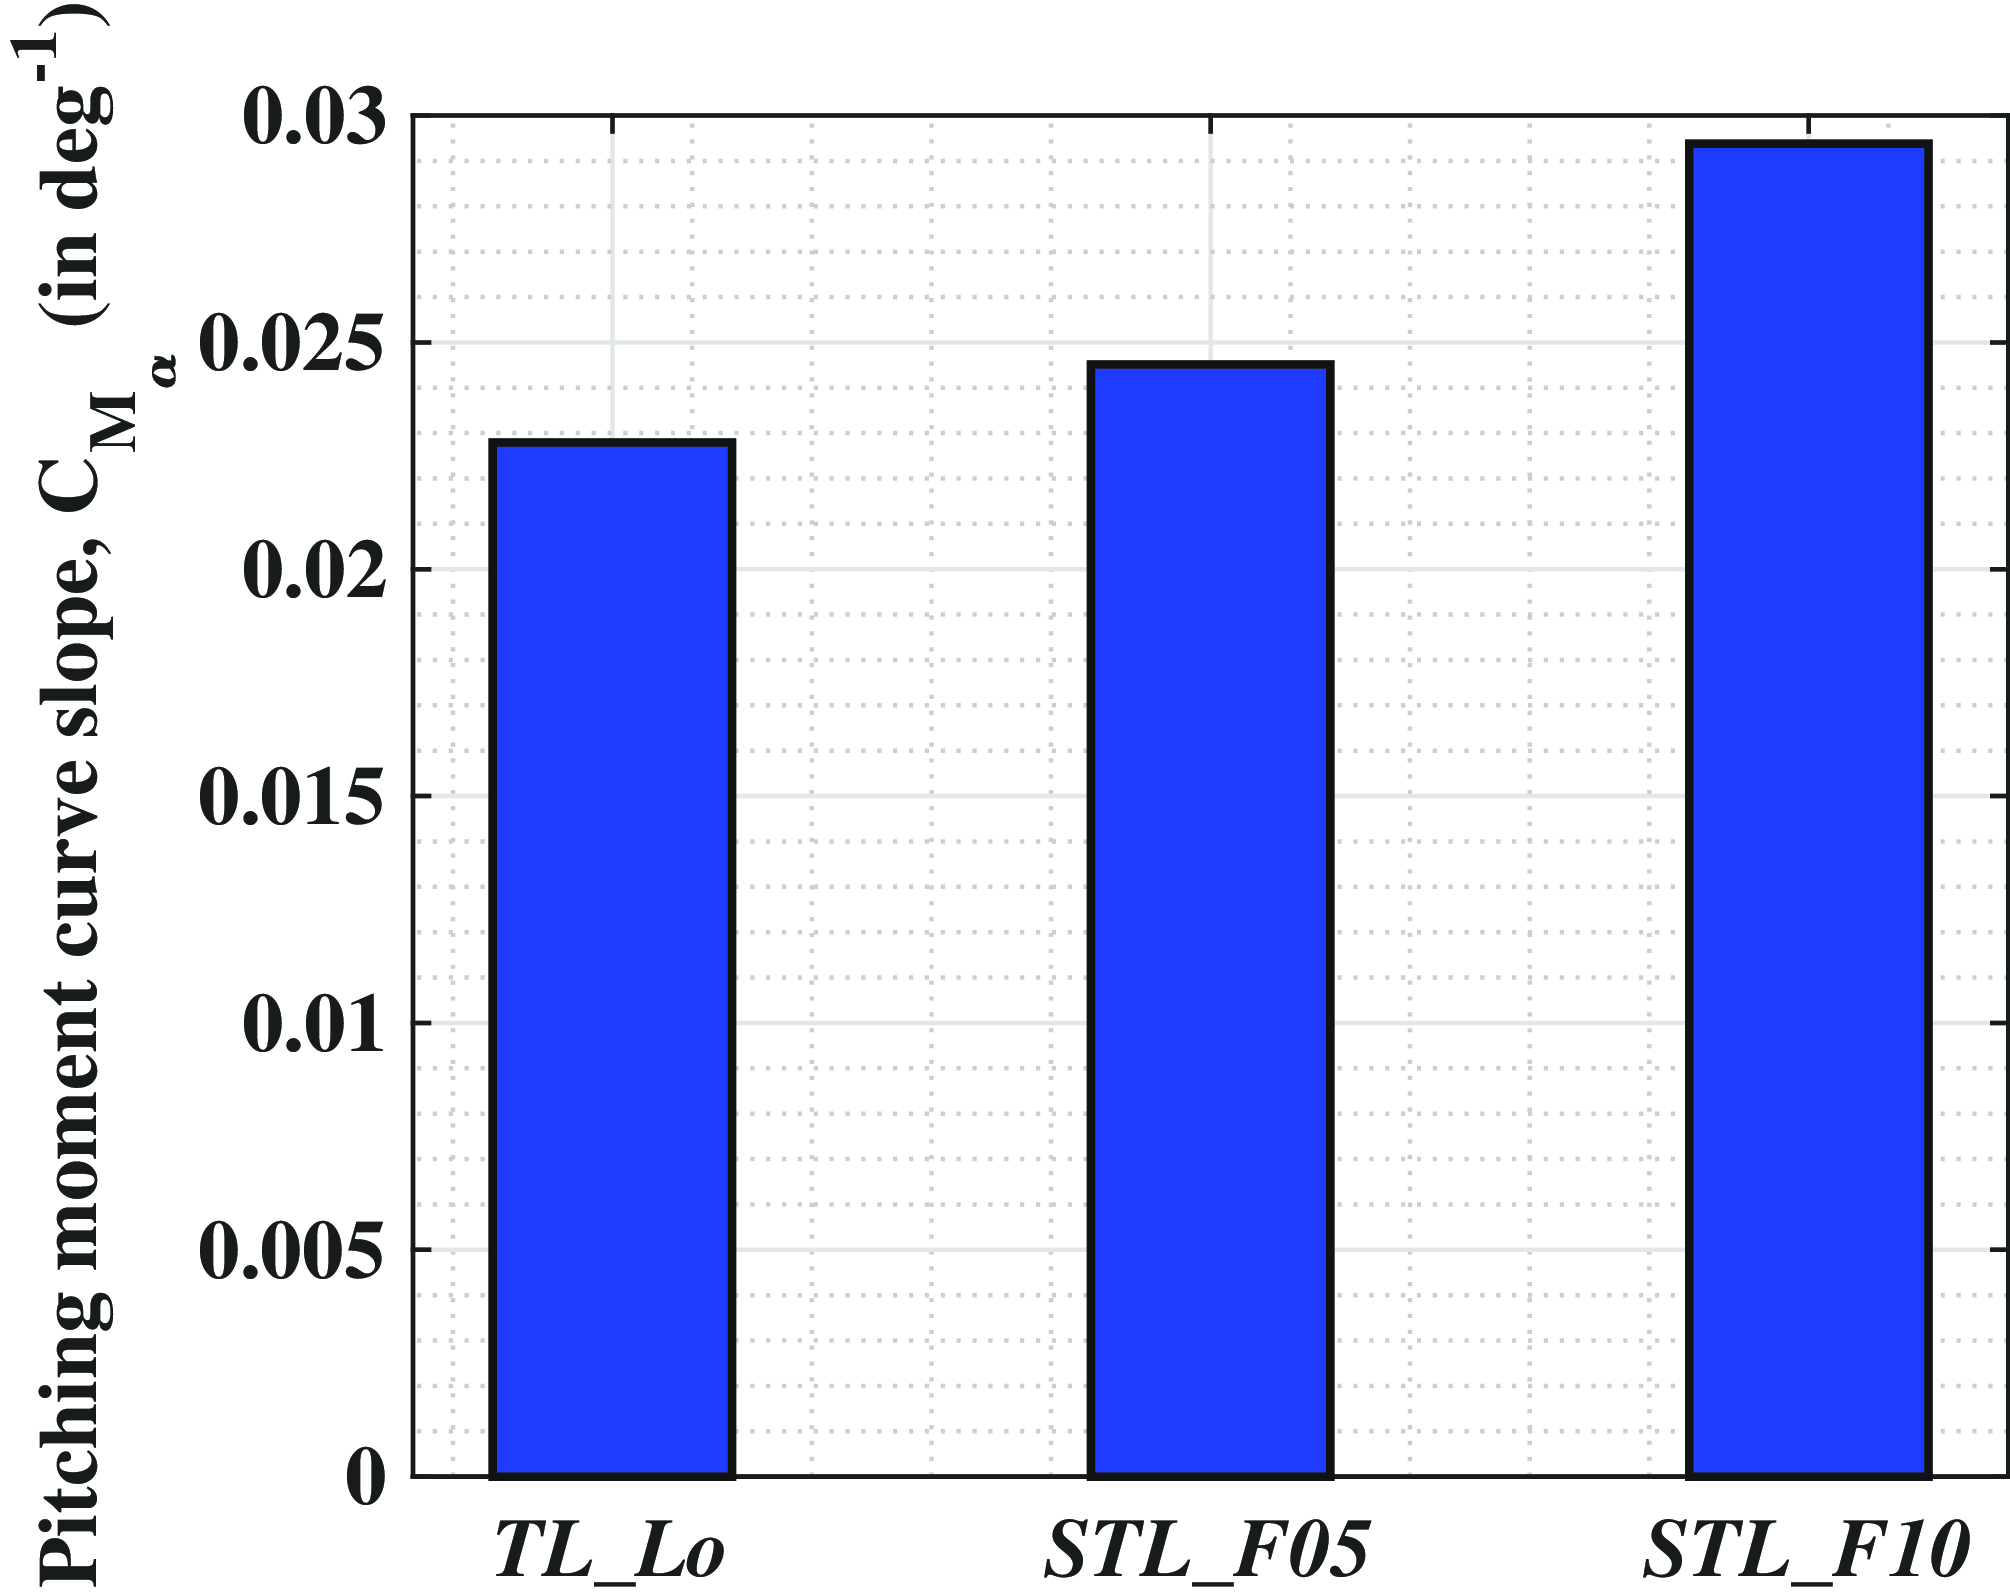
value is more appreciable compared to drag alleviation leading to reduced aerodynamic efficiency for the skewed fore tri-lobed hulls. The pitching moment curve plot shown in Fig. 14(d) is evaluated about a point
 $40{\rm{\% }}$
aft along the middle-lobe axis. From this plot, it can be ascertained that the overall
 ${C_M}$
tends to increase at a particular
 $\alpha $
as the skewness angle increases. This is further corroborated by the bar plot presented in Fig. 16, wherein the overall pitching moment slope increases for higher skewness. This increment ranges as
 $7.5{\rm{\% }}$
for STL_F05 to
 $29{\rm{\% }}$
for the STL_F10 variant compared to the baseline model. Thus, it can be stated that static instability of the tri-lobed hull increases for the skewed fore tri-lobed hull variants.
Comparison of pitching moment curve slope for skewed fore tri-lobed hull against the baseline tri-lobed hull.

3.3.2 Effect of aft skewness on the aerodynamics of tri-lobed hull
The aerodynamic trends related to skewed aft tri-lobed hulls are significantly different compared to the skewed fore tri-lobed hulls as seen in Fig. 17. Contrary to the skewed fore tri-lobed hulls, skewed aft tri-lobed hulls display significantly higher
 ${C_L}$
values compared to TL_Lo. This enhancement increases with the increase in aft-displacement of the side-lobes. Thus, the increment which is valued at
 $15.35{\rm{\% }}$
for STL_A05, enhances to
 $45{\rm{\% }}$
in the case of STL_A10 (calculated between
 $\alpha = {2^ \circ }$
to
 ${10^ \circ }$
). At
 $\alpha = 0^ \circ $
, STL_A05 presents near zero
 ${C_L}$
, which is lower than the baseline model, whereas STL_A10 hull presents a significantly higher
 ${C_{L_{0}}}$
. Analogous to the skewed fore counterparts, skewed aft tri-lobed hull variants display a non-linear lift increment, which is indicative of a significant deviation of aerodynamics between baseline tri-lobed hull and the skewed aft tri-lobed hulls. It can be envisaged by having a look at the contours in Fig. 5 that the overlapping contour of the side-lobes in the skewed aft tri-lobed hull induced flow convergence towards the upper surface of the middle-lobe near the stern portion, resulting in lowering of upper surface pressure, hence the increased pressure differential leading to higher
 ${C_L}$
. This shall be explained later in the flow-field results. The lift carry-over effect (discussed in Ref. (Reference Funk, Lutz and Wagner57)) for the skewed aft tri-lobed hull also contributes to the increased
 ${C_L}$
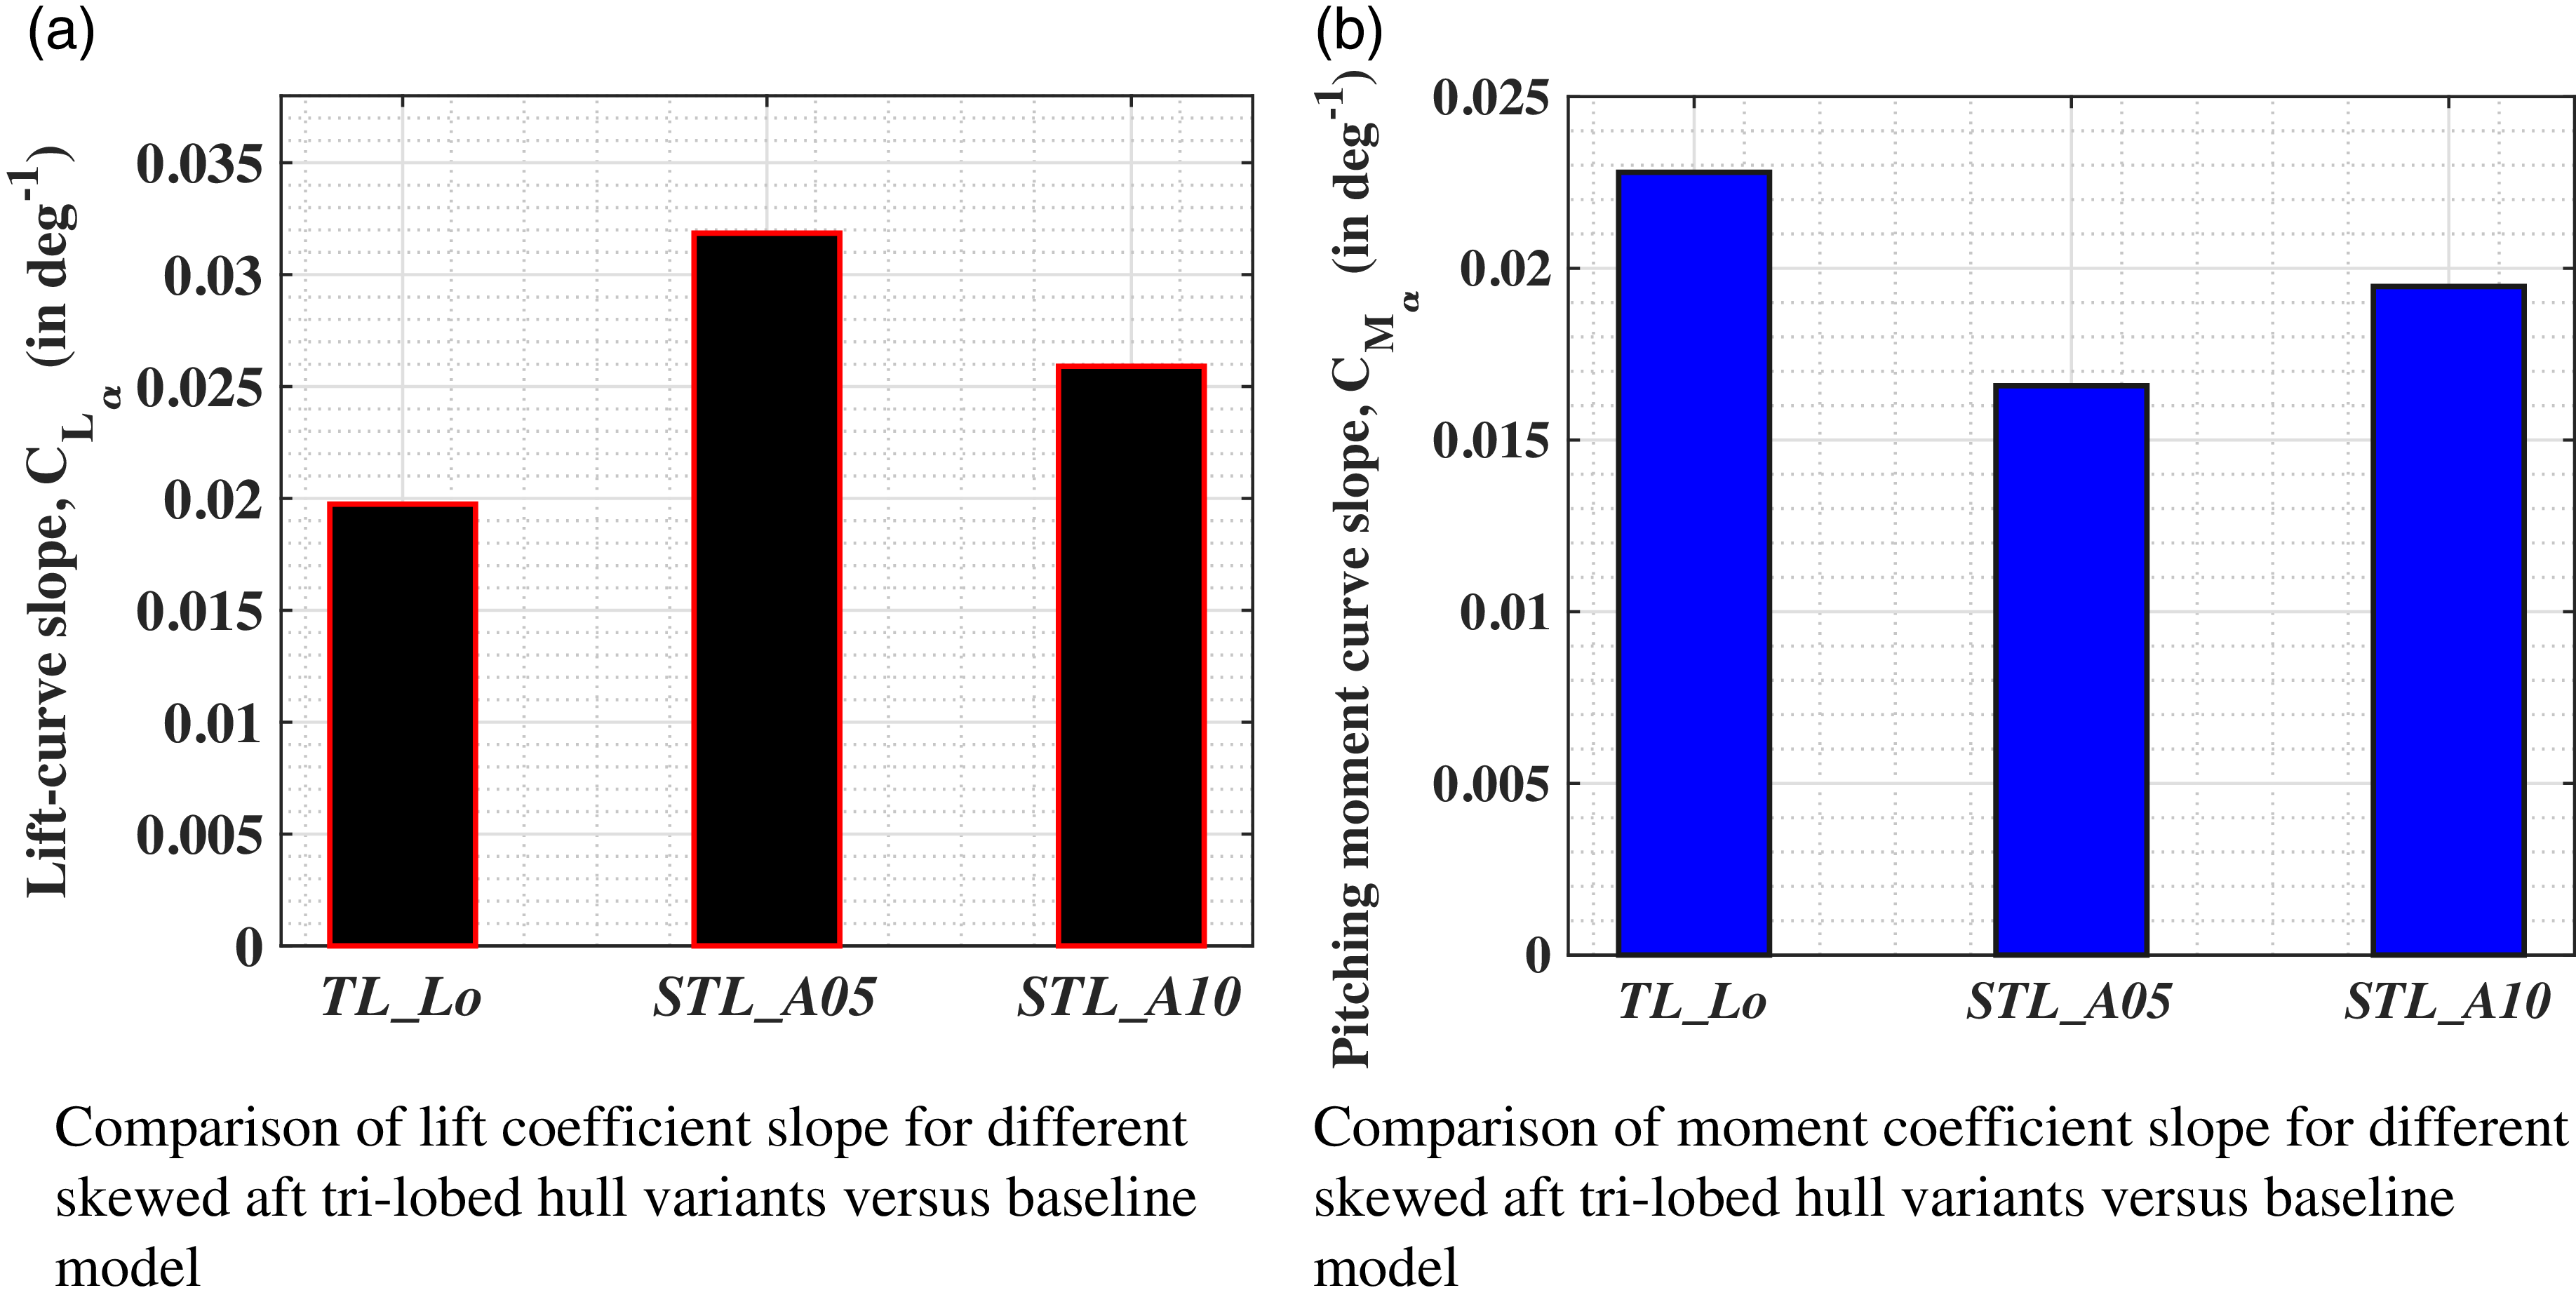
value. It was shown in Ref. (Reference Funk, Lutz and Wagner57) that the presence of fin members on the sides of airship hulls lead to increased lift attributed to interaction of the tailplane with hull flow. In the case of skewed aft tri-lobed hulls, the side-lobes act like tail-planes leading to increased lift-carry-over. The plots in Fig. 17(a) indicates the presence of higher lifting slope at lower angles. This is corroborated by comparing the bar plot of
 ${C_{{L_\alpha }}}$
values for the two skewed tri-lobed hulls in Fig. 18(a). Thus, the overall lifting performance of skewed aft tri-lobed hulls is better compared to the baseline model, and hence presents a productive option towards using such a configuration for future HA applications. Further explanation regarding these trends for STL_A10 will be undertaken later in the flow-field visualisation section.
Comparison of aerodynamic coefficients pertaining to different skewed aft tri-lobed hull variants at different angles of attack.

Comparison of lift and moment coefficient slopes pertaining to different skewed aft tri-lobed hull variants with the baseline tri-lobed model.

Figure 17(b) presents a significant increase in the
 ${C_D}$
value pertaining to skewed aft tri-lobed hulls, with the increment being
 $6.4{\rm{\% }}$
between TL_Lo and STL_A05, which jumps to
 $23{\rm{\% }}$
between TL_Lo and STL_A10. Thus, increased
 ${C_L}$
presented above is generated at the expense of higher
 ${C_D}$
value for the skewed aft tri-lobed hull variants. The uniform difference at all angles between
 ${C_D}$
of all the variants, indicates the presence of higher pressure drag at low angles, which could be attributed to wakes vortices being stronger for these hulls or the increased intensity of the flow stagnation region, and hence the higher drag. Much more clarity will be obtained using the flow-field visualisation plots later. Despite the heightened
 ${C_D}$
value, the overall lift-to-drag ratio is higher for all the skewed aft tri-lobed hulls (Fig. 17(c)) with an average increment of
 $ \approx 17{\rm{\% }}$
compared to TL_Lo. However, as
 $\alpha $
increases, difference between the baseline and skewed tri-lobed hull reduces and converges at
 $\alpha = {10^ \circ }$
. This further emphasises the suitability of current research being limited upto
 $\alpha = {10^ \circ }$
.
Trends associated with
 ${C_M}$
in Fig. 17(d) displays a subtle variation across the three variants. However, given the fact that overall
 ${C_{{M_\alpha }}}$
(Fig. 18(d)) is reduced for the skewed aft tri-lobed hulls, it can be stated that the overall static stability of the hull increases for the skewed aft tri-lobed hulls. It is also noteworthy, that the presence of skewed aft side-lobes will enable placement of the control surfaces at a larger distance from the volumetric centre leading to further augmentation of the overall static stability. Hence, displacing the side-lobes in the aft-direction has a significant impact on the overall aerodynamics of tri-lobed hulls leading to increased lift as well as improved aerodynamic efficiency and amelioration of the inherent static instability. Thus, aft-skewness seems to be a more productive step towards enhancing the performance of tri-lobed hulls compared to its baseline model.
3.3.3 Effect of upward and downward skewness of side-lobes on the aerodynamics of tri-lobed hull
This section makes use of aerodynamic coefficient bar plots (Fig. 19) for STL_U10 and STL_D10 plotted at
 $\alpha = {0^ \circ }$
,
 ${4^ \circ }$
, and
 ${8^ \circ }$
and compare them against TL_Lo. The
 ${C_L}$
bar plot in Fig. 19(a) presents a significantly reduced
 ${C_L}$
value for STL_U10 variant at
 $\alpha = {0^ \circ }$
and
 ${4^ \circ }$
. However, at
 $\alpha = {8^ \circ }$
, it displays a net
 ${C_L}$
increment of
 $4{\rm{\% }}$
compared to the baseline case. Understanding related to the negative lift associated with STL_U10 is provided in Appendix A.3 The skewed downward variant, STL_D10 displays higher
 ${C_L}$
value at all the angles with an averaged
 ${C_L}$
increment of
 $ \approx 88{\rm{\% }}$
. The overall
 ${C_D}$
value of both the skewed tri-lobes are significantly higher compared to the baseline model (averaged at
 $41.55{\rm{\% }}$
). In fact, the overall drag penalty is highest for STL_U10 at all angles with an average increment of
 $43.5{\rm{\% }}$
compared to baseline model, whereas STL_D10 presented an averaged increment of
 $ \approx 39.6{\rm{\% }}$
. The aerodynamic efficiency of STL_D10 is better compared to both the variants at
 $\alpha = {0^ \circ }$
(Fig. 19(c)). However, at higher angles, the overall aerodynamic efficiency is higher for the baseline model. The upward and downward displacement of side-lobes lead to increased drag at all angles indicating the presence of heightened pressure drag, and hence leading to lowered aerodynamic efficiency. Thus, displacing the side-lobes in the normal direction seems to be deleterious for the overall aerodynamic efficiency. Hence, further analysis related to detailed aerodynamic comparison between the baseline tri-lobed hull and skewed tri-lobed hull will be carried out for the skewed fore and skewed aft tri-lobed hull variants only.
Comparison of aerodynamic coefficients pertaining to skewed up and skewed down tri-lobed hulls at different angles of attack with baseline tri-lobed hulls.

3.4 Flow-field visualisation
In order to obtain further qualitative insight into the flow-physics associated with aforementioned aerodynamic trends, this section will carry out a detailed comparison of flow-field visualisation plots through the usage of velocity, and
 ${C_P}$
distribution plots at various angles.
3.4.1 Surface pressure coefficient plots: 3D analysis
Figures 20(a)–(i) and 21(a)–(c) compare the surface-wise
 ${C_P}$
plots of different variants at various angles to gain visual insight into the flow variations across a lifting body. Considering the heightened impact of external pressure distribution on the overall structural rigidity as well as shape retention of the tri-lobed hull, the aerodynamic assertions drawn hereinafter are based on the assumption of implementing appropriate load stiffeners like internal ribs and laminate tailoring to retain the overall shape. Further, discussions regarding this aspect are covered in a later section (Section 3.6.1).
Front-view of the pressure coefficient distribution over the hull surfaces at different angles of attack.

Back-view of the pressure coefficient distribution over hull surfaces at different angles of attack (legends are same as that of Fig. 20).

All the variants in Fig. 20 present stagnation region at the nose portion followed by pressure decrement as flow accelerates past the nose region. This is followed by pressure recovery beyond the point of maximum diameter, leading to the generation of adverse pressure gradient near the stern portion. Notably, a subtle ridged pattern appears near the nose in the 3-D surface
 ${C_P}$
renders, which could be attributed to the dependence of these contours on the overall surface meshing and contour interpolation. However, later poly-fitted 2-D
 ${C_P}$
curves (Section 3.4.2) exhibit the expected smooth pressure transition from the high stagnation region pressure value to a lower downstream value, consistent with the underlying 3-D distribution. These localised perturbations could be further reduced with targeted mesh refinement in future work. Given the close agreement between the 2-D and 3-D trends and the convergence of the global pressure behaviour, it can be concluded that these ridged features have a minimal impact on the overall
 ${C_P}$
trends.
As
 $\alpha $
increases, the stagnation region intensity on the upper surfaces reduce, and the flow is accelerated to a lower pressure. This leads to an increase in pressure difference across the upper and lower surfaces leading to increased
 ${C_L}$
. This lowering of
 ${C_P}$
value over the upper surface leads to higher adverse pressure gradient conditions near the stern portion, leading to an increase in
 ${C_D}$
value as
 $\alpha $
increases. Moreover, the plots also demonstrate the presence of flow corresponding to low
 ${C_P}$
(accelerated flow) near the intersecting curves pertaining to the tri-lobed variants, which is more intense as
 $\alpha $
increases. Thus, the tri-lobed
 ${C_P}$
distribution plots are associated with diverse regions of
 ${C_P}$
variations. It is the variation of intensity related to these regions across the three variants that would govern their inherent aerodynamic characteristics.
The stagnation region is similar for side-lobes across all variants. However, stagnation region corresponding to middle-lobes displays appreciable variation between the different variants. As the side-lobes move downstream, the intensity of this region increases. For instance, compare the Fig. 20(d) through 20(f). Due to this variation, the downstream pressure decrement is slower for STL_A10 compared to STL_F10. In the case of STL_A10, at
 $\alpha = {0^ \circ }$
and
 ${4^ \circ }$
presented in Fig. 20(c) and (f), respectively, a slower
 ${C_P}$
decrement, and hence a bigger stagnation region is presented. This would amount to increased
 ${C_D}$
value for skewed aft tri-lobed hulls as displayed earlier in Fig. 17(b). In the case of STL_F10, the stagnation region is bigger compared to the baseline model that is TL_Lo. However, the presence of funneling effect between the two side-lobes, leads to higher velocity between the lobes, and hence reduced
 ${C_P}$
value on the middle-lobe nose. This accelerated flow would lead to overall drag reduction, which would be smaller than TL_Lo. The relevant high velocity region dissipates as the side-lobes get shifted aft due to which the impact of this parameter is lower for STL_A10. Thus, the drag is mainly influenced by intensity of the stagnation region in the case of skewed aft tri-lobed hull variants, whereas the influence of flow acceleration between the lobes near the nose has a greater influence on the overall
 ${C_D}$
characteristics for STL_F10. These differences become more appreciable as
 $\alpha $
increases to
 $\alpha = {10^ \circ }$
(Fig. 20(g) through 20(i)).
The surface bound
 ${C_P}$
distribution pattern associated with the stern portion also displays appreciable differences across the three variants. As the side-lobes move aft, presence of a lower
 ${C_P}$
value on the middle-lobes for STL_A10 (Fig. 20(g)) compared to STL_F10 (Fig. 20(i) indicates the presence of lowered flow intermixing between the side-lobe flow and middle lobe flow for STL_A10. The presence of this lower
 ${C_P}$
would explain the presence of higher
 ${C_L}$
for skewed aft tri-lobed hull as indicated earlier in Fig. 17(a). The other two variants display uniform
 ${C_P}$
value distribution on the three lobes. This assertion is further qualified by observing the
 ${C_P}$
distribution contours in Fig. 20. This lowering of value at the stern region for STL_A10 (Fig. 21(c)) compared to STL_F10 (Fig. 21(a)) can be explained by the difference in relative placement of the side-lobes compared to the middle-lobe. Thus, due to the upstream placement of middle-lobe pertaining to STL_A10 (which is at a higher pressure compared to the side-lobes at a particular distance along the hull), higher
 ${C_P}$
flow from middle-lobe move towards the side-lobes. This would amount to lowered flow intermixing across the upper and lower surfaces of middle-lobe at the stern for STL_A10 leading to a lower
 ${C_P}$
value. This could also be related to the intersecting planes converging towards the middle-lobe for STL_A10, leading to lowered
 ${C_P}$
value. Au contraire, downstream location of the middle-lobe stern section for STL_F10, which is at a higher
 ${C_P}$
, induces increased flow intermixing over the middle lobe stern section leading to higher
 ${C_P}$
values, amplified by the presence of this region within the wake of side-lobes. Further corroboration related to this intermixing will be explained using the two-dimensional
 ${C_P}$
distribution plots in a later section. These plots emphasise that as the side-lobes move aft, the overall flow becomes more stagnant at the nose region, followed by increased differences associated with flow intermixing pattern in the stern region, leading to significant aerodynamic deviations between the three variants.
3.4.2 Pressure coefficient distribution at longitudinal vertical plane maximum diameter section of middle and side-lobes
The three-dimensional
 ${C_P}$
contours mentioned above provided a global overview of the overall flow behaviour associated with the three tri-lobed variants. In order to obtain a zoomed quantitative assessment of the associated leading edge suction region, pressure recovery in the middle region as well as stern region’s flow separation characteristics, further analysis was carried out using two-dimensional
 ${C_P}$
distribution plots. This section compares the
 ${C_P}$
distribution plots along the suction and pressure surfaces of the maximum-diameter section, located on the longitudinal vertical planes of side-lobe and middle-lobe, denoted as SP and MP, respectively in Fig. 22. The distribution line plots in Fig. 23 have been evaluated at SP and MP locations of the three variants for
 $\alpha = 0^{0}$
(Fig. 23(a) and 23(b)),
 ${4^ \circ }$
(Fig. 23(c) and 23(d)) and
 ${8^ \circ }$
(Fig. 23(e) and 23(f)).
Planes used to plot the pressure distribution plot.

Comparison of pressure coefficient distribution pertaining to the different skewed hull variants with baseline model plotted along central plane of middle-lobe and side-lobe hulls for different angles of attack.

In-line with the established flow-physics related to airship hull,
 ${C_P}$
starts reducing near the nose portion, as flow accelerates. Beyond
 $x/{L_h} = 0.11$
, the overall surface contour gradient reduces leading to a constant
 ${C_P}$
value. As flow moves beyond
 $x/{L_h} = 0.3$
, it tends to accelerate towards the maximum diameter region leading to further
 ${C_P}$
decrement up to
 $x/{L_h} = 0.5$
. However, beyond the maximum diameter length, the flow starts decelerating leading to
 ${C_P}$
increment. Interestingly, all the plots demonstrate constant
 ${C_P}$
or reduction of
 ${C_P}$
trends beyond
 $x/{L_h} = 0.83$
and minimal differences between the upper and lower surface
 ${C_P}$
values due to flow intermixing.
At
 $\alpha = {0^ \circ }$
, the value of
 ${C_P}$
at the nose on plane pertaining to MP is significantly lower for STL_F10 (
 $ \approx 0.24$
) compared to STL_A10 (
 $ \approx 0.78$
) as seen in Fig. 23(a). This further corroborates the presence of reduced relieving effect for STL_A10, leading to higher
 ${C_P}$
at the nose region similar to BM, and hence higher
 ${C_{{D_0}}}$
. The funneling effect within the side-lobes for STL_F10 leads to reduced
 ${C_P}$
value, and hence lower
 ${C_D}$
. Reduction of
 ${C_P}$
beyond
 $x/{L_h} = 0.3$
(as discussed above) is relatively steeper for STL_A10 and BM, which could be attributed to the converging intersection contour towards MP leading to increased flow velocity, and hence the lower
 ${C_P}$
value (also presented earlier in Fig. 21(c)). STL_F10 presents the lowest streamwise
 ${C_P}$
decrement owing to the diverging intersecting contours. This is also indicative of high pressure flow from the side-lobes moving towards the middle-lobe leading to curtailed
 ${C_P}$
decrement. This will be corroborated later through the usage of velocity contours. Beyond
 $x/{L_h} = 0.5$
, all variants demonstrate similar
 ${C_P}$
increment trends. Although this increment is steeper for STL_A10, the overall value is still lower compared to STL_F10. Thus, as the side-lobes move downstream, adverse pressure gradient over the upper surface attributed to the middle-lobe reduces. The higher
 ${C_P}$
value under the lower surface for stern portion of STL_A10 is indicative of reduced flow velocity leading to increased
 ${C_P}$
value retained across a longer length. This effect is more pronounced for STL_A10 because of reduced inter-mixing, which leads to increased
 ${C_L}$
value at
 $\alpha = {0^ \circ }$
(illustrated earlier in Fig. 17(a)). Thus, the unique geometry of STL_A10 leads to the stern portion of all lobes being mostly affected by their own flow structure. This leads to increased effect of the vortices on the overall lift leading to generation of higher lift at
 $\alpha = {0^ \circ }$
. The overall trends display minimum
 ${C_P}$
variation across the length for STL_F10 leading to lowest
 ${C_L}$
as well as lower
 ${C_D}$
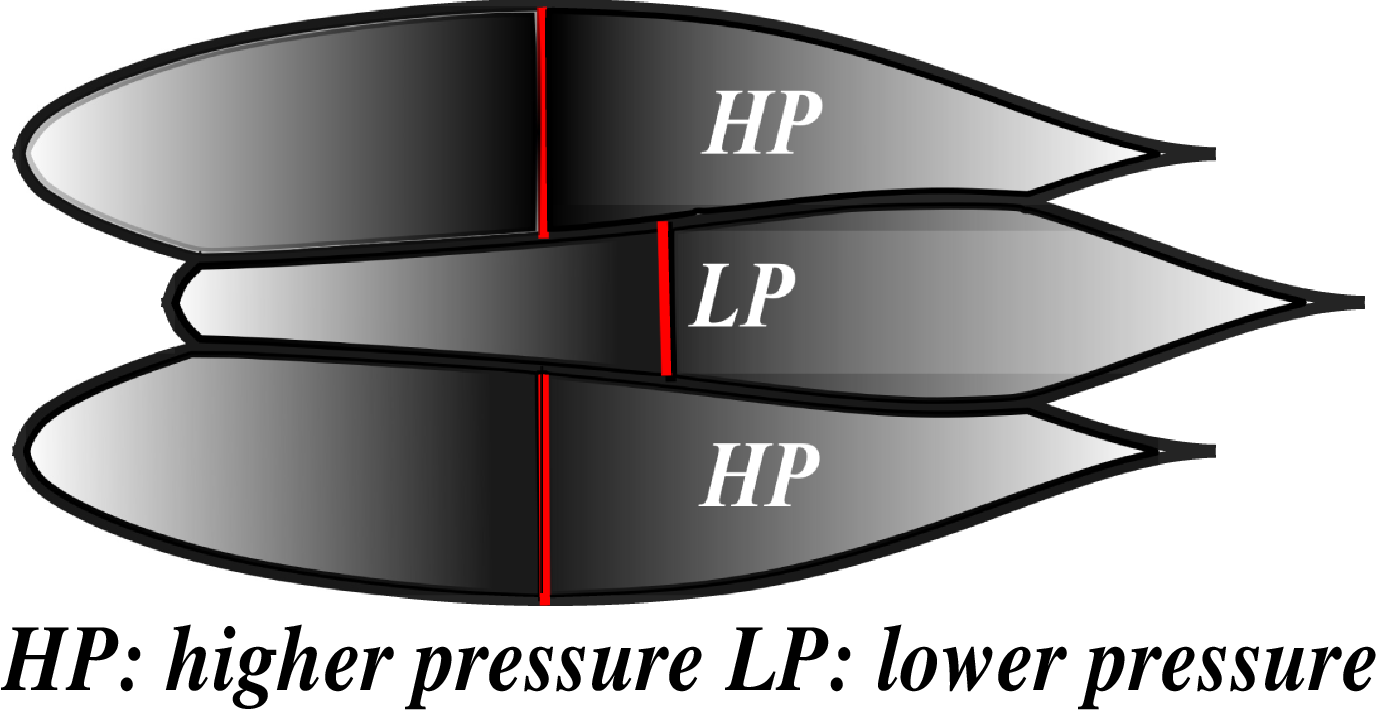
. This can be understood by referring to Fig. 27(g) and Fig. 24. Due to the downstream location of middle-lobes, flow attached with the side-lobes at a particular lengthwise location has higher
 ${C_P}$
compared to middle-lobes. This leads to the side-lobes’ HP (high pressure) flow mixing with middle-lobes’ LP (low pressure) flow leading to an earlier increase in
 ${C_P}$
, increased intermixing, and hence the higher
 ${C_P}$
value over MP compared to other variants. Discrepancies associated with different regions of the three variants are significantly lower at SP (Fig. 23(b)), with all the variants displaying similar
 ${C_P}$
variation along the length. This could be attributed to the increased intermixing phenomena on the side-lobes, further establishing the relevance of middle-lobe on controlling the tri-lobed hull geometry’s aerodynamics.
Pressure gradient in lateral direction leading to flow intermixing on the middle-lobe for STL_F10.

As
 $\alpha $
increases to
 ${4^ \circ }$
, differences between the lower and upper surfaces increase leading to
 ${C_L}$
enhancement for all the variants. Upper surface
 ${C_P}$
plots at MP (Fig. 23(c)) for STL_A10 and BM demonstrates significant lowering over the upper surface between nose and
 $x/{L_h} = 0.5$
section, while STL_F10 exhibits a significantly lower variation of
 ${C_P}$
till
 $x/{L_h} = 0.5$
corresponding to a net variation of
 $82{\rm{\% }}$
. The lowest
 ${C_P}$
value at nose (due to flow acceleration) followed by this gradual
 ${C_P}$
variation upto
 $x/{L_h} = 0.5$
for STL_F10 is again indicative of lowered
 ${C_D}$
value. Differences between the upper and lower surface flow upto
 $x/{L_h} = 0.5$
(which governs the overall
 ${C_L}$
value) is found to be significantly higher for STL_A10. Beyond
 $x/{L_h} = 0.5$
, plots pertaining to STL_F10 presents the earliest increase in upper surface
 ${C_P}$
value, which indicates the onset of earlier adverse pressure gradient conditions. This shall be corroborated later in the velocity flow-field Section 3.5.2. In the case of BM and STL_A10 upper surface plots,
 ${C_P}$
increment is deferred and is steeper. Lower surface plots pertaining to STL_A10 presents higher
 ${C_P}$
value near the stern portion, again indicative of the presence of lower velocity. This could further indicate the presence of adverse pressure conditions beneath the lower surface also. Owing to the reduced lobe-wise intermixing pertaining to middle-lobe for STL_A10, the flow behind the maximum diameter suffers enhanced adverse pressure gradient conditions leading to this phenomena. This is indicative of increased wake vortex impact for aft skewed airship hull variants. In the case of STL_F10 and BM, this difference is significantly higher and also opposite. Thus, the plots demonstrate lower
 ${C_P}$
under their lower surfaces, and higher
 ${C_P}$
over their upper surfaces. Thus, the overall flow contour of lower surface region beyond the maximum diameter is more favourable for these variants, leading to
 ${C_P}$
reduction under the lower surface. This amounts to reduced
 ${C_L}$
values for these variants. In-fact, it is the combination of increased positive lift on the nose region and reduced negative lift on the stern portion that leads to significant lift enhancement for STL_A10 at
 $\alpha = {4^ \circ }$
presented earlier in Fig. 17(a). Analogous to MP, SP plots in Fig. 23(d) again indicate the presence of increased pressure difference between the upper and lower surface plots. However, these differences are significantly lowered at this plane. Moreover, due to increased flow intermixing, differences between the respective upper and lower surface plots across the three variants are significantly lower at this plane. This intermixing is more intense near the stern portion leading to convergence of all the plots with a subtly reduced value for lower surface plots pertaining to STL_F10 and BM, further leading to reduced
 ${C_L}$
values compared to STL_A10.
As
 $\alpha $
increases to
 ${8^ \circ }$
(Fig. 23(e) and 23(f)), the same trends related to increased differences between the upper surface and lower surface plots at MP and SP, followed by increased differences between the variants at MP is repeated. Plots pertaining to MP re-establishes the presence of reduced flow intermixing at the stern portion for STL_A10. In fact, differences between the upper surface and lower surface plots amounting to negative lift is significantly higher at this angle for STL_F10 and BM. Interestingly, STL_F10 displays a significantly lower
 ${C_P}$
value at the nose for its lower surface. In fact, its value increases across the entire length. Due to this appreciably higher adverse pressure gradient, the upper surface flow separates at the stern region, which is indicated by the presence of constant positive
 ${C_P}$
value over the upper surface-stern portion.
Thus, skewing the side-lobes in aft direction leads to increased upper surface and lower surface
 ${C_P}$
differences as well as deviations related to flow intermixing. These plots can also be used as reference plots to implement flow control techniques to control the pressure variation leading to improved aerodynamic performance like implementation of passive devices behind the maximum diameter region to mitigate adverse pressure condition.
3.5 Flow-field visualisation
For the reader’s convenience, a consolidated summary of the inferences drawn from the analysis of the aforementioned
 ${C_P}$
distributions and aerodynamic force plots is presented in Table 7.
Comparative summary of aerodynamic effects of side-lobe skewness on tri-lobed hulls

In order to further understand the reasons governing these trends, detailed flow-field analysis using the velocity and pressure-based flow-field visualisation is carried out in this section.
Longitudinal vertical symmetry plane (green) and lateral vertical cut planes (red) used for flow-field visualisation.

3.5.1 Pressure coefficient flow-field in lateral vertical plane
This section makes use of
 ${C_P}$
contour plots obtained by slicing the computational domain along two lateral vertical planes depicted as red planes in Fig. 25. These lateral planes were placed at
 ${L_h}/4$
, and
 $3{L_h}/4$
locations from the nose of side-lobe hulls. Figures 26 and 27 compare the
 ${C_P}$
flow-field contour plots for STL_F10, TL_Lo and STL_F10 hulls at
 $\alpha = {0^ \circ }$
,
 ${4^ \circ }$
, and
 ${8^ \circ }$
corresponding to the aforementioned lateral planes. Before proceeding towards the detailed explanation of this analysis, it is essential to review an important concept related to wall bounded incompressible flow called the three-dimensional relieving effect [Reference Anderson71] (hereinafter referred to as ‘relieving effect’), mentioned earlier in Section 3.2. Flow approaching a streamlined three-dimensional body like a conventional single-lobe hull is able to ‘relieve’ some of its initial stagnation pressure by moving in the side as well as suction and pressure surface directions, leading to reduced velocity increment across the body. On the other hand, blunt bodies like a tri-lobed hull, amounts to restricted relieving effect leading to increased flow stagnation, increased velocity adjacent to the upper surfaces, and a higher
 ${C_D}$
value. As mentioned earlier by the authors in Ref.(Reference Tripathi, M, Pandey and Pant44), this reduced relieving effect for tri-lobed hulls was the biggest reason for its increased drag penalties. Thus, the impact of shifting side-lobe members on this effect, needs diligent consideration while comparing the lateral
 ${C_P}$
plots pertaining to skewed airship hulls.
Pressure coefficient distribution at 25%
 ${L_h}$
hull length location for skewed fore, skewed aft and baseline tri-lobed hulls at different angles of attack.

At
 $\alpha = {0^ \circ }$
in Fig. 26(a)–(c), flow-field for all the variants indicate the presence of similar flow across the upper surface and lower surfaces accounting for net zero
 ${C_L}$
value. However, the plots also demonstrate the presence of lower
 ${C_P}$
values over and below the middle-lobe. This lowering is maximum for STL_A10 (Fig. 26(c)) indicating reduced relieving effect. The initially side relieved flow from middle-lobes gets immediately blocked by the side-lobes downstream. This can be further corroborated by the presence of increased high-pressure area corresponding to surface pressure plots of STL_A10 as shown earlier in Fig. 20(c). This reduced relieving effect for STL_A10 leads to increased base drag, and hence the increase in
 ${C_{{D_0}}}$
(Fig. 17(b)). In the case of STL_F10,
 $C_{P}$
value pertaining to the middle lobes is smallest (Fig. 26(a)). Aft presence of middle-lobe leads to improved ‘relieving effect’ for the side-lobes followed by acceleration of flow within the lobes as flow approaches the middle-lobe. Consequently, the flow velocity is higher over and below the middle-lobes for STL_F10 (Fig. 26(a)). These variations could explain the overall
 ${C_D}$
trends with lower value being presented for STL_F10, and higher for STL_A10, in comparison to TL_Lo (Table 7).
In line with the surface bound
 ${C_P}$
plots discussed earlier, at higher angles (
 $\alpha = {4^ \circ }$
and
 ${8^ \circ }$
), the three variants display increased suction pressure, accounting for an increase in the
 ${C_L}$
value. Moreover,
 ${C_P}$
contours along the side-lobes are similar for the three variants, whereas the middle-lobe presents appreciably higher variations. Owing to increased funneling effect between the side-lobes followed by induced intermixing across the middle-lobe for STL_F10 as discussed earlier, Fig. 26(d) and 26(g) display significantly lower
 ${C_P}$
value over its middle-lobe. Despite this lower
 ${C_P}$
value compared to TL_Lo, increased intermixing near the nose portion, as well as a narrower ‘low
 ${C_P}$
’ region contribute to lowering of the overall
 ${C_L}$
pertaining to STL_F10 as seen earlier in Fig. 14(a) and mentioned in Table 7. The reduction in
 ${C_P}$
value over the middle lobe is smaller for TL_Lo as seen in Fig. 26(e) and 26(h). Upper surface of the STL_A10 middle-lobe presents maximum pressure reduction (Figs 27(f) and 26(i)) across a wider area leading to highest
 ${C_L}$
increment with
 $\alpha $
. There is also presence of a small ‘low
 ${C_P}$
’ region under the lower surface for STL_A10 at
 $\alpha = {4^ \circ }$
and
 ${8^ \circ }$
, further emphasising the presence of weakened relieving effect for STL_A10. However, at
 $\alpha = {8^ \circ }$
, this reduction of lower
 ${C_P}$
under the lower surface for STL_A10 is significantly curtailed. This analysis concludes some very important aerodynamic considerations related to side-lobe skewness for tri-lobed configurations. Improving the three-dimensional relieving effect by skewing the side-lobes in front direction to reduce
 ${C_D}$
value comes at the expense of mitigating the overall
 ${C_L}$
. Moreover, skewing the side-lobes in aft direction amounts to heightened differential between the upper surface and lower surface
 ${C_P}$
values at the cost of increased base drag value. This study establishes the relevance of optimised selection of side-lobe skewness from an aerodynamic stand-point, and importance of middle-lobes on the overall aerodynamic characteristics of a tri-lobed airship hull. It is envisaged that this study could prove crucial in improving the current state-of-the-art by making use of variable middle-lobe dimensions compared to the side-lobes.
As flow approaches the stern section at
 $75{\rm{\% }}{L_h}$
, the
 ${C_P}$
plots in Fig. 27 further indicate some interesting trends. At
 $\alpha = {0^ \circ }$
, flow contours associated with TL_Lo (Fig. 27c) and STL_A10 (Fig. 27(b)) display the presence of uniform contour across the entire surface indicative of the fact that flow across the upper surfaces and lower surfaces for all lobes have been intermixed. Owing to the increased middle-lobe area for STL_F10 (Fig. 27(a)), it presents lowest value for flow linked with the middle-lobe (Fig. 27(a)), whereas STL_A10 presents higher
 ${C_P}$
value close to the middle-lobes. The lower
 ${C_P}$
value for STL_F10 is indicative of favourable pressure gradient for STL_F10 leading to lower base drag compared to the other two variants. Contrarily, the increased
 ${C_P}$
value for STL_A10 especially beneath the lower surface is indicative of adverse pressure conditions, leading to increased
 ${C_D}$
. This would further indicate the presence of increased flow separation near the stern portion for STL_A10, which will be corroborated later in velocity flow-field section (Section 3.5.2). At such low angles, flow associated with the stern portion has a significant impact on the overall drag characteristics, indicated by trends in these plots.
Pressure coefficient distribution at 75%
 ${L_h}$
hull length location for skewed fore, skewed aft and baseline tri-lobed hulls at different angles of attack (legends are same as that of Fig. 26).

As angle increases, STL_F10 in Fig. 27(d) and 27(g) presents significantly diverse contour variations compared to the other two variants. It presents lower
 $C_{P}$
value under the middle-lobes. This lowering of
 $C_{P}$
would explain the overall decrement of
 $C_{L}$
pertaining to skewed fore variants, indicated earlier in Fig. 14(a). On the other hand, TL_Lo (Fig. 27(h)) and STL_A10 (Fig. 27(i)) indicate the presence of lowered
 ${C_P}$
value along the side-lobes, indicative of increased flow intermixing on the side-lobes. The middle lobe of STL_A10 displays increased
 ${C_P}$
value. This increased
 ${C_P}$
value would amount to increased adverse pressure gradient condition, leading to higher flow separation, and hence the higher
 ${C_D}$
. In the case of STL_F10, middle-lobe leads to lowering of
 ${C_P}$
value, due to which flow-field close to the side-lobes, which is at higher
 ${C_P}$
, gets pushed towards the middle member. This trend is significant for flow under the middle-lobe because of mitigated flow separation associated with lower surfaces. In the case of STL_A10 and TL_Lo, lateral flow from side-lobe to middle-lobe or vice-versa is minimal. However, the presence of lower
 ${C_P}$
along the side-lobes is presented, indicative of flow intermixing across sides of the side-lobes. This would explain the increased variation of
 ${C_L}$
plots pertaining to STL_A10 discussed in Table 7.
3.5.2 Velocity contour distribution
In this section, SP and MP linked streamwise velocity component (
 ${U_x}$
) contours have been compared at
 $\alpha = {4^ \circ }$
(Fig. 28) and
 $\alpha = 8^o$
(Fig. 29) for STL_F10, BM (also referred as TL_Lo) and STL_A10.
Comparison of velocity distribution plots at middle-lobe and side-lobe vertical planes pertaining to different tri-lobed hull variants for angle-of-attack =
 ${4^ \circ }$
.

Comparison of velocity distribution plots at middle-lobe and side-lobe vertical planes pertaining to different tri-lobed hull variants for angle-of-attack =
 ${8^ \circ }$
.

In-line with the aforementioned trends, flow-field contours related to MP exhibits higher deviations within the different variants especially near the stern. Stagnation bubble upstream of the nose is seen to be the smallest for STL_F10 (Fig. 28(a)), followed by higher velocity across a wider region over the upper surface. This is followed by increased lowering of
 ${U_x}$
downstream of the maximum diameter region. Higher
 ${U_x}$
over upper surface leads to a steeper pressure difference between the flow at maximum diameter region and the wake region, which leads to increased adverse pressure gradient, and hence the higher flow separation behind the maximum diameter (indicated by A in Fig. 28(a)). Furthermore, tendency of the high-pressure flow from side-lobes to approach towards the middle-lobes, as seen earlier in Fig. 23(a), further contributes to lowering of the velocity over the upper surfaces of STL_F10. This reduced
 $U_{x}$
velocity over the upper surface is further indicative of the higher
 $C_{P}$
values on the upper surface (indicated earlier in Fig. 23(c) and 23(e)) leading to reduced
 $C_{L}$
value (Fig. 14(a)). Despite the presence of reduced flow velocity region beyond the maximum diameter portion, the increased velocity between the lobes at the nose (indicated by reduced value) leads to significant increment in the relieving effect, and hence the reduced
 $C_{D}$
value. For BM (Fig. 28(c)), the stagnation region is bigger, followed by reduced velocity increment compared to STL_F10. Though STL_A10 (Fig. 28(e)) presents subdued flow separation at the nose portion, a flow separation region is presented below the lower surface near the stern (B in Fig. 28(e)). The increased adverse pressure condition beneath the lower surfaces presented for STL_A10 (mentioned in Table 7) leads to flow separation beyond the maximum diameter region. Due to the lack of intermixing, this low velocity flow is not energised leading to subdued increment of
 $C_P$
value (refer Fig. 23(c) and 23(f) for
 $C_{P}$
distribution) and the visible flow separation region. The presence of this increased flow separation region leads to the higher
 $C_D$
for STL_A10 presented earlier in Fig. 17(b).
In the case of SP contours, STL_F10 (Fig. 28(b)) and STL_A10 (Fig. 28(f)) exhibits lower nose stagnation region compared to BM (Fig. 28(d)). The stern region shows increased flow intermixing leading to lowered velocity fluctuations for all variants. However, contrary to trends presented at MP, stern region velocity fluctuations at SP increase from STL_F10 (C: Fig. 28(b)) to STL_A10 (D: Fig. 28(f)). In fact, due to the increased intermixing along the sides at this plane, STL_A10 presents no visible flow separation feature beneath the lower surface. The increased flow separation beneath the lower surface at MP followed by increased flow separation near the stern at SP for STL_A10 leads to the higher
 ${C_D}$
value.
As
 $\alpha $
increases to
 ${8^ \circ }$
(Fig. 29), stagnation region intensity increases for all the variants leading to the increase in
 $C_{D}$
value. The region corresponding to increased flow separation near the stern for STL_F10 (see E in Fig. 29(a)) is appreciably significant at this angle. Similar to the trends described earlier, STL_A10 presents increased flow separation attached to the lower surface (F in Fig. 29(e)) near the stern region, amounting to increased
 $C_{D}$
value.
Flow associated with SP again demonstrates reduced velocity fluctuations indicative of increased flow intermixing between the upper and lower surface flow. Fluctuations downstream of the stern still poses subtle differences across the three variants. Velocity fluctuations for STL_F10 are lowest followed by increased fluctuations for BM and STL_A10 (compare regions G, H, and I in Fig. 29(b), 29(d) and 29(f), respectively). Owing to the downstream location of side-lobes for STL_A10, interactions between the wake regions associated with side-lobes and middle lobes are reduced. Hence, the flow intermixing is significantly reduced. In the case of BM, the lateral motion is restricted, leading to reduced intermixing, and hence the higher streamwise fluctuations. Flow entertainment across the stern region from lower to upper surface is more significant for STL_F10. This would lead to reduced differences between upper and lower surface pressures leading to reduced
 ${C_L}$
.
It is notable that the velocity fluctuations indicated tendency of the flow to separate for upper surfaces in the case of STL_F10, whereas the same is presented under the lower surface for STL_A10. These vortices would generate a subtle longitudinal force in the x-axis direction (Fig. 30). Owing to the reduced aspect ratio of these hulls, generation of these vortices at the stern region leads to increased impact on the overall aerodynamics [Reference Gabriel and Mueller72, Reference Tripathi, Sucheendran and Misra73]. Notably, the relative placement of these vortices (emphasised in Fig. 30), leads to a force acting above the moment centre in the case of STL_F10 leading to increased pitch instability, whereas it acts below the moment centre in the case of STL_A10 leading to restoring moment. This leads to a net increase in the pitching moment stability for STL_A10 compared to BM presented earlier in Fig. 14(d), whereas the pitching moment instability is further degraded for STL_F10.
Stern portion non-linear lift components.

Thus, notable comprehensions regarding the underlying flow-physics for the different tri-lobed variants were accomplished through this analysis. These results further corroborated the presence of increased flow intermixing on the middle-lobes for STL_F10, followed by increased flow separation beneath the lower surface for STL_A10 leading to variations with respect to the respective aerodynamic trends. These assertions can be utilised by future airship designers to reduce the flow separation associated with middle-lobe through implementation of flow control techniques at appropriate locations.
3.6 Comparison of aerodynamic metrics related to skewed tri-lobed airship variants
After carrying out a detailed quantitative and qualitative analysis of the different skewed tri-lobed airship variants compared to the baseline tri-lobed hull (TL_Lo), this section explicitly compares some key aerodynamic metrics associated with all the longitudinally skewed tri-lobed hull variants. The concise amalgamation of these aerodynamic metrics including,
 ${C_{{L_\alpha }}}$
,
 ${C_{{D_0}}}$
and
 ${C_L}/{C_D}$
will be a crucial tool for prospective airship hull designers to fine-tune their tri-lobed hull geometry based on an informed interpretation of the underlying aerodynamic trends. Such an understanding would be crucial in understanding the design trade-offs pertaining to various skewed hull variants, enabling design optimisation of future tri-lobed hull variants. The parameters discussed in this section are crucial aerodynamic parameters for low
 $\alpha $
operations. As most airship applications are operated within the low
 $\alpha $
range, the deliberations inferred from this section would be crucial in understanding the effect of skewing the side-lobes of tri-lobed airships from an application stand-point.
Figure 31(a) compares the
 ${C_{{L_\alpha }}}$
pertaining to all the longitudinally skewed hull variants. It can be seen that skewing the side-lobes in the aft-direction while retaining the same
 ${V_h}$
leads to increased
 ${C_{{L_\alpha }}}$
. In-fact, the skewed fore tri-lobed hull variants under perform compared to TL_Lo, whereas the skewed aft variants present an appreciably higher
 ${C_{{L_\alpha }}}$
, ranging between
 $43{\rm{\% }}$
to
 $61{\rm{\% }}$
compared to the baseline model. Thus, as the side-lobes move aft, their lift slope improves, indicating improved flight handling capability as well as improved maneuverability to obtain the desired dynamic lift capabilities, which is imperative for HAs.
Comparison of aerodynamic performance pertaining to longitudinally skewed tri-lobed hull variants with baseline tri-lobed hull variant.

The bar plot presented in Fig. 31(b) compares the overall drag penalty associated with hull variants at
 $\alpha = {0^ \circ }$
, which is crucial to understand the aerodynamic performance of lifting bodies in cruise condition. Contrary to the trends discerned earlier for
 ${C_{{L_\alpha }}}$
,
 ${C_{{D_0}}}$
presents deleterious performance for the skewed tri-lobed hull variants as the side-lobes move aft. Value pertaining to STL_A10 is higher by
 $ \approx 20{\rm{\% }}$
compared to the baseline model, whereas STL_F10 presents lowering of the drag penalty by
 $ \approx 4.1{\rm{\% }}$
. Thus, the improved relieving effect pertaining to skewed fore tri-lobed hull variants lead to reduced drag penalties, which could be a crucial factor while selecting the final tri-lobed hull variants.
Since HAs are being touted for widespread implementation on long-range freight missions [Reference Ardema8], wherein the aerodynamic efficiency of the hulls would play a crucial role in determining the overall economical benefits, Fig. 31(c) compares the
 ${C_L}/{C_D}$
ratio of all the variants at
 $\alpha = {4^ \circ }$
,
 ${6^ \circ }$
and
 ${10^ \circ }$
. In line, with the expected trends, the overall aerodynamic efficiency increases as
 $\alpha $
increases for all the variants. Moreover, as the side-lobes move aft, the overall aerodynamic efficiency becomes higher for the tri-lobed hulls. For instance, the averaged
 ${C_L}/{C_D}$
enhancement for STL_A10 is valued at
 $18{\rm{\% }}$
compared to TL_Lo across all the angles. Thus, the effect of lift enhancement for skewed aft tri-lobed hulls is higher compared to the increased drag penalty, leading to improved
 ${C_L}/{C_D}$
performance. Contrarily, skewed fore variants demonstrate an average reduction of
 $ \approx 32{\rm{\% }}$
compared to the baseline models. It is also noteworthy, that the overall
 ${C_L}/{C_D}$
enhancement is significantly higher at lower angles. For instance, the average increment between successive variants is
 $31{\rm{\% }}$
at
 $\alpha = {4^ \circ }$
, whereas it is found to be only
 $3{\rm{\% }}$
at
 $\alpha = {10^ \circ }$
. Thus, the skewed aft hulls present the most optimum aerodynamic efficiency metric. It is also established that the overall aerodynamic efficiency enhancement between STL_A05 and STL_A10 is significantly lower at higher angles.
3.6.1 Comparison of load distribution aspects for different tri-lobed hull variants
It can be concluded from the aforementioned analysis that tri-lobed hull increases the available lifting surface area while reducing frontal drag area compared to three isolated hulls. The external aerodynamic pressure distribution, shaped by Bernoulli effects, stagnation zones and wake regions, affect the overall lift, drag and pitching moment characteristics. However, the assertions drawn earlier were based on assumption of a rigid airship hull surface. For a semi-rigid surface, any internal pressure imbalance would deform the hull surface, thereby altering external pressure distribution and degrading aerodynamic performance. Thus, 3D and 2D external pressure coefficient (
 ${C_P}$
) distribution plots discussed in Sections 3.4.1 and 3.4.2, respectively, would have a significant influence on the overall structural load distribution, shape-retention strategies, and aerodynamic stability of the tri-lobed hull. To enhance the engineering applicability of this study, the current section provides a brief qualitative overview of how variations in
 ${C_P}$
for different skewed tri-lobed configurations can affect the selection of the final hull geometry from a structural integrity standpoint.
The authors emphasise that the following discussion is qualitative in nature; a comprehensive finite element analysis (FEA) study is recommended for future work to quantitatively validate these observations.
Load Distribution and Shape Retention: The internal pressure of the lifting gas primarily governs the structural rigidity of an airship hull. However, the complex geometry of the tri-lobed configuration, combined with the anisotropic external
 ${C_P}$
distribution, makes these hulls sensitive to both static and cyclic loading effects. The three lobes share loads through a common internal framework or membrane, which dictates how pressure variations influence load transfer, membrane compression, local bending, buckling and cyclic fatigue characteristics. The following discussion briefly summarises the structural implications for each skewed configuration.
Aft-Skewed Tri-lobed Hulls
-
1. The deferred pressure reduction at the nose (as observed for STL_A10) would result in higher local compressive loads, increased susceptibility to nose buckling, with the overall cyclic fatigue exposure remaining on the lower side.
-
2. Subtle pressure fluctuations across the nose indicates reduced bending near the junctions, which can be managed through load distribution techniques like diaphragms.
-
3. The reduced streamwise pressure variation across the mid-lobe surfaces leads to reduced bending stresses, thereby improving fatigue life.
-
4. Overall, aft-skewed tri-lobed hulls exhibit a more rigid structural behaviour, with emphasis on localised reinforcement around the nose and junctions rather than global stiffening.
Fore-Skewed Tri-lobed Hulls
-
1. The dynamic low-pressure region at the nose would amount to increased cyclic stress amplitudes, leading to increased fatigue loading on the nose section.
-
2. The pronounced
${C_P}$
discontinuity at the lobe junctions would cause increased bending, and hence degrading the long-term shape retention and structural uniformity characteristics of the lobes. -
3. The steeper streamwise pressure gradients would cause higher longitudinal bending and buckling cycles, further amplifying fatigue susceptibility.
-
4. Thus, load regulation in this configuration is more complex, requiring engineered nose-skin design, optimised junction load paths and regular monitoring of structural integrity to ensure long-term durability.

In summary, side-lobe skewness linked with differing
 ${C_P}$
distribution trends will strongly influence the load distribution strategies of these hulls with regards to fatigue behaviour, and shape-retention characteristics. Aft-skewed variants provide improved rigidity characteristics with localised stress concerns at the nose and junctions, whereas fore-skewed variants exhibit higher flexibility and are amenable to cyclic fatigue and bending-deformations. These conclusions provide a preliminary way forward to optimising internal structural layout and reinforcement design for skewed tri-lobed airship configurations that would enable prolonged shape retention and improved fatigue characteristics. Given the varied sensitivity of different skewed airship variants towards these structural parameters, the authors would recommend carrying out a dedicated FEM analysis in the future. Such an approach would provide enhanced understanding regarding the structural attributes of skewed tri-lobed airships, enabling efficient retention of the optimised aerodynamic shape.
3.6.2 Comparison of stability characteristics
A comparison of the pitching moment slope (
 ${C_{{M_\alpha }}}$
) for the variants are presented in Fig. 32. A posteriori, airships are linked with a positive
 ${C_{{M_\alpha }}}$
, indicative of an inherently unstable lifting body. However, skewing the side-lobes in the aft direction leads to curtailed pitching instability. In fact, there is an average decrement of
 $ \approx 8.2{\rm{\% }}$
for
 ${C_{M\alpha }}$
between STL_F10 to STL_A10. This decrement is averaged at
 $ \approx 19{\rm{\% }}$
for the skewed aft variants compared to TL_Lo. Thus, as the side-lobes move aft, the tri-lobed hulls become more stable. Increased
 ${C_P}$
value at the nose and reduced stream-wise pressure difference for the skewed-aft hulls are associated with increased restoring moment as well as reduced bending moment fluctuations, respectively. These along with the presence of lower surface lift indicated earlier lead to the higher longitudinal stability for skewed-aft tri-lobed hulls. This would lead to reduced weight penalties associated with the fin control surfaces for STL_A10. Additionally the presence of fin surface on the skewed aft side-lobes would lead to increased moment arm for the control surfaces. This will further amount to reduction of the fin surface area required to provide the necessary stabilising moment. Thus, skewing the airships in aft-direction presents additional benefits with respect to longitudinal stability of the airships. However, given the reduced pitch stability (Fig. 32) and reduced
 $C_L/C_D$
enhancement at higher angles (Fig. 31(c)) between STL_A10 compared to STL_A05, along with the presence of reduced
 $C_{L_{\alpha}}$
(Fig. 31(a)) performance of STL_A10, indicates a limiting value on aft displacement of the side-lobes to achieve aerodynamic performance enhancement.
Comparison of pitching moment coefficient slope for all skewed hulls.

It can be envisaged that employing a design optimisation scheme like the one discussed in Ref. (Reference Kumar, Tripathi, Pant, Tripathi and Kiran Babu74) to discern the most optimum skewness of side-lobes along with side-lobe hull dimensions would lead to improved aerodynamic efficiency whilst retaining higher
 ${C_{{L_\alpha }}}$
as well as mitigated
 ${C_D}$
.
Another important aspect to be considered while selecting the final tri-lobed hull geometry would be to analyse the impact of these variants on the overall yaw stability. The increased nose stagnation pressure for STL_A10 would lead to improved weathervaning effect, whereas smoother longitudinal pressure variation would lead to reduced yaw-inducing moments. As a result, the overall yaw-stability would seem to increase for skewed aft variants. Notably, these assertions are only based on subjective analysis of the
 ${C_P}$
distribution plots discussed earlier. Detailed analysis regarding this aspect can be carried out in the future through the analysis of skewed tri-lobed hulls subjected to side-wind load conditions.
4.0 Conclusions
Considering the recent surge in implementation of hybrid airships consisting of multi-lobed hulls, a series of steady-state numerical simulations were carried out using the Reynolds-averaged Navier-Stokes framework implemented in OpenFOAM® for tri-lobed hull variants. These tri-lobed hull variants, called as skewed tri-lobed hulls, were derived from the baseline tri-lobed hull, by altering the relative placement of side-lobes with respect to the middle-lobe in the fore, aft, upward and downward directions, while retaining the same volume. The simulations were carried out with the aim of establishing a way forward for aerodynamic efficiency enhancement of tri-lobed airships. Numerical investigations across these configurations were carried out for low subsonic (Mach number
 $ \lt 0.1$
) and high Reynolds number (
 $Re = 3.9 \times {10^5}$
) flight conditions across different angles of attack, that is
 $\alpha = {0^ \circ }$
to
 ${10^ \circ }$
. Accuracy pertaining to the implemented numerical framework was ascertained by obtaining numerical results within
 $2{\rm{\% }}$
of the experimental data for a conventional single-lobed airship hull based on the LOTTE profile. Some noteworthy inferences drawn from the comparison of skewed hull variants with baseline tri-lobed hull variant are as follows:
-
• Skewed fore tri-lobed hulls exhibited reduced aerodynamic efficiency up-to
$ \approx 39{\rm{\% }}$
attributed to significant lift coefficient (
${C_L}$
) reduction (
$57{\rm{\% }}$
) followed by a lowering of drag coefficient (
${C_D}$
) up-to
$10.6{\rm{\% }}$
and a marginally higher pitching moment instability. -
• The skewed aft tri-lobed hull presented an efficient solution to improving the aerodynamic efficiency of tri-lobed hulls by presenting an efficiency enhancement of
$ \approx 17{\rm{\% }}$
compared to the baseline model due to a significant increase in
${C_L}$
(up-to
$45{\rm{\% }}$
) at the expense of increased
${C_D}$
value of up to
$23{\rm{\% }}$
followed by improved pitching moment stability. -
• Improving the three-dimensional relieving effect by skewing the side-lobes in front detection to reduce
${C_D}$
value came at the expense of mitigating the overall
${C_L}$
, whereas skewing the side-lobes in aft direction amounted to heightened pressure differential between the upper surface and lower surface
${C_P}$
plots at the cost of increased base drag value. -
• The results further indicated a limiting value on the amount of aerodynamic performance enhancement that can be achieved by skewing the side-lobes in aft-direction, which further indicates the scope of employing a design optimisation study to discern the most optimum skewness of side-lobes for improved aerodynamic efficiency whilst retaining a higher
${C_{{L_\alpha }}}$
as well as improved
${C_{{M_\alpha }}}$
. -
• The skewed aft tri-lobed hull presented heightened nose stagnation, gradual pressure variations across the hull as well as reduced intermixing near the stern region, whereas the skewed fore tri-lobed hull variant displayed significantly higher pressure reduction at the middle lobe, increased stream-wise pressure variations, and intermixing on the middle-lobes.
-
• Flow separation on the upper surface was significantly higher near the stern region for skewed-fore variant, whereas skewed-aft variant presented increased flow separation below the lower surface of the middle lobe owing to reduced flow intermixing, further emphasising the importance of middle-lobes on the overall aerodynamic characteristics of a tri-lobed airship hull.
-
• The assessment of pressure distribution differences between aft-skewed and fore-skewed tri-lobed hull variants indicated that local stiffeners will be required at the nose and lobe junctions for aft-skewed configurations to manage concentrated loads, whereas fore-skewed tri-lobed hulls could be more susceptible to cyclic fatigue at the junctions and nose necessitating careful structural design and maintenance to ensure long-term durability.
-
• Deliberations related to the skewed upward and skewed downward variants presented significant
${C_L}/{C_D}$
reduction at all angles. -
• The results derived in this analysis can be used as a reference to implement a design optimisation scheme integrated with active learning techniques [Reference Tripathi, Kumar and Pant75] to fine-tune the skewness parameter, to implement passive flow techniques beyond the maximum diameter, to incorporate variable hull profiles for the side-lobes or to integrate webbed stern region [Reference Tripathi, M, Pandey and Pant44] on skewed aft tri-lobed hull to improve aerodynamic performance of tri-lobed hulls.


The tri-lobed hull geometry increases the available lifting surface area while reducing frontal drag area compared to three isolated hulls. The external aerodynamic pressure distribution, stagnation regions, and wake disturbances, govern the overall lift, drag and pitching moment characteristics. The paper illustrated significant impact of side-lobe skewness on these aerodynamics parameters. The results further emphasised the role of efficient skewing on the shape retention and stability characteristics of tri-lobed hulls. The epistemic understanding obtained from this study will be crucial for future airship designers to implement design modifications to the current state-of-the-art for optimised aerodynamic efficiency enhancement of tri-lobed hulls, and hence enhance their utility across long-haul freight missions.
Acknowledgments
The authors would like to thank the Department of Aerospace Engineering situated at the Indian Institute of Technology Bombay (IIT Bombay), India, which provided us the necessary logistical and financial support to carry out these simulations. We would also like to convey our deepest gratitude to technical staff, especially Mr. Vinay Anand and Mr. Raman Verma for their unwavering support, which was pivotal in carrying out the necessary workstation setup, software installation as well as troubleshooting errors. We would also like to convey our deepest regards to Dr. Manikandan M. (associate professor, Manipal Institute of Technology) who helped us in generating the required geometries utilised in this study.
Competing interests
The author(s) declare none.
Appendix A
A.1 Reports demonstrating relevance of hybrid airships for future of transportation sector
This appendix provides an amalgamation of the current state-of-affairs with respect to the global transportation sector, and why the technological evolution of hybrid airships is being touted as the need-of-the hour for progress in green aviation.
Figure A1(a) presents the overall contribution of different transportation modes on US’s overall greenhouse emissions drawn from a 2020 report presented by the U.S. Environmental Protection Agency [2]. The report concluded a stark
 $7{\rm{\% }}$
year-on-year increment of global CO
 ${{\rm{\;}}_2}$
emissions. Terrestrial transportation sector contributed to more than
 $84{\rm{\% }}$
of the total greenhouse emissions, with emissions pertaining to medium and heavy increasing by more than
 $84{\rm{\% }}$
. Figure A1(b) further elaborates the significantly higher range of operating water-bound cargo ships. Despite this heightened range, cargo ships present significantly higher delivery times (Fig. A1(c)). Thus, higher speed leads to reduced range, whereas a higher range amounts to lower speeds and exacerbated greenhouse emissions. Considering, the current speed-cost lacuna along-with the financial and environmental implications, there is a need to reinvigorate this sector and implement new sustainable technologies. Bringing technological advancements in the field of aviation industry, which is associated with lower delivery times, has been presented as a viable option to meet global pollution mitigation requirements. To that end, implementing electric airships in the form of hybrid airships has been studied by various organisations including ICAO (International Civil Aviation Organization) [6], which asserted the significantly lower fuel consumption in gm per tone-km of payload transportation and is compared in Fig. A2, which further emphasised the relevance of technological advancements in this field.
Comparison of different transportation modes.

Geometrical and flow parameters for Zhiyuan-1 airship study

CO
 ${{\rm{\;}}_2}$
emission in gm per tone-km for different modes of cargo transport modes.

A.2 Solver validation for Zhiyuan-1 aerofoil
As an initial step to setting-up the solver implemented in this paper, a preliminary analysis covered in Ref. (Reference Gupta, Tripathi and Pant54) was carried out for the Zhiyuan-1 airship hull (notated as SL_Zi). This study acting as an important step towards setting up the final numerical framework, compared the numerical and experimental results related to a
 $1:13.7$
scaled down model of the SL_Zi [Reference Wang, Fu, Duan and Shan77]. This Chinese airship (Fig. A3) extensively used as reference case in numerous erstwhile CFD investigations, is associated with parametric equations elaborated in Ref. (Reference Suman, Lakshmipathy and Pant78). Specifications on dimensions and flow related to this study are given in Table A1.
Generatrix related to Zhiyuan-1 airship hull: SL_Zi.

Figure A4 presents the comparison of
 ${C_L}$
and
 ${C_D}$
data for the Zhiyuan-1 hull (SL_Zi). As seen in the figure, the employed CFD solver was able to capture the aerodynamic trends related to both the coefficients within an acceptable level of accuracy. The absolute error (
 $\delta $
) between the numerical and experimental results pertaining to
 ${C_L}$
was found to be
 $ \approx 1.8{\rm{\% }}$
below
 $\alpha = {10^ \circ }$
. In the case of
 ${C_D}$
, the numerical results were within
 $10{\rm{\% }}$
of the experimental results beyond
 $\alpha = {6^ \circ }$
. However, discrepancies with respect to increased numerical
 ${C_D}$
at lower angles can also be observed. These deviations were attributed to the fact that high
 $Re$
characteristic of the simulated flow makes the flow amenable to flow transition effects, whereas the employed solver assumed the flow to be fully turbulent. Thus, the drag gets overestimated at lower angles. Notwithstanding these variations, the solver was able to capture the aerodynamic trends pertaining to SL_Zi within an acceptable level of accuracy especially for
 $\alpha $
ranging between
 $\alpha = {0^ \circ } - {10^ \circ }$
. Although the study demonstrated increased deviation between the numerical and experimental variations compared to the LOTTE profile case, it acted as an important step in formulating the numerical framework used for the LOTTE profile hull simulated in this paper.
Comparison of numerical and experimental results for the Zhiyuan-1 airship hull.

A.3 Explanation of negative lift for skewed upward tri-lobed hull
The overall positioning of side-lobes in the upward direction for STL_U10 (Figure A5) leads to increased flow velocity below the lower surfaces pertaining to middle-lobes leading to negative pressure differential, and hence the negative
 ${C_L}$
value. However, in the case of skewed down lobes, the velocity will be higher over the upper surface of middle-lobes leading to increased lift compared to the three variants.
Flow-physics related to negative lifting force generated by skewed-upward tri-lobed hulls.