

The World is a healthier place than at almost any time in the past. People live longer, they are taller and stronger and their children are less likely to get sick or to die. (Reference Deaton1)
A continuing trajectory away from the Holocene could lead, with an uncomfortably high probability, to a very different state of the Earth system, one that is likely to be much less hospitable to the development of human societies. (Reference Steffen, Richardson and Rockström2)
These two quotes, whilst not necessarily incompatible, illustrate the disconnect between different perspectives of the present: is it a time of unprecedented peril or progress, or is it both? What is the state of our planet, and what does it mean for people around the world? How do we manage threats, build on genuine progress, and assure a healthy, habitable planet for future generations?
This book attempts to address these questions. We do so through the lens of human health and well-being. We hope in this way to fill a gap in the growing roster of publications that explore recent dramatic environmental changes and the driving forces behind them. Our premise is that the health of populations depends on the integrity of natural systems. These systems provide ‘ecosystem services’ such as freshwater and food, energy and building materials, and storm protection. Natural environments also provide meaning and inspiration to billions of people. Importantly, natural systems maintain planetary conditions within safe limits for humanity. However, many natural systems, both globally and regionally, have been altered and their vital functions compromised by human actions. These changes threaten to undermine progress, with far-reaching consequences for the health of today’s and future populations.
To understand these transformational changes in natural systems, we need to analyse more than just their physical manifestations. We need to confront questions of history, politics, economics, and even human nature. Did humanity stumble unknowingly into the future we are creating, or did the current state of the planet result, to some degree, from deliberate decisions by parties who could have pursued a different and more benign development pathway but had strong incentives to exploit short-term benefits over future sustainability? In an era when ‘facts’ can be manipulated to serve powerful interests on a scale never previously witnessed, this line of inquiry is highly charged. Perceptions about the relative importance of a threat or an opportunity may be filtered by ideologies, coloured by preconceptions, and shaped by forces with private agendas. This book aims not merely to document the burgeoning threats to human health but also to suggest potential actions that could be taken to adapt to environmental change that cannot be prevented, and more importantly to halt, and where possible reverse, the environmental damage that has already occurred. We aspire to provide a clear trail of evidence to support our conclusions, and to be transparent about inevitable uncertainties. In doing so we draw on insights from diverse disciplines and academic traditions, without claiming to be expert in many of them. We invite you, the reader, if in doubt, to consult the original sources and make up your own mind.
The Long Arc of Human History
The story has to begin during the long (in human but not geological terms) period of the last nearly 12,000 years forming the Holocene Epoch, when humanity emerged from hunter-gatherer to agrarian communities and later into growing urban settlements founded on trade, and increasingly manufacturing. The Holocene was notable for its relative climatic stability, which allowed civilization as we know it to emerge. It was interrupted only by little ice ages – significant on human scale but minimally so on a geological scale. Much can be learned from the impacts of relatively modest fluctuations in climate on human society over this period (Reference McMichael, Woodward and Muir3). These lessons help us assess the likely effects of rapid climate and other changes on health and development in the future (see Chapter 2).
The industrial revolution occurred during the eighteenth and nineteenth centuries. While technology advanced in many places around the world, the epicentre was in Europe and North America. The steam engine emerged in the early eighteenth century. A vast range of industries, from textiles to iron and steel to shipbuilding, saw rapid innovation, mechanization, and growth. Machines began to replace human and animal labour on farms. An economic transition from agriculture to industry, population shifts from rural to urban, and population growth, all followed. A second wave, sometimes called the second industrial revolution, occurred during the late nineteenth and early twentieth centuries, featuring mass production on assembly lines, transportation advances including the internal combustion engine, and distributed electrical grid systems. While a full account of this history is beyond the scope of this chapter, one underlying theme is important to emphasize: the central role of energy (Reference Smil4). It was unprecedented access to concentrated energy, first from coal and later from petroleum and natural gas, that unlocked the revolutionary changes that ushered in the modern world – both its benefits and some of its greatest challenges.
Progress in health gathered pace during the late nineteenth and early twentieth centuries. Consider life expectancy in England, where good historical data are available. There was little change between 1550 and 1850 (although the life expectancy of ducal families began to rise around 1750) (Reference Harris5). Between 1850 and 1950 average life expectancy increased from 40 to 70 years, with most of the increase occurring from 1900 onwards (apart from a dip in 1918 due to the post-World War I influenza pandemic). The increase was observed in other countries for which there are data. It was due primarily to reduced chances of dying in childhood and predated the advent of many effective treatments for adult diseases. Improved nutrition was certainly part of the story but not the only explanation. Economic growth alone is also an unlikely candidate because the improvements in child mortality were uniform across Europe despite the highly uneven onset of economic growth (see (Reference Deaton1) for discussion). The most likely explanation is the adoption of public health measures, including improved sanitation, led by pioneering researchers such as John Snow, whose epidemiological study of cholera transmission in London showed how it was spread through faecal contamination of drinking water (Reference Rosen6, Reference Melosi7).
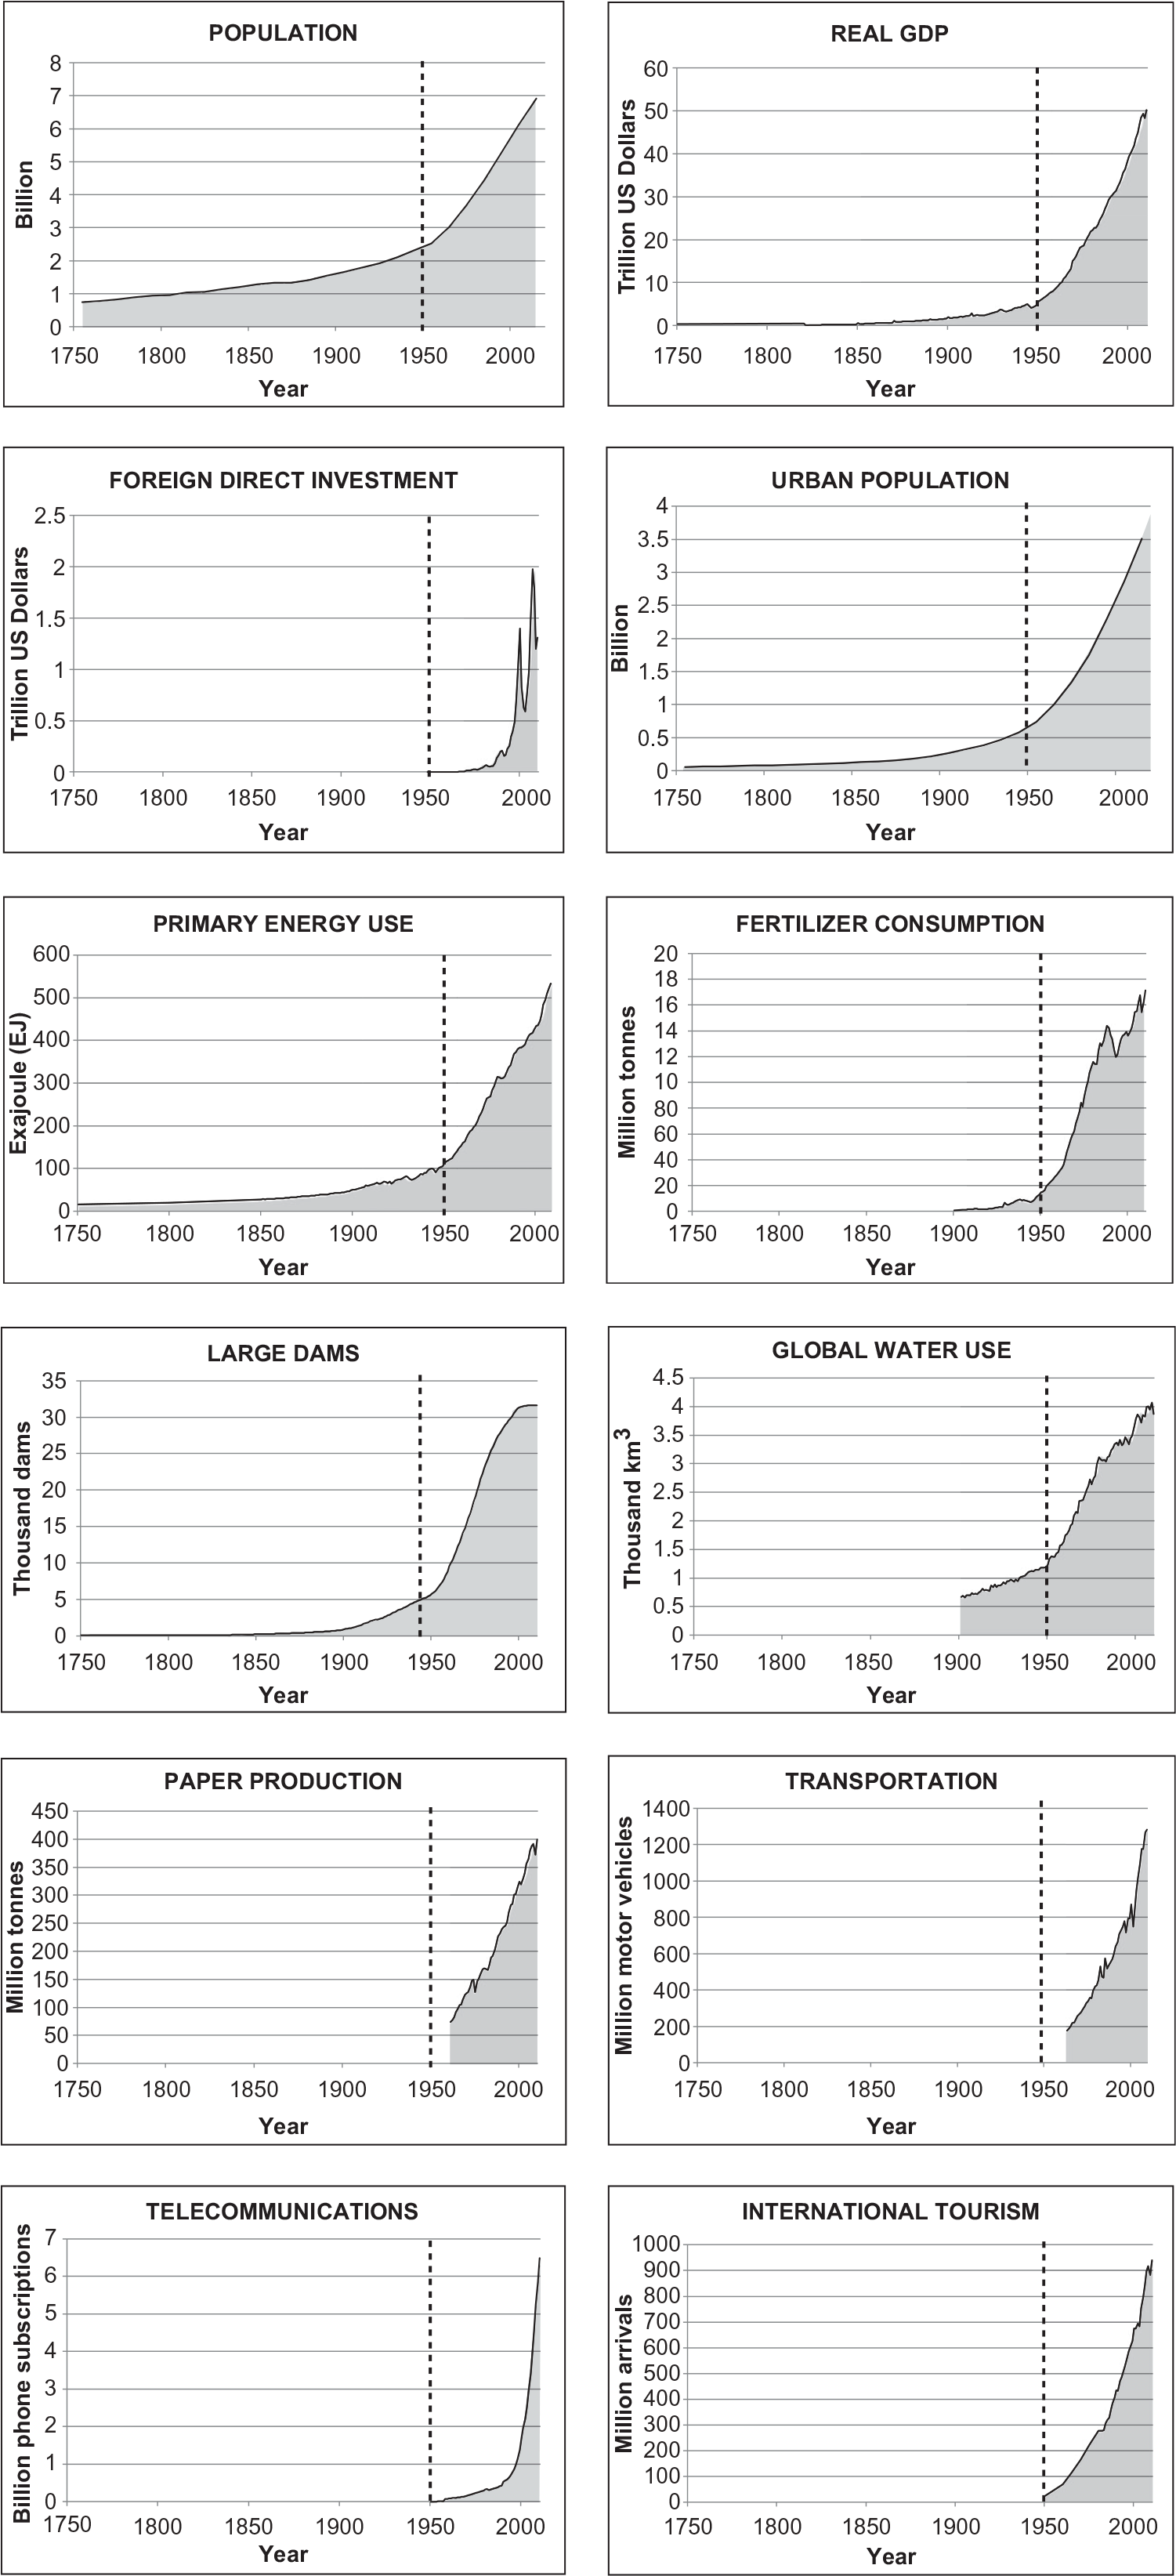
By the mid-twentieth century, the post-World War II economic expansion brought a further growth in global population, increasingly rapid technological change (such as the development of the synthetic organic chemical and electronics industries), and increasing demands for raw materials, food, and energy. This scaling up of the human enterprise has been called the Great Acceleration (Reference Steffen, Crutzen and McNeill8). It is best captured by the iconic set of graphs that demonstrate human progress as assessed by a range of indicators (population, economic growth, resource use, urbanization, globalization, transport, and communication) (Figure 1.1).
The Great Acceleration. These graphs show the rapid upscaling of the human enterprise, using a wide range of indicators. Dramatic growth began in the nineteenth century and accelerated rapidly in the second half of the twentieth century.

Human Thriving in the Great Acceleration
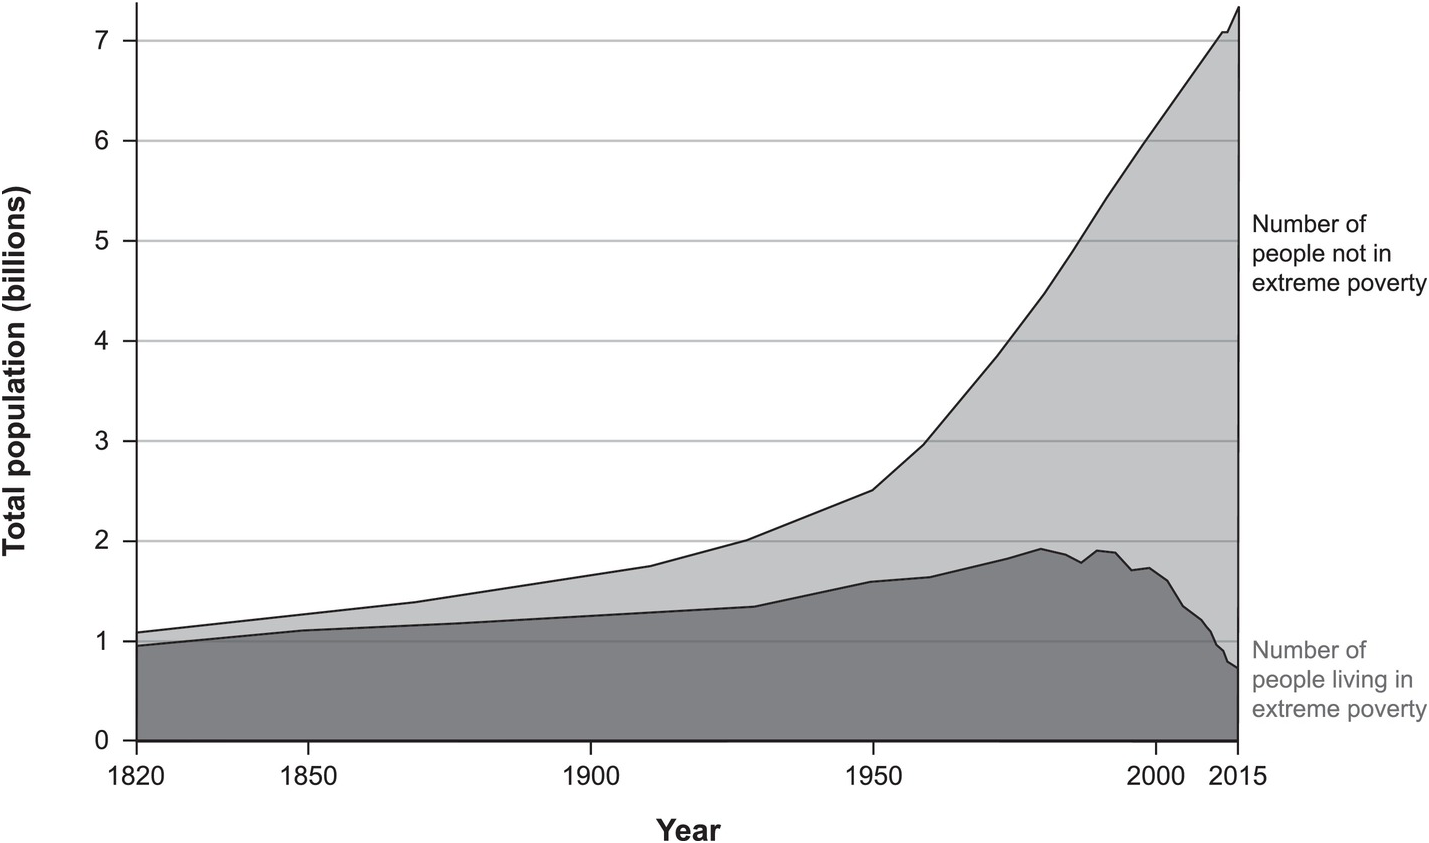
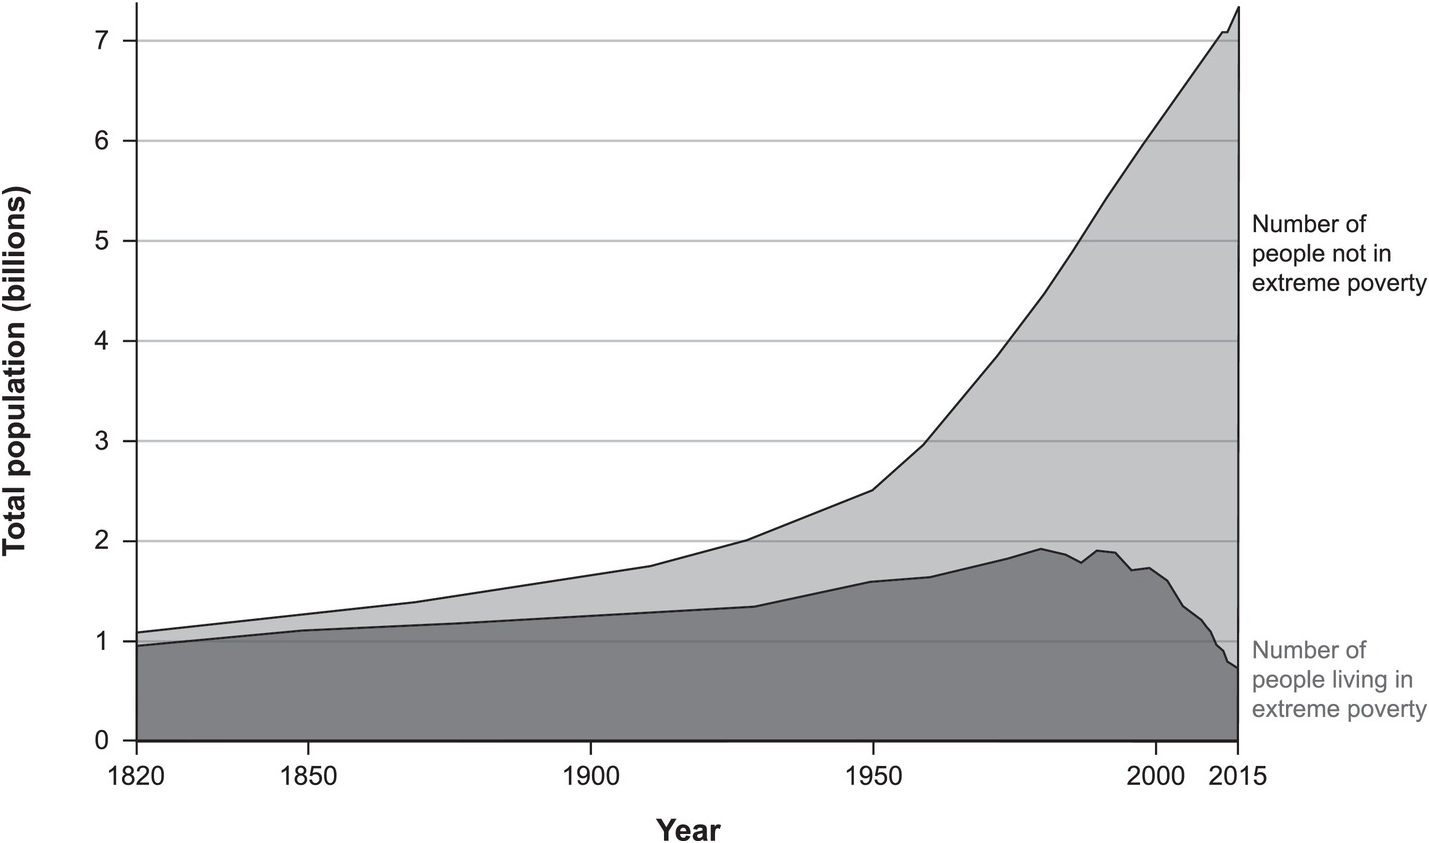
It is obvious from the graphs in Figure 1.1 that this period has been largely a positive experience for much of humanity. The average life expectancy increased worldwide from 47 years in 1950–1955 to 70.9 years in 2010–2015 (9). Death rates in children younger than 5 years of age worldwide decreased substantially from an average of 214 per thousand live births in 1950–1955 to 39 in 2018 (10). According to World Bank estimates, in 2015, 10% of the world’s population lived below the international poverty line, currently set at US$1.90 a day (in 2011 purchasing power parity (PPP) dollars), compared with 36% in 1990. Nearly 1.1 billion people have moved out of extreme poverty since 1990. In 2015, 736 million people lived on less than US$1.90 a day, down from 1.9 billion in 1990 (11). These advances have been driven largely by progress in East Asia (China) and the Pacific (Indonesia) as well as South Asia (India), with only modest progress in Sub-Saharan Africa, where most people in absolute poverty now live. This admittedly unequal escape from poverty (Reference Deaton1) has been accompanied by unparalleled advances in public health, health care, education, human rights legislation, and technological development that have brought great benefits to multitudes of people.
The second half of the twentieth and early twenty-first centuries brought many advances in public health and health care. Immunization coverage against common infectious diseases expanded, promoted by the World Health Organization (WHO) Expanded Programme on Immunization from 1974. Primary health care workers delivered a growing stock of effective treatments such as oral rehydration therapy for diarrhoeal diseases. Advances in contraceptive technology and availability, and improvements in the education of girls (in some countries), helped to lower fertility, thus reducing the risks of pregnancy and childbirth. Again there is no consistent relationship between economic growth and improvements in health indicators such as infant mortality. The relatively recent declines in infectious diseases such as HIV/AIDS, malaria, and tuberculosis reflect effective disease control measures together with investments in research and health care more than they reflect Gross Domestic Product. In high-income countries declines in non-communicable disease mortality (including ischaemic heart disease, stroke, and some types of cancer) reflect declines in smoking and improved prevention and treatment, particularly in primary care settings. The epidemiological transition in many low- and middle-income countries (LMICs), with its growing burden of non-communicable disease, is partly due to declines in infectious disease mortality (Reference Omran12). Pathways linking communicable and non-communicable diseases and the environment are discussed in Chapter 2.
In summary, humanity has benefitted greatly, although inequitably, from advances in the past two to three centuries. But these benefits have come at a cost, which has been borne particularly by the Earth’s natural systems.
A Changing Planet
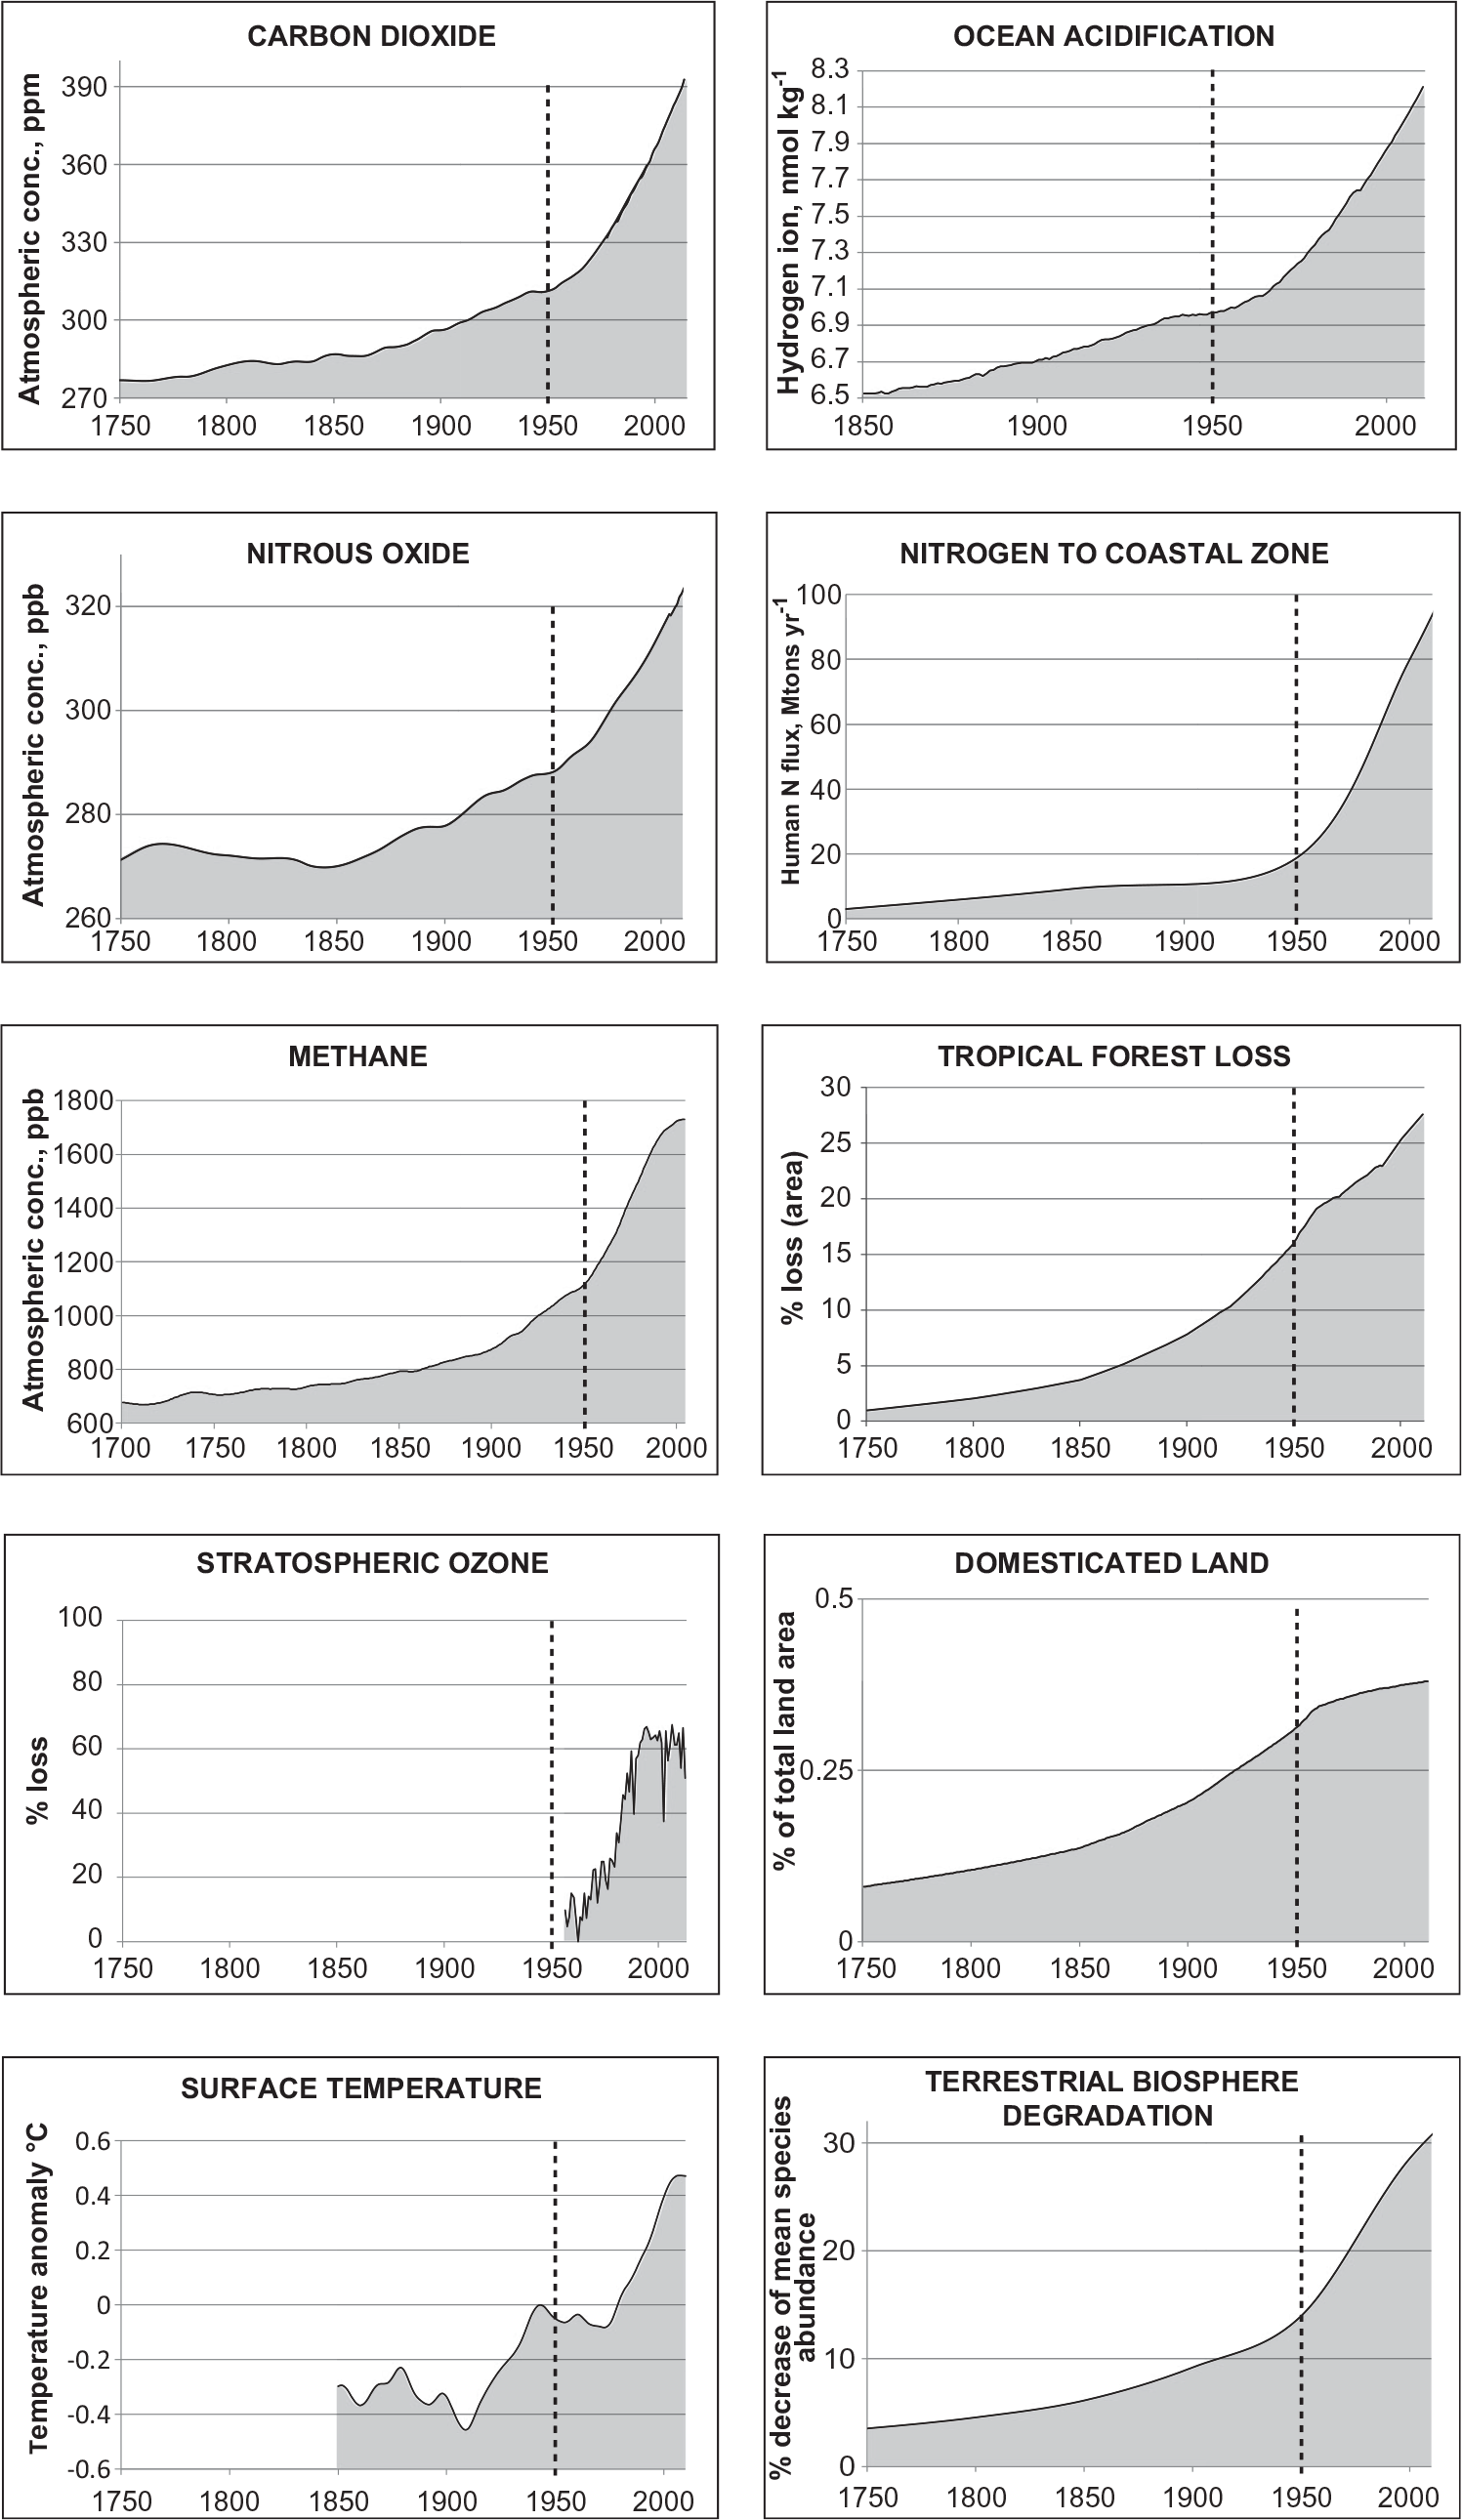
The growing human presence on Earth, depicted in Figure 1.1, is associated with another set of changes, shown in Figure 1.2. These are changes to Earth systems; systems that are so intrinsic to the Earth’s balance of energy and cycling of materials that they can be likened to an organism’s metabolism, and the indicators in Figure 1.2 to rapid changes in vital signs.
Earth system trends in the Great Acceleration. These indicators can be thought of as the planet’s vital signs. All show significant and rapid changes as part of the Great Acceleration, especially since the mid-twentieth century.
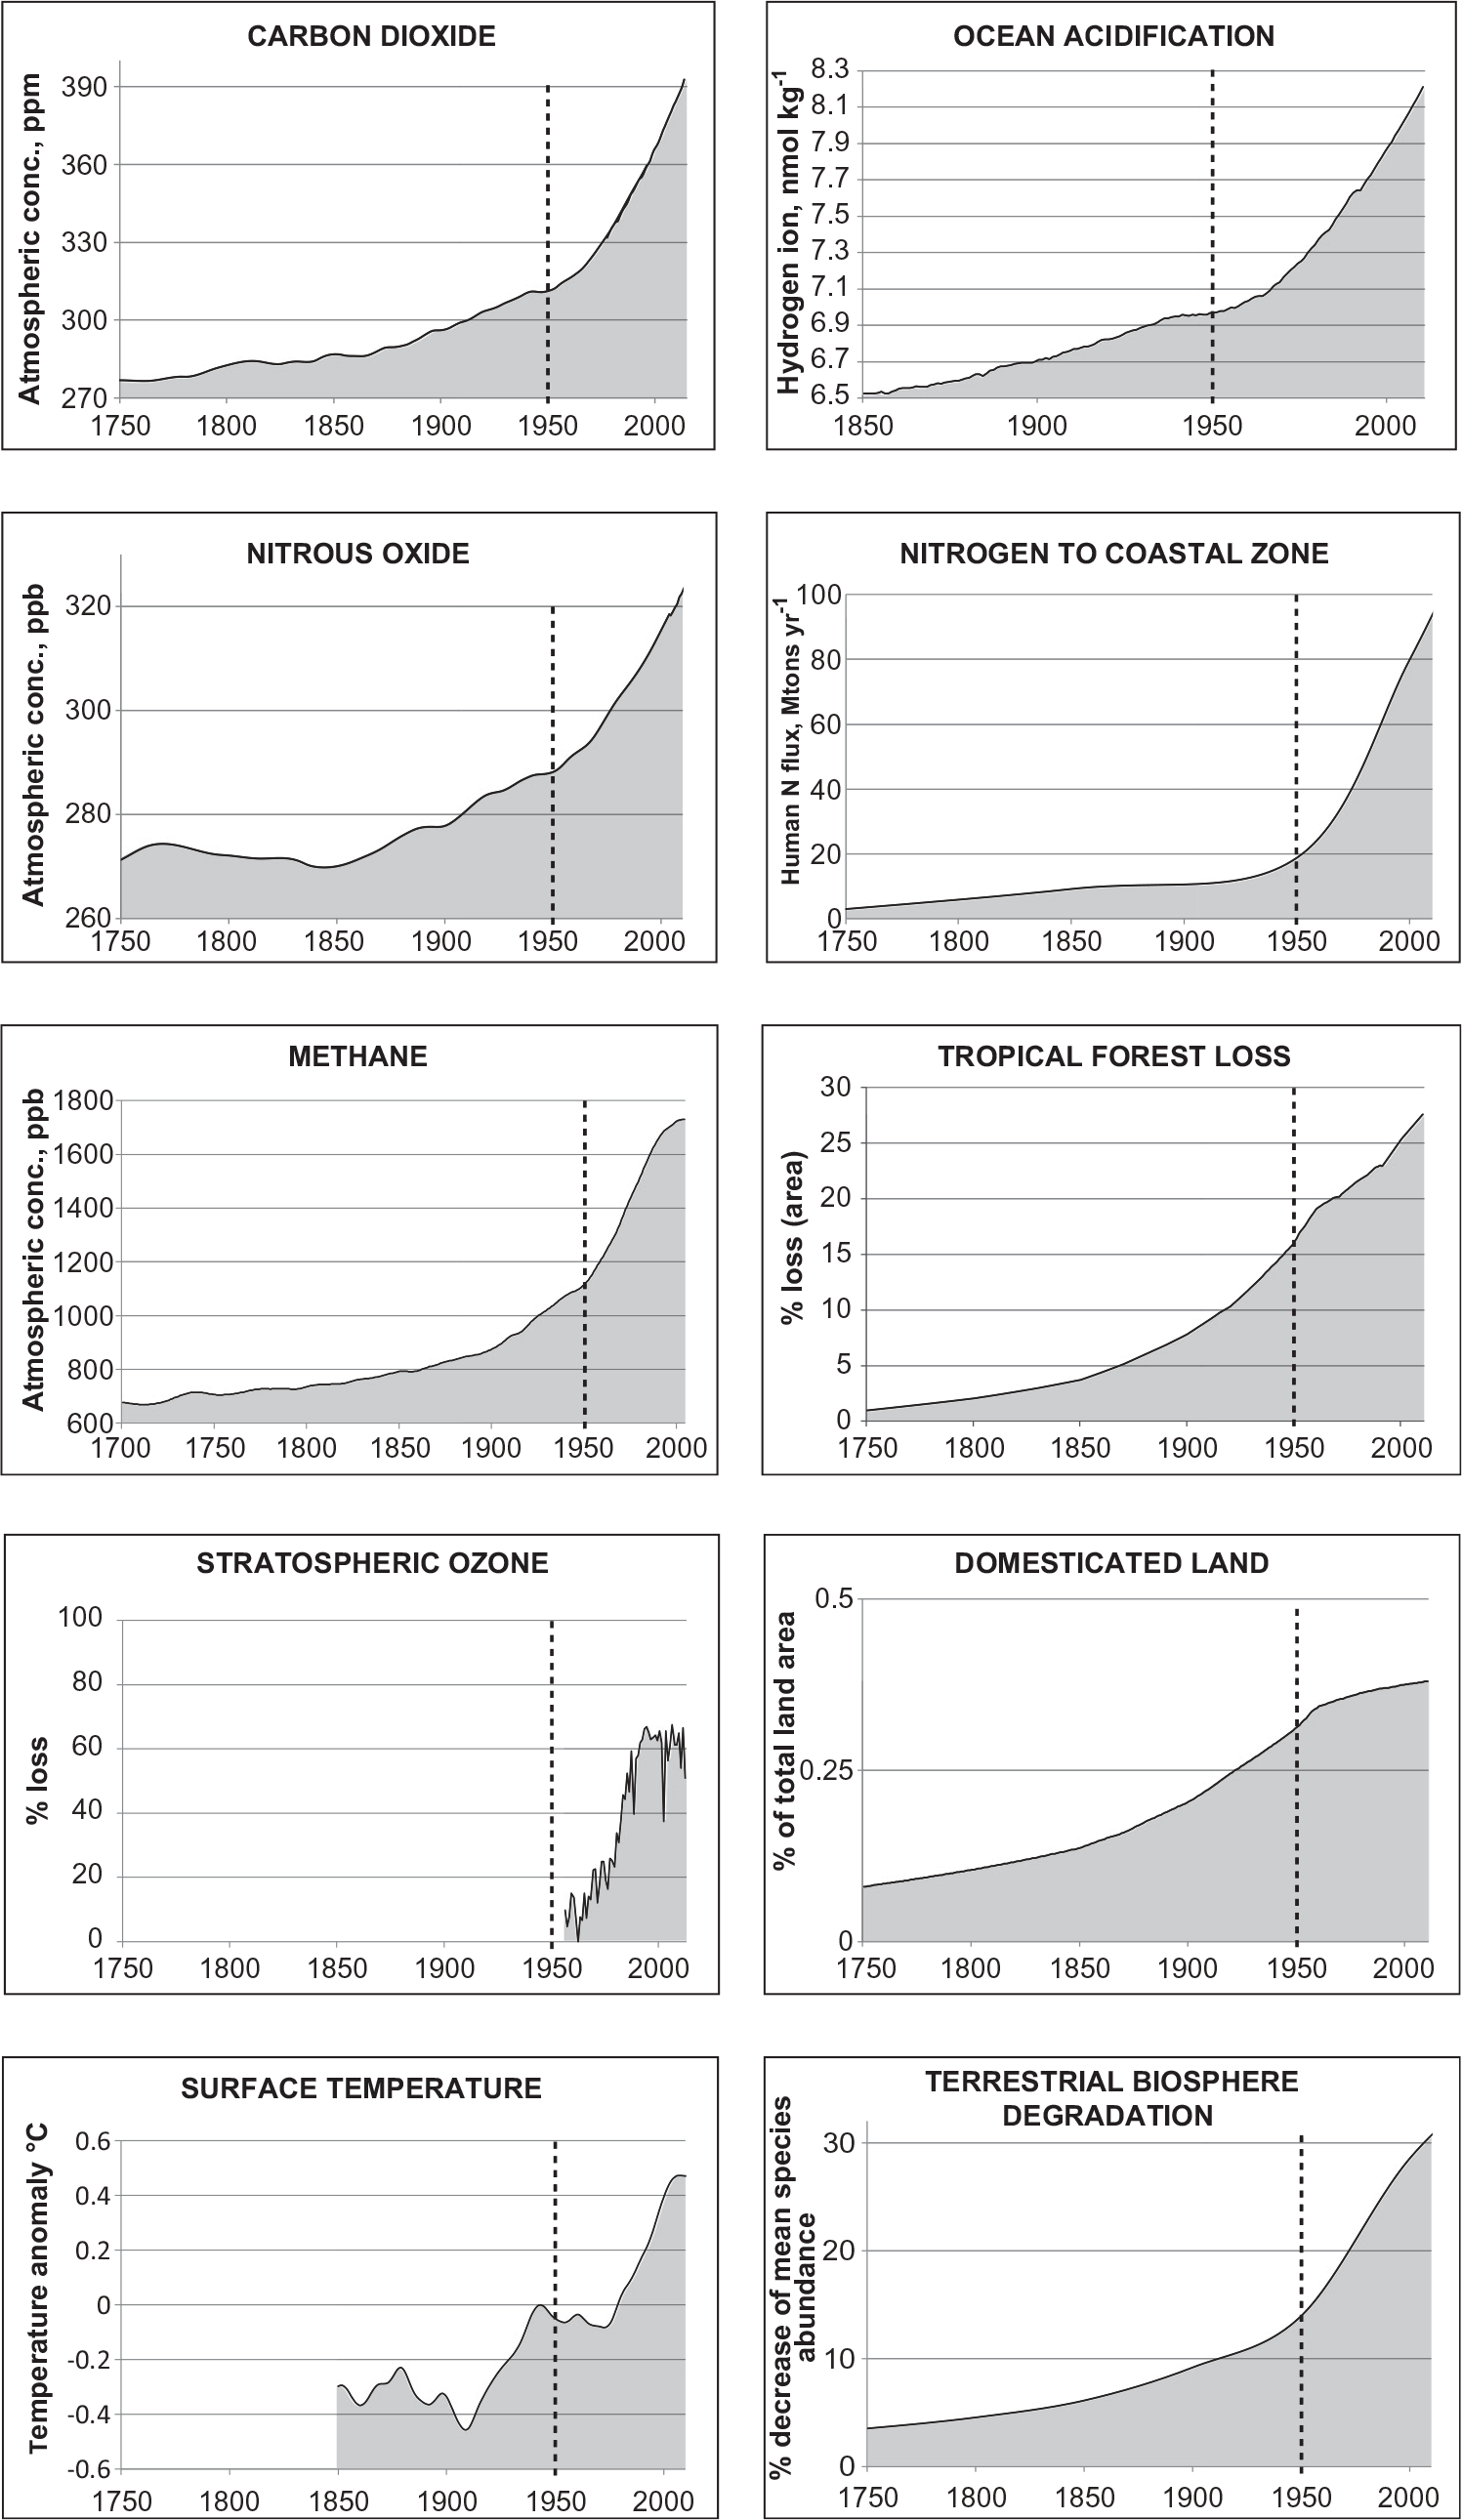
Geological epochs ordinarily persist for millions of years but contemporary planetary changes are so rapid and far-reaching that they demarcated a new geological epoch less than 12,000 years into the Holocene. Nobel laureate Paul Crutzen, a Dutch atmospheric chemist, proposed the term Anthropocene to describe these dramatic changes (Reference Crutzen13). The transition of a geological epoch is marked by a detectable global signal in fossils, rock, or both, such as the layer of iridium in sediments around the world from 66 million years ago, when a meteorite collided with Earth, wiped out the dinosaurs, and ended the Cretaceous Epoch. Scientists have debated the starting point of the Anthropocene. Crutzen pointed to the early nineteenth century when, during the industrial revolution, large-scale fossil fuel (especially coal) combustion initiated the rise of the atmospheric carbon dioxide concentration from 284 parts per million (ppm), the Holocene maximum (Reference Crutzen and Steffen14). (The level is now well above 400 ppm and rising.) Others have suggested inflection points as early as the European conquest of the Americas (because the demographic collapse of Amerindian populations from infectious disease, war, and forced labour left enduring traces in the geosphere and biosphere (Reference Lewis and Maslin15, Reference Lewis and Maslin16)), or even earlier, back at the dawn of human agriculture. Other commentators have proposed that the point of inflection is as recent as the mid-twentieth century (when multiple changes in the nitrogen, phosphorus, and carbon cycles were observed, and when nuclear weapons testing left indelible traces) (Reference Zalasiewicz, Waters and Williams17). Irrespective of the starting point of the Anthropocene Epoch, it is clear that profound changes in Earth systems are underway, and that they have significance not only for those of us alive today, but on geological timescales. A brief summary follows; the Rockefeller Foundation–Lancet Commission report (Reference Whitmee, Haines and Beyrer18) provides a more complete discussion of trends and primary data sources.
Land use changes and soil degradation (Reference Whitmee, Haines and Beyrer18, 19): About one-third of the Earth’s ice-free and desert-free land surface has been converted to cropland or pasture and 2.3 million km2 of primary forest have been cut down since 2000, particularly in tropical regions. (In temperate regions much of the extensive deforestation occurred historically and in some places reforestation is occurring.) Roads are being built throughout the world’s remaining forests, and habitats are being fragmented – so much so that, by one estimate, 70% of remaining forest is within 1 km of a forest edge (Reference Haddad, Brudvig and Clobert20). In addition, urbanized land is expanding in both large and small–medium conurbations around the world, much of it in prime locations such as along rivers where it replaces cultivated farmland or natural vegetation (Reference Güneralp, Reba, Hales, Wentz and Seto21). Soil degradation, which renders land unfit for cultivation, affects about 1–2.9 million hectares (10,000–29,000 km2) of agricultural land annually, with some estimates suggesting much larger affected areas. This also reduces soil carbon, increases susceptibility to flooding, and reduces soil microbial diversity. More than 50% of desertification is due to underlying soil degradation from human activities.
Biodiversity loss: Overall, biodiversity loss is occurring at vastly increased rates compared with pre-human times, amounting to as much as a 1000-fold increased rate of extinctions, which has not been equalled for 66 million years (Reference Pimm, Jenkins and Abell22). Species abundance of vertebrates declined by 58% between 1970 and 2012, with the largest recorded decline (81%) in freshwater systems. A recent census of biomass on Earth (Reference Bar-On, Phillips and Milo23) shows that the biomass of humans (0.06 gigatonnes of carbon, Gt C) is an order of magnitude greater than that of all wild mammals combined (≈ 0.007 Gt C), and the biomass of livestock exceeds them both (≈ 0.1 Gt C, dominated by cattle and pigs). This also applies to wild and domesticated birds, for which the biomass of domesticated poultry (≈ 0.005 Gt C, dominated by chickens) is about three-fold higher than that of wild birds (≈ 0.002 Gt C).
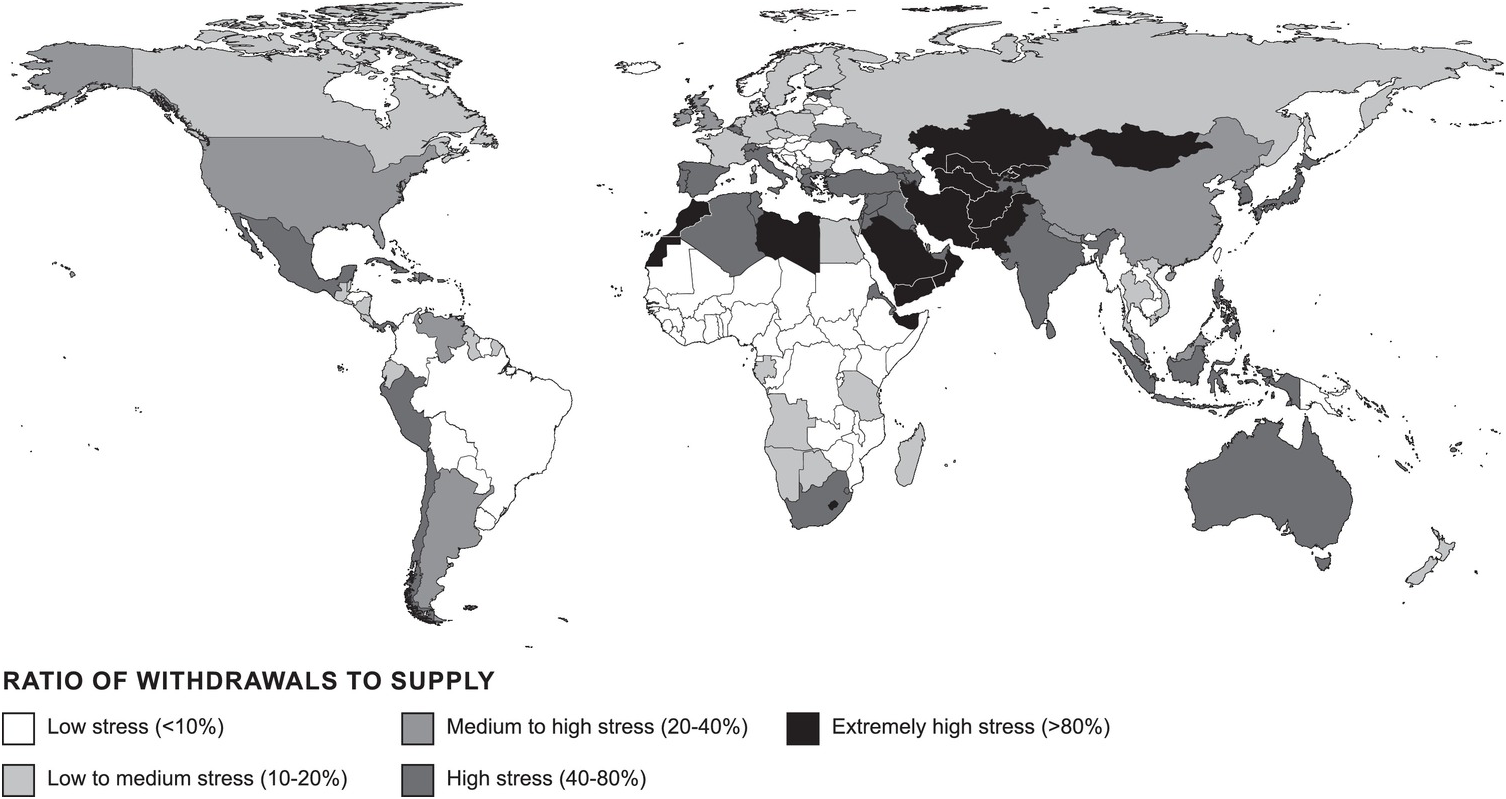
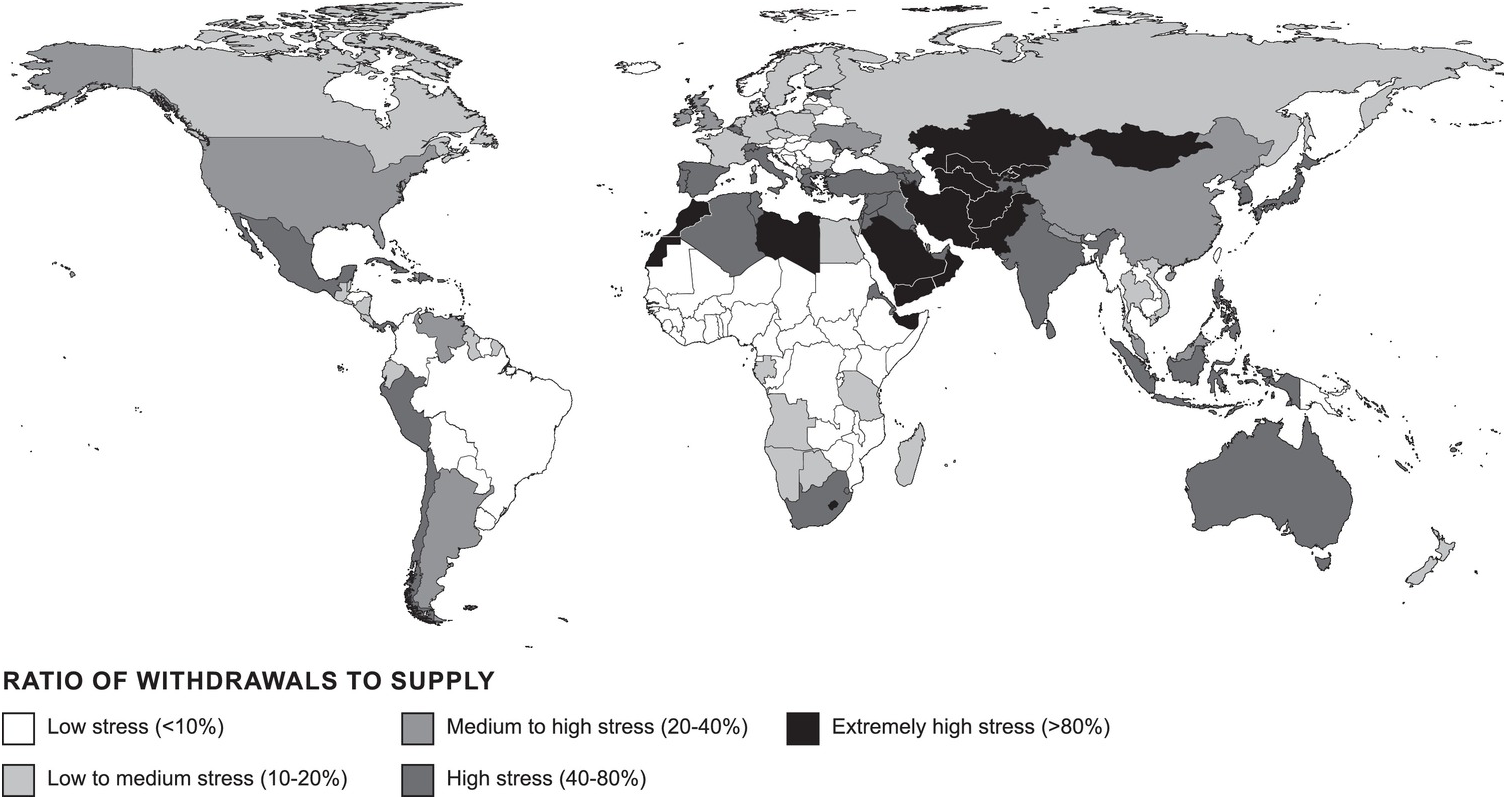
Freshwater appropriation: Humans exploit approximately 50% of all accessible freshwater annually. In the relentless search for energy and water for irrigation and other uses, over 60% of the world’s rivers have been dammed, amounting to more than 0.5 million km in total length, and many more dams are planned (Reference Zarfl, Lumsdon, Berlekamp, Tydecks and Tockner24). Aquifers, reserves of freshwater built up over millennia that cannot be replenished in the foreseeable future, are being depleted rapidly in many regions. For example, the Arab world has experienced a 75% decrease in per capita freshwater availability since 1962 and the total demand is 16% higher than available renewable freshwater resources. These trends imply that increasing numbers of countries will become water stressed over coming decades (Figure 1.3) with serious implications for the irrigation of crops, industrial production, and energy supply.
Projected water stress by country in 2040. These projections assume continued high greenhouse gas emissions (RCP8.5) and a ‘middle of the road’ development pathway that largely continues historical patterns (SSP2).
Changing oceans: Oceans too are subject to rapid and extensive pressures with about 90% of wild-catch fisheries fully or overexploited. According to the Food and Agriculture Organization (FAO) data, global fish catches peaked in 1996 and have declined slowly since, but independent estimates suggest a higher peak catch and subsequent faster decline, reflecting overfishing rather than reductions in catch to allow restocking of fish populations (Reference Pauly and Zeller25). The oceans act as a sink for both carbon dioxide and for increasing heat – reducing the rate of atmospheric warming – and as a result are undergoing profound changes. As carbon dioxide rises in the atmosphere and dissolves in seawater, the oceans become more acidic. The pH of ocean surface water has decreased by 0.1 since the beginning of the industrial era, equivalent to a 26% increase in hydrogen ion concentration (Reference Rhein, Rintoul, Aoki, Stocker, Qin and Plattner26). Increasing acidity has many, but still incompletely understood, implications for ecosystems and for humanity. It results in thinning of the shells of crustaceans as they find it more difficult to lay down calcium carbonate, and contributes to the degradation of coral reefs which are subject to multiple environmental stressors. Heating is contributing to coral bleaching (Reference Hughes, Anderson and Connolly27) and changing the distribution of fish stocks, resulting in movement of some fish species from equatorial to higher latitudes (Reference Frainer, Primicerio and Kortsch28). Many coastal ecosystems are also subject to high loading from nitrogen, phosphorus, and carbon run-off from agricultural land and sewage outflows, contributing to local acidification. In some cases these inflows lead to ‘dead zones’ where high levels of nutrients result in eutrophication, characterized by reduced oxygen levels, the growth of toxic algae, and loss of biodiversity (Reference Breitburg, Levin and Oschlies29).
Climate: Our changing climate is the most prominent and widely known transformation that confronts humanity in the Anthropocene Epoch. Climate change is due to the accumulation of greenhouse gases (GHGs) in the atmosphere driven by human activities, notably the burning of fossil fuels. (In general the term climate change is preferred to global warming because the effects are wider than just temperature increases and include changes in rainfall patterns and sea level rise. The term ‘climate change’ is being superseded by ‘climate crisis’ or ‘climate emergency’ in many non-technical publications because of the growing risks, and ‘global warming’ may be replaced by ‘global heating’ for similar reasons.) Carbon dioxide (CO2) is the most important GHG. According to the World Meteorological Organization (WMO) (30), the last time the Earth experienced a comparable atmospheric concentration of CO2 was 3 to 5 million years ago when global mean temperatures were 2 to 3 °C higher than today and sea level was 10 to 20 metres higher. The WMO concludes that the rate of increase of atmospheric CO2 over the past 70 years is nearly 100 times larger than that at the end of the last ice age and the abrupt changes in the atmosphere witnessed in the past 70 years are without precedent. Carbon dioxide persists for long periods in the atmosphere, with around 20% remaining for 1000 years or more – a troubling legacy for future generations. Short-lived climate pollutants (SLCPs) include methane, black carbon (a type of fine particle from incomplete burning of solid fuels), and hydrofluorocarbons, or HFCs (synthetic compounds used for several purposes including air conditioning, refrigerants, solvents; replacing the ozone-depleting chemicals chlorofluorocarbons, or CFCs). The SLCPs are important because reductions in emissions can deliver immediate reductions in climate forcing, in contrast to long-lived GHGs such as CO2, whose presence, and impact, will linger for centuries.
In 2015, at the annual conference of the United Nations Framework Convention on Climate Change (UNFCCC) in Paris, the nations of the world reached agreement to limit global heating to well under 2 °C global average temperature rise above pre-industrial levels (with the further aspiration to limit it to 1.5 °C) and pledged to set goals to reduce GHG emissions. While the Paris Agreement marked an important step forward, the Nationally Determined Contributions (NDCs) to which nations committed are, in the aggregate, insufficient to prevent warming exceeding 2 °C. Recent estimates (31) suggest that even if the NDCs are implemented (an unlikely outcome given current trends) the ensuing increase in global average temperature will reach around 3.2 °C.
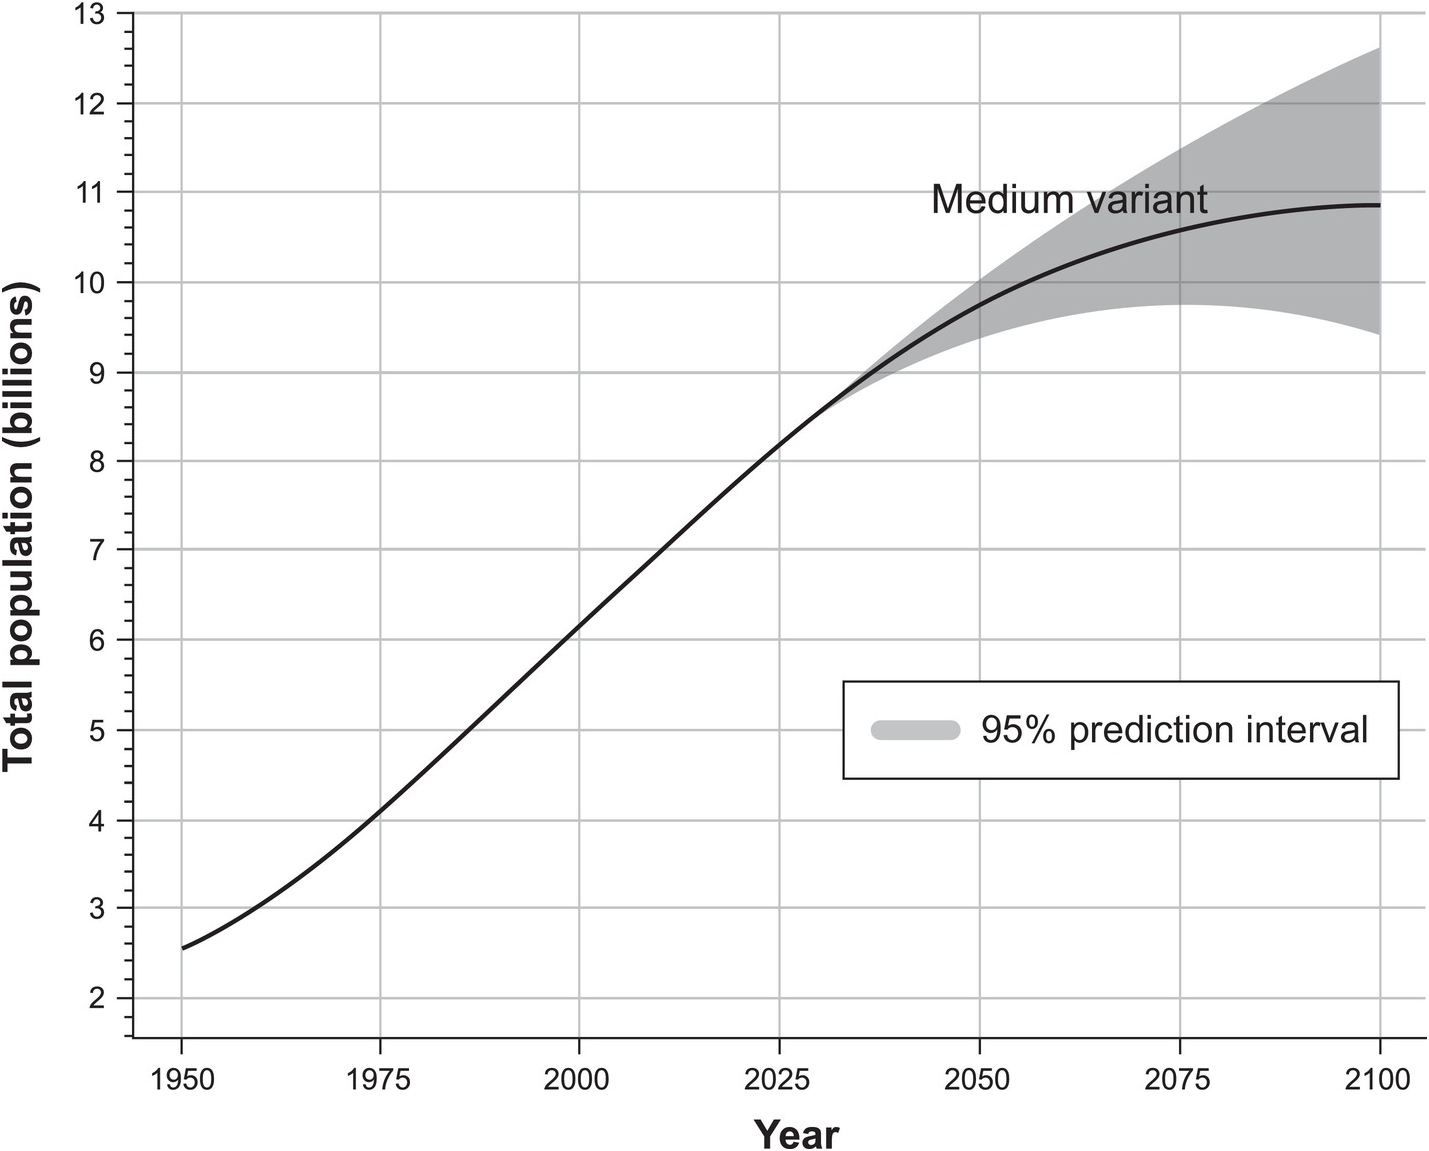
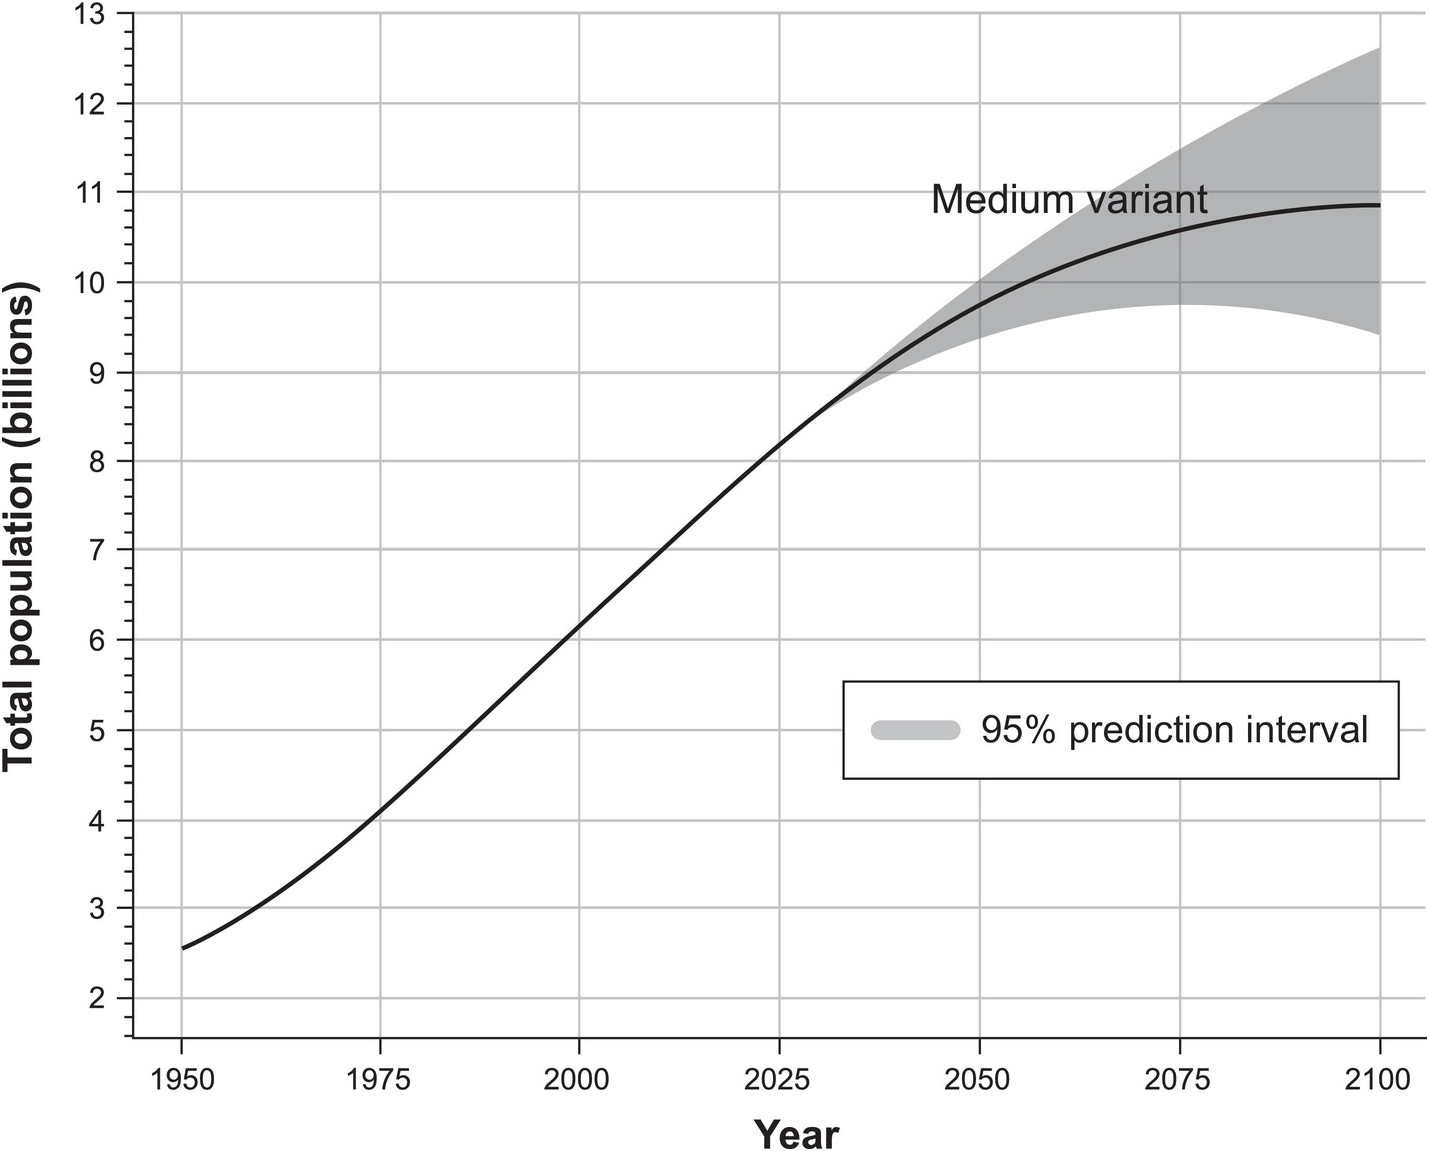
Consumption patterns and population growth: The human presence on Earth, unlike temperature, pH, and the other domains just discussed, is not a biophysical measure. But it underlies each of the other planetary changes. A key driver is human population growth (Figure 1.4). At the turn of the twentieth century, the human population was 1.6 billion. In 1950, shortly after the end of World War II, it was 2.5 billion. By 2000, it had reached 6.1 billion, and by 2020, it surpassed 7.7 billion (adding as many people in 20 years as had lived on the planet in 1900). According to UN mid-level projections (9), the global population will continue to grow, to about 8.5 billion in 2030, 9.7 billion in 2050, and 10.9 billion in 2100. Over half this growth will be in Sub-Saharan Africa and India, much of it in cities. (As discussed in Chapter 4 and shown in Figure 4.4, different assumptions about socioeconomic and population growth yield different planetary scenarios.)
Projected global population, in billions.
Importantly, population explains only part of humanity’s demands on planetary resources. The per capita use of these resources – mediated by affluence, technology, efficiency, and waste – is a major driving factor. Consumption varies widely, as reflected in differences in per capita CO2 emissions that may vary by over 100-fold between countries (32). Fifty years ago, biologist Paul Ehrlich and environmental scientist John P. Holdren expressed this idea in simple terms with the equation I = PAT, in which environmental impacts (I) are a function of population (P), the intensity of individual consumption patterns (A for affluence), and the technologies used to produce and consume (T) (Reference Ehrlich and Holdren33). Some critics have dismissed this equation as overly simplistic, because it omits such phenomena as interactions among the factors, environmental resilience, and tipping points. But it conveys a powerful point: that addressing both consumption and population is essential to addressing the challenges of the Anthropocene.
With the Great Acceleration, global prosperity has dramatically increased. In the half-century following World War II, the number of people living in extreme poverty began to decline for the first time in human history, while the number of people not in extreme poverty grew rapidly (Figure 1.5). Poverty is highly inequitably distributed geographically, as discussed below. But with billions of people emerging from poverty, seeking to eat more animal-source protein, fly to distant destinations, drive cars, utilize mobile phones, and store data, the combination of population and prosperity represents a phase change for the planet, with our collective footprint far exceeding the capacity of the planet to support us (Box 1.1).
Global population living in extreme poverty, 1820–2015. Extreme poverty is defined as living on less than US$1.90 in international dollars per day, adjusted for price differences among countries and for inflation over time.
Two useful concepts for considering humanity’s use of planetary resources are the ecological footprint and biocapacity. The ecological footprint measures the environmental resources a population requires to produce the goods and services it uses and to absorb its waste (including carbon emissions). Examples of what people need to produce goods and services include metal and stone, plant-based food and fibre products, livestock and fish, timber and other forest products, and space for urban infrastructure. These in turn are drawn from productive surface areas, six of which the ecological footprint tabulates: cropland, grazing land, fishing grounds, built-up land, forest area, and area needed to absorb CO2 emissions from energy use. Population size and affluence are the main drivers of environmental footprint, while urbanization, age distribution, and economic structure (a country’s position on the development continuum from extractive industries and manufacturing towards a service economy) have less effect (Reference Dietz, Rosa and York34).
While ecological footprint is a demand-side concept, reflecting human consumption patterns, biocapacity is a supply-side concept. Biocapacity measures nature’s ability to absorb our waste and generate new resources – to support us by providing ‘ecosystem services’. This corresponds to the productivity of ecological assets – cropland and forests. The biocapacity of a place can be enhanced or degraded, depending upon how it is managed.
Both ecological footprint and biocapacity are expressed in units of hectares, so they can be compared with each other. If a population’s ecological footprint exceeds the biocapacity of the region it inhabits, that population is not living within sustainable limits, and is said to run an ecological deficit. This requires importing from other regions, depleting the region’s ecological assets (e.g. overfishing), and/or emitting waste (e.g. CO2) into the atmosphere. If on the other hand a region’s biocapacity exceeds its ecological footprint, it is said to have an ecological reserve.
The biocapacity needed to produce the natural resources and services that humanity consumed in 2016 is equivalent to that provided by 1.7 planet Earths – a powerful testament to the unsustainable trajectory of current development pathways. As of 2020 human demand on the Earth’s ecosystems is estimated to exceed the regenerative capacity of nature by 75%.
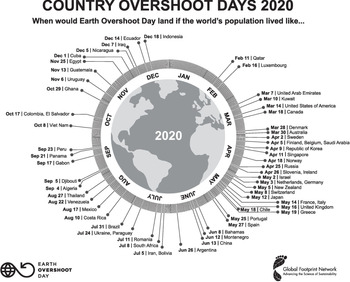
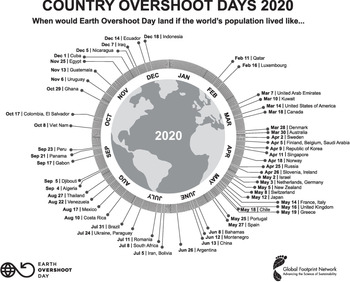
Still another way to express the idea of resource use relative to limits is to calculate a country’s ‘Overshoot Day’ – the day when its use of resources exceeds the amount it would use in one year if it were living within ecological limits (see Figure 1.8, below). A country that reaches Overshoot Day early in the year is using resources well in excess of what is sustainable, while a country that reaches Overshoot Day near the end of the year is living within its ecological means. There is also a global Overshot Day, which varies over time with global resource use. During the decade 2010–2019, that day varied within a few days of 3 August, but in 2020 it was delayed until 22 August by the COVID-19-related global economic slowdown. While the concept can be criticized on the grounds that it combines different impacts, it provides a readily understandable measure of sustainability as a single figure.
Sources:
Wackernagel M, Beyers B. Ecological Footprint: Managing Our Biocapacity Budget. Gabriola Island, BC: New Society Publishers; 2019.
Global Footprint Network. www.footprintnetwork.org/our-work/ecological-footprint.
Earth Overshot Day. www.overshootday.org/.
Great care is taken to ensure that scientific research is conducted under ethical principles including informed consent and minimization of risks. However, heedless disruptions of Earth systems are essentially multiple poorly regulated experiments at regional and global scales, the outcomes of which we are now beginning to experience. These ‘experiments’ are not seen as ‘research’ but as ‘development’, with the onus of regulating potentially damaging approaches falling on frequently inadequate systems of governance and accountability.
The advent of the Anthropocene Epoch marks a discontinuity in human history and complicates attempts to predict and project future trends in human development. The dramatic changes seen in the Earth’s vital signs raise the possibility that, in achieving (admittedly inequitable) socioeconomic advances for humanity, we have mortgaged the future. These trends challenge conventional thinking and point to the need to live within finite constraints of a small planet at a time of increasing demand for resources from an expanding world population. The first step towards that end is to define as far as possible the safe environmental limits within which humanity has a reasonable prospect of flourishing.
Planetary Boundaries
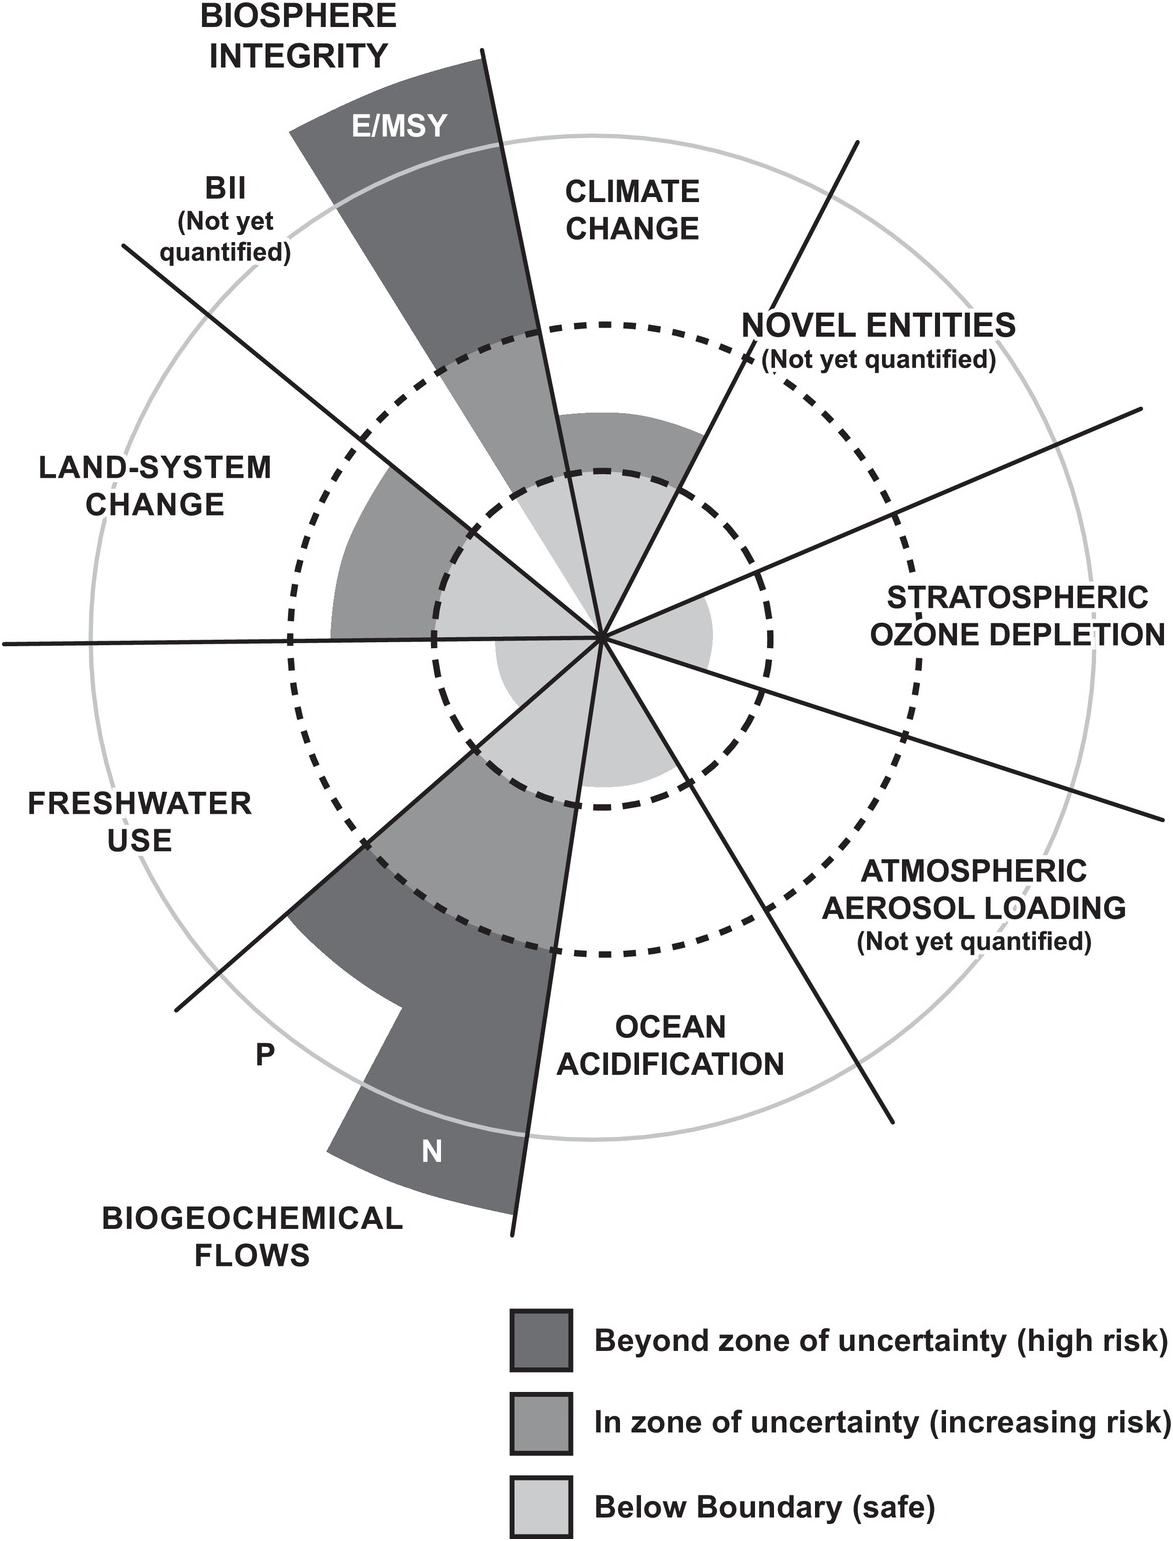
Growing understanding of the pervasive changes in Earth’s natural systems has led to attempts to define a safe operating space within which humanity can flourish. A team based at the Stockholm Resilience Institute proposed nine planetary boundaries in 2009 (Reference Rockström, Steffen and Noone35), and has continued to refine and improve the concept since then (Reference Steffen, Richardson and Rockström2) (Figure 1.6 and Table 1.1). The current concept proposes two core boundaries – climate and biosphere integrity – that cut across all the others, providing connections among them and operating at the level of the whole Earth system, having co-evolved over 4 billion years or so. They are both regulated by the other processes and provide a broad framework within which the other boundaries operate. Ecosystems (terrestrial, marine, and freshwater) and their biota, which constitute the biosphere, regulate the flows of energy and materials, thus determining the responses of the Earth system to changes in a range of processes.
Planetary boundaries. The nine processes shown in the diagram regulate the Earth’s stability and resilience. If humanity operates within boundaries for each domain, we can continue to develop and thrive for generations to come. But transgressing the boundaries – as has occurred with biosphere integrity and biogeochemical flows – increases the risk of large-scale abrupt or irreversible environmental changes.
Key: Under biosphere integrity, BII is the biodiversity intactness index, representing functional biodiversity, and E/MSY is extinctions per million species-years, representing genetic biodiversity. Novel entities are chemicals such as organic pollutants, radioactive materials, nanomaterials, and microplastics that are anthropogenic, generally persistent, and harmful.

Several aspects of the planetary boundaries are important. First, they are based on our evolving understanding of the conditions that allowed humanity to thrive over the course of the Holocene Epoch. Second, the various boundaries, and the driving forces that threaten to breach them, interact, reflecting the concept that the Earth is essentially a single integrated complex system. For example, climate change accelerates biodiversity loss because many species cannot adapt quickly enough to changes in temperature and precipitation, including by being unable to migrate quickly enough to keep pace with rapid changes. Similarly, ocean acidification depends directly on the level of CO2 in the atmosphere; there would be no risk of exceeding the boundary if CO2 levels had not exceeded 350 ppm. Third, different boundaries operate on different spatial scales – continental or global in some cases, regional or local in others. Some regional changes have global implications; for example, the saturation or degradation of regional carbon sinks (such as forests or wetlands) increases CO2 levels in the atmosphere and accelerates climate change. Fourth, while ‘control variables’ are proposed for each boundary, there are inevitable uncertainties about the exact quantification of boundaries. Nevertheless, there is value to the notion of quantitative boundaries, set at levels that account for uncertainties and that allow for inevitable lags in implementing protective policies before reaching dangerous tipping points (Box 1.2).
| Earth system process | Risk of exceeding boundary | Control variable(s) | Planetary boundary (zone of uncertainty) | Current status |
|---|---|---|---|---|
| Climate change | Loss of polar ice sheets. Regional climate disruptions. Loss of glacial freshwater supplies. Weakening of carbon sinks. | Atmospheric CO2 concentration, ppm Energy imbalance at top of atmosphere, W/m2 | 350 ppm CO2 (350–550 ppm) +1.0 W/m2 (+1.0–1.5 W/m2) | 415 ppm CO2 (2020) 2.3 W/m2 (1.1–3.3 W/m2) |
| Change in biosphere integrity (biodiversity) | Disrupted ecosystem functioning at continental and ocean basin scales. Impact on many other boundaries – C storage, freshwater, N and P cycles, land systems. | Genetic diversity: Extinction rate Functional diversity: Biodiversity Intactness Index (BII) | <10 E/MSY (10–100 E/MSY) with an aspirational goal of ~1 E/MSY (the background rate of extinction loss). | 100–1000 E/MSY |
| Maintain BII at 90% (90–30%) or above, assessed geographically by biomes/large regional areas (e.g. southern Africa), major marine ecosystems (e.g. coral reefs), or large functional groups. | 84%, analysed for southern Africa only. | |||
| Stratospheric ozone depletion | Severe and irreversible UV-B radiation effects on human health and ecosystems. | Stratospheric ozone concentration, DU | <5% reduction from pre-industrial level of 290 DU (5–10%). | Only transgressed over Antarctica in Austral spring (~200 DU); currently improving. |
| Atmospheric aerosol loading | Disruption of monsoon systems. Human health effects. Interacts with climate change and freshwater boundaries. | Global: AOD (but with much regional variation) Regional: AOD as a seasonal average over a region | Global: To be determined. Regional (South Asian Monsoon as a case study): AOD over Indian subcontinent of 0.25 (0.25–0.50), absorbing (warming) AOD <10% of total AOD. | 0.30 AOD over South Asia |
| Ocean acidification | Conversion of coral reefs to algal-dominated systems. Regional loss of some marine biota. | Carbonate ion concentration, Ωarag | Sustain ≥80% (≥80%– ≥70%) of the pre-industrial mean surface ocean Ωarag | ~84% of the pre-industrial aragonite saturation state |
| Biogeochemical flows (phosphorus and nitrogen cycles) | P: Oceanic anoxic events with impacts on marine ecosystems. N: Reduced resilience of ecosystems via acidification of terrestrial ecosystems and eutrophication of coastal and freshwater systems. | P global: P flows from freshwater systems into oceans P regional: P flows from fertilizers to erodible soils N global: industrial and intentional biological fixation of N | 11 Tg P/year (11–100 Tg P/year). 6.2 Tg P/year (6.2–11.2) mined and applied to erodible (agricultural) soils (global average that varies regionally). 62 (62–82) Tg N/year globally; regional distribution of fertilizer N is critical. | ~22 Tg P/year ~14 Tg P/year ~150 Tg N/year |
| Land-system change | Trigger of irreversible and widespread conversion of biomes to undesired states. Reduced carbon storage and resilience via changes in biodiversity and landscape heterogeneity. | Global: forested land area as percentage of original forested area Biome: forested land area as percentage of potential forest | Global: 75% (75–54) (a weighted average of tropical, boreal, and temperate forests) Biome-specific:
| 62% |
| Global freshwater use | Could affect regional climate patterns (e.g. monsoon behaviour) by affecting moisture feedback, biomass production, carbon uptake by terrestrial systems and reducing biodiversity. | Consumptive blue water use (km3/year) | Global: 4000 km3/year (4000–6000 km3/year) | ~2600 km3/year |
| Chemical pollution (‘Novel entities’ see Figure 1.6 above) | Thresholds leading to unacceptable impacts on human health and ecosystem function possible but largely unknown. | Emissions, concentrations, or effects on ecosystem and Earth system function of such entities as persistent organic pollutants (POPs), plastics, endocrine disruptors, heavy metals, and nuclear waste. | To be determined. |
Key: ppm: parts per million, W/m2: watts per square metre; E/MSY: extinctions per million species-years; DU: Dobson unit, defined as 0.01 mm thickness at standard temperature and pressure; AOD: aerosol optical depth; Ωarag: average global surface ocean aragonite saturation state. (Aragonite is a form of calcium carbonate formed by many marine organisms. Acidification lowers Ωarag; at Ωarag < 1, aragonite dissolves, threatening the integrity of these organisms.)
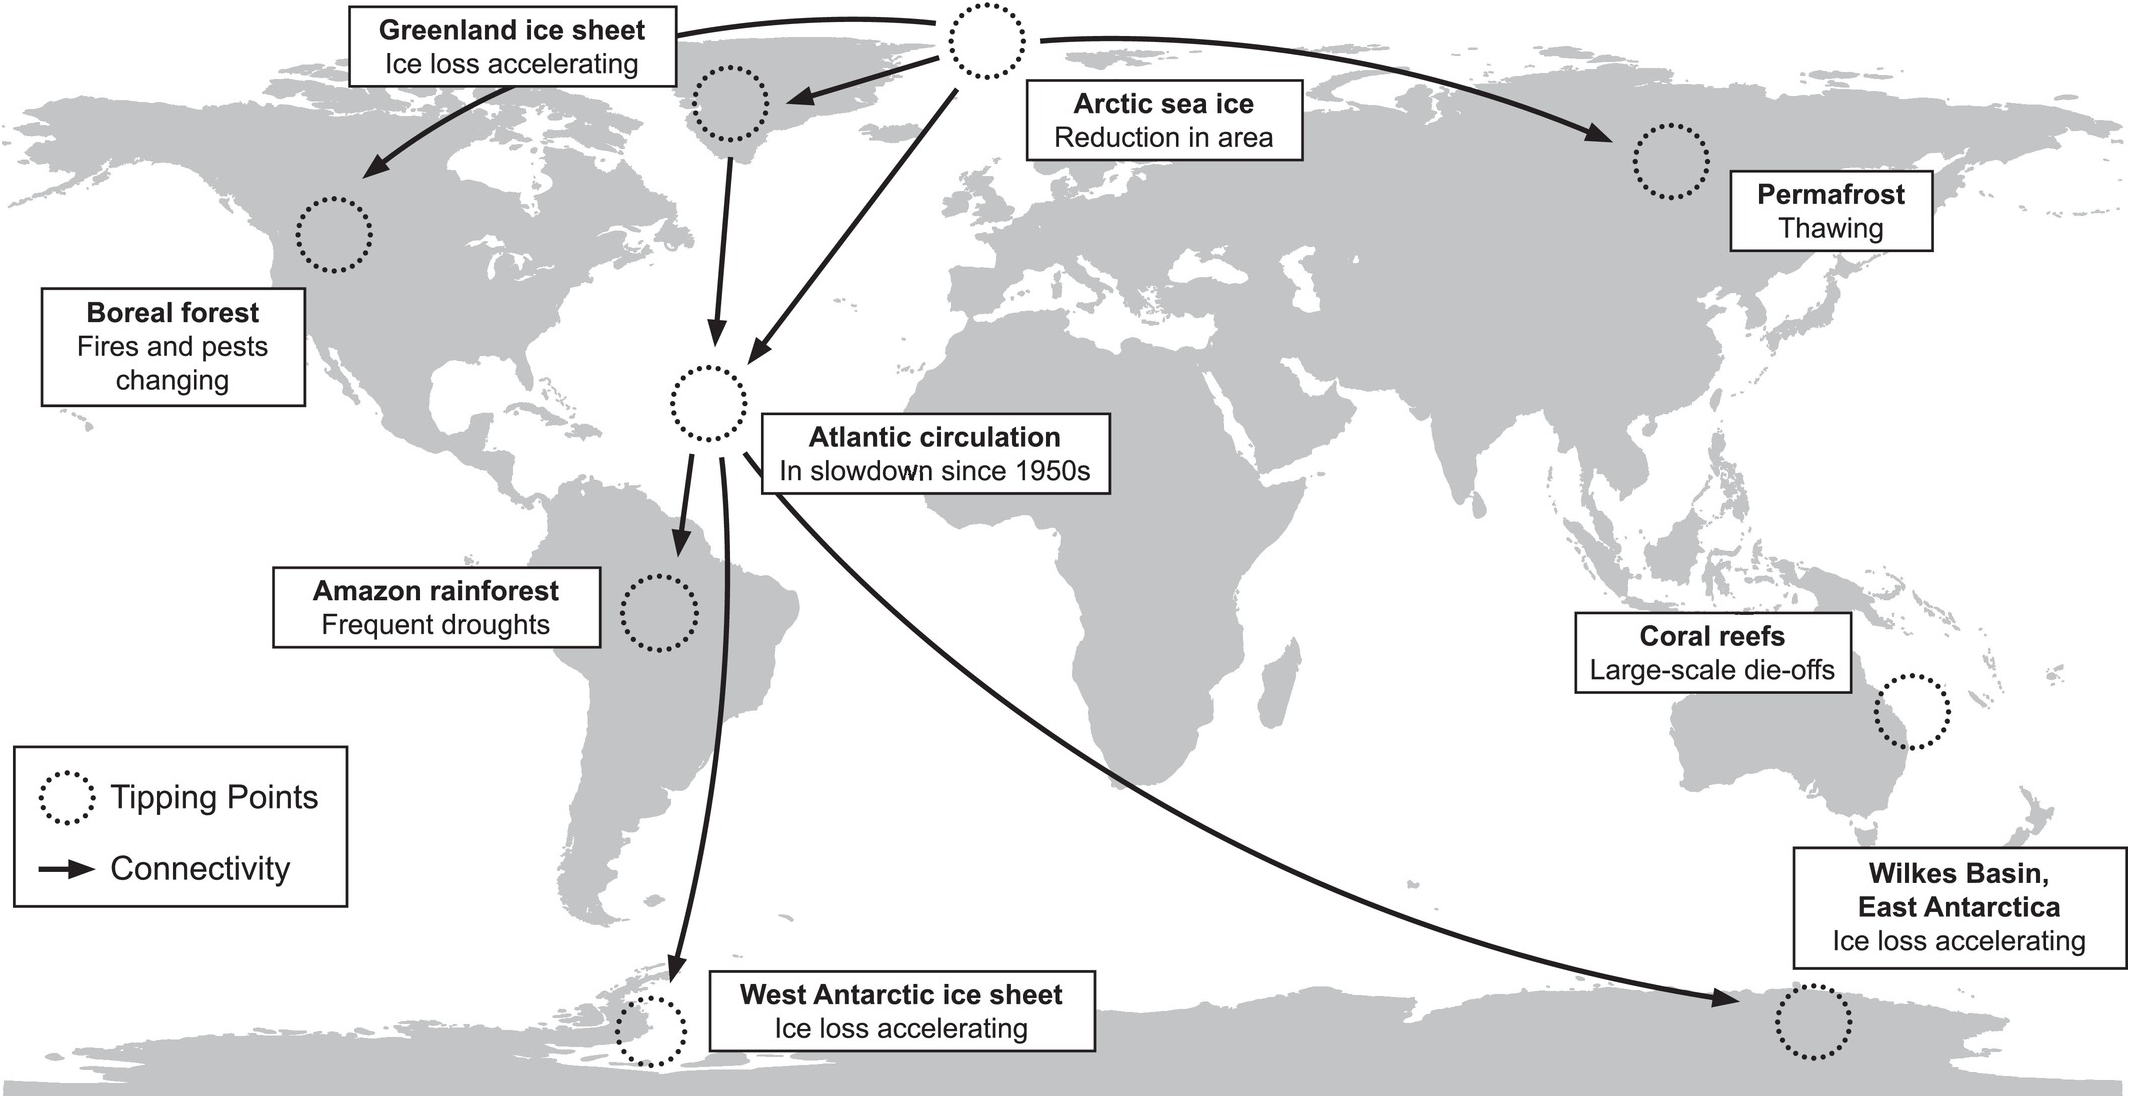
A tipping point in an Earth system is a point at which sudden, non-linear, shifts may occur, with high risk of adverse effects. Tipping points represent a sudden change from one state to another, which may be difficult or impossible to reverse and result in major reductions in ecosystem services important for human societies. Examples are collected by the Regime Shifts database (http://regimeshifts.org/) which also provides evidence that the shift has occurred and for the mechanisms behind the shift as well as the potential for reversibility. Some of these shifts are predominantly local phenomena but many are linked to underlying global processes – for example the move to an ice-free Arctic in summer months due to climate change, or coastal eutrophication from increased inflows of nitrogen and phosphorus, which leads to murky, high nutrient waters with lower oxygen levels and reduced biodiversity. Tipping points may cascade, meaning that one may trigger another (Reference Cai, Lenton and Lontzek36) (Figure 1.7). Because approaching tipping points leads to high risks of serious, and potentially catastrophic, consequences, sensible public policy entails a precautionary approach that aims to avoid reaching them (Reference Lenton, Rockström and Gaffney37).
Potential tipping cascades from climate change. Many planetary systems are subject to irreversible changes, or tipping points. Potential interactions among the tipping elements that could generate cascading domino effects are shown by arrows.

The climate boundary: There is a risk that, even at the 2 °C target of heating agreed in Paris, feedbacks could come into play which would amplify warming and set the Earth on a highly dangerous course (Reference Steffen, Rockström and Richardson38). These feedbacks can include permafrost thawing releasing methane, Amazon and boreal forest dieback and, most significantly, weakening of the carbon sinks on land and in the oceans leading to reduced ability to take up carbon. These feedbacks combined could lead to an estimated mean additional 0.47 °C (0.24–0.66) of heating (above that due to greenhouse gas emissions) by the end of the century and could become self-perpetuating. There is potential for both continuous change, e.g. melting of large masses of ice, and for sudden tipping points (Box 1.2). The number of abrupt shifts, particularly in terrestrial systems, is projected to increase in high GHG emission compared with low-emission scenarios (Reference Drijfhout, Bathiany and Beaulieu39). Cascading tipping points may occur at different levels of heating; irreversible changes to the Greenland and West Antarctic ice sheets, Arctic summer sea-ice, Alpine glaciers, and coral reefs may occur at 1–3 °C heating above pre-industrial levels (indeed, may be underway now), while tipping points in the great ocean currents, Amazon and boreal forests, the Sahel, Indian summer monsoons, and the El Niño Southern Oscillation are unlikely to occur until 3–5 °C warming is reached, and irreversible loss of Arctic winter sea-ice, Northern Hemisphere permafrost, and the East Antarctic ice sheet are unlikely until more than 5 °C warming has occurred (Reference Steffen, Rockström and Richardson38). The various tipping points are inter-related; for instance, collapse of ocean circulation would hasten loss of Antarctic ice, contributing to rising sea levels (Figure 1.7). The implication of this analysis is that we may approach a planetary threshold above which there are unacceptable risks of cascading effects even at temperature rises compatible with the Paris Agreement.
The biodiversity boundary reflects two key roles of the biosphere within the overall Earth system. The first is genetic diversity, which determines the capacity for further evolution to adapt to changing conditions, and the second is functional diversity, which is ‘the value, range, distribution and relative abundance of the functional traits of the organisms present in an ecosystem or biota’ (Reference Mace, Reyers and Alkemade40). The appropriate metric for genetic diversity would be phylogenetic species variability (PSV), the ‘information bank’ of genetic variability that represents the capacity for continued evolutionary adaptation. However, global PSV data are not available, so the metric of genetic diversity is the global extinction rate. This metric has serious limitations: our inadequate understanding of baseline extinction rates, the difficulty of measuring extinction rates across all taxa, and the time lag it entails. The target is set at ten extinctions per million species-years (E/MSY), a ten-fold increase over the presumed background rate (1 E/MSY) – a level that may or may not reflect a level of loss that can be sustained without significant irreversible damage to the Earth system. Ideally the extinction rate would be kept to the background rate. The metric of functional biodiversity is the Biodiversity Intactness Index (BII), which assesses population abundance across a wide range of key taxa or functional groups in a given biome or ecosystem, as a percentage of the pre-industrial abundance. The BII has only been applied to a few countries and there is much uncertainty (90–30%) about the appropriate boundary level, but the upper limit is suggested as the boundary to reduce risks.
Nitrogen and phosphorus cycling: Nitrogen and phosphorus are key elements in the biochemical cycles that support life – components of DNA and RNA, of the energy-carrier adenosine triphosphate (ATP), of proteins, and more. Both elements cycle through biotic and abiotic systems naturally, but human activities – principally the manufacturing and distribution of fertilizers – have distorted these cycles significantly and now dominate global N and P cycling (Reference Fowler, Coyle and Skiba41, Reference Yuan, Jiang and Sheng42). The run-off of fertilizer, human and animal waste, and other N and P sources into waterways can lead to overabundance of these nutrients – eutrophication – which in turn drives overgrowth of phytoplankton (cyanobacteria, dinoflagellates, and especially algae). As these organisms die and decompose, oxygen in the water is depleted, creating dead zones. Substantial dead zones are found in the Baltic and Black Seas, the Gulf of Mexico, the Bay of Bengal, the US Great Lakes, and numerous other coastal and inland waterways. Since the main contributions arise from a limited number of agricultural regions, redistribution from areas of excessive use to areas in which fertilizers are underused could increase global crop yield and prevent exceedance of N and P boundaries at the regional scale.
Land system changes: Of the many land types – forest, woodland, savannah, grassland, tundra, and so on – the focus of the land system boundary is forests, because of the critical impacts of forests on global climate. Forests help regulate climate through changes in albedo (reflectance of sunlight) and cooling from evapotranspiration, and act as carbon sinks. The boundary is set as a percentage of original forest cover remaining. Tropical and boreal forests play a more vital role than temperate forests in climate regulation, and are therefore disproportionately weighted in the land use boundary. Forest protection also plays a key role in biodiversity conservation and vice versa, such that if the BII boundary of 90% were respected, the achievement of the forest cover boundary would be assured.
Stratospheric ozone depletion is a qualified success story. The Montreal Protocol on the regulation of ozone-depleting substances such as chlorofluorocarbons (CFCs) has led to the progressive elimination of these substances with the aim of limiting the damage that they cause to the Earth’s ozone layer (Reference Gonzalez, Taddonio and Sherman43). The ozone layer in the stratosphere is a shield against damaging levels of ultraviolet radiation reaching the Earth’s surface. The Montreal Protocol was the first treaty in the history of the United Nations to achieve universal ratification, making it arguably the most successful environmental global action, one which was agreed in advance of incontrovertible proof of the cause of the ozone hole because of the consensus that it was wise to act in a precautionary manner. The sustained damage to the ozone layer is due to the long lifetimes in the atmosphere of ozone-depleting chemicals. Happily, recent evidence shows that during the first two decades of the present century there was a decline of about 0.8% annually in reactive chlorine species that are responsible for the ozone depletion (Reference Strahan and Douglass44). But recent evidence of illegal CFC emissions from eastern China reinforce the need for vigilance (Reference Rigby, Park and Saito45). This concern is further heightened by evidence that the Protocol’s success is being undermined by new, unexpected emissions, not only of several CFCs but also of carbon tetrachloride and hydrofluorocarbons (Reference Solomon, Alcamo and Ravishankara46). The latter were introduced as non-ozone-depleting replacements for CFCs but are potent greenhouse gases.
Atmospheric aerosol loading: Atmospheric aerosols represent a wide range of liquid, solid, or mixed particles, including particles that are directly emitted into the atmosphere and gaseous molecules that are converted into particulate-phase species. They derive from natural sources such as volcanoes and deserts, and from human activities such as fossil fuel combustion and agriculture (linking them closely to climate change). Chemically, atmospheric aerosols are divided into inorganic species (salts, metals), carbonaceous compounds, and water. There are direct human health impacts, including millions of deaths each year (see Chapter 2), as well as regional and global environmental impacts. The boundary for aerosol atmospheric loading is based on the regional impacts of aerosols on ocean–atmosphere circulation – specifically, on the threshold at which aerosol loading could cause the Indian monsoon to switch to a drier state, with potentially far-reaching effects on the regional economy and agricultural production.
Novel entities: Finally, the introduction of novel entities (i.e. new substances, new forms of existing substances, novel life forms) is proposed as a boundary because of the potential for unwanted effects on the environment and human health. The risks were exemplified by the introduction of CFCs, discussed above, which were thought to be unreactive but later found to be ozone-depleting. The releases of over 100,000 synthetic chemicals into the environment by the burgeoning global chemical industry, whose economic output rose from US$171 billion in 1970 to over US$5 trillion in 2019 (47), are likely to increase the risks of untoward events in future, but at present no global boundary can be defined. Major sources of chemical contamination include: pesticides from agricultural run-off; dioxins associated with combustion and electronics recycling; mercury and other heavy metals from mining and coal combustion; butyl tins, heavy metals, and asbestos released during ship-breaking; dyes, heavy metals, and other pollutants associated with textile production; toxic metals, solvents, polymers, and flame retardants used in electronics manufacturing and released during waste disposal; and drug or pharmaceutical pollution through excretion in urine and inadequate disposal (Reference Whitmee, Haines and Beyrer18, 47, Reference Landrigan, Fuller and Acosta48). Many of these sources may pose serious local threats to human health and the environment. In order for a chemical to pose a threat to the Earth system, three conditions need to be fulfilled, according to Persson et al. (Reference Persson, Breitholtz and Cousins49): (a) the chemical has a disruptive effect on a vital Earth system process; (b) the disruptive effect is not discovered until it is a problem at the global scale; and (c) the effect is not readily reversible. This approach highlights the central role of uncertainty in managing the risk of novel entities. When risks are uncertain but there is sufficient evidence to give grounds for concern (e.g. because of effects on reproductive performance of some species), precautionary actions may be taken to reduce risks (although these actions may be opposed by vested interests which can use the presence of uncertainty as a rationale for inaction). When little or nothing is known about the risks the challenge is to address gaps in knowledge. Because of the diversity of novel entities, their complex geographical spread, multiple interacting exposures, and the consequently major gaps in knowledge, accompanying often lax systems of regulation, this boundary is likely to be the most problematic in terms of defining appropriate metrics and credible boundaries. Ultimately it can most effectively be addressed through re-designing our economy based on careful regulation of toxic (and potentially toxic) substances together with the principles of circularity, including re-use, recycling and re-manufacturing, as outlined in Chapter 10.
Interactions among the key processes corresponding to planetary boundaries are more the norm than the exception, although much remains to be learned about them. As noted above, two of the boundaries – global climate and biodiversity – serve as cross-cutting constructs that interact with each other and integrate the interactive effects of the other seven. One example is the oceans. Carbon dioxide drives both climate change and ocean acidification. In addition, through varied oceanographic, ecological, and physiological processes, climate change exacerbates the hypoxic conditions that drive ocean dead zones. Warmer water holds less dissolved oxygen, and warmer surface waters amplify water column stratification, preventing more oxygenated surface waters from mixing with more hypoxic deep layers (Reference Altieri and Gedan50). Chemical contaminants offer another example. Climate-related meteorological factors such as temperature, wind speed, and precipitation increase the mobilization and transport of many environmental contaminants, including mercury, polycyclic aromatic hydrocarbons (PAHs), and other persistent organic pollutants (POPs) (Reference Obrist, Kirk and Zhang51, Reference Nadal, Marquès, Mari and Domingo52). And climate change is a principal threat to biosphere integrity, contributing to biomass reductions and species loss in settings ranging from fisheries to pollinators (Reference Barange, Bahri and Beveridge53, Reference Marshman, Blay-Palmer and Landman54).
As so much of our current economic system is based on ignorance of the biophysical limits within which humanity can flourish, the concept of finite limits is likely to be unwelcome to many and poses a serious threat to current paradigms of development. The challenge is amplified by the pronounced inequities in consumption, and thus environmental footprints, between and within countries, both historically and contemporaneously.
Inequities in Greenhouse Gas Emissions and Environmental Footprints
Countries vary greatly in their use of resources and in their emissions of GHGs (Reference Stocker, Qin and Plattner55), as do people at varying levels of prosperity within countries. In 2010 for example, median per capita emissions in high-income countries (13 tCO2eq/person/year) were almost ten times those in low-income countries (1.4 tCO2eq/person/year). Recent data from the Global Carbon Atlas show the dramatic differences even more starkly – from 38 tonnes/person/year for Qatar to less than 0.1 tonne for some Sub-Saharan African countries. This means that the carbon footprint of one Qatari is equivalent to those of over 380 citizens of Malawi or Chad, and highlights the importance of consumption patterns in global carbon emissions (32).
Within broad categories of countries there is considerable variability; per capita emissions in high-income countries range from 8.2 to 21 tCO2eq/person/year, for the (population weighted) 10th and 90th percentiles. Amongst low-income countries the average is pulled up (to 4.3 tCO2eq/person/year) by a very few countries with high emissions from land use change (Reference Stocker, Qin and Plattner55). While CO2 emissions from fossil fuel burning are fairly reliably quantified, methane emissions and emissions from land use change have greater uncertainty. About half of cumulative fossil fuel CO2 emissions to 2010 were from high-income economies (as designated by the Organisation for Economic Co-operation and Development, OECD), 20% from the economies in OECD’s ‘transition region’, 15% from the Asia region, and the remainder from Latin America, the Middle East, Africa, and international shipping. Thus, high-income countries have benefitted greatly from fossil fuel-derived energy which has powered their development and led to the advent of the consumer society.
Corresponding to the inequities in GHG emissions, there are pronounced inequalities in transgressions of other planetary boundaries. For example 33% of the world’s sustainable nitrogen budget is used to produce meat for people in the EU – just 7% of the world’s population (Reference Sutton, Oenema and Erisman56). Several studies have compared environmental footprints across countries (Reference Dietz, Rosa and York34, 57). Figure 1.8 shows results of such analysis, illustrating the dramatic differences between, say, Qatar and Vietnam. More than 80% of the world’s population lives in countries that are using more resources than can be supported by the Earth’s natural systems.
Overshoot Days. This diagram shows the day in the year on which the Earth would reach its sustainable limit if everyone consumed to the same extent as the population of the country in question. The only nations that can be said to be approaching sustainability are those whose Overshoot Days occur in the last few months of the year. However, even those countries that appear to be approaching sustainability face significant challenges. Indonesia, for example, has experienced extensive forest fires, including peat burning, and in 2016 ranked fifth in the world for coal production (www.worldometers.info/coal/indonesia-coal/).
Whilst population growth has clearly contributed importantly to increasing GHG emissions, the large gap in per capita emissions between the highest and lowest emitting nations reveals profound and sustained inequalities. The variation between countries shows that, at least in principle, some countries can achieve high levels of human development at substantially lower GHG emissions than others, although no high-income countries have yet achieved the very low emission levels required to meet or exceed the mitigation targets agreed in Paris.
Globalization, Development, and Changing Environmental Footprints
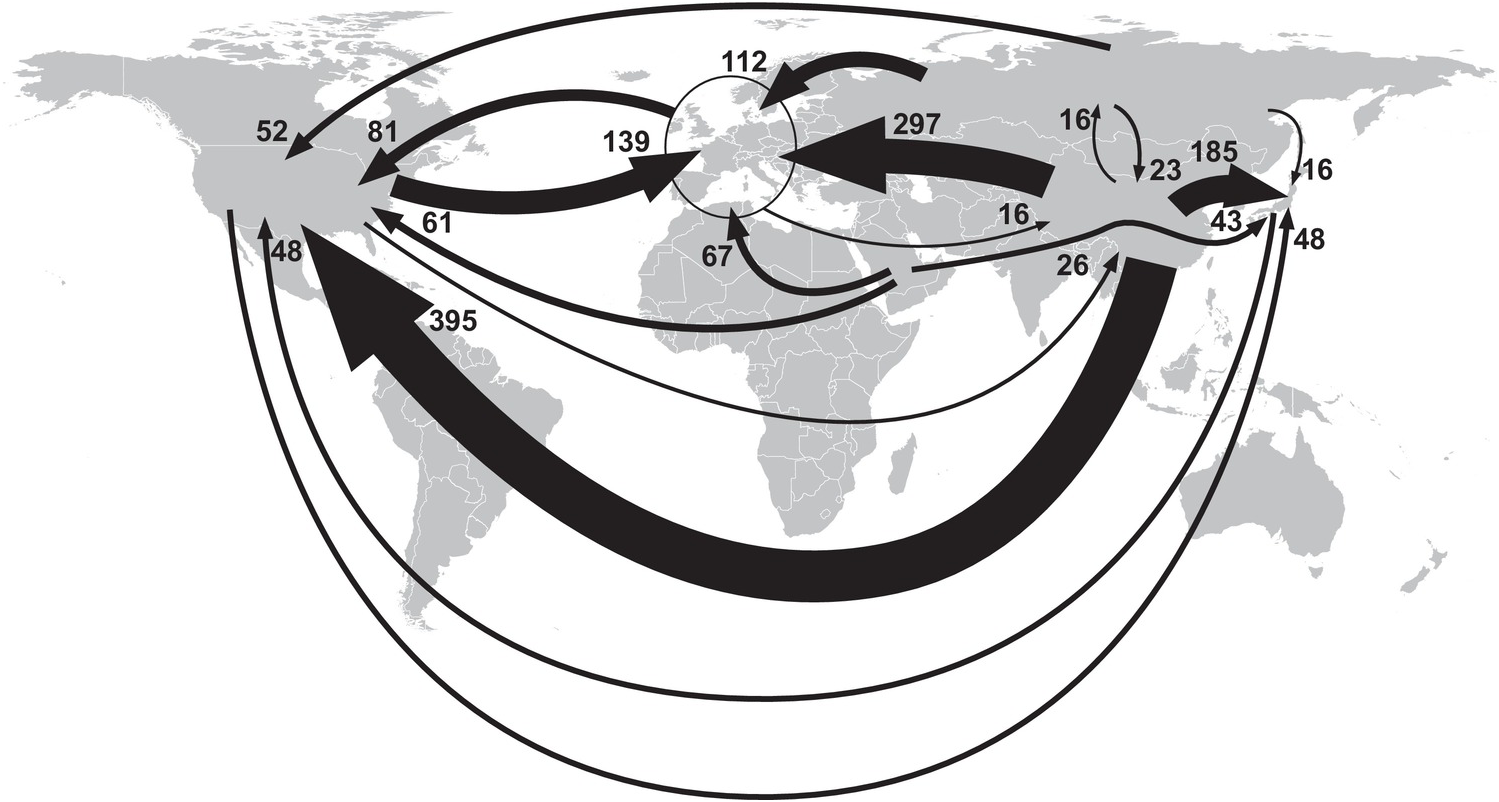
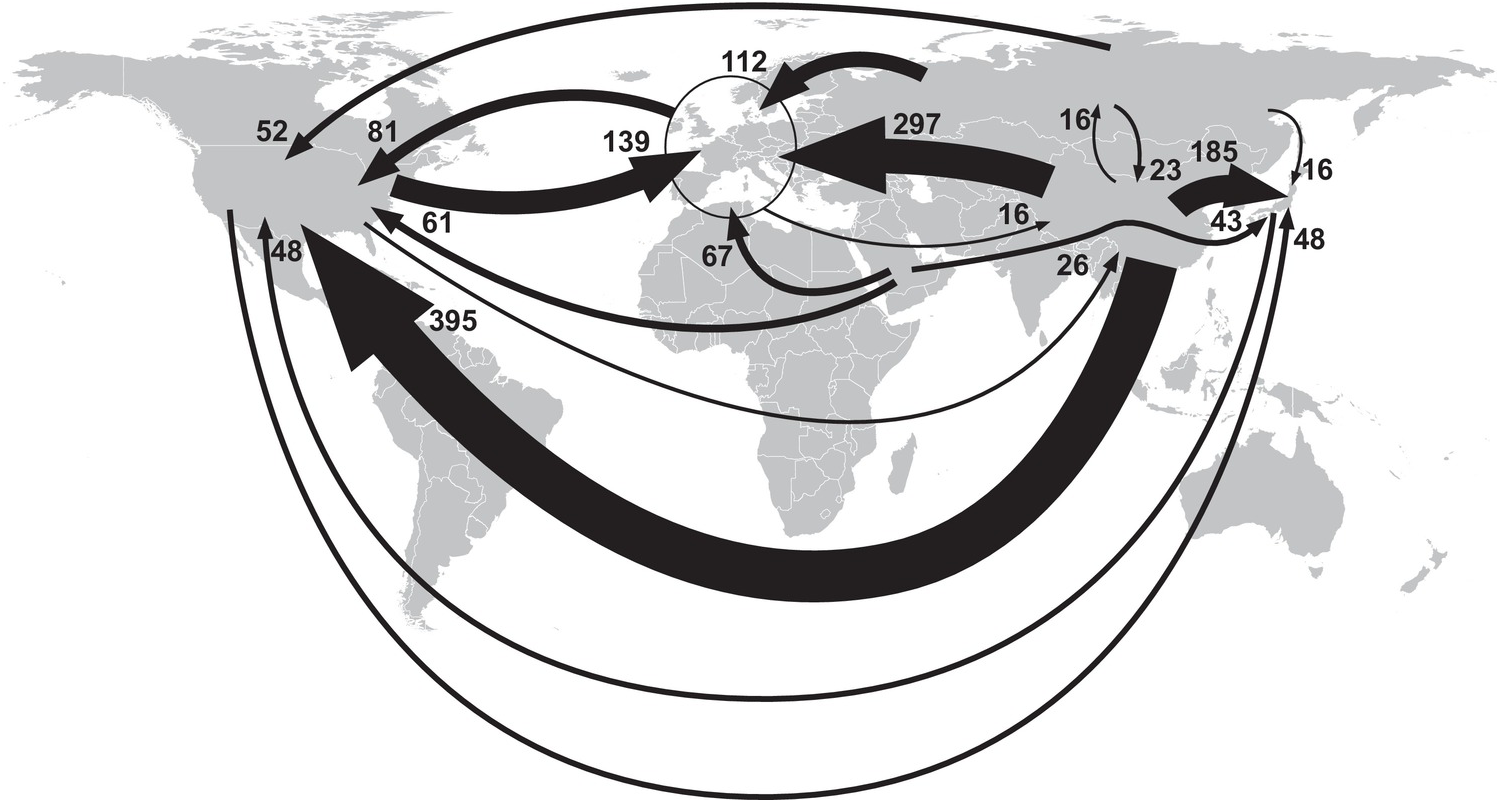
In recent decades, the movement of manufacturing to countries such as China has contributed to the plateauing, and in some cases decline, of energy-related GHG emissions in high-income countries. Climate negotiations focus on production-related rather than consumption-related emissions; however, when countries such as China produce goods for consumption in wealthy countries, the responsibility for associated CO2 emissions arguably lies with those who consume the goods produced. The concept of embodied emissions – emissions intrinsic to products that enter global trade – is therefore pertinent to a full understanding of national contributions to climate change (Reference Davis and Caldeira58) (Figure 1.9). According to one estimate of the supply chain of global CO2 emissions, 37% of global emissions are from fossil fuels traded internationally and 23% of global emissions are embodied in traded goods (Reference Davis, Peters and Caldeira59).
Major inter-regional fluxes of emissions embodied in trade (Mt CO2/year) from dominant net exporting countries to dominant net importing countries. Countries of Western Europe are aggregated. The largest flux is embodied in the flow of manufactured goods from China to the USA.
That said, GHG emissions in LMICs are growing substantially as rising prosperity alters consumption patterns. Global growth in GHG emissions is increasingly driven by the energy and industry sectors in upper-middle-income countries which, according to the IPCC, accounted for 60% of the rise in global GHG emissions between 2000 and 2010. Despite a global trend away from coal use, new coal-fired power plants are planned or under construction in China, India, Vietnam, Indonesia, Bangladesh, South Africa, Egypt, the Philippines, Pakistan, and Zimbabwe (Reference Shearer, Mathew-Shah, Myllyvirta, Yu and Nace60) – a process that has been called ‘carbonization’ (Reference Steckel, Hilaire, Jakob and Edenhofer61). Animal product (meat and dairy) consumption is rising rapidly in many LMICs (with the possible exception of India), a function of shifts in dietary preferences with growing prosperity and urbanization (Reference Zhai, Du and Wang62). Rapid urbanization, especially in Africa and Asia, has been accompanied by dramatic increases in private car and truck traffic, often consisting of poorly maintained, ageing vehicles that emit high levels of GHGs as well as other air pollutants (Reference Kutzbach63, Reference Doumbia, Toure and Silue64). Overall, the increase in fossil fuel CO2 emissions between 1970 and 2010 can be attributed to changes in population (+87%), per capita GDP adjusted for Purchasing Power Parity (PPP) (+103%), energy intensity of GDP (−35%) and CO2 intensity of energy (−15%). The increases in per capita production and consumption are major drivers worldwide of rising GHG emissions and increases in both energy efficiency and decarbonization have not been sufficient to offset the effects of GDP growth.
The Roots of the Anthropocene
How did we arrive at this point? How did the trajectory of humanity diverge so drastically from the constraints of the natural world?
Human separation from nature has a long history, at least in Western culture. In ancient Greece, some thinkers abstracted human learning from nature. In the Platonic dialogue Phaedrus, Socrates finds himself strolling outside the city walls, and grumbles to his companion, ‘I’m a lover of learning, and trees and open country won’t teach me anything, whereas men in town do’ (Reference Hamilton and Cairns65, p. 479). Even earlier, the book of Genesis included the well-known divine mandate, ‘Be fertile and multiply. Fill the land and conquer it. Dominate the fish of the sea, the birds of the sky, and every beast that walks the land.’ (Some contemporary thinkers have imputed a gentler meaning to this passage, emphasizing stewardship rather than conquest – but the long-standing standard interpretation speaks volumes about conventional attitudes.) Modern economies often evolved with little thought of protecting nature, the ultimate source of food, raw materials and energy, or reducing hazardous waste and pollution, ignoring them altogether or classifying them at best as externalities. These externalities can be difficult to quantify and even when they can be costed they are often not reflected in the current prices we pay for consumer goods or energy. This failure to internalize true costs forfeits opportunities to prevent ongoing irreversible damage to planetary life-support systems.
There is perhaps no more chilling illustration of this callous and even brutal attitude toward the natural world than these words from French political theorist Henri de Saint-Simon (1760–1825):
The object of industry is the exploitation of the globe, that is to say, the appropriation of its products for the needs of man; and by accomplishing this task, it modifies the globe and transforms it, gradually changing the conditions of its existence… From this point of view, Industry becomes religion.
But there were opposing views too, embedding humanity within the fabric of nature. This world-view had long characterized indigenous cultures (Reference Gomez-Baggethun, Corbera and Reyes-Garcia68). It has emerged with regularity in Western culture, from the New England transcendentalists to the British and German Romantic painters of the eighteenth and nineteenth centuries. As a scientific framework, the interdependence of humans and the natural world was foreshadowed by such writers as John Muir, George Perkins Marsh, and Aldo Leopold. The rise of evolutionary biology in the nineteenth and twentieth centuries made clear that humans were subject to a complex framework of natural laws, and the rise of ecology as a scientific discipline in the twentieth century provided much empirical evidence.
With the Anthropocene, a third approach has emerged – humans not as exploiters of the natural world, nor as citizens of the natural world, but as managers of the natural world. In some cases, fear of the future is replaced by the hubris of audacious schemes – giant mirrors in space orbit, stratospheric sulfate particles to reflect sunlight back into space, ocean fertilization with iron to stimulate CO2-absorbing algae. Such schemes are represented as planetary rescue plans, despite profound questions of safety, governance, and ethics, and the possibility that such efforts will distract from or undermine efforts to achieve sustainable practices (Reference Hamilton69).
What is clear is that humanity did not stumble completely unaware or unwittingly into the Anthropocene. The basic principles of global heating have been clear for well over a century. In 1857, French lawyer and scientist Eugène Huzar, observing the explosive growth of technology powered by fossil fuels, wrote:
In one or two hundred years, criss-crossed by railways and steamships, covered with factories and workshops, the world will emit billions of cubic meters of carbonic acid and carbon oxide, and, since the forests will have been destroyed, these hundreds of billions of carbonic acid and carbon oxide may indeed disturb the harmony of the world.
In 1896, Swedish scientist Svante Arrhenius calculated the effect of a doubling of atmospheric CO2 on Earth’s surface temperature, with estimates that proved prescient. The problem was not a novel one; ‘A great deal has been written,’ Arrhenius noted in his paper, ‘on the influence of the absorption of the atmosphere upon the climate’ (Reference Arrhenius71). In the 1930s, British steam engineer Guy Callendar collected several decades of temperature and CO2 measurements, and concluded that global heating was underway. He wrote:
Few of those familiar with the natural heat exchanges of the atmosphere, which go into the making of our climates and weather, would be prepared to admit that the activities of man could have any influence upon phenomena of so vast a scale. In the following paper I hope to show that such influence is not only possible, but is actually occurring at the present time.
In 1957, Roger Revelle and Hans Suess of the Scripps Institution correctly suggested: ‘… human beings are now carrying out a large scale geophysical experiment… Within a few centuries we are returning to the atmosphere and oceans the concentrated organic carbon stored in the sedimentary rocks over hundreds of millions of years’ (Reference Revelle and Suess73). Nor were such observations confined to arcane scientific journals. Bonneuil and Fressoz, in The Shock of the Anthropocene, show that the significance of the Great Acceleration was widely appreciated by mid-century (Reference Bonneuil and Fressoz67). Books entitled Road to Survival by William Vogt and Our Plundered Planet by Henry Fairfield Osborn detailing the profound human implications of environmental destruction sold 20–30 million copies in the immediate post-World War II period. Rachel Carson’s Silent Spring, published in 1962, called attention to the ravages of pesticides through ecosystems, and became an immediate best-seller. Archival research has documented that fossil fuel companies were not only aware of their contributions to climate change from the 1970s or earlier; they were actively engaged in research to investigate the phenomenon (Reference Supran and Oreskes74). Despite claims by the World Economic Forum in 2019 that, ‘in relation to the environment … the world is most clearly sleepwalking into catastrophe’ (75), sleepwalking hardly seems the right metaphor for a process undertaken against a background of well-founded growing awareness.
Instead, the Anthropocene is the result of particular choices – political, economic, technological, and ideological choices, frequently driven by powerful interests – so much so that some have suggested that ‘Capitalocene’ is a more apt term than Anthropocene (Reference Moore76). Clearly, there have been deliberate attempts to bake in aspects of the modern economy that reinforce dangerous trends. With regard to energy, giant fossil fuel corporations have won subsidies, suppressed alternative power sources, battled labour unions, and manipulated markets to assure the dominance first of coal, and later of petroleum (Reference Freese77–Reference Auzanneau79). With regard to the built environment (Chapter 9), passive house technologies requiring little external energy were developed in the 1930s, and affordable solar homes were promoted in 1945 (Reference Barber80), but these were eclipsed by the development of suburbs in post-war America and the insistence by developers and utility companies on connections to the fossil-powered electric grid. In the USA, suburbanization – supported by Federal and local policies, mortgage lending practices, and real estate developers (Reference Jackson81) – also fostered mass ownership of private cars. With regard to food and agriculture (Chapter 10), it has been argued that the Green Revolution of the 1960s, which took place against the backdrop of Cold War ideological struggles, helped to ensure dominance of an agro-industrial approach to food production (Reference Cullather82). This approach was successful in improving food security by increasing yields of wheat, rice, and maize but also led to heavy dependence on high inputs of chemical fertilizers, pesticides, and energy whilst depleting water tables, polluting water sources, and leading to salination of soils.
However, we cannot exclusively blame a capitalist system that thrived on externalizing the full costs of economic activities. There is ample evidence of environmental destruction in the Soviet Union (Reference Peterson83), East Germany (Reference Dominick84), the People’s Republic of China (Reference Shapiro85), and other non-capitalist economies. Greenhouse gas emissions declined sharply after the fall of Soviet Communism (Reference Schierhorn, Kastner and Kuemmerle86). A substantial contribution was made by deep reductions in beef consumption when subsidies for livestock were removed and by subsequent carbon sequestration on abandoned cropland. However, it is likely that in the absence of policy action emissions will rebound. Both centrally controlled and market-driven economies have therefore contributed to unsustainable patterns of development, but now the consumer economy reigns largely supreme and depends on the pursuit of economic growth irrespective of the impacts on the natural systems that sustain human civilization.
The Path Forward
If the Anthropocene is the result of human action, then reversing course, and achieving a sustainable world to bequeath to future generations, can also flow from human action. Many of the needed technologies are already available. Many of the needed policies are clear. The institutions that need to be transformed (or sunsetted) are well documented (Reference Heede87, Reference Griffin88). They include fossil fuel industries and other companies whose business model depends on degrading the natural systems that underpin health. And a growing global movement of concerned citizens is calling for change.
During the long sweep of human history the environment has been exploited to benefit societies and powerful interests within them. Many indicators of human health and well-being have improved over the past century, but persistent inequities and adverse trends in indicators of the health of natural systems underpinning human progress are deeply concerning. In the absence of transformative change, current practices threaten to undermine the prospects for today’s and future generations. Subsequent chapters of this book aim to describe threats to human health in the Anthropocene Epoch, to discuss the extent to which we can adapt to the changes unleashed by human activities, and to suggest which societal choices can help to safeguard health, and human progress more generally, at much lower levels of environmental impact.