Introduction
Hindu and other Eastern mythologies view the universe as a stable oscillator, in perpetual but constant motion (Capra, Reference Capra2010). At a much smaller scale, and although the concept can be traced back to Hippocrates (Cofer & Appley, Reference Cofer and Appley1964), it was Claude Bernard who first proposed that maintaining the relative constancy of the internal environment might be one of the operational principles of life (Gross, Reference Gross1998).
Our stress response (originally called general adaptation syndrome (Selye, Reference Selye1951)), is the dynamical system through which we adaptively respond to external change in order to maintain internal constancy. Although our stress systems are multifarious (Gunnar & Quevedo, Reference Gunnar and Quevedo2007; Sapolsky, Reference Sapolsky2015), here we concentrate on the autonomic nervous system (ANS) and the network of brain regions and neurotransmitters involved in controlling arousal and regulatory function (see Aston-Jones & Cohen, Reference Aston-Jones and Cohen2005; Cacioppo, Tassinary, & Berntson, Reference Cacioppo, Tassinary and Berntson2000; Pfaff, Reference Pfaff2018; Porges, Reference Porges2007; Wass, Reference Wass2018, Reference Wass2020; Waterhouse & Navarra, Reference Waterhouse and Navarra2019 for recent reviews). The ANS can be studied both as one reciprocally connected subsystem, and as multiple differentiable subsystems (Calderon, Kilinc, Maritan, Banavar, & Pfaff, Reference Calderon, Kilinc, Maritan, Banavar and Pfaff2016; Pfaff, Reference Pfaff2018; Wass, Reference Wass2020). Both approaches are partially true (Calderon et al., Reference Calderon, Kilinc, Maritan, Banavar and Pfaff2016); here, we treat it mainly as the former. Optimal ANS arousal (henceforth “arousal”) lies at an intermediate point between over- and under-arousal (McCall et al., Reference McCall, Al-Hasani, Siuda, Hong, Norris, Ford and Bruchas2015; Samuels & Szabadi, Reference Samuels and Szabadi2008; Thayer, Hansen, Saus-Rose, & Johnsen, Reference Thayer, Hansen, Saus-Rose and Johnsen2009; Wass, Reference Wass2020).
Allostasis describes the active process through which internal equilibrium (homeostasis) is achieved and maintained (Cannon, Reference Cannon1929; McEwen & Wingfield, Reference McEwen and Wingfield2003; Ramsay & Woods, Reference Ramsay and Woods2014; Selye, Reference Selye1951; Sterling, Reference Sterling2012). When there is a discrepancy between the current level of activation and the optimal level or range for the given situation, the organism will typically engage in behavior designed to shift activation to reduce the discrepancy (Fiske & Maddi, Reference Fiske and Maddi1961). As an active process, allostasis can involve trade-offs between different systems in the body – the baroreflex, for example, involves changes in heart rate to compensate for variations in blood pressure (Berntson & Cacioppo, Reference Berntson and Cacioppo2007). However, it can also involve trade-offs over time: for example, the body cannot effectively mobilize fuel and oxygen to meet catabolic demands while simultaneously siphoning them off for growth and repair; allostasis involves managing trade-offs between the two (Sterling, Reference Sterling2012).
When used by psychologists and cognitive neuroscientists, allostasis typically refers to the behavioral processes through which an optimal level of arousal is established, and maintained. In this article, we describe evidence for allostatic mechanisms during childhood. We also introduce a new distinction between allostasis, the dynamical principle underlying self-regulation, with its opposite process, which we characterize as metastasis – the dynamical principle underlying dysregulation. We present common-sense argumentation and empirical data that both point to the existence of metastatic processes during childhood, and we argue that these processes are relatively under-researched.
The remainder of the article is structured as follows. First, we contextualize our approach by laying out our motivation for studying self-regulation and dysregulation from a dynamic perspective (see “‘Passive viewer’ approaches to the regulation of emotion and cognition”). Next, we contrast the two processes of allostasis and metastasis (section “Two dynamical principles”), and offer common-sense arguments for the existence of the latter (see “Real-world examples of metastasis”). We then examine empirical data for the existence of these processes, considering separately Actor×Environment interactions (second section) and Actor×Actor interactions (third section). In the fourth section we go on to discuss outstanding questions, followed in the fifth section by a discussion of dynamical methods for quantifying Attention×Arousal×Environmental interactions that might in future help to address these questions. Conclusions are presented in the sixth section.
“Passive viewer” approaches to the regulation of emotion and cognition
In real life, the environment generally does not deliver an isolated stimulus and then patiently wait for one to emit an isolated response. (Spivey & Dale, Reference Spivey and Dale2006)
Behavioral scientists commonly assess a child's capacity for self-regulation of emotion using experiments such as a toy removal task (Gagne, Van Hulle, Aksan, Essex, & Goldsmith, Reference Gagne, Van Hulle, Aksan, Essex and Goldsmith2011). In this paradigm, a child is allowed to play with a toy before an experimenter takes it and places it out of reach, before returning it after a time interval (Gagne et al., Reference Gagne, Van Hulle, Aksan, Essex and Goldsmith2011). The same sequence is presented across a number of discrete but contiguous trials, and the child's behavioral and physiological responses are averaged.
Compare this with an ecologically valid equivalent – say, a child having a tantrum at not being allowed to buy a toy while out shopping. A child might pick up a toy, and announce that they want it; their parent, tired and in a hurry, might abruptly say “no,” and attempt to take the toy off them, perhaps leading to a physical tug of war. The child might lose this, sit down with a bump, and burst out crying. Alternatively, they might start bashing the toy on the floor and break it; others in the shop might turn around to look at the noise. This series of events – being abruptly told “no,” a tug of war, sitting down with a bump, making a loud noise, being stared at by strangers – are all independent, exogenous causes of increased arousal. The toy removal is just a trigger for an ongoing cascade featuring multiple interconnected causative factors.
It has been over a hundred years since Dewey first criticized our tendency to assume that stimulus-response sequences happen discretely, in serial, and without overlap: “What we have is a circuit, not an arc or broken segment of a circle. [. . .] The motor response determines the stimulus, just as truly as sensory stimulus determines movement. [. . .]” (Dewey, Reference Dewey1896, p. 365). Given this, the continued pervasiveness of the “stimulus-response doctrine” is surprising (Edelman, Reference Edelman2016; Kingstone, Smilek, & Eastwood, Reference Kingstone, Smilek and Eastwood2008; Kolodny & Edelman, Reference Kolodny and Edelman2015; Osborne-Crowley, Reference Osborne-Crowley2020; Risko, Richardson, & Kingstone, Reference Risko, Richardson and Kingstone2016; Spivey & Dale, Reference Spivey and Dale2006; but see Holleman, Hooge, Kemner, & Hessels, Reference Holleman, Hooge, Kemner and Hessels2020). Even now, most experimental assessments of self-regulation rely on exposing the participant to experimenter-controlled events, and averaging participants’ responses.
Because of this, previous authors (Cole, Lougheed, Chow, & Ram, Reference Cole, Lougheed, Chow and Ram2020; Cole, Ram, & English, Reference Cole, Ram and English2019a; Cole, Ramsook, & Ram, Reference Cole, Ramsook and Ram2019; Morales et al., Reference Morales, Ram, Buss, Cole, Helm and Chow2018; Rabinovich, Muezzinoglu, Strigo, & Bystritsky, Reference Rabinovich, Muezzinoglu, Strigo and Bystritsky2010; Thayer & Lane, Reference Thayer and Lane2000; Thelen, Schöner, Scheier, & Smith, Reference Thelen, Schöner, Scheier and Smith2001; Wichers, Wigman, & Myin-Germeys, Reference Wichers, Wigman and Myin-Germeys2015) have argued instead in favor of an approach that views self-regulation as the product of constant, dynamic interactions between factors endogenous to the child and factors exogenous to them. Dynamics is “the free interplay of forces and mutual influences among components tending toward equilibrium or steady states” (Kugler, Kelso, & Turvey, Reference Kugler, Kelso and Turvey1980, p. 6). Reflecting this, we consider that self-regulation is not an attribute of individuals. Rather, that self-regulation takes place through interactions with the environment (Actor×Environment interactions) and with other people (Actor×Actor interactions). If you take an individual away from their environment, and from other people, then you take away their capacity to self-regulate (Levenson, Reference Levenson1988; Sameroff, Reference Sameroff2009).
Two dynamical principles
But what dynamical principles might underlie how we select our responses on a moment-by-moment basis? Here, we contrast two dynamical principles. The common property of these is that, in each case, a participant's response at time t + 1 is systematically influenced by their state at time t. However, the direction of the influence is opposite.
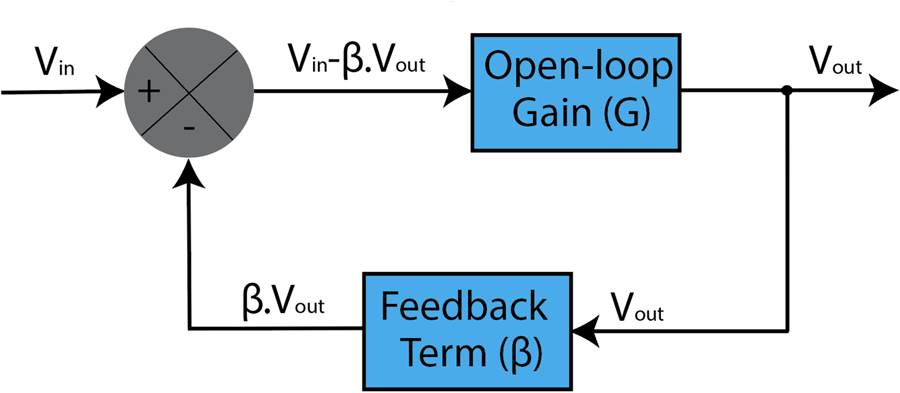
The first is allostasis – that is, the process through which we dynamically compensate for change in order to maintain homeostasis (Atzil, Gao, Fradkin, & Barrett, Reference Atzil, Gao, Fradkin and Barrett2018; McEwen & Wingfield, Reference McEwen and Wingfield2003). Allostasis is not a static mental resource – as is implicitly assumed by studies that measure an individual's capacity for self-regulation in the same way that, for example, other researchers (Gathercole & Alloway, Reference Gathercole and Alloway2008) might attempt an individual's working memory capacity. Rather, allostasis is dynamical. For example, when something occurs that exogenously increases arousal, allostatic mechanisms would involve behaviors that lower stimulation, thereby decreasing arousal. When something that occurs to decrease arousal, allostatic mechanisms would involve behaviors that increase arousal. In many ways, these processes are similar to negative feedback (see Figure 1) – but, as we describe in the second and third sections below, they are not exactly the same. Allostasis is the dynamical principle underlying self-regulation.
Schematic illustrating negative and positive feedback loops, as commonly used in electronics. The circuit represents a system with gain (G) and feedback (β). V in and V out show the input and output. The summing junction at its input subtracts the feedback signal from the input signal to form the error signal V in − βG, which drives the system. In a negative feedback system, the feedback term β is negative. Feedback reduces the overall gain of a system with the degree of reduction being related to the system's open-loop gain. (Also known as degenerative feedback.) In a positive feedback system, the feedback term is positive and so feedback increases the overall gain of a system. (Also known as amplificatory feedback.)

Relatively less attention has been paid to the opposite processes (although see for example Cole, Bendezú, Ram, & Chow, Reference Cole, Bendezú, Ram and Chow2017). In this article we coin the term “metastasis” (derived from the Greek word “meta” meaning “beyond”) to describe these. If allostasis is the dynamical principle underlying self-regulation, then metastasis is the dynamical principle underling dysregulation. Models for similar processes abound in biology – such as metastatic tumors, for example. Where allostatic processes involve small initial increases and decreases in arousal becoming corrected for over time, metastatic processes are the opposite: they involve small initial increases and decreases in arousal becoming amplified over time. Again, this process is close but identical to “positive feedback” (see Figure 1) – as we discuss further in the third section “Actor–actor.”
Real-world examples of metastasis
In “‘Passive viewer’ approaches to the regulation of emotion and cognition” we gave the example of a child having a tantrum in a shopping center. We argued that, in the real world, emotion dysregulation takes place through multiple, reciprocally interconnected, self-sustaining interactions between the actor and the environment, and between the actor and other actors.
There are numerous other common-sense examples of similar self-sustaining emotion dysregulation dynamics. For example, most parents have observed a young, agitated child banging their spoon on the table at mealtimes, which seems to agitate them still further – or deliberately running their hands up and down the bars of their cot at night when they can't sleep, which seems to keep them awake for longer. Similarly, many parents have observed an agitated child to move faster or less carefully, and to hurt themselves or to break something and be reprimanded, which seems to increase agitation further, making them move still faster. However, these types of self-sustaining cycles have received surprisingly little theoretical attention hitherto.
In adult psychology, similar processes are better understood. At the cognitive level, for example, clinical research has identified maintenance factors that actively maintain, and amplify, anxiety symptoms (Salkovskis, Reference Salkovskis1991). In panic disorder, for example, paying increased attention to physiological symptoms can cause their subsequent amplification (Clark, Reference Clark1986). Similarly, rumination (Ehring, Frank, & Ehlers, Reference Ehring, Frank and Ehlers2008), attention biases to threat (Pine et al., Reference Pine, Mogg, Bradley, Montgomery, Monk, McClure and Kaufman2005) and maladaptive compensatory strategies such as thought suppression (McMahon & Naragon-Gainey, Reference McMahon and Naragon-Gainey2018) are all thought to actively maintain, and amplify, initial symptoms (Salkovskis, Reference Salkovskis1997). Other research has, similarly, taken a systems-level perspective to investigate how attention regulation and affective processes interact during inhibition (such as disengaging from a distressing stimulus), and to contrast it with how these processes interact during dysregulation (such as paying increased attention to a distressing stimulus) (Friedman, Reference Friedman2007; Pérez-Edgar, Reference Pérez-Edgar2018; Thayer & Lane, Reference Thayer and Lane2000).
In this article, we consider similar dynamical metastatic processes from the perspective of child development. In addition, we also consider the flip-side: as well as examining how increases in arousal can become amplified over time, we also consider whether similar processes might also explain how decreases in arousal can become amplified over time. Again, common-sense arguments appear to suggest that they do. Thus, for example, a child's arousal state can influence whether or not they engage with a complex new stimulus (Richards, Reference Richards1987; Van der Meere & Sergeant, Reference Van der Meere and Sergeant1988; Wass, Reference Wass2020); but engagement, and comprehension, is thought to cause changes in arousal (Pempek et al., Reference Pempek, Kirkorian, Richards, Anderson, Lund and Stevens2010; Richards, Reference Richards2010). Thus, decreased arousal might cause increased engagement, causing decreases in arousal (D. R. Anderson & Lorch, Reference Anderson, Lorch, Bryant and Anderson1983; Richards & Anderson, Reference Richards and Anderson2004), leading to a similar pattern of fluctuations in arousal becoming amplified over time.
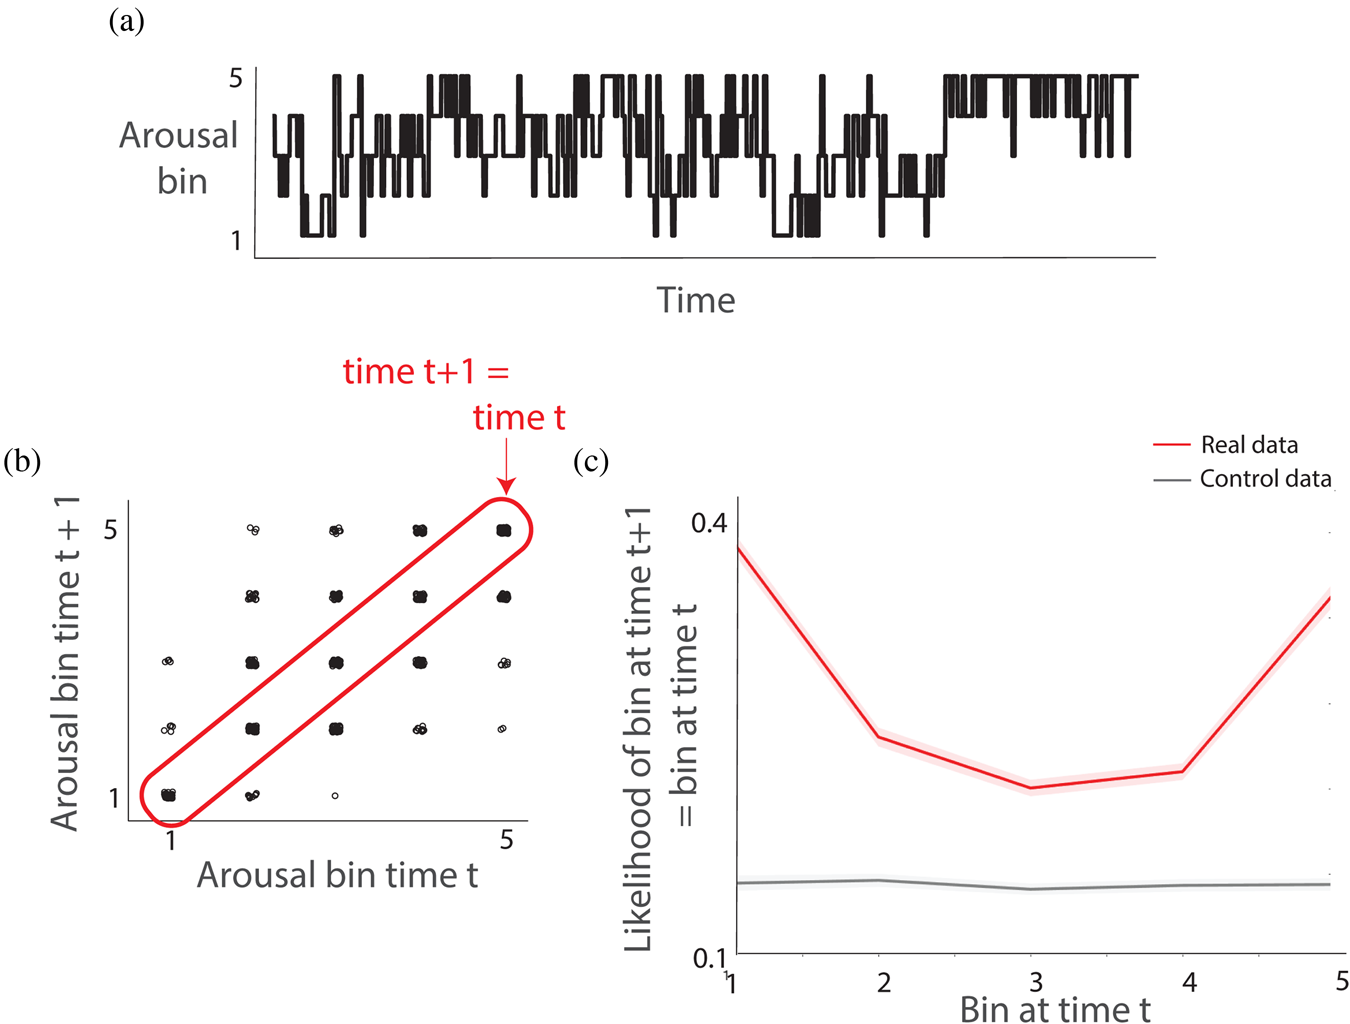
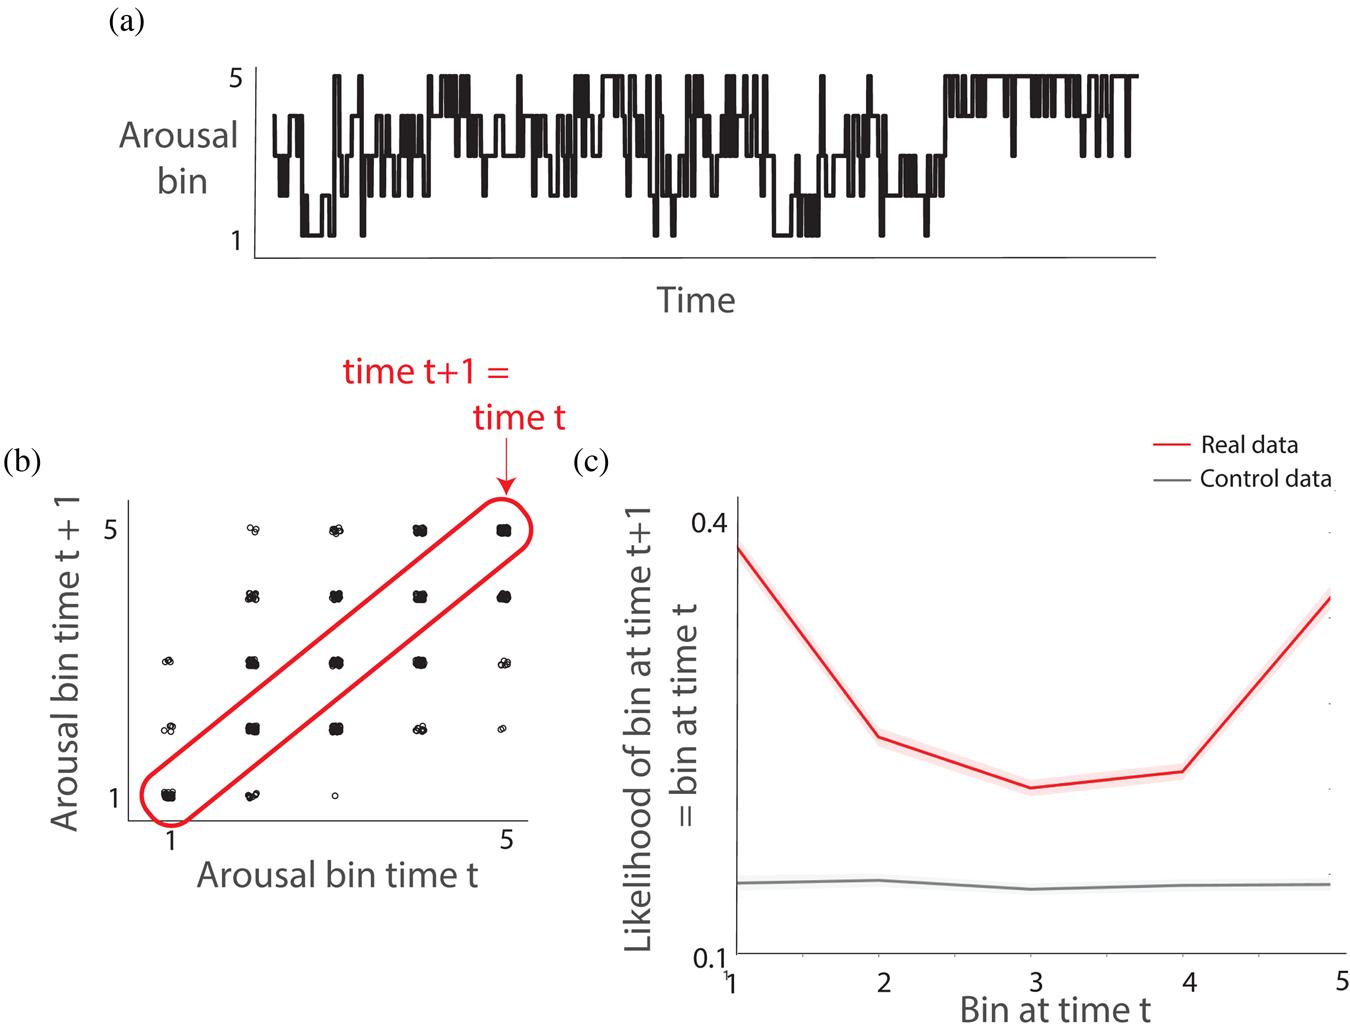
Two recent papers have suggested that metastatic processes might influence naturalistic arousal during early childhood. For example, one study took day-long naturalistic recordings to examine fluctuations in autonomic arousal (derived from a mixture of heart rate, heart rate variability and movement) in 12-month-old infants (see Figure 2). Based on the above-discussed literature on allostatic regulation, they predicted that, if fluctuations above and below the mean are corrected for via self-regulation, then over longer timescales intermediate arousal states should be more long-lasting than high or low arousal states (Wass, Clackson, & Leong, Reference Wass, Clackson and Leong2018; Wass, Smith, Clackson, & Mirza, Reference Wass, Smith, Clackson and Mirza2021). In fact, they found the opposite: across multiple timescales, high and low arousal states were more long-lasting than intermediate arousal states. One explanation for this finding is that different arousal states have different intrinsic levels of hysteresis. Another is that metastatic processes may operate during early childhood, similar to those identified in adult clinical psychology (see also Cole et al., Reference Cole, Lougheed, Chow and Ram2020).
(a) Illustrative example day-long excerpt of autonomic arousal data (derived from a composite of heart rate, heart rate variability and movement) from a single participant after data were binned into five equally sized bins and downsampled to 60-s epochs (data from Wass et al., Reference Wass, Smith, Clackson and Mirza2021). (b) Illustrative example of an adapted Poincaré plot in which arousal bin at time t is plotted against arousal bin at time t + 1, showing that rapid transitions in arousal (e.g., from Bin 1 at time t (x-axis) to Bin 5 at time t + 1 (y-axis)) are rare. (c) Plot based on arousal data downsampled to 60-s epochs which shows, separately for each arousal bin at time t, the likelihood of time t + 1 being the same as time t. Top line shows the real data; bottom line the control data. Shaded areas show standard error of the means. The U-shape indicates that extreme low and high arousal states are more long-lasting than intermediate states. The same phenomenon is observed across multiple timescales (Wass et al., Reference Wass, Smith, Clackson and Mirza2021).
Both allostasis and metastasis can be instantiated through interactions between one actor and the environment (henceforth, Actor×Environment interactions). However, they can also be instantiated through inter-personal relationships (henceforth, Actor×Actor interactions). In the second section we consider the former (actor–environment) interactions and the latter (actor–actor) in the third section.
Actor–Environment
Allostatic mechanisms
Even newborns are thought to have a tendency to close their eyes when overstimulated (Brazelton, Reference Brazelton1983). Other early experiments examined video-coded behaviors such as gaze aversion, which downregulates arousal (Field, Reference Field1981). Even at 5 months, infants were more likely to show gaze aversion following a experimenter-administered toy removal, which upregulates arousal (Buss & Goldsmith, Reference Buss and Goldsmith1998; Kopp, Reference Kopp1982 Stifter & Braungart, Reference Stifter and Braungart1995). Other research has examined other putative downregulatory behaviors, such as distraction, self-soothing, calming self-talk, and proximity seeking, across typical and atypical development (Doherty-Sneddon, Riby, & Whittle, Reference Doherty-Sneddon, Riby and Whittle2012 Feldman, Dollberg, & Nadam, Reference Feldman, Dollberg and Nadam2011; Nigg, Reference Nigg2017). Overall, these results are consistent with a framework in which even young infants are more likely to show downregulatory behaviors following an external stressor. (Although of note, most studies have simply tested for the presence of behaviors that are assumed to be downregulatory, without actually testing whether they are or not.)
In addition to studies which examine the likelihood of particular behaviors within particular time-windows, other studies have specifically examined how behaviors change over time. These studies are essential, for example, to differentiate children who show high reactivity but good regulation from those who show low reactivity (Kahle, Miller, Helm, & Hastings, Reference Kahle, Miller, Helm and Hastings2018; Ursache, Blair, Stifter, & Voegtline, Reference Ursache, Blair, Stifter and Voegtline2013); and also to study how the use of regulatory strategies affects emotional recovery (Cole et al., Reference Cole, Bendezú, Ram and Chow2017; Cole et al., Reference Cole, Ram and English2019a; Cole, Ramsook, & Ram, Reference Cole, Ramsook and Ram2019b; Cole et al., Reference Cole, Lougheed, Chow and Ram2020). For example, one study continuously coded children's overt displays of emotions (facial and vocal affect) and their use of executive processes (e.g., thumb-sucking as self-soothing) during a frustration-eliciting task (Cole et al., Reference Cole, Lougheed, Chow and Ram2020; see also Morales et al., Reference Morales, Ram, Buss, Cole, Helm and Chow2018). Dynamical modelling techniques (see “Dynamical methods for quantifying Attention×Arousal×Environmental interactions”) were used to capture age-related changes in the bidirectional coupling between the two variables. Results showed coupling between the two variables, such that executive processes had a direct influence on changes in emotional displays at all ages. The strength of this coupling was stable between 24 months and 5 years. When examining coupling in the opposite direction – how emotional displays affect executive processes – they also found that emotions tended to inhibit the use of executive processes (Cole et al., Reference Cole, Lougheed, Chow and Ram2020) (see also Cole et al., Reference Cole, Bendezú, Ram and Chow2017 and the fourth section “Outstanding questions” for further discussion of this point).
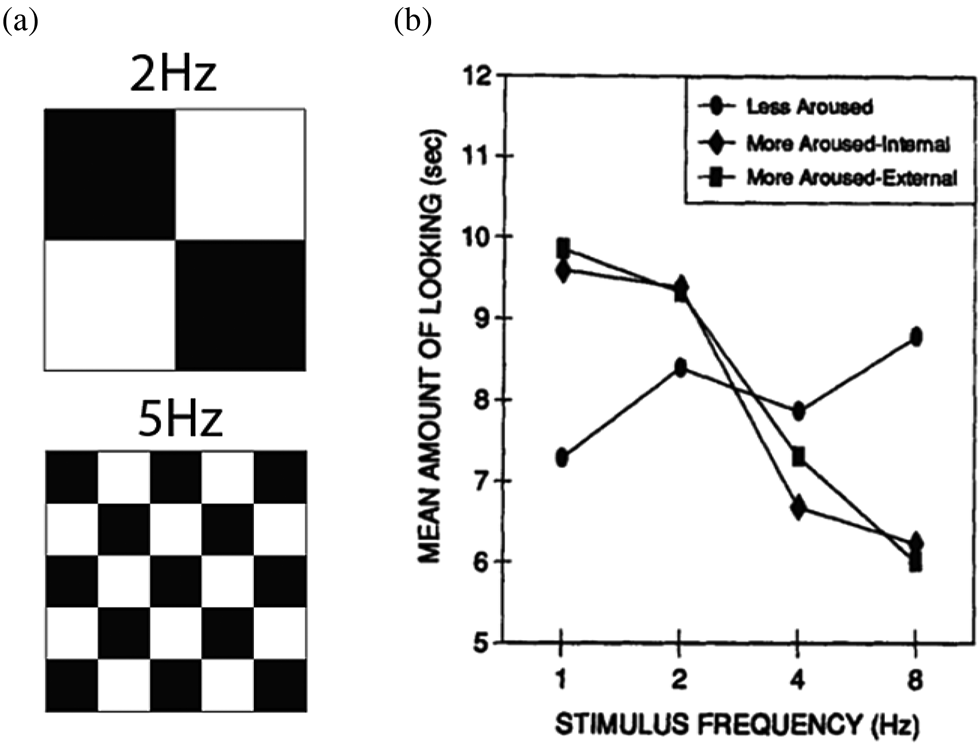
The studies described thus far have examined how children downregulate following increases in arousal. Only a smaller body of research has examined how children upregulate following decreases in arousal, to maintain an optimal intermediate level. Gardner, Karmel and colleagues measured how young infants’ preference for less arousing, low-frequency visual stimuli versus more arousing, high-frequency visual stimuli (see Figure 3) varied contingent on their own arousal (Gardner & Karmel, Reference Gardner and Karmel1984, Reference Gardner and Karmel1995; Gardner, Karmel, & Flory, Reference Gardner, Karmel and Flory2003; Gardner, Karmel, & Magnano, Reference Gardner, Karmel and Magnano1992; Geva, Gardner, & Karmel, Reference Geva, Gardner and Karmel1999). (The determination of whether low-frequency visual stimuli were in fact more arousing was measured separately, by recording heart rate.) They found that highly aroused one-month-old individuals preferred less arousing, low-frequency stimuli, whereas less aroused infants preferred more arousing, high-frequency stimuli (Gardner & Karmel, Reference Gardner and Karmel1984, Reference Gardner and Karmel1995). (The same results were not observed in four-month-olds, possibly because the static checkerboard patterns used led to “floor” effects in older infants.) These results suggest that young infants dynamically recalibrate their attentional behaviors to downregulate their own arousal when it is high, and to upregulate it when it is low. To our knowledge, these studies are the only ones to have shown this.
(a) Illustrations of the checkerboards of varying frequency used by Gardner et al., Reference Gardner, Karmel and Magnano1992). (b) From Gardner et al., Reference Gardner, Karmel and Magnano1992 showing that highly aroused infants prefer to look at less arousing, low-frequency stimuli; whereas less aroused infants prefer more arousing, high-frequency stimuli.

Metastatic mechanisms
Above we considered allostatic Actor×Environment interactions, through which we compensate for increases (or decreases) in arousal by changing how we interact with the environment in such a way as to correct for the change in arousal. Here, we consider the opposite processes: metastatic actor-environment interactions, through which we respond to increases (or decreases) in arousal by changing how we interact with the environment in such a way that the increases (or decreases) in arousal become amplified.
Researchers working in attention-deficit/hyperactivity disorder (ADHD) have examined how increases in arousal can become amplified over time. For example, a number of researchers have suggested that hyper-arousal may cause a preference for fast-paced visual stimuli (Beyens, Valkenburg, & Piotrowski, Reference Beyens, Valkenburg and Piotrowski2018), and for smaller but more immediate rewards (Castellanos, Sonuga-Barke, Milham, & Tannock, Reference Castellanos, Sonuga-Barke, Milham and Tannock2006; Sonuga-Barke, Wiersema, van der Meere, & Roeyers, Reference Sonuga-Barke, Wiersema, van der Meere and Roeyers2010); and that fast-paced visual stimuli and immediate rewards are, in turn, more likely to cause increases in arousal (Beyens et al., Reference Beyens, Valkenburg and Piotrowski2018; Van der Meere & Sergeant, Reference Van der Meere and Sergeant1988). However, this research has, to our knowledge, only been conducted based on time-invariant snapshots at the trait-level (i.e., “do children with ADHD tend to be more aroused on average, and to prefer fast-paced stimuli”), and not based on continuous data recorded at the state-level (i.e., “at times when a child is more aroused do they tend to prefer fast-paced stimuli”).
Within adult psychology, as discussed in the section “Two dynamical principles,” research has also identified factors that can dynamically maintain, and amplify, anxiety symptoms (Salkovskis, Reference Salkovskis1991; Thayer & Lane, Reference Thayer and Lane2000). Similarly, research with infants and children has suggested that increased vigilance to novelty and threat may cause the emergence of anxiety symptoms during later development (Dudeney, Sharpe, & Hunt, Reference Dudeney, Sharpe and Hunt2015; Pérez-Edgar, Reference Pérez-Edgar2018; Pérez-Edgar et al., Reference Pérez-Edgar, Bar-Haim, McDermott, Chronis-Tuscano, Pine and Fox2010; Roy, Dennis, & Warner, Reference Roy, Dennis and Warner2015). Attention mechanisms may lead behaviorally inhibited children to resort to habitual and inflexible repertoires in new environments (Pérez-Edgar, Reference Pérez-Edgar2018), which amplifies behavioral inhibition. Certainly, trait-level anxiety can affect bottom-up capture and the processing of irrelevant stimuli (Rossi & Pourtois, Reference Rossi and Pourtois2017), which affects how children explore and exploit the environment (Reader, Reference Reader2015). Importantly, however, and as with the research in ADHD described above, both of these ideas have thus far only been explored as trait- and not state-level features.
We can also consider the opposite type of amplificatory process: how decreases in arousal can become amplified over time. As we described in the section “’Passive viewer’ approaches to the regulation of emotion and cognition,” we know that a child's arousal state can influence how they react when a complex or slow-paced new stimulus is presented (Richards, Reference Richards1987; Van der Meere & Sergeant, Reference Van der Meere and Sergeant1988) – either engaging with it, or not. At the same time, comprehensible stimuli (e.g., TV programs with the shots correctly ordered versus randomly re-shuffled) elicit greater changes in arousal (Pempek et al., Reference Pempek, Kirkorian, Richards, Anderson, Lund and Stevens2010; Richards, Reference Richards2010). Thus, a decrease in arousal might cause increased engagement with a complex or slow-paced stimulus, which causes further decreases in arousal. This might explain why attention patterns in naturalistic settings show a non-linear self-sustaining character – such that, the longer a look lasts, the more its likelihood of ending during the next successive time interval diminishes (D.R. Anderson, Alwitt, Lorch, & Levin, Reference Anderson, Alwitt, Lorch, Levin, Hale and Lewis1979; D. R. Anderson & Lorch, Reference Anderson, Lorch, Bryant and Anderson1983; Richards & Anderson, Reference Richards and Anderson2004).
In the fourth section we discuss outstanding questions with regard to both allostasis and metastasis. First, though, we consider allostasis and metastasis from the perspective of Actor×Actor interactions.
Actor–Actor
Allostatic mechanisms
Coregulation (within the dyad), as opposed to self-regulation (within the individual), is considered particularly important during early development (Bridgett, Burt, Edwards, & Deater-Deckard, Reference Bridgett, Burt, Edwards and Deater-Deckard2015; Butler, Reference Butler2011; Fogel, Reference Fogel1993; Kopp, Reference Kopp1982; Sameroff, Reference Sameroff and Mussen1983; Tronick, Reference Tronick1982). Research has shown that increases in child arousal are corrected faster in the presence of a caregiver than in their absence (Ham & Tronick, Reference Ham and Tronick2009; Shih, Quiñones-Camacho, Karan, & Davis, Reference Shih, Quiñones-Camacho, Karan and Davis2018), and that how a parent responds when their child is challenged predicts how quickly the child recovers (Bornstein & Suess, Reference Bornstein and Suess2000; Leerkes, Su, Calkins, Supple, & O'Brien, Reference Leerkes, Su, Calkins, Supple and O'Brien2016; Shih et al., Reference Shih, Quiñones-Camacho, Karan and Davis2018; Wass et al., Reference Wass, Smith, Clackson, Gibb, Eitzenberger and Mirza2019a). This suggests that allostatic actor-actor mechanisms are important, at least during early development. Infants are sensitive to whether their partner is contingently responding to them (Murray, Reference Murray1985; Rayson, Bonaiuto, Ferrari, Chakrabarti, & Murray, Reference Rayson, Bonaiuto, Ferrari, Chakrabarti and Murray2019), and dyads showing more contingent Caregiver×Child interactions also show superior affect regulation (Beebe et al., Reference Beebe, Jaffe, Markese, Buck, Chen, Cohen and Feldstein2010; Murray, Reference Murray1985), as well as superior infant attention and learning (Goldstein, Schwade, Briesch, & Syal, Reference Goldstein, Schwade, Briesch and Syal2010; Jaffe et al., Reference Jaffe, Beebe, Feldstein, Crown, Jasnow, Rochat and Stern2001; Mason, Reference Mason2018; Mason, Kirkpatrick, Schwade, & Goldstein, Reference Mason, Kirkpatrick, Schwade and Goldstein2019). Recent theories have also suggested that allostasis plays a role at other levels, such as in the development of Bayesian predictive coding mechanisms in the brain (Atzil et al., Reference Atzil, Gao, Fradkin and Barrett2018).
However, although the concept of actor-actor allostasis is well advanced, there are inconsistencies in how adults are thought to modulate their own arousal state in response to an increase (or decrease) in child arousal. Affective states are contagious (Heyes, Reference Heyes2018; Waters, West, & Mendes, Reference Waters, West and Mendes2014; Waters, West, Karnilowicz, & Mendes, Reference Waters, West, Karnilowicz and Mendes2017). We could predict, then, based on the concept of negative feedback discussed in the section “Two dynamical principles,” that adults would perform the opposite changes to those shown by their child – for example reducing their arousal at times when their child's arousal is high. Through this, they would disconnect their own state from that of the child in order to help their child's arousal to regain equilibrium through affect contagion. In fact, though, the majority of the literature into how allostatic mechanisms operate across dyads has looked for the opposite relationship: that parents match, or connect their own state to that of the child (Dezecache, Jacob, & Grezes, Reference Dezecache, Jacob and Grezes2015) in order to help the child regain equilibrium (Feldman, Reference Feldman2007). This is motivated by research findings showing that empathy involves matching one's own physiological or neural state to the state of the person with whom one is empathizing (Levenson & Ruef, Reference Levenson and Ruef1992; Wicker et al., Reference Wicker, Keysers, Plailly, Royet, Gallese and Rizzolatti2003).
Sometimes, both types of response can be observed within a single study. For example, a recent study found that parent's starting arousal level determines whether they respond to an increase in their child's arousal by increasing their own arousal (to connect) or by decreasing their own arousal (to disconnect) (Wass et al., Reference Wass, Smith, Clackson, Gibb, Eitzenberger and Mirza2019a). One further distinction that may be important here is between emotional contagion, which is early-developing and involuntary, and more controlled processes of interpreting those feelings, which are later developing and effortful (Heyes, Reference Heyes2018 (see also Dezecache et al., Reference Dezecache, Jacob and Grezes2015; Singer & Klimecki, Reference Singer and Klimecki2014). Heyes calls the former Empathy1 and the latter Empathy2 (Heyes, Reference Heyes2018). Possibly, “connecting” may involve Empathy1-type responses and “disconnecting” may involve Empathy2-type responses.
Also of note, not all theorists think that coregulation only involves strict parent–child coordination according to allostatic principles. For example, some research has suggested that the ideal interaction is not of absolute coordination, but rather is “messy,” involving the mismatch of responses and their subsequent repair (Ham & Tronick, Reference Ham and Tronick2009; Jaffe et al., Reference Jaffe, Beebe, Feldstein, Crown, Jasnow, Rochat and Stern2001; Tronick, Reference Tronick2007). Tronick suggests that these moments of disconnection do have a functional significance, but it is not the systematic “negative feedback” disconnection discussed here (Ham & Tronick, Reference Ham and Tronick2009).
Metastatic mechanisms
Research into metastatic processes within caregiver–child dyads is most well advanced for ADHD, where parental expressed emotions (i.e., hostility, criticism, low warmth) are thought to operate both as causes, and as consequences, of oppositional child behavior (Harold et al., Reference Harold, Leve, Barrett, Elam, Neiderhiser, Natsuaki and Thapar2013; Taylor, Reference Taylor1999) (see also Baker, Fenning, Howland, & Huynh, Reference Baker, Fenning, Howland and Huynh2019; Combs-Ronto, Olson, Lunkenheimer, & Sameroff, Reference Combs-Ronto, Olson, Lunkenheimer and Sameroff2009; Overbeek, Creasey, Wesarg, Huijzer-Engbrenghof, & Spencer, Reference Overbeek, Creasey, Wesarg, Huijzer-Engbrenghof and Spencer2020). For example, one study found that parents with higher expressed emotions had children with larger cortisol responses, and that child cortisol reactivity mediated the link between parental expressed emotions and child oppositional behaviors (Christiansen, Oades, Psychogiou, Hauffa, & Sonuga-Barke, Reference Christiansen, Oades, Psychogiou, Hauffa and Sonuga-Barke2010). Again, however, this research has been conducted based on static, time-invariant data at the trait-level (i.e., “do parents of children with ADHD tend to show more expressed emotions on average?”) rather than based on continuously recorded data at the state-level (i.e., “how do child/parenting arousal and parenting strategies tend to cofluctuate during the day?”). Recording continuous data showing how child/parent arousal and vocalizations covary during the day would allow us to do this (see “ Dynamical methods for quantifying Attention×Arousal×Environmental interactions”). Because of this, we understand little about what triggers, and what defuses, amplificatory Parent×Child interactions; whether parent–child oppositionality occurs in multiple brief bursts or fewer, more sustained episodes; and how, for example, parents may use different disciplining tactics contingent on their own fluctuating physiological stress.
Other research has examined similar processes in dyads where the parent has anxiety or depression (Feldman et al., Reference Feldman, Granat, Pariente, Kanety, Kuint and Gilboa-Schechtman2009; T.M. Field, Healy, Goldstein, & Guthertz, Reference Field, Healy, Goldstein and Guthertz1990; Granat, Gadassi, Gilboa-Schechtman, & Feldman, Reference Granat, Gadassi, Gilboa-Schechtman and Feldman2017; Smith et al., Reference Smith, Jones, Charman, C, Mirza and Wassin press). Parents with high anxiety are thought to adopt an overloaded, high stimulating interactional style (Feldman et al., Reference Feldman, Granat, Pariente, Kanety, Kuint and Gilboa-Schechtman2009), and to over-respond to small-scale physiological changes in their child (Smith et al., Reference Smith, Jones, Charman, C, Mirza and Wassin press); whereas parents with depression are thought to be generally under-responsive (Amole, Cyranowski, Wright, & Swartz, Reference Amole, Cyranowski, Wright and Swartz2017; Field et al., Reference Field, Healy, Goldstein and Guthertz1990). However, the metastatic underpinnings of these processes (i.e., how the child's behavior affects the adults, which in turn affects the child, and vice versa) remain inadequately understood.
Similar ideas have also been discussed, but again remain relatively underexplored, in autism spectrum disorders (ASD). For example, it is thought that, in at least some children with ASD, increases in arousal may associate with eye gaze avoidance (Kaartinen et al., Reference Kaartinen, Puura, Mäkelä, Rannisto, Lemponen, Helminen and Hietanen2012; although see Nuske, Vivanti, & Dissanayake, Reference Nuske, Vivanti and Dissanayake2015); and a separate series of studies has shown that parents of children who show less parental engagement start, in turn, to make fewer efforts to engage with their children (Wan, Green, & Scott, Reference Wan, Green and Scott2019) – which, given the known role of parent–child engagement in coregulation of arousal (Kopp, Reference Kopp1982), may contribute to a metastatic cycle. Again, however, these ideas have thus far been explored at the trait- and not the state-level.
In “Allostatic mechanisms,” we discussed problems with considering allostasis purely as a “negative feedback” process. This is because parental responding sometimes involves disconnecting their own arousal level from the child's (e.g., responding to an increase in child's arousal by decreasing their own arousal, in order to help the child's arousal decrease); whereas at other times it involves the opposite (responding to an increase in the child's arousal by increasing their own arousal in order to help the child's arousal decrease). Is metastasis always as a “positive feedback” process (see Figure 1)? Certainly, the ADHD literature would suggest that increases in child arousal tend to be matched by increases in parental arousal (i.e., positive feedback). In depression and anxiety, however, the picture is more mixed (Feldman et al., Reference Feldman, Granat, Pariente, Kanety, Kuint and Gilboa-Schechtman2009; Field et al., Reference Field, Diego, Hernandez-Reif, Schanberg, Kuhn, Yando and Bendell2003; Granat et al., Reference Granat, Gadassi, Gilboa-Schechtman and Feldman2017; Smith et al., Reference Smith, Jones, Charman, C, Mirza and Wassin press). This is a question for future research.
It should also be noted that metastatic actor-actor processes are not the only dyadic mechanism thought to underlie the development of child self-regulatory deficits. For example, trait-level parental under-responsiveness is considered an independent route to later child self-regulatory problems (Bornstein & Manian, Reference Bornstein and Manian2013; Slagt, Dubas, van Aken, Ellis, & Deković, Reference Slagt, Dubas, van Aken, Ellis and Deković2017).
Outstanding Questions
Allostasis
In this article, and in agreement with others (Cole et al., Reference Cole, Ramsook and Ram2019b; Thayer & Lane, Reference Thayer and Lane2000; Thelen & Smith, Reference Thelen and Smith1994), we have argued that a continuing majority approach that views self-regulation primarily as a static mental resource has obscured a deeper understanding of how self-regulation emerges through dynamical interactions. For example, no research to our knowledge has examined whether different children have different levels of “optimal” arousal (cf Zuckerman, Reference Zuckerman1979), such that a given arousal level might elicit downregulation in one child (because that arousal level is above the “optimal” arousal level for that child) – but upregulation in another child. Similar principles might also underlie differences within parent–child dyads, as well as between individual children (Wass et al., Reference Wass, Smith, Clackson, Gibb, Eitzenberger and Mirza2019a).
It is also worth noting that almost all previous research has merely examined for the presence or absence of behaviors which are assumed to up- or downregulate arousal, without actually testing whether they do or not. Because of this, no research has quantitatively contrasted which behaviors are effective downregulatory behaviors, and which are not. Similarly, no research has examined whether allostatic mechanisms might work cross-modally – such that an increase in one subsystem (e.g., sensory) might be compensated for by a decrease in another system (e.g., motor) (Calderon et al., Reference Calderon, Kilinc, Maritan, Banavar and Pfaff2016; Nigg, Reference Nigg2017).
The final point is that, as we have noted, intermediate levels of ANS arousal are considered optimal for attention and learning (Aston-Jones & Cohen, Reference Aston-Jones and Cohen2005; Wass, Reference Wass2020). However, the vast majority of research has examined how children downregulate following increases in arousal. Much less research has examined how children upregulate following decreases in arousal (although see Gardner et al., Reference Gardner, Karmel and Flory2003; Zuckerman, Reference Zuckerman1979). This may be for two reasons. First, hypo-arousal can be detected using autonomic monitoring, but may not be detectable using purely behavioral observations of facial affect. Behavioral coding may be suitable for examining hyper- but not hypo-arousal, whereas autonomic recordings can capture both extremes. Second it may be merely because young children in particular tend towards hyper-arousal, in particular during psychopathology, and so hypo-arousal may simply be less common. From a theoretical perspective, though, it seems important to consider whether up- and downregulatory processes operate in similar ways, using similar mechanisms.
Metastasis
We have also argued throughout that relatively little research has examined metastatic processes – from the perspective either of Actor×Environment, or Actor×Actor interactions. Furthermore, what research there is has examined it at based on time-invariant snapshots at the trait level (e.g., “are children with anxiety more likely to be aroused, and to show attention biases?”) rather than based on continuous recordings at the state level (e.g., “are all children more likely to show attention biases when aroused?”). As we discuss further in the section “Dynamical methods for quantifying Attention×Arousal×Environmental interactions,” below, one reason for this may be because metastatic processes are generally harder to elicit using experimenter-controlled paradigms and in the lab. Because of this we understand little about what might trigger, and defuse, metastatic actor–environment and Actor×Actor interactions. For example, are parenting styles influenced by child and parent arousal? And do parenting styles directly influence child and parent arousal? We also know little about the timescale of processes: whether mutually amplificatory Parent×Child interactions are more likely to occur in multiple brief bursts or fewer, more sustained episodes. Answering both of these questions would be of immediate benefit within applied psychology.
From both a theoretical and an applied perspective, however, one question seems crucial: how, and why, do we transition between allostatic and metastatic processes? For example, Cole showed that increased emotionality precedes decreased use of executive processes (Cole et al., Reference Cole, Lougheed, Chow and Ram2020; see section “Allostatic mechanisms”), a process which they characterized as regulatory interference (Cole et al., Reference Cole, Bendezú, Ram and Chow2017). However, is it, for example, that small increases (or decreases) in arousal trigger allostatic (corrective) mechanisms, whereas larger increases in arousal trigger metastatic processes? Are differences best observed between individuals (and, if so, why) (Cole et al., Reference Cole, Bendezú, Ram and Chow2017)?
A second aim is to discover why metastatic processes develop in the first place. Previous researchers have compared inhibitory processes – that is negative feedback circuits that interrupt ongoing behavior (e.g., disengaging from a distressing stimulus) – with positive feedback loops (e.g., paying increased attention to a distressing stimulus) (Thayer & Lane, Reference Thayer and Lane2000). They suggested that positive feedback loops may promote perseveration and continued activation of systems, thereby limiting their availability for other processes (Thayer & Lane, Reference Thayer and Lane2000; see also Pérez-Edgar, Reference Pérez-Edgar2018). Understanding how, and why, positive feedback loops develop as attractors – that is what gives them their self-sustaining character – is central to our ability to better target these mechanisms in future.
Dynamical Methods for Quantifying Attention×Arousal×Environmental Interactions
One reason why so many of the real-world regulatory processes that we have been discussing remain unexplored is a methodological one. Lab-based studies observe small time segments during which (the parent at least) is on “best behavior” (i.e., is aware of being watched by multiple cameras). Many of the metastatic processes we have discussed, such as oppositional Parent×Child interactions, are naturally hard to observe in these settings.
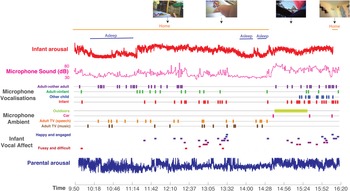
Recently, several groups have taken the approach that we advocate, and developed time-series analyses to analyze dynamical changes in continuous data. Some of these are based on longer segments of lab-collected data (Cole et al., Reference Cole, Lougheed, Chow and Ram2020; Morales et al., Reference Morales, Ram, Buss, Cole, Helm and Chow2018), such as during a frustration-eliciting waiting task. The others look at emotion regulation “in the wild” simply by using wireless wearable devices to recording multimodal data in naturalistic settings (de Barbaro, Reference de Barbaro2019; Maitha et al., Reference Maitha, Goode, Maulucci, Lasassmeh, Yu, Smith and Borjon2020; Wass et al., Reference Wass, Smith, Clackson, Gibb, Eitzenberger and Mirza2019a; Wass et al., Reference Wass, Smith, Clackson and Mirza2021) (see Figure 4). Variables that can be recorded using these wearable devices include: autonomic function (heart rate, respiration, actigraphy); sound (both ambient noise and vocalizations); visual attention patterns (using head-mounted cameras); parent–child proximity; GPS; and many more.
An example of real-world naturalistic data recorded from a 12-month-old infant and their parent. From top to bottom: photos from a wearable camera worn by the infant; coding of when participants were at home and asleep; infant autonomic arousal (measured via heart rate, heart rate variability and movement); sound levels from the microphone worn by the infant; vocalizations recorded on the microphone; ambient noise from the microphone; infant vocal affect; parent autonomic arousal. From Wass et al., Reference Wass, Smith, Clackson, Gibb, Eitzenberger and Mirza2019a; Wass et al., Reference Wass, Smith, Daubney, Suata, Clackson, Begum and Mirza2019b.

Below, we describe a method through which hypothesis-driven testing can be applied to these time series data in order to test for expected allostatic and metastatic mechanisms.
Quantifying how the coupling between variables changes over time
Conventional task designs concentrate on analyzing change relative to predetermined experimenter events (such as the starts and stops of experimenter-controlled stressors.) Dynamic approaches, in contrast, examine “the free interplay of forces and mutual influences” (Kugler et al., Reference Kugler, Kelso and Turvey1980). These can be studied either between two variables (e.g., parent and child arousal), or between larger groups of variables (e.g., also involving sound, vocalizations, visual attention patterns and so on).
To quantify these mutual influences, we can examine the strength of coupling between variables. Although various measures exist to quantify this, here we concentrate on Granger prediction (Granger, Reference Granger1969; Sugihara et al., Reference Sugihara, May, Ye, Hsieh, Deyle, Fogarty and Munch2012), which is a regression-based method which tests whether my ability to predict the next value of time series B is improved if I also know information about time series A – that is, do changes in A forward-predict changes in B? Using a moving window, it is possible to examine how the strength of the Granger-predictive relationship between the two time series fluctuates over time (Thorson, West, & Mendes, Reference Thorson, West and Mendes2018).
This continuous measure of how the coupling between two variables changes over time can then be further analyzed by examining change relative to particular events. Crucially these events are defined with respect to the participant themselves, rather than predetermined and experimenter-defined. These can be identified in two different ways. First, we might examine how coupling changes relative to particular processes that we expect to trigger allostatic or metastatic reactions. These might include particular types of spontaneous vocalizations (from the child or parent), or particular things that the child sees or hears. We can assess whether the observed changes in coupling relative to these events differ from the chance coupling by comparing the observed results with “control” pseudo-events inserted randomly into the data.
Second, we might identify moments when we expect allostatic or metastatic reactions to be triggered in a different way – for example, by identifying the most elevated peaks or troughs in naturally occurring arousal. This can be done, for example, by inserting events into the data whenever the arousal exceeds a certain threshold (e.g., 95th centile), and examining the change in coupling (e.g., between parent and child arousal) relative to these events (Smith et al., Reference Smith, Jones, Charman, C, Mirza and Wassin press).
Differentiating allostatic from metastatic coupling
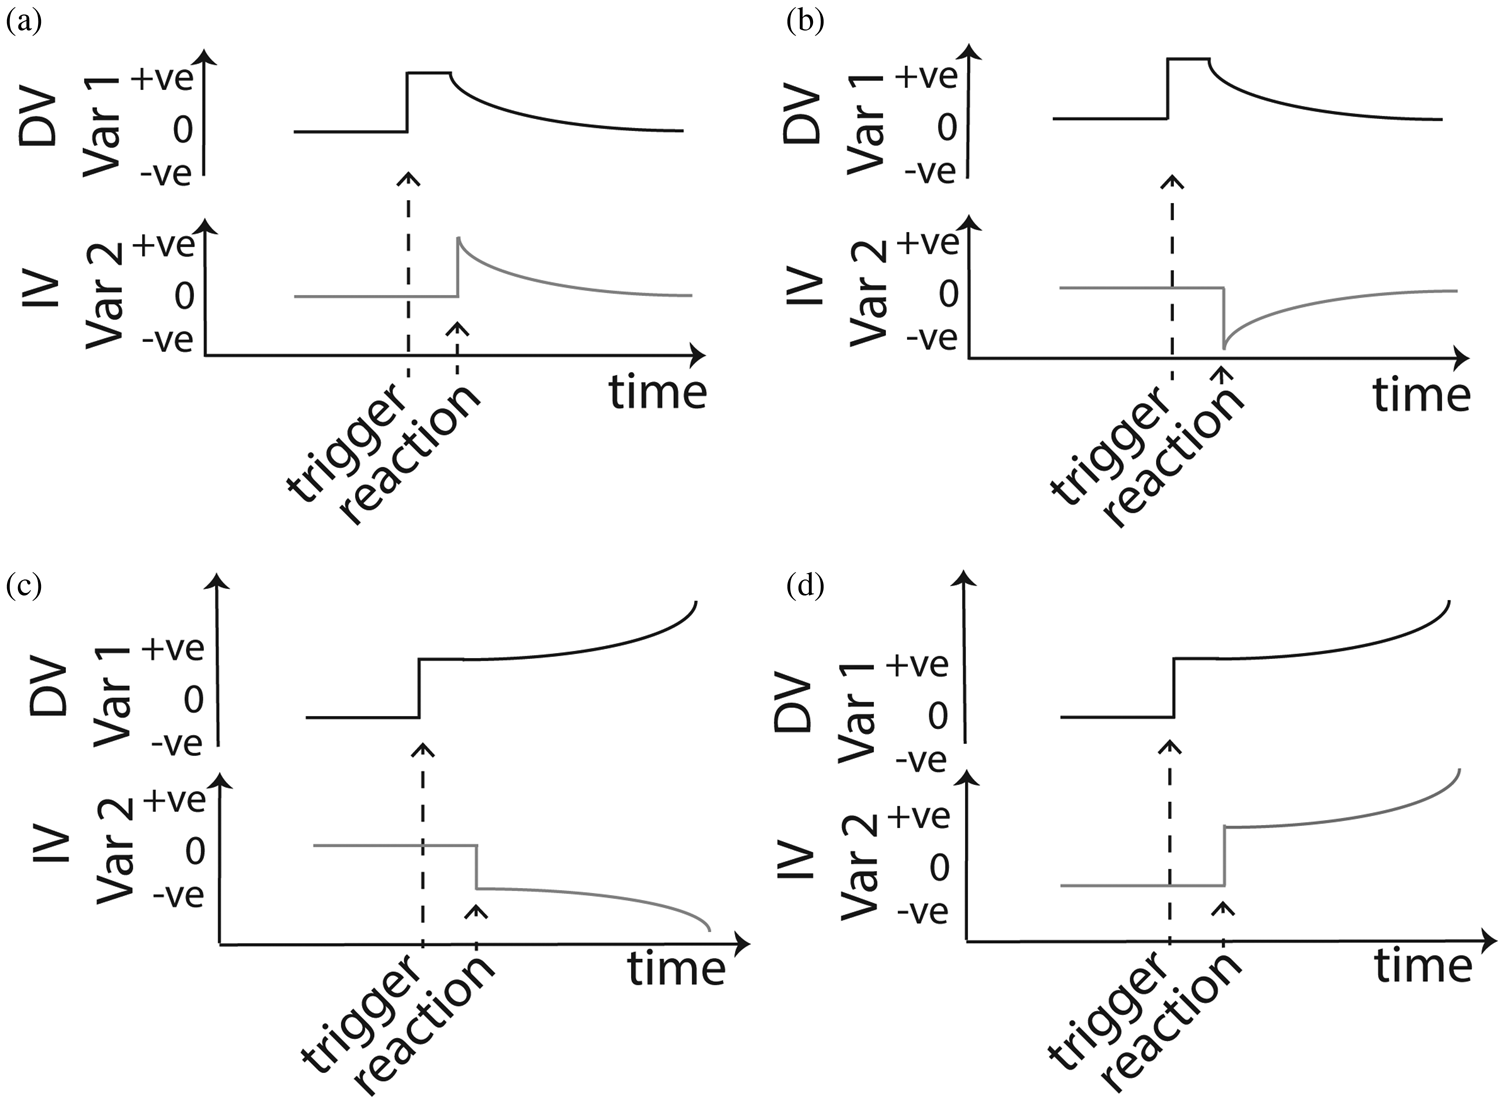
Using the method described above we can quantify how the coupling between variables changes over time, and relative to particular naturally occurring features of the data. How do we identify whether the coupling identified is allostatic, or metastatic? Figure 5 shows an illustration of the different types of relationship we can expect to observe. Three parameters are primarily of interest. First, is the interaction allostatic or metastatic? that is, is the outcome of the coupling to correct for the initial change in the dependent variable, in which case it is allostasis, or to amplify the initial change in the dependent variable, in which case it is metastasis? Second, is the Granger-predictive relationship between the two time series positive (increases in the dependent variable associate with increases in the independent variable) or negative? Third, and finally, which is omitted from Figure 5 for simplicity, is the initial change in the dependent variable an increase or a decrease? Figure 5 only shows initial increases in arousal. Decreases in arousal follow the same pattern, but inverted.
Schematic illustrating the different types of allostatic and metastatic processes that can be identified in time series data. The schematics show different possible relationships between a dependent variable (DV) (such as infant arousal) and an independent variable (IV) (such as parent arousal). (a) Allostatic mechanism where increased values of the IV associate with decreases in the DV (i.e., DVt +1 = DVt − IVt). The sequence shows an increase in the IV, which occurs in response an increase in the DV, leading to a decrease in the DV. (b) Allostatic mechanism where DVt +1 = DVt + IVt. A decrease in the IV, which occurs in response to an increase in the DV, leads to a decrease in the DV. (c) Metastatic relationship where increased values of the IV associate with decreases in the DV (i.e., DVt +1 = DVt − IVt). A decrease in the IV, which occurs in response to an increase in the DV, leads to a further increase in the DV. (d) Metastatic relationship where DVt +1 = DVt + IVt. In increase in the IV, which occurs in response to an increase in the DV, is followed by a further increase in the DV.

In addition to the analyses described here, a variety of other methods are available and useful for testing for the presence of allostatic and metastatic processes (Chatfield, Reference Chatfield2004; Chow, Reference Chow2019; Thorson et al., Reference Thorson, West and Mendes2018; Xu, de Barbaro, Abney, & Cox, Reference Xu, de Barbaro, Abney and Cox2020). For example, dynamic systems models, such as the damped oscillator models used by Cole, Ram and colleagues (Cole et al., Reference Cole, Lougheed, Chow and Ram2020; Morales et al., Reference Morales, Ram, Buss, Cole, Helm and Chow2018) can be used to examine how quickly a child's arousal levels return to baseline following a spontaneous increase, as well as for quantifying dynamic changes in the coupling between two variables (Morales et al., Reference Morales, Ram, Buss, Cole, Helm and Chow2018) (see also Lewis, Reference Lewis2005). In addition, analyses such as Cross-Recurrence Quantification Analysis can identify “attractor basins” – that is the states of a dynamic system that can show increased stability, relative to other states (Coco, Mønster, Leonardi, Dale, & Wallot, Reference Coco, Mønster, Leonardi, Dale and Wallot2020; Ham & Tronick, Reference Ham and Tronick2009; Shockley, Butwill, Zbilut, & Webber, Reference Shockley, Butwill, Zbilut and Webber2002). These analyses would be useful for addressing the questions laid out in the section “Metastasis.”
Conclusions
We are used to thinking of emotions as properties that “resonate” (Buchanan, Bagley, Stansfield, & Preston, Reference Buchanan, Bagley, Stansfield and Preston2012) in “interpersonal” space (Butler, Reference Butler2011; Ham & Tronick, Reference Ham and Tronick2009; Hatfield, Cacioppo, & Rapson, Reference Hatfield, Cacioppo and Rapson1993; Waters et al., Reference Waters, West and Mendes2014). However, most researchers persist in conceptualizing (and measuring) self-regulation as a static, time invariant, mental resource. We have argued that regulatory processes are similarly best understood as “resonant” properties viewed the systemic level, as the product of dynamic and constantly fluctuating Actor×Environment and Actor×Actor interactions (Feldman, Reference Feldman2007; Sameroff, Reference Sameroff2009).
We also discussed two principles that can guide these interactions. In both cases, behaviors at time t + 1 are systematically influenced by behaviors at time t – but in different directions. The first is allostasis, through which we actively compensate in order to maintain equilibrium. The second are metastatic processes, through which small initial increases and decreases become progressively amplified over time.
We have also pointed to a number of areas where our current understanding is incomplete. Most particularly, we know little about the influence of the real-world environment, and how we as active agents dynamically modulate our internal state through Actor×Environment interactions.
We tend to pay theoretical attention only to phenomena that we can easily study in the lab. Metastatic processes are hard to observe, and yet studying them may develop our understanding across a range of psychopathologies. Developing our research in this area may help understand what triggers, and defuses, metastatic processes when they occur; how metastatic change over time; and what intervention techniques are effective for preventing and defusing them.
Acknowledgment
Many thanks for Marta Perapoch for reading and commenting on several drafts of this manuscript.
Funding Statement
This research was funded by Economic and Social Research Coundil (ESRC) grant number ES/N017560/1, by a Leverhulme Project Grant RPG-2018-281 and by European Research Council grant number ONACSA 853251.
Conflicts of Interest
None.