
1. Introduction
High Reynolds number wall-bounded turbulent shear flows are characterized by a separation of scales between the flow in the near-wall region, in which mean viscous stresses play an important role, and the flow farther away from the wall, where mean viscous effects are largely negligible. This separation of scales is quantified by the friction Reynolds number  $Re_{\tau } = \delta /\delta _{\nu }$, where
 $\delta$ is the characteristic length scale of the shear layer, such as a channel half-width, a pipe radius or a boundary layer thickness, and
 $\delta _{\nu } = \nu /u_{\tau }$ is the viscous length scale, where
 $\nu$ is the kinematic viscosity of the fluid,
 $u_{\tau } = \sqrt {\tau _w/\rho }$,
 $\tau _w$ is the mean wall shear stress and
 $\rho$ is the fluid density. Both the direct numerical simulation (DNS) and large eddy simulation (LES) of such wall-bounded turbulent flows are expensive, as the spatial degrees of freedom required to resolve the near-wall layer scale as
 $\mathcal {O}(Re_{\tau }^{2.5})$ and
 $\mathcal {O}(Re_{\tau }^{2})$ for DNS and LES, respectively (Mizuno & Jiménez Reference Mizuno and Jiménez2013). For a large class of flows of technological importance, this cost is prohibitive, even on modern high-performance computing systems.
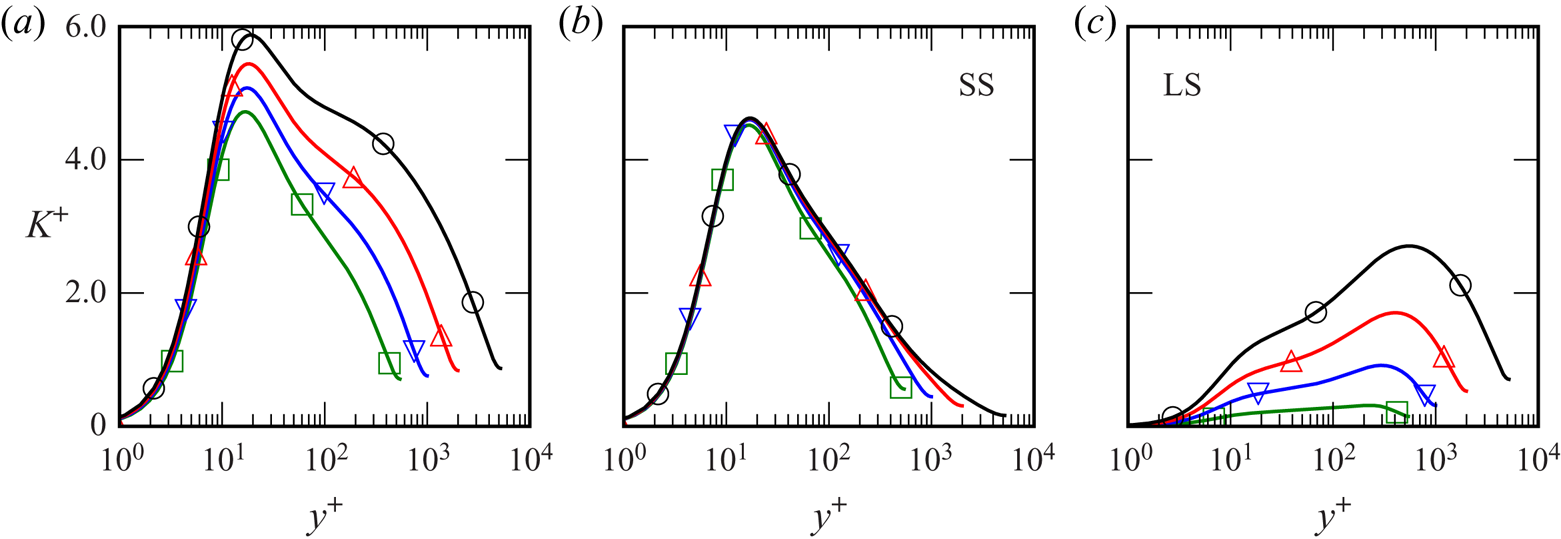
Thanks to advances in experimental techniques and computational power, the understanding of the physics of wall-bounded flows has increased greatly since the earliest investigations by Hagen (Reference Hagen1839), Darcy (Reference Darcy1854) and Reynolds (Reference Reynolds1895), and the later work by Millikan (Reference Millikan1938). It is well known that there is an autonomous near-wall cycle of self-sustaining mechanisms (Jiménez & Moin Reference Jiménez and Moin1991; Hamilton, Kim & Waleffe Reference Hamilton, Kim and Waleffe1995; Jeong et al. Reference Jeong, Hussain, Schoppa and Kim1997), involving low and high speed streamwise velocity streaks and coherent structures of quasi-streamwise vorticity. Jiménez & Pinelli (Reference Jiménez and Pinelli1999) showed that this cycle of near-wall dynamics persists without any input from the turbulence farther away from the wall. Moreover, if any element of the cycle is suppressed, the near-wall turbulent kinetic energy (TKE) decays, and the flow becomes laminar. However, the large-scale structures (superstructures) in the outer layer do modulate the turbulent fluctuations in the near-wall region (Hutchins & Marusic Reference Hutchins and Marusic2007; Marusic, Mathis & Hutchins Reference Marusic, Mathis and Hutchins2010a; Ganapathisubramani et al. Reference Ganapathisubramani, Hutchins, Monty, Chung and Marusic2012), leaving their ‘footprint’ on the autonomous cycle. Mathis, Hutchins & Marusic (Reference Mathis, Hutchins and Marusic2011) (see also references therein) modulated a ‘universal signal’ identified in experimental data as the contribution of the small-scale near-wall turbulence, to formulate a predictive statistical model. The large-scale modulation results, for instance, in an  $Re_{\tau }$-dependent peak of the turbulent kinetic energy in the near-wall region (see figure 1) because its influence increases with increasing
 $Re_{\tau }$ (DeGraaff & Eaton Reference DeGraaff and Eaton2000).
Unfiltered, high-pass (SS) and low pass (LS) portion of the turbulent kinetic energy scaled in viscous units with  $k_{{cut}} \delta _{\nu } =0.00628$ (
 $\lambda _{{cut}}/\delta _{\nu } =1000$) for a channel flow at various
 $Re_{\tau }$ (green:
 $Re_{\tau }=550$, blue:
 $Re_{\tau } = 1000$, red:
 $Re_{\tau }=2000$, black:
 $Re_{\tau }=5200$). The contribution from the large scales increases with
 $Re_{\tau }$, but the contribution from the small scales is largely independent of
 $Re_{\tau }$. Figure reproduced from Lee & Moser (Reference Lee and Moser2019) with permission.

Recently, Lee & Moser (Reference Lee and Moser2019) performed spectral analysis of channel flow DNS data for several different  $Re_{\tau }$ (ranging from approximately
 $550$ to
 $5200$) to investigate the relative importance of different length scales to the production, transport, and dissipation of TKE. Their results suggest that the small scales in the near-wall region behave universally. Indeed, when the energy spectrum is high-pass filtered to only include contributions from wavenumbers (defined to be
 $k=2\pi/\lambda$, where
 $\lambda$ denotes wavelength) with magnitude larger than some
 $k_{cut}\delta _{\nu }= 0.00628$ (corresponding to a wavelength
 $\lambda _{cut}/\delta _{\nu } = 1000$), the resulting energy is found to be independent of
 $Re_{\tau }$, as shown in figure 1. Similar results were also obtained in Samie et al. (Reference Samie, Marusic, Hutchins, Fu, Fan, Hultmark and Smits2018) for experimental data ranging from
 $Re_{\tau } \approx 6000\text {--}20\,000$. These works, along with those mentioned above, indicate that the near-wall region has universal small scales, independent of
 $Re_{\tau }$. The large scale portion of the near-wall turbulence, however, is the result of eddies whose size and influence on the turbulent statistics depend on
 $Re_{\tau }$. These observations suggest that an appropriately formulated numerical simulation of only the small-scale near-wall dynamics should be able to reproduce the near-wall small-scale statistics (e.g. SS in figure 1). One objective of the work reported here is to test this hypothesis.
With this in mind, we endeavour to design a computational model of the universal near-wall small scales of turbulent, wall-bounded shear flows. The primary modelling goal is to accurately represent the contribution of the small scales to the near-wall turbulent statistics without simulating the entire wall-bounded turbulent shear flow. The model is formulated to simulate wall-bounded turbulence only in a near-wall, rectangular domain  $\varOmega$ localized to the boundary. The size of the domain scales in viscous units, so that as
 $Re_{\tau }$ increases, the domain shrinks in size relative to the size of the overall flow whose near-wall turbulence is being modelled.
The model is formulated to mimic the mean flux of momentum from the outer layer, but it otherwise ‘isolates’, or decouples, the near-wall dynamics from large-scale outer-layer influences, such as the modulations by superstructures. In this way it is similar to the numerical experiments described in Jiménez & Pinelli (Reference Jiménez and Pinelli1999) in which the equations of motion are filtered to suppress the dynamics above some fixed wall-normal height. It is fundamentally different from a low Reynolds number channel flow, for example, whose dynamics is influenced by the presence of the opposite wall. If such a configuration can accurately model the dynamics of the near-wall, small-scale features of the flow, it could be used to study the response of near-wall turbulence to changes in the momentum environment, including the effects of pressure gradients. Further, assuming a separation of scales between the small-scale autonomous near-wall dynamics and the large-scale outer turbulence that modulates it, the model flow could be used to inform a representation of wall turbulence in a wall-modelled LES.
This paper reports on the development and evaluation of just such a computational model of the near-wall layer in turbulent shear flows. It originated as a design for the high-fidelity, ‘microscale’ component of a multiscale computational approach for simulating wall-bounded turbulence in the style of the heterogeneous multiscale method (Abdulle et al. Reference Abdulle, Weinan, Engquist and Vanden-Eijnden2012), as pursued by Sandham, Johnstone & Jacobs (Reference Sandham, Johnstone and Jacobs2017), who coupled their microscale model to a LES in a full channel. Previous multiscale approaches of this type include Pascarelli, Piomelli & Candler (Reference Pascarelli, Piomelli and Candler2000) and Tang & Akhavan (Reference Tang and Akhavan2016), in which LES are coupled to minimal flow unit simulations. One application of the model will be to generate data to inform a pressure-gradient-dependent wall model for an LES (Piomelli & Balaras Reference Piomelli and Balaras2002; Bose & Park Reference Bose and Park2018), as suggested by Coleman, Garbaruk & Spalart (Reference Coleman, Garbaruk and Spalart2015). In this case, the model plays the role of the universal signal in Mathis et al. (Reference Mathis, Hutchins and Marusic2011). Additionally, the current model approach could be used to study the interaction between the small, near-wall turbulent dynamics and more complicated physical processes, such as heat transfer, chemical reactions, turbophoresis or surface roughness.
The rest of the manuscript is organized as follows: § 2 contains a description of the computational model and the numerical method used to integrate the equations of motion. Section 3 provides a comparison between the statistics generated by the model and the corresponding quantities from DNS for the cases of both zero and mild favourable pressure gradients. In § 4 the results are summarized, and possible applications and extensions of the model are discussed.
2. Formulation
2.1. Notation
In the following discussion, the velocity components in the streamwise ( $x$), wall-normal (
 $y$) and spanwise (
 $z$) directions are denoted as
 $u$,
 $v$ and
 $w$, respectively, and when using index notation, these directions are labelled 1, 2 and 3, respectively. The expected value is denoted with angle brackets (as in
 $\langle \cdot \rangle$), and upper case
 $U$ and
 $P$ indicate the mean velocity and pressure, so that
 $\langle u_i \rangle = U_i$. The velocity and pressure fluctuations are indicated with primes, e.g.
 $u_i = U_i + u_i'$. Partial derivatives shortened to
 $\partial _i$ signify
 $\partial /\partial x_i$, differentiation in the direction
 $x_i$. The mean advective derivative is
 $\textrm {D}(\cdot )/\textrm {D} t = \partial _t (\cdot ) + U_j \partial _{j} (\cdot )$, where Einstein summation notation is implied. In general, repeated indices imply summation, with the exception of repeated Greek indices. Lastly, the superscript ‘
 $+$’ denotes non-dimensionalization with the kinematic viscosity
 $\nu$ and the friction velocity
 $u_{\tau }$.
2.2. Motivation
Intrinsic to the computational model is the assumption of a separation of temporal and spatial scales between the small-scale turbulence arising from the autonomous near-wall dynamics and the large-scale outer-layer turbulence. The near-wall dynamics can therefore be considered to be in local equilibrium with the pressure gradient and momentum flux environment in which they are evolving. Furthermore, under this scale-separation assumption, both the local pressure gradient and the turbulent momentum flux from the outer layer toward the wall can be considered constants on the scale of the near-wall dynamics being simulated. Note that despite this assumption, the near-wall model will be representative of the wall layer in wall-bounded flows that are not in equilibrium overall, or those with non-constant pressure gradients. The assumptions break down, for example, for a boundary layer near separation.
The goal of the computational model is to simulate the turbulent small scales in the near-wall region as a function of an imposed pressure gradient only in a small, rectangular domain localized to the boundary. This necessarily means placing non-physical computational boundaries in a region of chaotic, highly nonlinear dynamics. In addition to the standard no-slip condition at the lower boundary  $y=0$, the use of periodic boundary conditions at the sidewalls is well established, assuming the flow is statistically homogeneous in these directions. The problem of prescribing appropriate boundary conditions at the upper computational boundary, however, is non-trivial (Berselli, Iliescu & Layton Reference Berselli, Iliescu and Layton2006; Sagaut, Deck & Terracol Reference Sagaut, Deck and Terracol2006). Once a mathematically well posed condition is prescribed, care must be taken to prevent the approximation inherent in the boundary condition from polluting the turbulent dynamics in the domain's interior. To address this issue, the model augments the near-wall computational domain with a ‘fringe region’. In this fringe region, the flow is externally forced to account for the mean flux of momentum through the upper computational boundary that is precluded by the boundary conditions imposed there. The inclusion of such a region increases the computational cost of the model, but it provides the momentum transport needed to create the ‘correct environment’ for the evolution of turbulence in the near-wall region. In this way, the fringe region mollifies the effect of the non-physical computational boundary. Similar techniques are used for designing inflow/outflow conditions in the DNS of turbulent boundary layers (Colonius Reference Colonius2004; Khujadze & Oberlack Reference Khujadze and Oberlack2004; Wu & Moin Reference Wu and Moin2009; Sillero, Jiménez & Moser Reference Sillero, Jiménez and Moser2013), for example, as well as in molecular dynamics simulations, often referred to as a ‘heat bath’ or ‘thermostat’ (Berendsen et al. Reference Berendsen, Postma, van Gunsteren, DiNola and Haak1984; Yong & Zhang Reference Yong and Zhang2013).
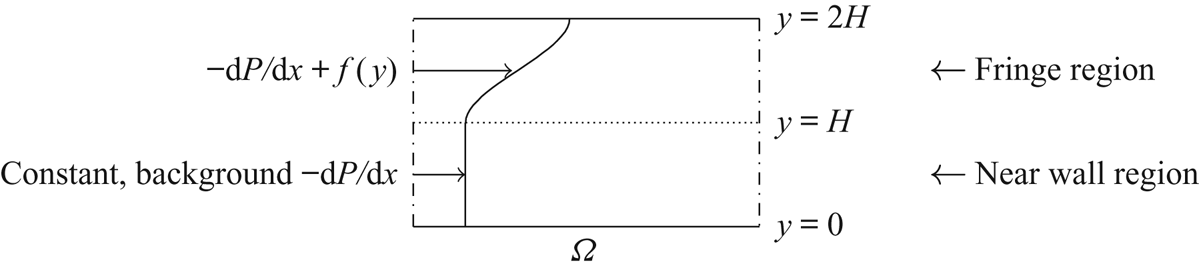
If one is interested in the turbulent statistics resulting from a constant-pressure-gradient near-wall region out to a wall-normal height of  $y \approx H$, the fringe region consists of a layer from
 $H \le y \le 2H$ in which a horizontally uniform streamwise forcing is applied, as illustrated in figure 2.
The fluid is subject to periodic boundary conditions at the (dash-dotted) sidewalls, constant Dirichlet/Neumann conditions at the upper boundary  $y=2H$ and the no-slip condition at the wall
 $y=0$, as described in (2.1). In addition to the constant pressure gradient assumed to be present in the near-wall layer, the model includes an auxiliary pressure gradient in a ‘fringe region’ to account for momentum transport at the computational boundary
 $y=2H$.

2.3. Mathematical formulation
The near-wall patch (NWP) model is defined by the equations of motion and boundary conditions in the rectangular domain  $\varOmega = [0,L_x]\times [0,L_y]\times [0,L_z]$:
 \begin{equation} \left.\begin{gathered} \partial_t u_i + u_j \partial_j u_i + \partial_i p - \nu \partial_j \partial_j u_i = f_i-\partial_i P \quad\text{in } \varOmega, \\ \partial_i u_i = 0\quad \text{in } \varOmega, \\ \partial_i P = \textrm{d} P/\textrm{d} x \ \delta_{i1} \text{ is constant}\quad \text{in } \varOmega, \\ u_i \text{ periodic in } x \text{ and } z \text{ directions}\quad \text{in } \varOmega,\\ u_i = 0, \quad y = 0, \\ v = \partial_y w = 0, \quad y = L_y, \\ \partial_y u = \psi \in \mathbb{R}, \quad y = L_y, \\ f_i(x,y,z,t) = f(y) \delta_{i1}\quad \text{in } \varOmega. \end{gathered}\right\} \end{equation}
These are simply the forced incompressible Navier–Stokes equations on a periodic domain in the wall-parallel directions, with the no-slip boundary condition at  $y=0$ (the wall), and no-flow through and constant viscous tangential traction
 $\nu \psi$ in the streamwise direction (
 $x$) specified at the top
 $y=L_y$. The term
 $\textrm {d} P/\textrm {d} x$ models the externally imposed streamwise pressure gradient in the real turbulent flow being modelled, which is constant on the scale of the NWP. The pressure
 $p$ is the NWP model's pressure field, which is determined from the incompressibility constraint, in the usual way. It only remains to specify
 $\psi$ and the forcing function
 $f(y)$. The former represents the viscous flux of momentum through the top, and the latter is a source of streamwise momentum that makes up for the missing turbulent flux of streamwise momentum through the upper computational boundary, owing to the boundary conditions that imply that the Reynolds stress vanishes there.
The forcing function  $f(y)$ is non-zero only in the fringe region
 $y>L_y/2$, and is constructed such that
 \begin{equation} \int_0^{L_y}f(y)\,\textrm{d} y=-\tau_{turb}, \end{equation}
where  $\tau _{turb}$ is the turbulent flux of mean momentum through
 $y=L_y$ in the turbulent flow being modelled.
In the real turbulent flow with a (locally) constant mean pressure gradient, the mean streamwise momentum equation integrated over  $[0,L_y]$ yields
 \begin{gather} -\frac{\textrm{d} P}{\textrm{d} x}L_y + \left(\left.\nu\frac{\partial U}{\partial y}\right|_{y=L_y}-\tau_{turb}\right) - \tau_w = 0, \end{gather}
 \begin{gather}\implies \tau_w = -\frac{\textrm{d} P}{\textrm{d} x}L_y + \tau_{top}. \end{gather}
The term in parentheses,  $\tau _{top}$, is the total momentum flux (viscous plus turbulent) through
 $y=L_y$, and it, along with
 $\textrm {d} P/\textrm {d} x$, determines the mean wall shear stress
 $\tau _w$.
The mean streamwise stress balance for the NWP model system (2.1) is
 \begin{equation} \nu \frac{\partial U}{\partial y} -\left\langle u' v' \right\rangle+ \int_{0}^{y} f(s) \,\textrm{d} s = y \frac{\textrm{d} P}{\textrm{d} x} + \tau_w. \end{equation}
The boundary conditions in (2.1) and the constraint (2.2) imply that at  $y=L_y$, (2.5) becomes
 \begin{gather} \nu \psi + \int_{0}^{L_y} f(s) \,\textrm{d} s = L_y \frac{\textrm{d} P}{\textrm{d} x} + \tau_w, \end{gather}
 \begin{gather}\implies \tau_w = -\frac{\textrm{d} P}{\textrm{d} x}L_y + \nu \psi - \tau_{turb}, \end{gather}
so that for fixed  $L_y$, the parameters
 $\nu$,
 $\tau _{turb}$,
 $\psi$ and
 $\textrm {d} P/\textrm {d} x$ determine
 $\tau _w$. Dimensional analysis therefore implies that there is a two-parameter family of possible turbulent flows to model.
By specifying  $\psi$ and
 $\tau _{turb}$ so that
 $\nu \psi - \tau _{turb} = \tau _{top}$, the NWP model's mean stress balance augmented with the forcing function
 $f$ (2.7) will be consistent with that of the real turbulent flow being modelled (2.4).
2.4. Physical parameters
The total mean stress at  $y=L_y$ for the NWP model is given by
 \begin{equation} \tau_{tot} := \nu \psi - \tau_{turb}. \end{equation}
In wall units,  $\tau _{tot}$ is simply a function of
 $\textrm {d} P^+/\textrm {d} x^+$:
 \begin{equation} \tau^+_{tot} = 1 + L_y \frac{\textrm{d} P^+}{\textrm{d} x^+}. \end{equation}
The pressure gradient  $\textrm {d} P^+/\textrm {d} x^+$ is thus one parameter defining a model case, and its values for the four cases presented – three favourable-pressure-gradient cases and one zero-pressure-gradient case – are shown in table 1. The values for
 $\tau _{tot}^+$ are also shown for convenience, but of course they are simply determined via (2.9).
Imposed pressure gradient and the resulting total momentum flux  $\tau _{tot}$ at
 $y=L_y$ for the model cases presented. The favourable-pressure-gradient parameters were selected to match the pressure gradients in the channel flow cases at https://turbulence.oden.utexas.edu/. Note that data from the NWP550 case are only used in figure 14.

The second parameter to define a NWP model case is  $\psi ^+$; it determines the portion of
 $\tau ^+_{tot}$ carried by the mean viscous stress. For all of the statistics reported in § 3, however, the actual value of
 $\psi ^+$ used was found to be insignificant. For each case listed in table 1, an initial
 $\psi ^+_{dns}$ was determined from available DNS data. Results were then compared from runs with
 $\psi ^+ = \psi ^+_{dns}$,
 $\psi ^+ = 2\psi ^+_{dns}$,
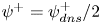 $\psi ^+ = \psi ^+_{dns}/2$ and
 $\psi ^+ = 0$, and the differences were found to be negligible. Hence, there is really only a one-parameter family of possible turbulent flows to explore with the model, and for simplicity,
 $\psi ^+$ is set to zero. Accordingly, (2.8) reduces to
 \begin{equation} \tau_{tot} = - \tau_{turb}. \end{equation}
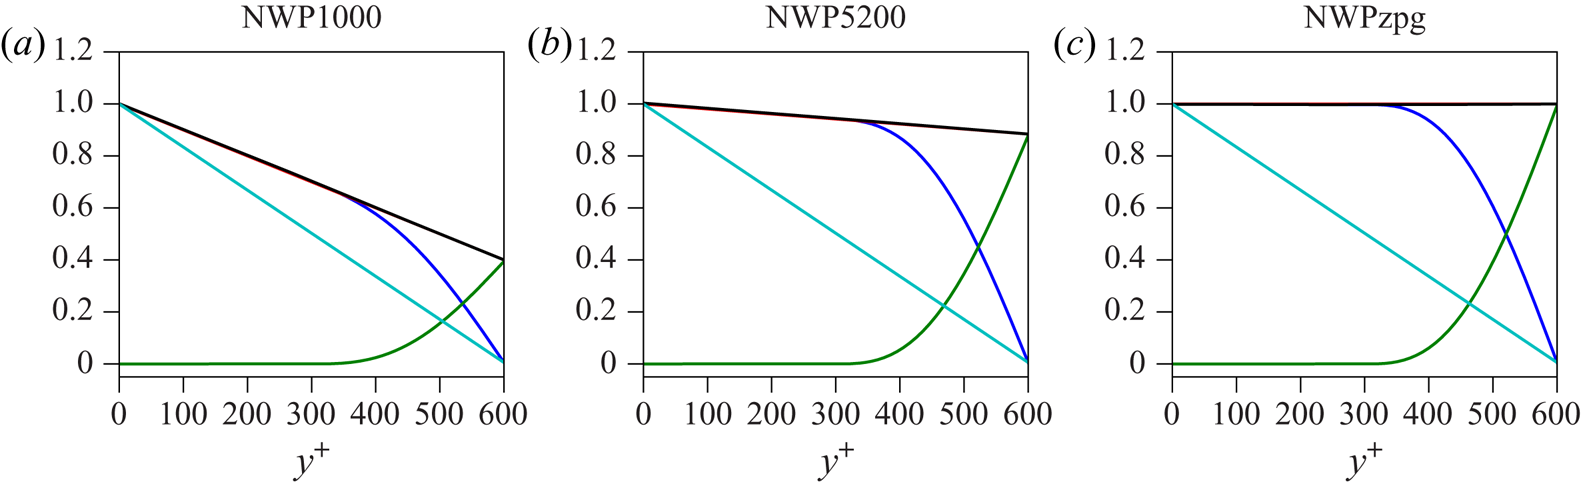
Figure 3 illustrates the statistically converged stress balances for these model cases. Included in the figure is a stress profile resulting from simulating the equations of motion (2.1) without the extra momentum flux provided by the auxiliary pressure gradient  $f$ (the cyan curve). In that case, a similar analysis to that shown in (2.5)–(2.7) above shows that the statistically converged stress profile is simply a linear function with values
 $\tau ^+_w=1$ and
 $\psi ^+$ at
 $y^+=0$ and
 $y^+=L_y^+$, respectively. It is clear that this stress profile is in poor agreement with the target profiles (2.9), which is to be expected, since
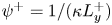 $\psi ^+ = 1/(\kappa L^+_y)$ in the log region. Moreover, this discrepancy increases with decreasing
 $\textrm {d} P^+/\textrm {d} x^+$ (corresponding to increasing
 $Re_{\tau }$ when comparing to a channel flow), illustrating the utility of including the extra momentum flux provided by the auxiliary forcing term
 $f$.
Blue: model total stress  $\tau ^+_{{model}}(y^+)=\partial U^+/\partial y^+ - \left \langle u'v' \right \rangle ^+$; red: target total stress
 $\tau _{target}^+=1 + y^+\,\textrm {d} P^+/\textrm {d} x^+$; green: primitive
 $F^+(y^+)$ of forcing function
 $f^+$; black:
 $\tau ^+_{{model}}(y^+) + F^+(y^+)$; cyan: total stress for a simulation without the forcing function
 $f^+$; for all the three model cases listed in table 1.

2.5. Computational parameters
The remaining model parameters, consistent for all simulation cases, are summarized in table 2. The size of the rectangular domain  $\varOmega$ is taken to be
 $L_x^+ = L_z^+ = 1500$ and
 $L_y^+ = 600$; these values, while somewhat arbitrary, were determined through a combination of numerical experimentation and the spectral analysis of Lee & Moser (Reference Lee and Moser2019). Their work suggests that the contributions to the turbulent kinetic energy from modes with wavelengths
 $\lambda ^+ < 1000$ are universal and
 $Re_{\tau }$-independent in a region below a wall-normal distance of approximately
 $y^+ = 300$. Accordingly,
 $L_y^+ = 2\cdot 300=600$ is chosen to allow for a sufficiently large fringe region to mollify the effect of the non-physical computational boundary at
 $y=L_y$ (see figure 2), and both
 $L_x^+$ and
 $L_z^+$ are taken to be at least 1000.
Summary of simulation parameters consistent for all simulation cases;  $\psi$ is the prescribed value for the Neumann boundary condition in (2.1).
 $N_x$ and
 $N_z$ refer to the number of Fourier modes, while
 $N_y$ is the number of B-spline collocation points.
 ${\rm \Delta} x = L_x/N_x$ and similarly for
 ${\rm \Delta} z$.
 ${\rm \Delta} y_w$ is the collocation point spacing at the wall.

For the domain size in the stream/spanwise directions, there generally is a balance between computational cost and the accuracy of the model, as defined by a comparison of the model's energy spectral density with that of large-scale DNS. In particular, a variety of domain sizes were tested, ranging from  $L_x^+=L_z^+=1000$ to approximately
 $3500$. Increasing
 $L_x$ and
 $L_z$ results in better agreement of the model's low-wavenumber, large-scale portion of the energy spectral density with the corresponding portion computed from DNS. The high-wavenumber, small-scale portion of the model's energy density, however, was insensitive to the domain size, so long as
 $L_x$ and
 $L_z$ were not taken to be too close to
 $L_x^+=L_z^+=1000$. In particular,
 $L_x^+=L_z^+=1500$ was found to be the smallest domain size capable of reproducing the universal small scales discussed in § 3.3.
Given some target turbulent flux of mean momentum  $\tau _{turb}$, the auxiliary forcing
 $f$ must satisfy (2.2), but it is otherwise unconstrained. For the simulations reported here,
 $f$ is defined explicitly to be
 \begin{equation} f(y) = \begin{cases} 4\tau_{turb}/L_y^4 \left(L_y-2y\right)^2 \left(5L_y-4y\right), & y \in [L_y/2,L_y] \\ 0, & y \in [0,L_y/2], \end{cases} \end{equation}
which was chosen to satisfy  $f(L_y/2) = f'(L_y/2) = f'(L_y) = 0$. In particular the constraint
 $f'(L_y/2)=0$ is important so that the transition in forcing from the near-wall region to the fringe region is smooth. Other functional forms of
 $f$, however, are of course possible. In particular a quadratic profile satisfying (2.2) and
 $f(L_y/2)=f'(L_y/2)=0$ was tested, and no detectable changes in the statistics in the near-wall region
 $y^+\in [0,300]$ were found.
2.6. Numerical implementation and resolution
The model (2.1) is solved numerically using the velocity–vorticity formulation due to Kim, Moin & Moser (Reference Kim, Moin and Moser1987). The equations of motion are discretized with a Fourier–Galerkin method in the stream/spanwise directions and a seventh-order B-spline collocation method in the wall-normal direction (Kwok, Moser & Jiménez Reference Kwok, Moser and Jiménez2001; Botella & Shariff Reference Botella and Shariff2003; Lee & Moser Reference Lee and Moser2015). They are integrated in time with a low-storage, third-order Runge–Kutta method that treats diffusive and convective terms implicitly and explicitly, respectively (Spalart, Moser & Rogers Reference Spalart, Moser and Rogers1991). The numerical resolution in both space and time is consistent with that of DNS. The number of Fourier modes, and hence the numerical resolution, used in each simulation is listed in table 2, and can be compared with, for instance, table 1 in Lee & Moser (Reference Lee and Moser2015). In addition, the collocation point spacing in the wall-normal direction is similar to previous DNS studies; the total number of collocation points  $N_y$ is taken to be equal to the number of collocation points below
 $y^+ = 600$ in Lee & Moser (Reference Lee and Moser2015). They are then distributed in the near-wall region according to the same (shifted and rescaled) stretching function.
The model is implemented with a modified version of the PoongBack DNS code (Lee, Malaya & Moser Reference Lee, Malaya and Moser2013; Lee et al. Reference Lee, Ulerich, Malaya and Moser2014), and the initial condition is taken from a restart file from a DNS run that is truncated to fit in  $\varOmega$ at the resolutions listed in table 2 and modified to satisfy the boundary conditions 2.1.
2.7. Statistical convergence
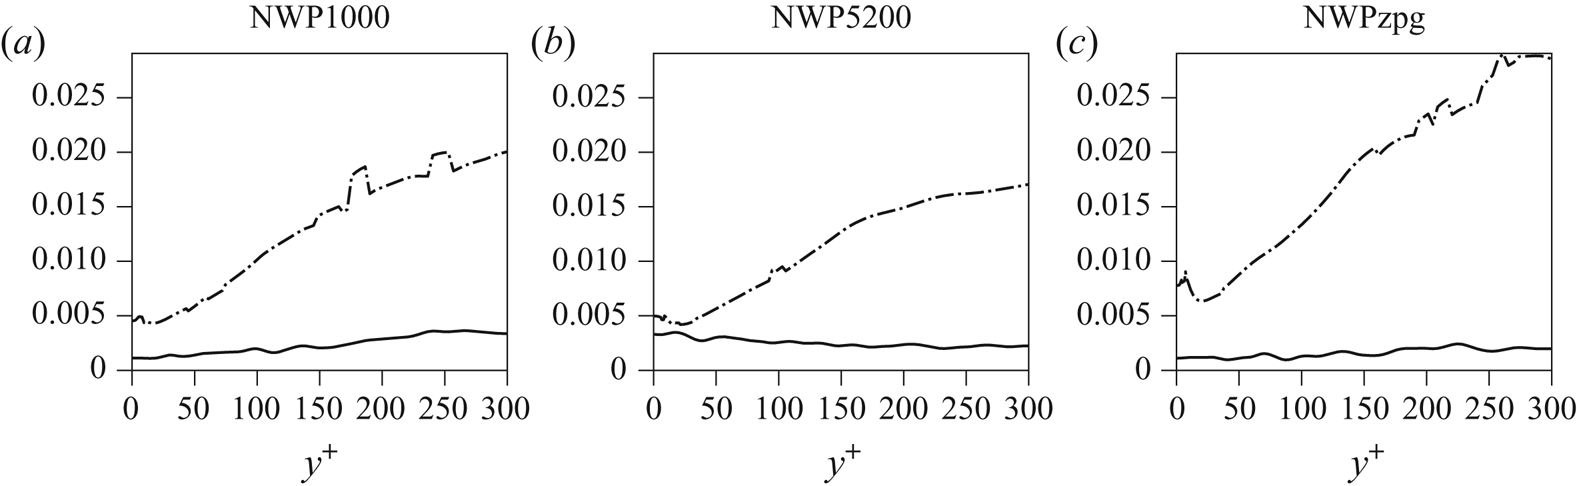
The method of Oliver et al. (Reference Oliver, Malaya, Ulerich and Moser2014) is used to assess the uncertainty in the statistics reported due to sampling noise. For each pressure-gradient case, statistics are collected by averaging in time until the estimated statistical uncertainty in the mean stress profiles is less than a few per cent. For the cases in table 2 reported here, the sampling error is less than three per cent, as shown in figure 4.
Statistical convergence for the model cases listed in table 2 – solid lines: absolute error  $|\tau ^+_{{model}}(y^+) - \tau _{target}(y^+)|$, where
 $\tau ^+_{{model}} = \partial U^+/\partial y^+ - \left \langle u'v' \right \rangle ^+$ and
 $\tau ^+_{target} = 1 + y^+ \,\textrm {d} P^+/\textrm {d} x^+$; dash-dotted lines: standard deviation of the estimated statistical error for
 $\tau ^+_{{model}}$ in the region
 $y^+\in [0,300]$.

3. Numerical results
The NWP model can be interpreted in two ways. In the first, one considers it to be a model for the small-scale near-wall turbulence in a wall-bounded flow with mean pressure gradient in wall units the same as the imposed pressure gradient in the model. In this case, one aspires to have the statistics from the model and the real flow match for quantities that are insensitive to the unrepresented large scales or for the statistics of the small scales computed from a low-pass filter as in Lee & Moser (Reference Lee and Moser2019). This is the interpretation explored in the results reported here. In the second interpretation, the NWP model represents small-scale near-wall turbulence in a region of a real wall-bounded turbulent flow with local pressure gradient in wall units based on the local wall shear stress the same as that imposed in the model. In this case, the NWP model is analogous to the universal signal of Mathis et al. (Reference Mathis, Hutchins and Marusic2011), representing the process that is modulated by large-scale outer-layer fluctuations in a real turbulent flow. These interpretations are clearly complementary, and both should be valid given the scale-separation assumptions on which the model is predicated.
The statistics reported here were computed from the three near-wall patch model cases NWP1000, NWP5200 and NWPzpg. The first two are so named because the imposed favourable pressure gradient in these cases is the same in wall units as the mean pressure gradient in a fully developed channel flow with friction Reynolds number  $Re_\tau =1000$ and 5200. For NWPzpg, the imposed pressure gradient is zero. To assess the quality of the NWP, statistics from the model will be compared to those from the channel flow DNS of Lee & Moser (Reference Lee and Moser2015, Reference Lee and Moser2019) at
 $Re_{\tau }=1000$ and
 $Re_{\tau }=5200$–referred to below as LM1000 and LM5200 (statistics at https://turbulence.ices.utexas.edu), and the zero pressure turbulent boundary layer DNS of Sillero et al. (Reference Sillero, Jiménez and Moser2013), Borrell, Sillero & Jiménez (Reference Borrell, Sillero and Jiménez2013) and Simens et al. (Reference Simens, Jiménez, Hoyas and Mizuno2009) at
 $Re_\tau =2000$, which is referred to below as SJM2000 (statistics at https://torroja.dmt.upm.es/turbdata/blayers/high_re/). So, comparisons are being made to flows in which the mean pressure gradient is the same in wall units as the imposed pressure gradient in the NWP models. However, many wall shear flows can have the same
 $\partial P^+/\partial x^+$. For example, the NWP1000 and NWP5200 cases could equally well be associated with favourable-pressure-gradient boundary layers and the NWPzpg case has imposed pressure gradient consistent with an infinite Reynolds number channel. Note that there is streamwise evolution of the mean wall shear stress in SJM2000, which is not the case in the channel flow cases. The comparison here is hence predicated on this evolution occurring over scales that are asymptotically large relative to the viscous scale, which indeed is the case.
3.1. Mean velocity and shear stresses
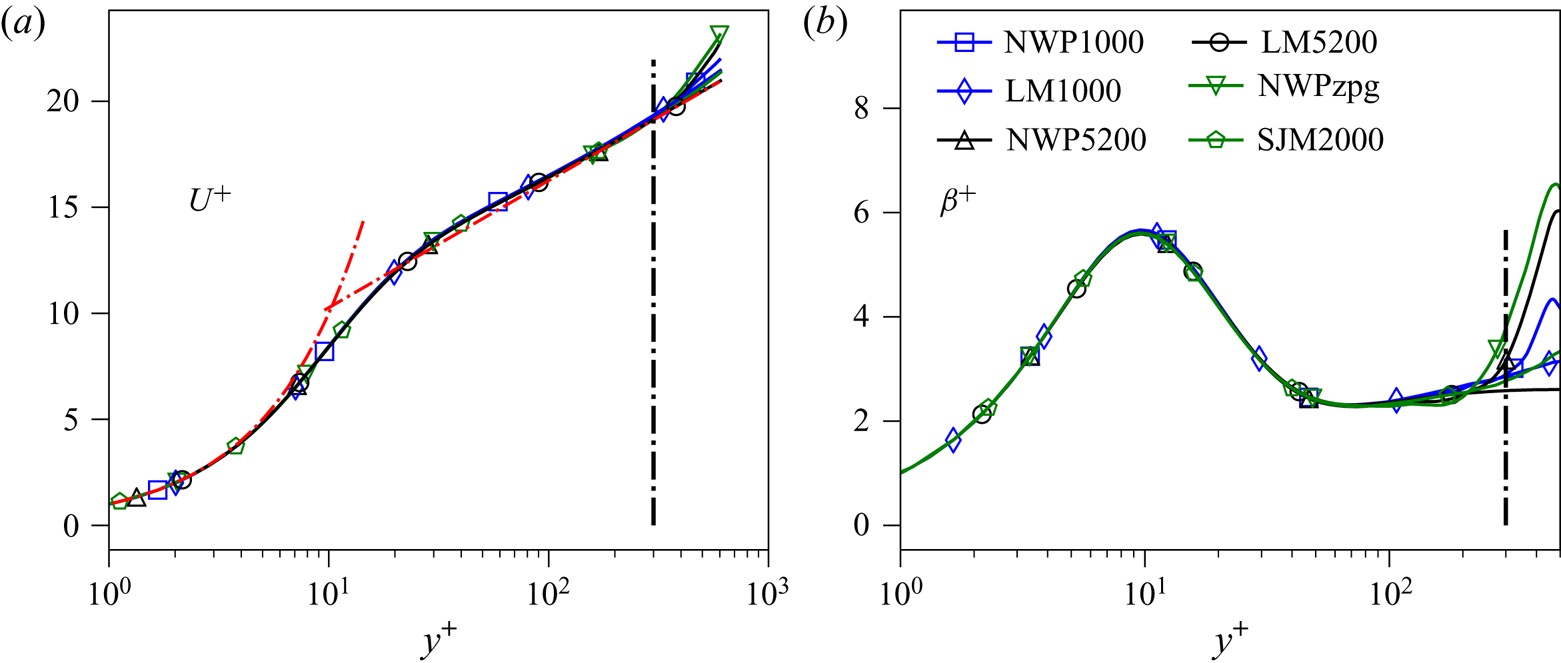
If the near-wall turbulence fluctuations represented in the NWP model dominate the Reynolds stress, as is expected from the spectral analysis of Lee & Moser (Reference Lee and Moser2019), then the mean velocity in the NWP should match that in a full turbulent flow. Figure 5 demonstrates that this is indeed the case. The relative error in  $U^+$ is less than
 $0.6\,\%$ for
 $y^+ \in [0,300]$, and the error is similarly small for the log-law indicator function
 $\beta ^+$
 \begin{equation} \beta^+(y^+) := y^+ \frac{\partial U^+}{\partial y^+} \end{equation}
in the range  $y^+\in [0,100]$. However, there is mild disagreement of
 $\beta$ in the range
 $y^+ \in [100,300]$. As expected, the profiles diverge for
 $y^+>300$. The NWP model's Reynolds shear stress
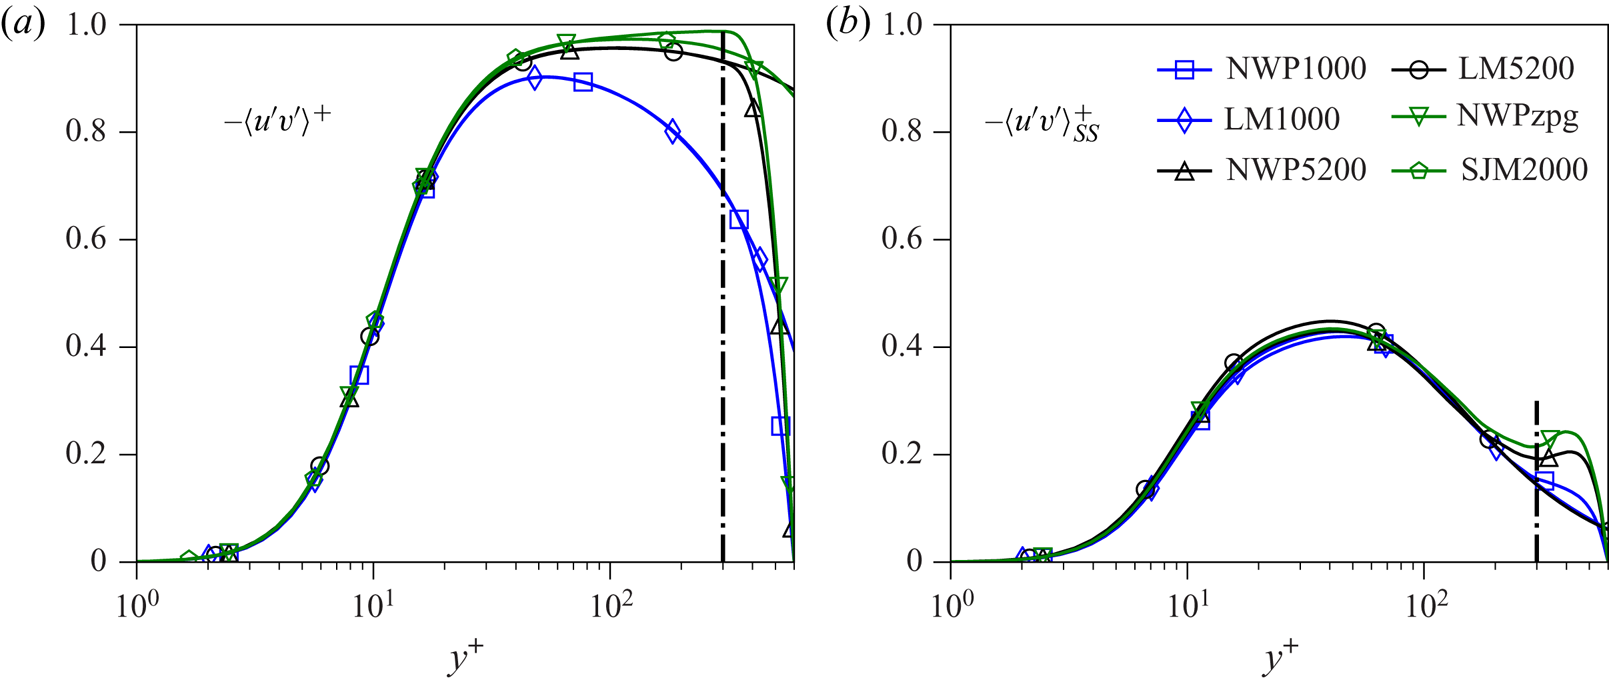
 $\left \langle u'v' \right \rangle$ is in excellent agreement with that of the DNS in the region
 $y^+\in [0,300]$, as expected given the agreement of the mean velocity; see figure 6. For the channel cases, the error is less than
 $0.5\,\%$, and for the zero-pressure-gradient case the error is below
 $4\,\%$. In the former, the total stress at
 $y=L_y$ is known analytically as
 $\tau ^+_{tot} = 1 + L_y^+ \,\textrm {d} P^+/\textrm {d} x^+$ and is used to define
 $f(y)$ in (2.2), (2.8), and (2.9). In the latter, the same relations are used, though they are approximate due to the streamwise growth of the near wall layer in a boundary layer. This may explain the relatively larger discrepancy between the
 $\left \langle u'v' \right \rangle$ profiles for the boundary layer. In both instances, recall that
 $\left \langle u'v' \right \rangle$ necessarily vanishes at the upper computational boundary as a consequence of the boundary condition
 $v=0$ in (2.1). The accuracy of the Reynolds shear stress profiles in spite of this condition demonstrates the utility of the forcing function
 $f$ in enabling momentum transport to the near wall region
 $y^+\in [0,300]$.
Mean velocity  $U^+$ (a) and the indicator function
 $\beta ^+ = y^+ \partial _{y^+} U^+$ (b) versus
 $\log (y^+)$. The black dashed-dotted vertical line marks
 $y^+=300$, and the red dashed-dotted lines plot the law of the wall
 $U^+=y^+$ and
 $U^+ = (1/\kappa )\log (y^+) + B$, where
 $\kappa = 0.384$ and
 $B = 4.27$ (Lee & Moser Reference Lee and Moser2015).


3.2. Energy spectral density
For two points  $(x,y,z),(x',y,z') \in \mathbb {R}\times [0,2\delta ]\times \mathbb {R}$ in an infinitely long channel, define the separation distances
 $r_x = x-x'$ and
 $r_z = z-z'$. For a turbulent flow that is statistically homogeneous in the stream and spanwise directions, the two point correlation tensor
 \begin{equation} {\mathsf{R}}_{ij}(r_x,y,r_z) := \left\langle u_i'(x+r_x,y,z+r_z) u_j'(x,y,z) \right\rangle \end{equation}
is a function only of  $r_x$,
 $y$ and
 $r_z$. Taking the Fourier transform of (3.2) in the variables
 $r_x$ and
 $r_z$ defines the spectral density
 ${\mathsf{E}}_{ij}(k_x, y, k_z)$, which encodes the average contribution to the Reynolds stress tensor from different length scales as a function of the wall-normal variable
 $y$. The Reynolds stress tensor can be recovered by taking the limit
 $(r_x,r_z) \to (0,0)$ in (3.2), or by integrating the spectral density over all wavenumbers
 \begin{equation} \left\langle u_i'u_j' \right\rangle(y) = \int\int {\mathsf{E}}_{ij}(k_x,y,k_z)\,\textrm{d} k_x \,\textrm{d} k_z . \end{equation}
For a wall-bounded flow in a full size domain, the low-wavenumber contributions to the Reynolds stress represent the mean influences of the large-scale structures on the near-wall dynamics. As is well known (Hutchins & Marusic Reference Hutchins and Marusic2007; Marusic et al. Reference Marusic, Mathis and Hutchins2010a; Lee & Moser Reference Lee and Moser2017; Samie et al. Reference Samie, Marusic, Hutchins, Fu, Fan, Hultmark and Smits2018; Lee & Moser Reference Lee and Moser2019), these low-wavenumber features of the near-wall flow depend on  $Re_{\tau }$. In contrast, there is evidence that the high-wavenumber (small-scale) contributions to the Reynolds stress profiles are universal and independent of
 $Re_{\tau }$ (Samie et al. Reference Samie, Marusic, Hutchins, Fu, Fan, Hultmark and Smits2018; Lee & Moser Reference Lee and Moser2019). By design, the NWP model's domain size does not allow accurate representation of the very large-scale structures known to exist in the near-wall region, and thus one cannot expect to capture their influence on the near-wall velocity fluctuations. Instead, one expects the NWP model to correctly capture the dynamics of the universal small scales elucidated by Samie et al. (Reference Samie, Marusic, Hutchins, Fu, Fan, Hultmark and Smits2018) and Lee & Moser (Reference Lee and Moser2019) associated with the autonomous cycle of Jiménez & Pinelli (Reference Jiménez and Pinelli1999).
To determine whether or not this is the case, the model's spectra  ${\mathsf{E}}_{ij}$ are compared to their DNS counterparts. The spectra are visualized in so-called log-polar coordinates (Lee & Moser Reference Lee and Moser2019), in which the wavenumber magnitude
 $k = \sqrt {k_x^2 + k_z^2}$ is represented on a logarithmic scale. For fixed wall-normal location, the log-polar coordinates are defined as
 \begin{equation} \left.\begin{gathered} k_x^{\#} := \frac{k_x}{k} \log_{10}\left(\frac{k}{k_{{ref}}}\right), \\ k_z^{\#} := \frac{k_z}{k} \log_{10}\left(\frac{k}{k_{{ref}}}\right), \end{gathered}\right\} \end{equation}
where  $k_{{ref}}$ is an arbitrary reference wavenumber that must be smaller than the smallest non-zero wavenumber included in the spectrum, taken here to be
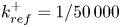 $k^+_{{ref}}=1/50\,000$. Two advantages of these coordinates are that lines of constant
 $k_z/k_x$ have slopes of
 $k_z/k_x$, and lines of constant magnitude
 $k$ map to circles. In this way, the orientation and alignments of the Fourier modes are easily interpreted; see Lee & Moser (Reference Lee and Moser2019) for a more detailed discussion. The two-dimensional spectral densities of the streamwise and wall-normal velocity variances are shown in figures 7 and 8, respectively. The spectra are visualized at the wall-normal locations
 $y^+ = 15$,
 $y^+=100$ and
 $y^+=300$ for the simulations NWP1000, NWP5200, LM1000 and LM5200.
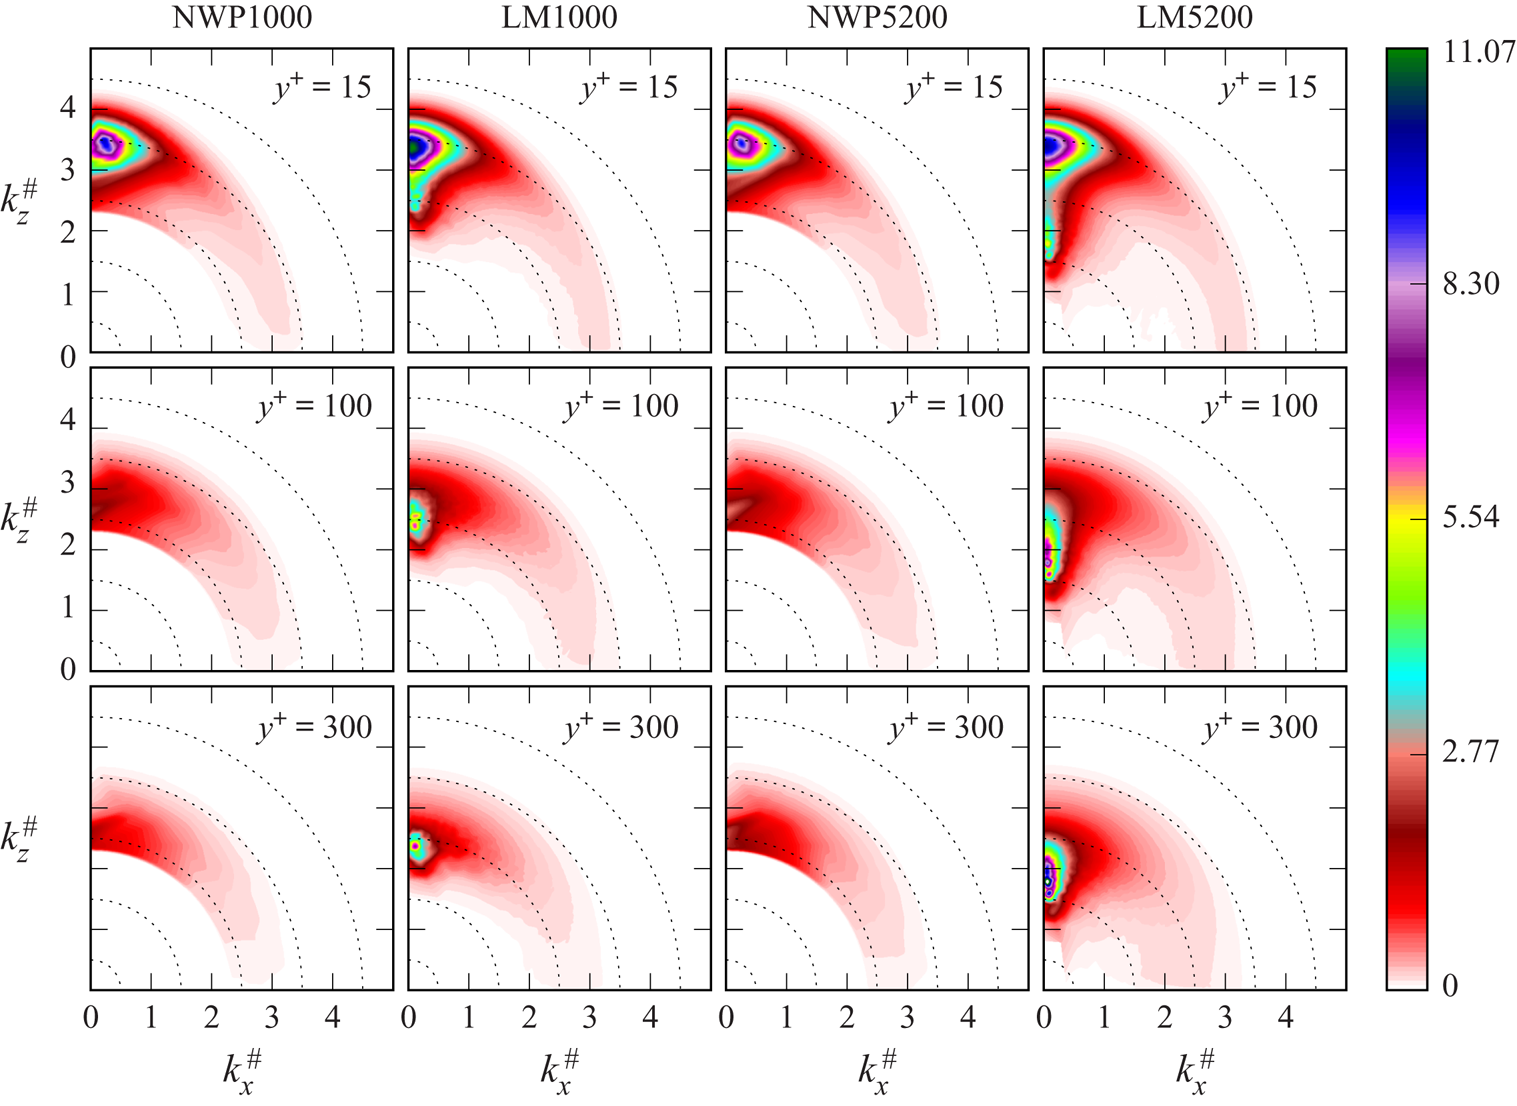
Two-dimensional spectra of the streamwise velocity variance  $\left \langle u'u' \right \rangle ^+$ in log-polar coordinates, as defined by (3.4).
 $\lambda ^+=10$ on the outermost dotted circle and increases by a factor of 10 for each dotted circle moving inward, where
 $\lambda = 2{\rm \pi} /k$ is the wavelength.

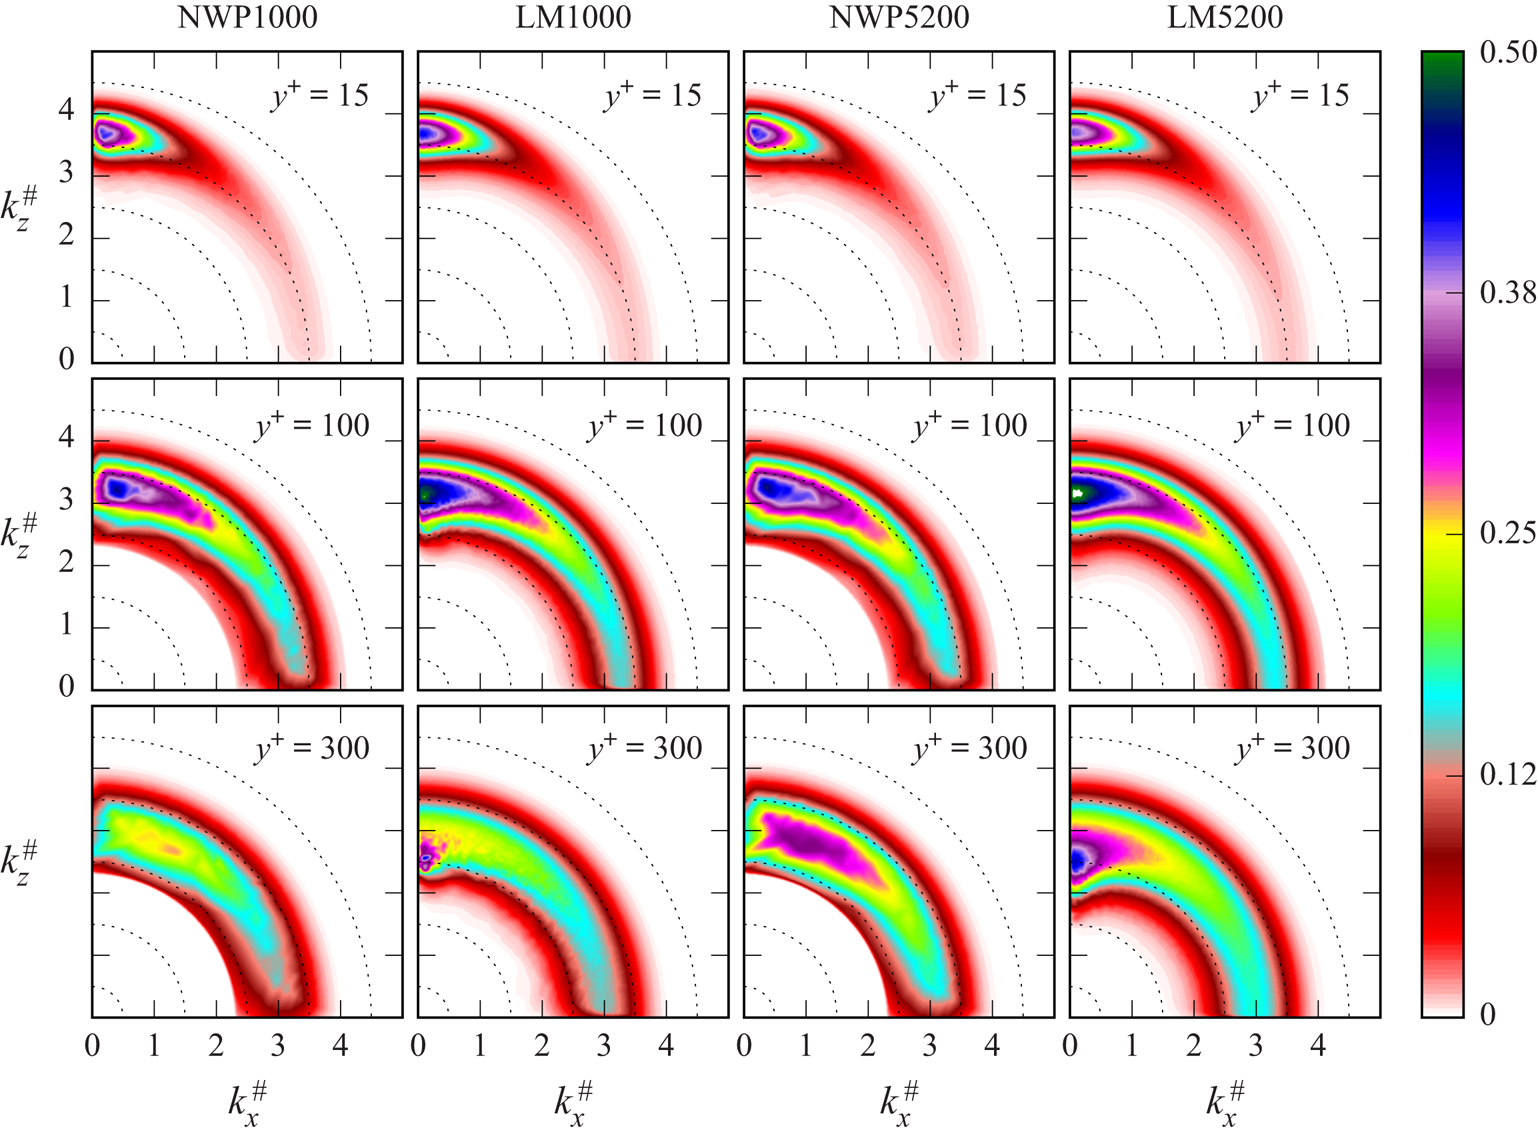
Two-dimensional spectra of the wall-normal velocity variance  $\left \langle v'v' \right \rangle ^+$ in log-polar coordinates, as defined by (3.4).
 $\lambda ^+=10$ on the outermost dotted circle and increases by a factor of 10 for each dotted circle moving inward, where
 $\lambda = 2{\rm \pi} /k$ is the wavelength.

In each of the cases, the streamwise velocity spectra  $E_{11}$ consist primarily of energy concentrated along the
 $k_z^{\#}$ axis, with Fourier modes for which
 $k_z/k_x \gtrsim 10$ (Lee & Moser Reference Lee and Moser2019). These correspond to structures that are strongly elongated in the streamwise
 $x$-direction, such as the well-known, near-wall low- and high-speed streaks. The channel flow data LM1000 and LM5200 (columns two and four in figure 7) show that this energy exhibits two distinct features. The first is an ‘inner energy site’ (Samie et al. Reference Samie, Marusic, Hutchins, Fu, Fan, Hultmark and Smits2018), a triangular shaped region in the near-wall layer
 $y^+\approx 15$ distributed primarily between wavelengths
 $\lambda ^+ = 100$ and
 $\lambda ^+ = 1000$ that can be attributed to the autonomous near-wall dynamics described by Hamilton et al. (Reference Hamilton, Kim and Waleffe1995), Jeong et al. (Reference Jeong, Hussain, Schoppa and Kim1997) and Jiménez & Pinelli (Reference Jiménez and Pinelli1999) and others. The model
 $E_{11}$ spectra, shown in columns one and three in figure 7, qualitatively reproduce the inner energy site, suggesting that it captures the dynamics of the near-wall, small-scale energetic motions.
The second feature is a concentration of energy at relatively low wavenumbers (in the range  $1000 < \lambda ^+ < 10\,000$) along the
 $k_z^{\#}$ axis at each of the wall-normal locations
 $y^+=15$,
 $y^+=100$, and
 $y^+=300$. These are due to the very large-scale motions (VLSMs) imposed from the outer-layer flow described by Hutchins & Marusic (Reference Hutchins and Marusic2007) and Marusic et al. (Reference Marusic, Mathis and Hutchins2010a). These VLSMs contribute energy in the near-wall region around
 $y^+=15$, and farther away from the wall they are responsible for the majority of the turbulent kinetic energy. As both
 $y^+$ and
 $Re_{\tau }$ increase, the energy becomes more concentrated and is found at larger wavelengths, consistent with the attached eddy hypothesis of Townsend (Reference Townsend1976). In addition, the VLSMs modulate the near-wall cycle through nonlinear interactions, creating large-scale variations in the local wall shear stress that result in local variations in the dominant (most-energetic) wavelength (Lee & Moser Reference Lee and Moser2019). Consequently, the spectral peak of the inner energy site for the DNS data is reduced and ‘smeared out’ as a function of
 $Re_{\tau }$. For example, the
 $Re_{\tau }=5200$ peak is
 ${\sim }10\,\%$ lower than the
 $Re_{\tau }=1000$ peak.
By design, the NWP model can only support modes with wavelengths less than or equal to  $L_x^+ = L_z^+ = 1500$, meaning the VLSMs present in real wall-bounded turbulence are not represented by the model. As a result, there is no energy associated with such large-scale structures; the concentration of energy at low wavenumbers along the
 $k_z^{\#}$ axis (corresponding to wavelengths
 $\lambda ^+\gtrsim 1000$) present in the DNS spectra is not present in that of the model. This is true both in the near-wall region and farther away from the wall at
 $y^+=100$ and
 $y^+=300$.
Furthermore, the NWP model does not capture the nonlinear modulations of the autonomous cycle by the VLSMs. For instance, even though the model represents wavenumbers along the  $\lambda ^+=1000$ band, its spectra is not simply a spectral truncation of the DNS spectra. Additionally, the peak of the inner energy site is nearly identical for the two model cases, differing by only a few per cent. These differences between spectra of the model and DNS highlight the important role the VLSMs play in the turbulent near-wall layer.
The  $E_{22}$ spectra are largest in the wavenumber regions in which the
 $E_{11}$ spectra are peaked, as discussed in Lee & Moser (Reference Lee and Moser2019). Additionally, the distribution of energy generally becomes more isotropic with increasing wall-normal distance
 $y^+$. Figure 8 shows that the DNS energy density
 $E_{22}$ is primarily, but not exclusively, located at the small scales, i.e. at wavenumbers
 $\lambda ^+<1000$. Because the NWP model adequately resolves such structures, its energy density
 $E_{22}$ is in overall good agreement with the DNS spectra, especially in the near-wall region. Farther away from the wall the agreement is not as good since the DNS spectra are peaked at lower wavenumbers. Accordingly, the model's unfiltered
 $\left \langle v'v' \right \rangle$ profiles shown in figure 10 show excellent agreement with the corresponding DNS profiles in region
 $y^+ \in [0,300]$; they are nearly identical for
 $y^+ \lesssim 50$ and only display slight discrepancies for
 $y^+ \in [50,300]$.
Lastly, the fidelity of the NWP model's energy density  $E_{33}$ (not shown) in reproducing the DNS spectra is similar to the
 $E_{11}$ spectra. It clearly approximates the small scales in the near-wall region well, but it fails to capture the modulation by the large-scale structures at each wall-normal location.
3.3. Universality of small scales
To better quantify the universality of the small scales and assess the NWP model's ability to reproduce them, the energy spectral density is high-pass filtered and then integrated to measure the energy residing in the small scales. Let  $\mathcal {K}$ denote the set of wavenumbers supported by a simulation, and let
 $k_{cut} = 2{\rm \pi} /\lambda _{cut}$ with
 $\lambda ^+_{cut} = 1000$. Define
 $\mathcal {K}_{SS}$ to be the subset of
 $\mathcal {K}$ with the property that
 $(k_x,k_z) \in \mathcal {K}_{SS}$ if
 \begin{equation} \min\{|k_x|,|k_z|\} >k_{cut}, \end{equation}
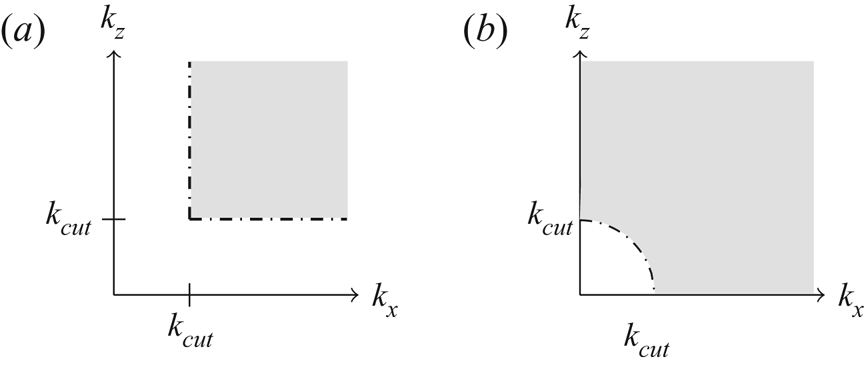
visualized in figure 9(a). The  $\mathcal {K}_{SS}$ sets are meant to contain large wavenumbers associated with the universal small scales. Here
 $k_{cut}$ is chosen based on the two-dimensional spectra in Lee & Moser (Reference Lee and Moser2019), where it is observed that the energy associated with the autonomous cycle has
 $\lambda ^+ < 1000$.
(a) The shaded grey region indicates the subset (in the first quadrant) of wave space  $\mathcal {K}_{SS}$ defined by (3.5). (b) The corresponding region defined instead by the circular,
 $L^2$ filter (3.6) used in Lee & Moser (Reference Lee and Moser2019).

Note the high-pass filter (3.5) is slightly different than the  $L^2$ filter
 \begin{equation} \sqrt{k_x^2 + k_z^2} > k_{cut} \end{equation}
used in Lee & Moser (Reference Lee and Moser2019) and visualized in figure 9(b). In particular, the wavenumbers on the axis  $k_x=0$ (respectively
 $k_z=0$) with
 $k_z > k_{cut}$ (resp.
 $k_x > k_{cut}$) are filtered out by (3.5) but not by (3.6). These axes contain the NWP model's approximation to the large-scale motions present in a DNS that do not ‘fit’ in the NWP domain. Such motions correspond to wavenumbers smaller than
 $2{\rm \pi} /L_x = 2{\rm \pi} /L_z$, and they are not well represented by the NWP model. Hence, they are filtered out by (3.5). The approximation can be improved by increasing
 $L_x$ and
 $L_z$ (confirmed by numerical tests), although this of course increases the model's overall computational cost.
Given  $\mathcal {K}$ and
 $\mathcal {K}_{SS}$, the Reynolds stresses are
 \begin{equation} \left\langle u_i'u_j' \right\rangle(y) = \sum_{(k_x,k_z)\in\mathcal{K}} {\mathsf{E}}_{ij}(k_x,y,k_z), \end{equation}
and the small-scale energy can be quantified as
 \begin{equation} \left\langle u_i'u_j' \right\rangle_{SS}(y) = \sum_{(k_x,k_z)\in\mathcal{K}_{SS}} {\mathsf{E}}_{ij}(k_x,y,k_z). \end{equation}
The velocity covariance  $\left \langle u'v' \right \rangle$ and variances
 $\left \langle u'_{\alpha }u'_{\alpha } \right \rangle$,
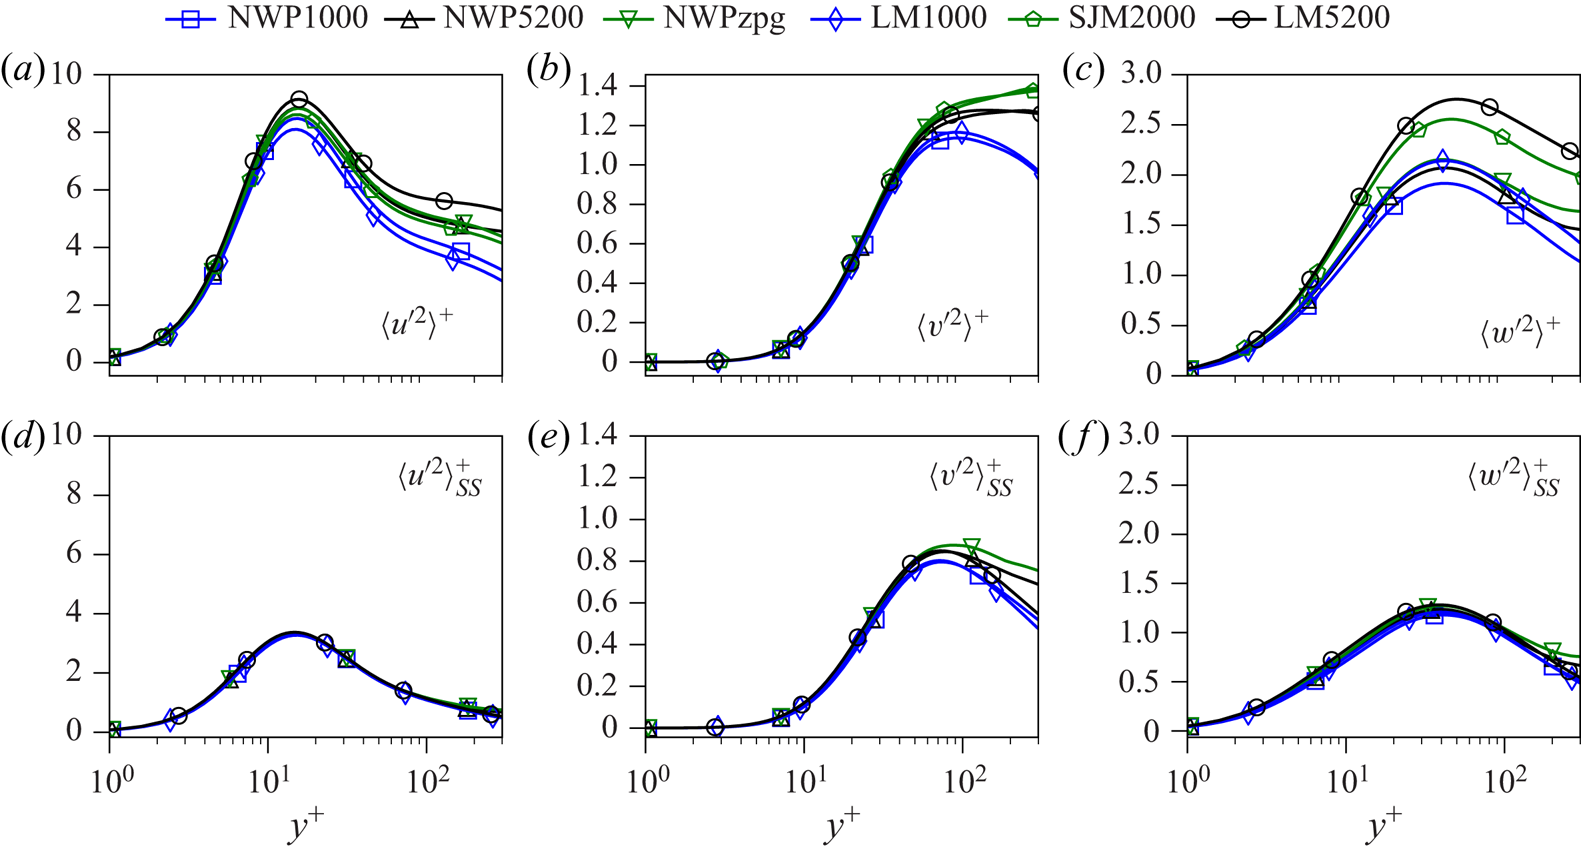
 $\alpha =1,2,3$ and their high-pass filtered counterparts are shown in figures 6 and 10, respectively. As previously mentioned, the model's unfiltered
 $\left \langle u'v' \right \rangle$ and
 $\left \langle v'v' \right \rangle$ profiles both agree quite well with the corresponding DNS profiles. The model's streamwise and spanwise velocity variances, however, display non-trivial discrepancies with the DNS profiles, as expected from the observed differences in the two-dimensional spectra. In contrast, the model's high-pass filtered profiles all show agreement with the high-pass filtered DNS quantities. In all cases the agreement is excellent in the region
 $y^+\in [0,100]$, although there are some relatively mild discrepancies for
 $y^+\in [100,300]$. Moreover, it is clear that the high-pass filtered quantities are nearly
 $Re_{\tau }$ independent; the collapse of the
 $\left \langle u'u' \right \rangle _{SS}$ profiles is particularly convincing. Although two-dimensional spectra data is not available for the zero-pressure-gradient DNS case SJM2000, the
 $\left \langle u_i'u_j' \right \rangle _{SS}$ profiles computed from the model simulation NWPzpg are included for completeness; they display the same universal behaviour as the favourable-pressure-gradient flows. These observations lend support to the conclusion that the small scales in the near-wall region are universal, and that the difference in the Reynolds stress profiles as a function of
 $Re_{\tau }$ is due to the increasing influence of the VLSMs. Previous results of this type obtained in both Lee & Moser (Reference Lee and Moser2019) and Samie et al. (Reference Samie, Marusic, Hutchins, Fu, Fan, Hultmark and Smits2018) involve high-pass filtering the entire turbulent flow field, in which there are nonlinear interactions between wavenumbers across all the scales of motion. It is particularly remarkable, however, that the NWP model reproduces the universal behaviour of the small scales without the dynamic modulation of the near-wall autonomous cycle by the large-scale structures.
Velocity variances  $\left \langle u'_{\alpha }u'_{\alpha } \right \rangle ^+$ (a–c) and the corresponding high-pass filtered quantities
 $\left \langle u'_{\alpha }u'_{\alpha } \right \rangle ^+_{SS}$ (d–f) as a function of
 $\log (y^+)$.

3.4. Reynolds stress transport
The production of turbulent kinetic energy in a wall-bounded flow is primarily due to the large mean velocity gradient in the wall-normal direction  $\partial U/\partial y$. In a flow that is homogeneous in the stream/spanwise directions with
 $V=W=0$, the only
 $\left \langle u'_{\alpha }u'_{\alpha } \right \rangle$ term with a non-zero production is
 $\left \langle u'u' \right \rangle$; it is given by
 \begin{equation} \mathcal{P}_{11} = -2\frac{\partial U}{\partial y}\left\langle u'v' \right\rangle. \end{equation}
The two-dimensional spectra of  $\mathcal {P}_{11}$ are accordingly defined as
 \begin{equation} E_{11}^{\mathcal{P}}(k_x,y,k_z) := -2\frac{\partial U}{\partial y}(y) E_{12}(k_x,y,k_z). \end{equation}
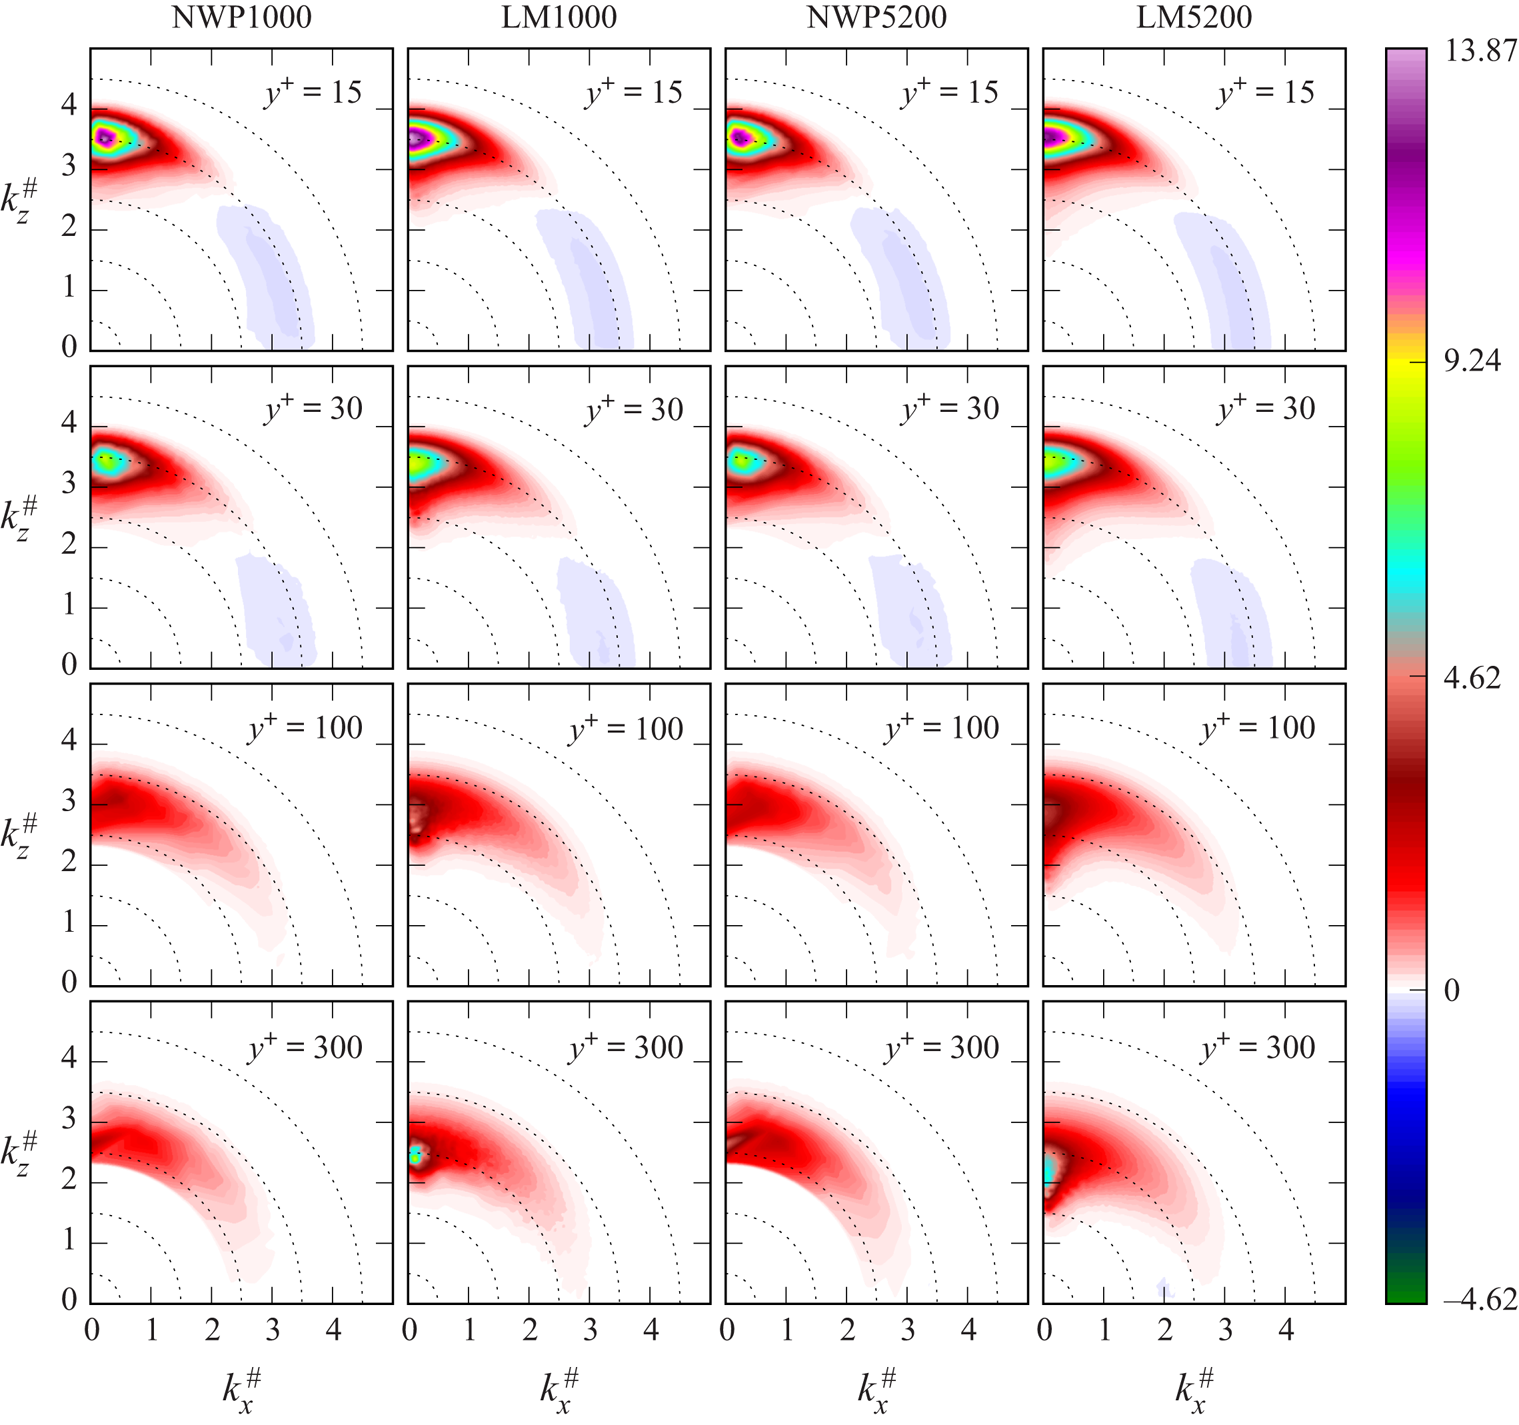
The spectral analysis of channel flow data in Lee & Moser (Reference Lee and Moser2019) demonstrated that, in contrast to the near-wall energy spectra  $E_{11}$, the near-wall production spectra
 $E^{\mathcal {P}}_{11}$ contain only a high-wavenumber peak (see columns two and four in figure 11). It follows that the large scales in the near-wall region, and hence the energy that they contain, are due to energy transport (either in
 $y$ or in scale), rather than local production. This observation suggests that the NWP model should be able to capture the near-wall energy production, even though the VLSMs are not present. The production spectra shown in figure 11 show that this is indeed true. At both
 $y^+=15$ and
 $y^+=30$, the NWP1000 and NWP5200 spectra are qualitatively similar to that of DNS, including the regions of negative production occurring over a range of scales around
 $\lambda ^+=100$. Farther away from the wall, the large-scale structures increasingly influence the energy production, and their influence increases with
 $Re_{\tau }$. At
 $y^+=300$, the large-scale influences dominate the DNS production spectra, and the model is not able to reproduce such low-wavenumber features.
Two-dimensional, premultiplied spectra  $y^+ (E^{\mathcal {P}}_{11})^+$ in log-polar coordinates, as defined by (3.4).
 $\lambda ^+=10$ on the outermost dotted circle and increases by a factor of 10 for each dotted circle moving inward, where
 $\lambda = 2{\rm \pi} /k$ is the wavelength.

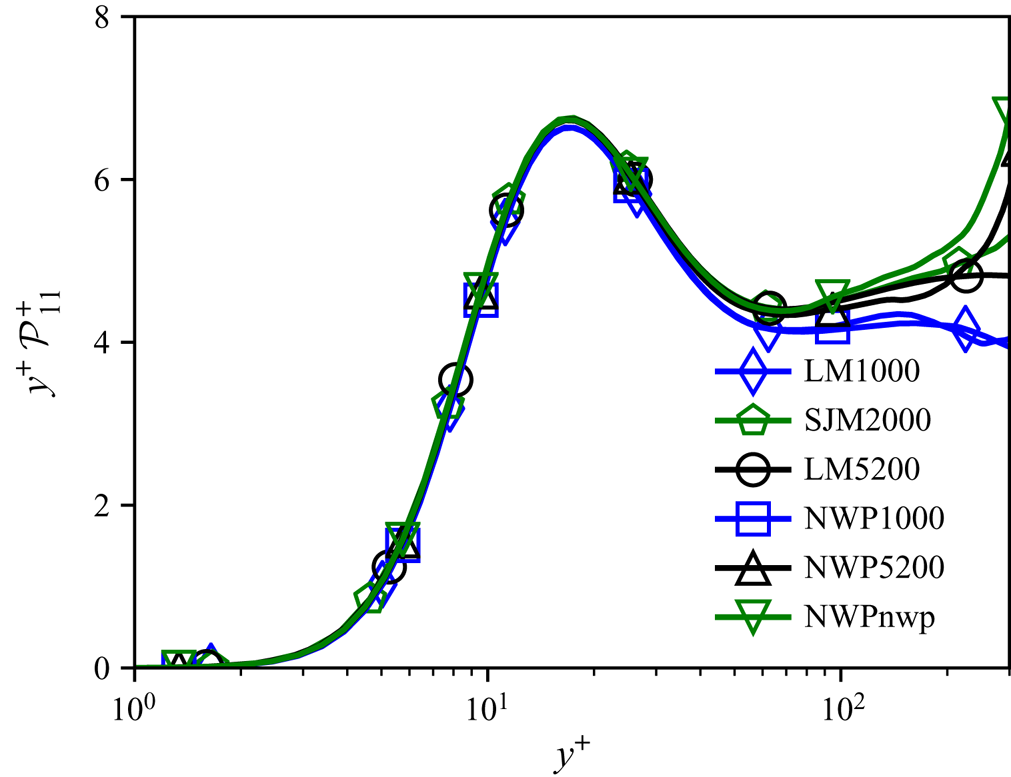
The one-dimensional, premultiplied production profiles are shown in figure 12, and they are consistent with the aforementioned observations regarding the two-dimensional spectra. The DNS profiles are approximately  $Re_{\tau }$-independent for
 $y^+\lesssim 70$, the corresponding model profiles show strong agreement for
 $y^+\lesssim 100$, and they begin to show modest discrepancies for
 $y^+\gtrsim 200$.
Profiles of the premultiplied  $\left \langle u'u' \right \rangle$ production
 $\mathcal {P}^+_{11}$ versus
 $\log (y^+)$ in the region
 $y^+\in [0,300]$.

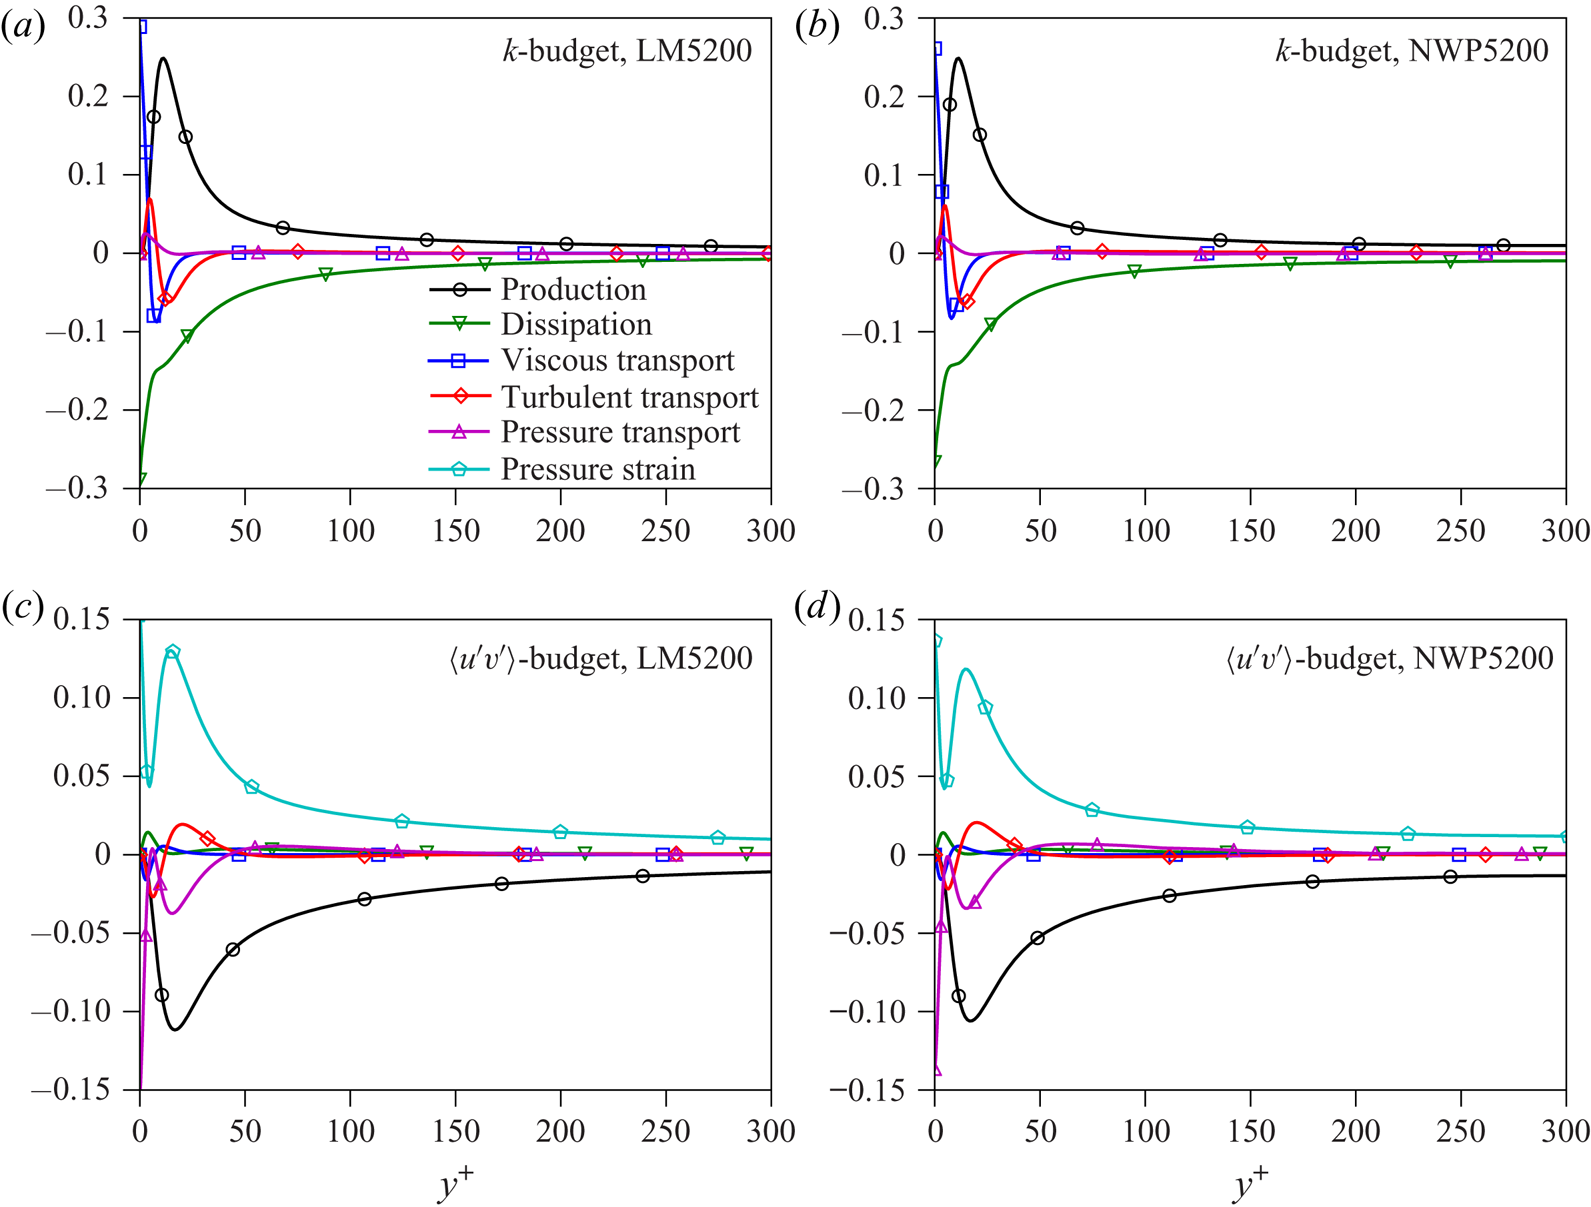
After being produced by the mean velocity gradient, turbulent kinetic energy is redistributed across scales and velocity components, transported both towards and away from the wall, and ultimately dissipated by viscosity. The relative strength, or importance, of these processes as a function of wall-normal distance can be measured by the terms in the Reynolds stress budget equation (Pope Reference Pope2000). Exhaustive analyses of the behaviour of these terms for wall-bounded flows can be found in Hoyas & Jiménez (Reference Hoyas and Jiménez2008), Richter (Reference Richter2015), Mizuno (Reference Mizuno2015, Reference Mizuno2016), Aulery et al. (Reference Aulery, Dupuy, Toutant, Bataille and Zhou2017) and Lee & Moser (Reference Lee and Moser2019) and other references therein. A general conclusion to be drawn from these works is that, similar to the production and velocity variances, the small-scale contributions to the terms in the budget equation are universal in the near-wall region, and differences in the profiles as a function of  $Re_{\tau }$ can be attributed to modulations by large-scale motions. As a consequence, the terms in the Reynolds stress budget equations evaluated in the NWP model are consistent with those in near-wall turbulence. For example, the terms in the turbulent kinetic energy and Reynolds shear stress budget equations are shown in figure 13 for both NWP5200 and LM5200. The precise definitions of the terms in figure 13 are standard, but for clarity they are specified in the appendix (A 1).
Budget equations of the turbulent kinetic energy 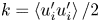 $k= \left \langle u_i'u_i' \right \rangle /2$ (a,b) and shear stress
 $\left \langle u'v' \right \rangle$ (c,d) for the largest Reynolds number cases LM5200 (a,c) and NWP5200 (b,d). The terms are defined in appendix (A 1).

3.5. Near-wall turbulence structure
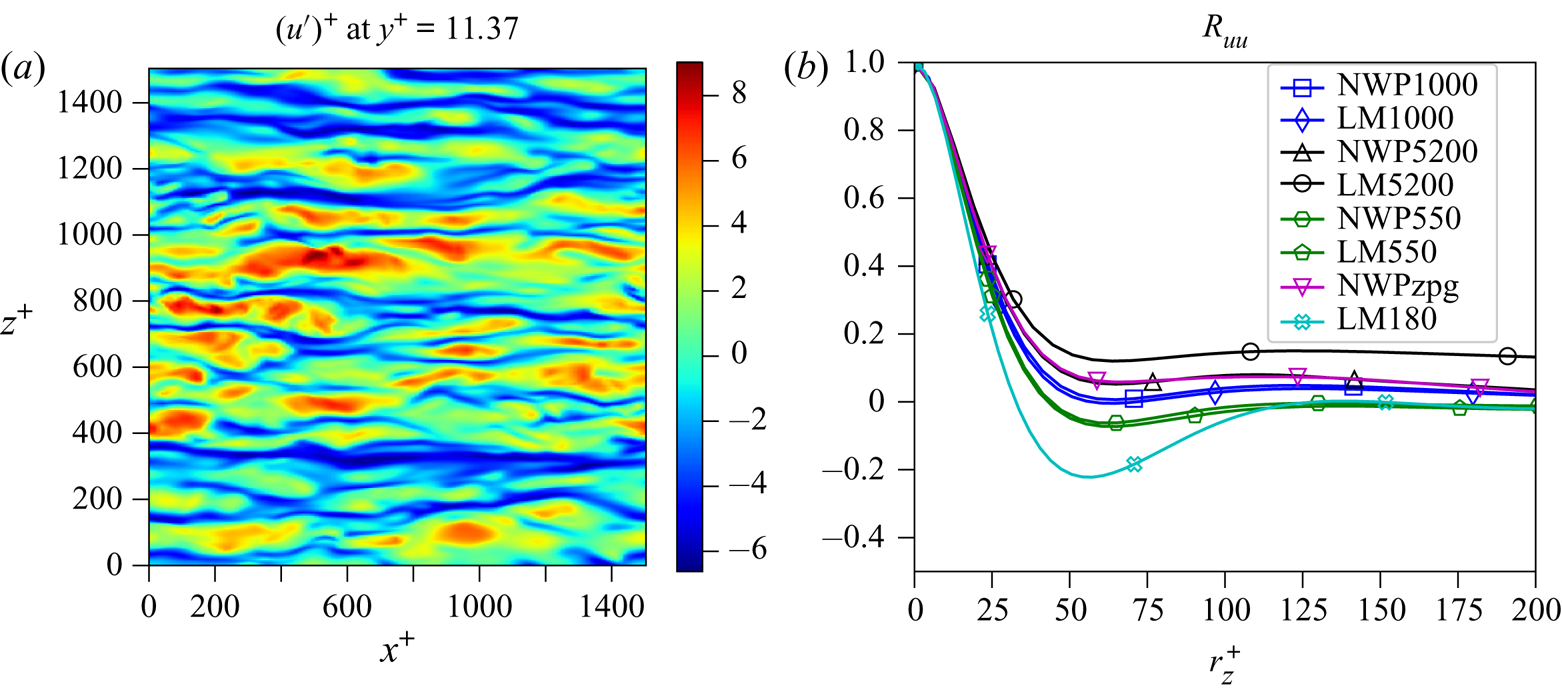
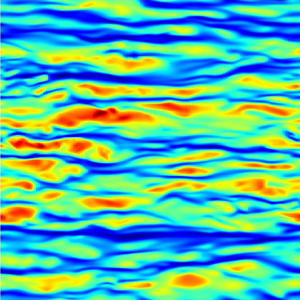
In addition to producing consistent near-wall statistics, the NWP model flow produces flow structures that are consistent with expectations for near-wall turbulence. For example, the well-known high- and low-speed streaks are apparent in visualizations of the streamwise velocity fluctuations near the wall (figure 14), and those streaks have the expected spanwise spacing, as evidenced by the two-dimensional spectra in figure 7 at  $y^+=15$, and the spanwise two-point correlations of streamwise velocity fluctuations in figure 14. In the NWP flows, increasing the magnitude of the imposed favourable pressure gradient appears to increase the coherence of the streaks, as indicated by the depth of the mild local minimum at
 $r_z^+\approx 50$, although the imposed pressure gradient in the NWP5200 case is weak enough to have no effect relative to NWPzpg. The correlations from NWP1000 and NWP550 are also in excellent agreement with those of their corresponding channel flow DNS, while the correlations from NWP5200 and LM5200 are quite different. This is almost certainly due to the large-scale modulations of the near-wall turbulence that occur in the high Reynolds number channel flow. These are apparent from the two-dimensional spectrum for LM5200 at
 $y^+=15$ (see figure 7), which cannot be represented in the NWP model, and are largely absent in the lower Reynolds number channel flows (LM1000 at
 $y^+=15$ in figure 7).
(a) Snapshot of the streamwise velocity fluctuation  $u'$ in the
 $x$–
 $z$ plane; (b) two-point correlation function
 $R_{uu}(r_z)$ for all three model cases, as well as an additional model case NWP550, and channel flow DNS ranging from
 $Re_{\tau } \approx 180\text {--}5200$. Each
 $R_{uu}$ is measured at
 $y^+\approx 11.5$.

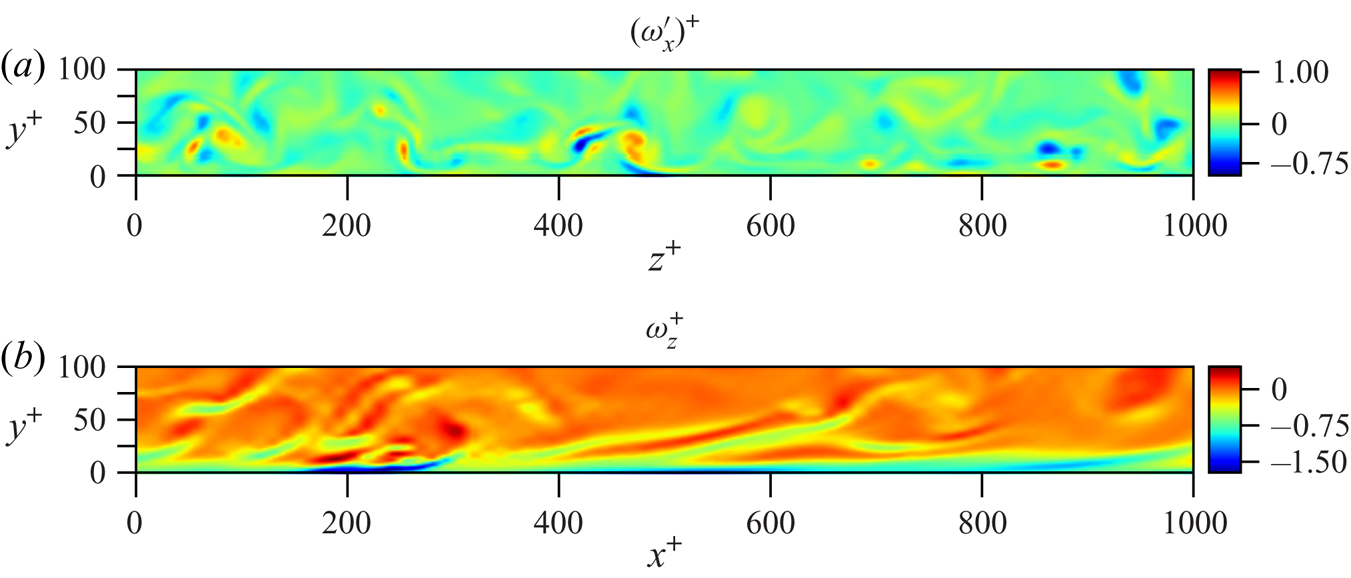
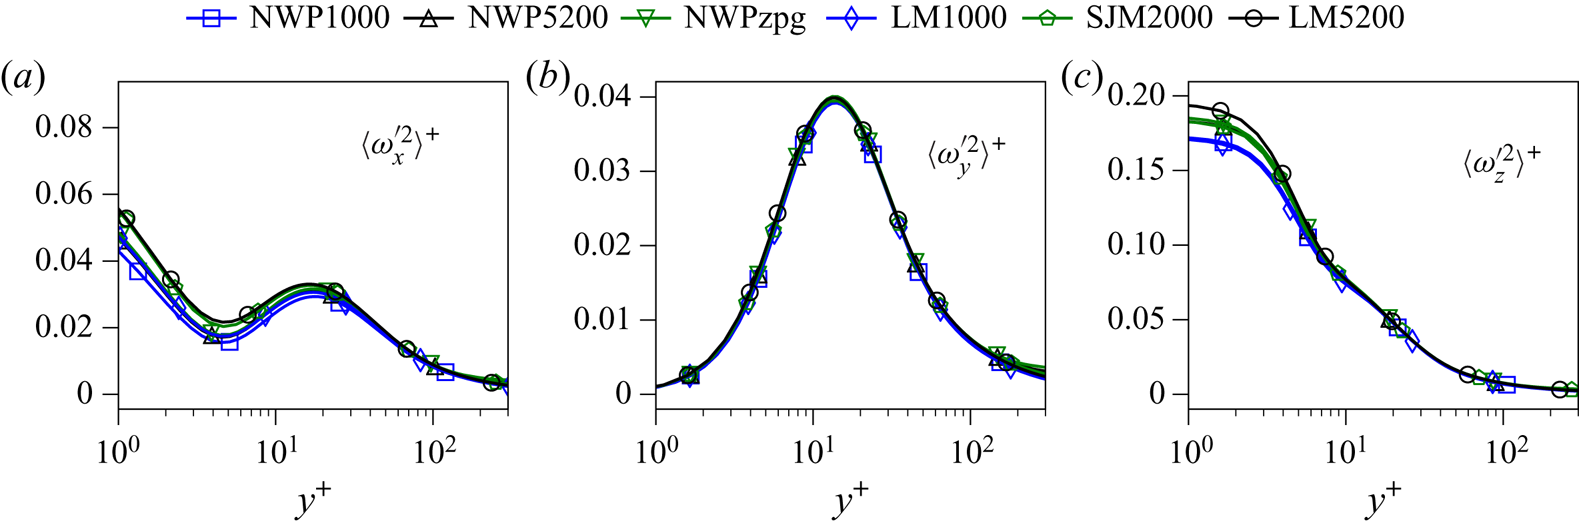
In the autonomous near-wall dynamics, the near-wall streaks are formed by near-wall streamwise vortices (Jiménez & Pinelli Reference Jiménez and Pinelli1999), and such streamwise vortices are indeed present in the NWP flow (figure 15). The presence of near-wall streamwise vortices is also imprinted in the streamwise vorticity variance profiles (figure 16) in the local maximum that occurs at  ${\sim }y^+=15$. Streamwise, wall-normal and spanwise vorticity variances in the NWP model flows are also all largely consistent with those from the channel flow and boundary layer DNS. Other features of the autonomous near-wall dynamics include the predominantly streamwise vortices that lift up from the wall forming inclined vortices, as well as sharp gradients in the streamwise velocity that are manifested as inclined spanwise vorticity structures. These too are apparent in visualizations of spanwise vorticity from the NWP flows (figure 15).
Contour plots of the streamwise vorticity fluctuation  $\omega _x'$ in the
 $y$–
 $z$ plane and spanwise vorticity
 $\omega _z$ in the
 $x$–
 $y$ plane.

Vorticity variances  $\left \langle \omega '_{\alpha }\omega '_{\alpha } \right \rangle ^+$ versus
 $\log (y^+)$ in the region
 $y^+\in [0,300]$.

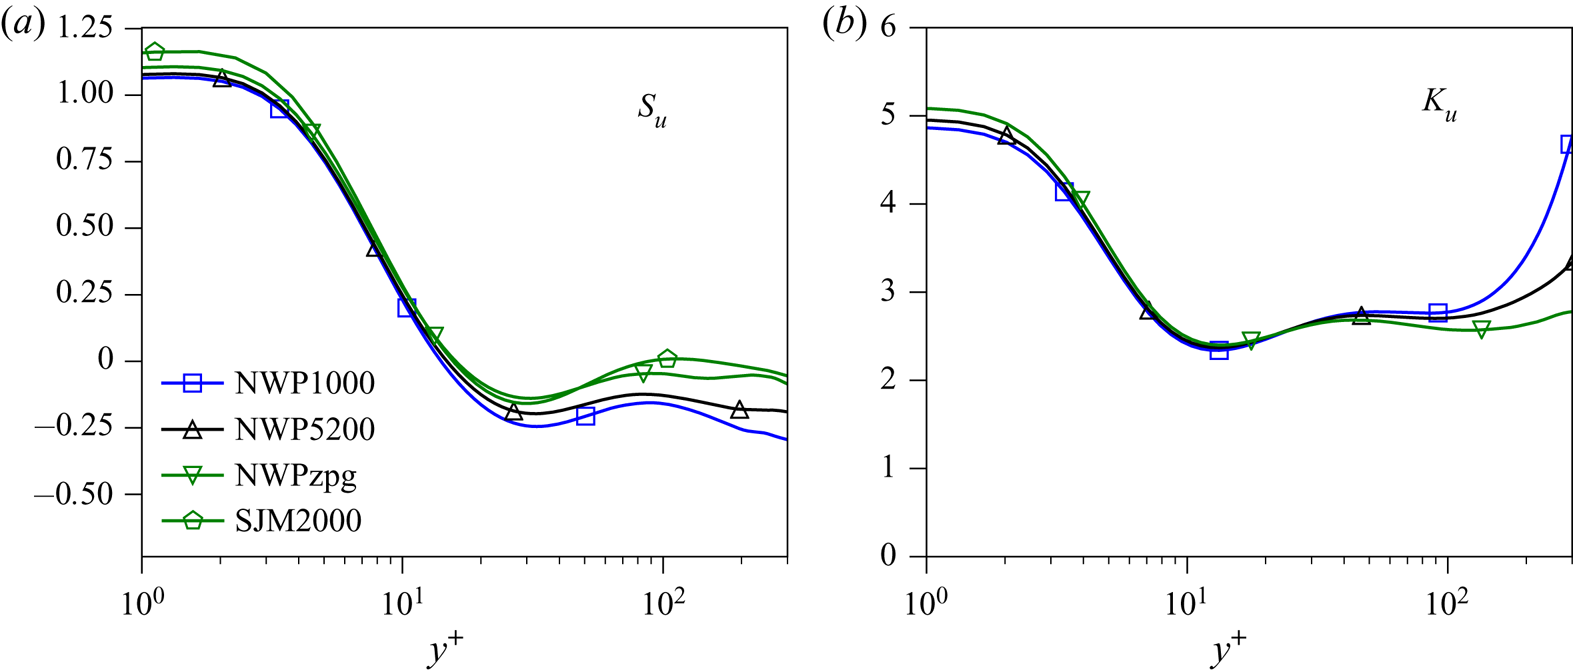
Given the consistency of the NWP flow structures with those of near-wall turbulence, one would expect that higher-order statistical quantities would also be consistent. As an example, the skewness and kurtosis of the streamwise velocity fluctuations are shown in figure 17. While these quantities are not as widely reported, and are in particular not currently available for LM1000 and LM5200, their profiles in the NWP cases are nonetheless consistent with data in the literature (Monty et al. Reference Monty, Hutchins, Ng, Marusic and Chong2009; Chin et al. Reference Chin, Ng, Blackburn, Monty and Ooi2015; Samie et al. Reference Samie, Marusic, Hutchins, Fu, Fan, Hultmark and Smits2018). In particular, skewness has a local minimum at  $y^+\approx 20$, crosses zero at
 $y^+\approx 10$ and attains a maximum at the wall of
 ${\sim }1.1$. Also, kurtosis has a local minimum at
 $y^+\approx 10$ and reaches a maximum at the wall of
 ${\sim }5$.
Skewness  $S_u$ and kurtosis
 $K_u$ of the streamwise velocity fluctuations in the NWP cases, and skewness in SJM2000.

4. Conclusions
The NWP model of near-wall turbulence described here was formulated in part to address the hypothesis that the autonomous dynamics of the near-wall turbulence modulated by the large-scale outer-layer turbulence is responsible for the observed characteristics of near-wall turbulence. The NWP flow was also formulated to serve as as a computationally accessible quantitative model of near-wall turbulence which will be useful in a number of contexts.
Regarding the former objective, the study described here builds on previous work by Jiménez & Pinelli (Reference Jiménez and Pinelli1999) and Jiménez & Moin (Reference Jiménez and Moin1991), which use simulations with restricted periodic domains, and in the case of Jiménez & Pinelli (Reference Jiménez and Pinelli1999), manipulation of the turbulence outside the near-wall layer. These simulations were used to characterize in detail the fluid dynamic processes responsible for near-wall turbulence, and establish that these processes are autonomous, not requiring interaction with the outer turbulence. Here, however, the objectives were different, and so the domain sizes, while still restricted, are larger in the horizontal and vertical directions (1500 and 600 wall units, respectively), motivated by the spectral analysis of Lee & Moser (Reference Lee and Moser2019).
The statistical profiles from the NWP flows are in close agreement with those from DNS of turbulent channels and a boundary layer in large spatial domains. For some quantities for which very large scales make a significant contribution, such as the streamwise velocity variance, this agreement is attained only after the large-scale fluctuations that are too large to be represented in the NWP have been filtered out. This indicates that there is a universal near-wall small-scale dynamics that produces the familiar statistics of near-wall turbulence, which had been suggested previously based on analysis of both experimental and DNS data from wall-bounded turbulent flows (Marusic, Mathis & Hutchins Reference Marusic, Mathis and Hutchins2010b; Mathis et al. Reference Mathis, Hutchins and Marusic2011; Lee & Moser Reference Lee and Moser2019). By actually simulating the autonomous near-wall dynamics over the range of scales at which it occurs, as determined from spectral analysis (Lee & Moser Reference Lee and Moser2019), we confirm that the ‘universal signal’ described by Marusic et al. (Reference Marusic, Mathis and Hutchins2010b) and Mathis et al. (Reference Mathis, Hutchins and Marusic2011) arises from universal dynamics, where universal here means independent of Reynolds number or external flow configuration.
As a quantitative model of near-wall turbulence, the NWP flow defines a one-dimensional family of near-wall turbulent flows, parameterized by the imposed streamwise pressure gradient  $\partial P^+/\partial x^+$. In this context, the NWP model can, for example, be used as a source of data to inform a wall model for wall-modelled LES. For such an application, one would invoke the scale-separation assumption discussed in § 2.2 and use NWP flows matched to the local pressure gradient and momentum flux associated with the large-scale outer-layer flow simulated by the LES. Other applications of the NWP model are as a vehicle for numerical experiments on near-wall turbulence as in Jiménez & Pinelli (Reference Jiménez and Pinelli1999) and to investigate the interactions of the small-scale, near-wall turbulence with such complications as surface roughness, heat transfer, chemical reactions and turbophoresis. These applications of the NWP were outside of the scope of the current study, but the NWP model allows such near-wall phenomena to be studied computationally at a much lower cost than a full DNS of a real turbulent flow. For example, the NWP computational grid is a factor of 24 080 smaller than the DNS grid used for the LM5200 channel case.
Finally, the NWP formulation described here can be considered a lowest-order asymptotic description of near-wall turbulence, in which the imposed pressure gradient, the momentum flux from the outer flow and the mean wall shear stress are considered uniform in space and time on the scale of the patch. A higher-order approximation could allow one or more of these quantities to vary slowly in the streamwise direction or time, which can be treated asymptotically as in Spalart (Reference Spalart1988) or Topalian et al. (Reference Topalian, Oliver, Ulerich and Moser2017) to model the resulting spatial or temporal evolution of the wall turbulence. This would broaden the applicability of NWP models, which, for example, would allow them to be used with stronger pressure gradients, especially strong adverse-pressure-gradient boundary layers in which wall shear stress generally evolves relatively rapidly.
Acknowledgements
The work presented here was supported by the National Science Foundation Award (no. DMS-1620396), as well as by the Oden Institute for Computational Science and Engineering. The research utilized the computing resources of the Texas Advanced Computing Center (TACC) at the University of Texas at Austin. We wish to thank M. Lee for assistance with the PoongBack code, supplying post-processing scripts for visualizing data and insightful discussions. We also thank T. Oliver, P. Mohan and G. Yalla for insightful discussions and useful suggestions for this manuscript.
Declaration of interests
The authors report no conflicts of interest.
Appendix A. Reynolds stress budget equation
The Reynolds stress budget equations govern the evolution of the Reynolds stress tensor. The terms of the equation are given by
 \begin{align} \frac{\textrm{D} \left\langle u_i'u_j' \right\rangle}{\textrm{D} t} &= -\overbrace{\left(\left\langle u_i'u_k' \right\rangle \frac{\partial U_j}{\partial x_k} +\left\langle u_j'u_k' \right\rangle\frac{\partial U_i}{\partial x_k}\right)}^{\mathcal{P}_{ij}} \nonumber\\ &\quad - \overbrace{\frac{\partial \left\langle u_i'u_j'u_k' \right\rangle}{\partial x_k}}^{T_{ij}} +\overbrace{\nu \frac{\partial^2\left\langle u_i'u_j' \right\rangle}{\partial x_k\partial x_k}}^{D_{ij}} \nonumber\\ &\quad +\overbrace{\left\langle p'\left(\frac{\partial u_i'}{\partial x_j}+\frac{\partial u_j'}{\partial x_i}\right) \right\rangle}^{\varPi_{ij}} -\overbrace{\left(\frac{\partial \left\langle p'u_i' \right\rangle}{\partial x_j} + \frac{\partial \left\langle p'u_j' \right\rangle}{\partial x_i}\right)}^{\varUpsilon_{ij}} \nonumber\\ &\quad -\overbrace{2\nu \left\langle \frac{\partial u_i'}{\partial x_k}\frac{\partial u_j'}{\partial x_k} \right\rangle}^{\epsilon_{ij}}. \end{align}
Here  $\mathcal {P}_{ij}$ denotes turbulence production,
 $T_{ij}$ turbulent transport,
 $D_{ij}$ viscous transport,
 $\varPi _{ij}$ pressure strain,
 $\varUpsilon _{ij}$ pressure transport and
 $\epsilon _{ij}$ dissipation.