
I. INTRODUCTION
Microstructure evolution trajectories of metallic crystalline materials undergoing plastic deformation are governed by generation, movement, and storage of dislocations.Reference Hull and Bacon1 The microstructure fields resulting from the aforementioned interplay of dislocations are critical determinants of the mechanical and functional response of the resulting productsReference Chang, Kim and Moon2–Reference Valiev5 This response is mediated through defect characteristics such as grain and subgrain boundaries that are in turn composed of dislocation distributions. Therefore, high fidelity process-oriented microstructure tailoring frameworks must encapsulate the holistic evolution of how dislocations and their assemblies evolve as a function of the thermomechanical deformation parameters.
How dislocation densities are accumulated during plastic deformation are relatively well understood at low strain-rates (<102/s) and modest strain range (≪1). Standard practices have been developed for probing their constitutive behavior in these subsections of dynamic deformation conditions. These include Hopkinson plastic deformation technique for high range of strain-rate (>103/s) and low strains (<1), hot torsion experimentation or rolling at relatively modest strain-rate (<102/s) and high strain (>4).Reference McQueen and Bergerson6–Reference Nicholas9 Unfortunately, the dynamic microstructure transformations particularly at high strain (≫1) and high strain-rates (>102/s) are less than well understood. Prior investigations by the authors of the present work have examined the evolution of microstructural parameters including grain size,Reference Shekhar, Abolghasem, Basu, Cai and Shankar10 subgrain size,Reference Abolghasem, Basu, Shekhar, Cai and Shankar11 crystallographic texture,Reference Basu and Ravi Shankar12 grain boundary characteristics such as fraction of low angle grain boundaries,Reference Shekhar, Abolghasem, Basu, Cai and Shankar10 and the progression of dynamic recrystallization.Reference Abolghasem, Basu and Shankar13 The aforementioned efforts include capturing and quantifying the evolution of microstructure transformation (specifically grainReference Shekhar, Abolghasem, Basu, Cai and Shankar10 and subgrainReference Abolghasem, Basu, Shekhar, Cai and Shankar11 sizes) in the high strain and high strain-rate regime. However, these studies have ignored the role dislocation densities, which (i) are central to the microstructural evolution under the severe deformation conditions and (ii) play a deterministic role in determining the constitutive response of the resulting materials. An explicit delineation of the evolution of dislocation densities resulting from large strain/strain-rate, thermomechanically coupled deformation remains a challenge.Reference Ding and Shin14,Reference Ding, Zhang and Richard Liu15
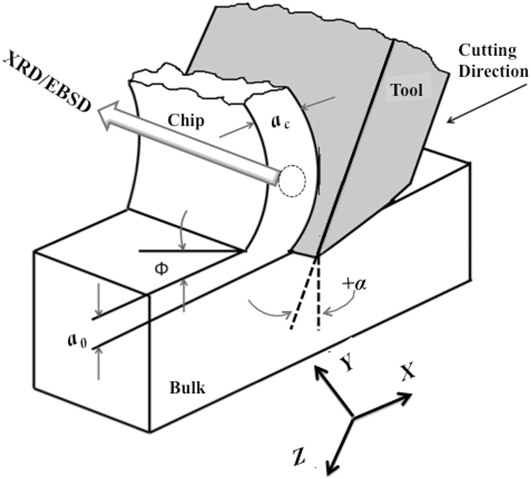
Here, we utilize large strain machining (LSM) to study the evolution of dislocation densities during shear deformation characterized by severe strains (≫1) and strain-rates (>102/s). This study leverages our prior work where we have studied the subgrain size evolution under similar thermomechanical conditions.Reference Abolghasem, Basu, Shekhar, Cai and Shankar11 Thus, we are in a position to examine the robustness of the idea of similitude in evolution of deformed microstructures in a regime, where it has not been explored to date. We examine whether the subgrain size (δ) and the dislocation density (ρi) indeed scale in a self-similar manner, where  $\delta \sqrt {{\rho _{\rm{i}}}}$ ∼ constant. LSM offers a platform for this study because (i) the coupled temperature rise in the deformation zone is well-understood using models that have been calibrated using in situ infrared thermography. Hence, it offers a framework for measurably imposing large shear strains in elements of materials in a single-deformation pass.Reference Meyers, Subhash, Kad and Prasad16 (ii) Homogeneously deformed samples result in the form of “chips” under plane-strain conditions that can be probed to characterize the corresponding microstructural consequences using electron microscopy and X-ray diffraction (XRD) analyses. (iii) LSM enables imposition of strains varying in the range 1–10 at strain-rates varying within the range of 10–103/s, and temperatures from close to ambient to ∼470 K, in a configuration which can impose simple shear deformation (Fig. 1). It is envisioned that process-oriented microstructure tailoring frameworks that will result from this effort will provide avenues for seamless integration with scalable shear-based manufacturing platforms.Reference Moradi, Basu and Shankar17
Schematic of the LSM process. The dotted circle indicates the location where XRD and EBSD were performed.

II. EXPERIMENTAL METHODS
Toward the aforementioned objective, oxygen-free high conductivity (OFHC) copper was annealed at 973 K for 2 h. This resulted in a nominal grain size of ∼50 μm. LSM was performed on annealed OFHC-Cu. This process involves a linear system in which a hardened steel tool moves along the annealed OFHC Cu workpiece to remove the material as illustrated in Fig. 1. Consequently, the material within the depth a 0 is deformed in simple shear resulting in a chip that has the thickness a c. Herein, LSM allows us to perform orthogonal machining as the tool cutting edge is maintained perpendicular to its moving direction. This was done to facilitate the in situ characterization of deformation conditions, viz. strain-rate and temperature by enforcing shear deformation in a plane-strain configuration. Toward this, a workpiece thickness featuring t > 10a 0 was used. Note that this feature enables a reliable mapping of the microstructural consequences produced during LSM to the thermomechanics of deformation. Nonetheless, this geometry remains directly relevant to that in an array of scalable manufacturing processes, such as drilling, milling, turning, etc., all of which involve removal of a predetermined depth of the material utilizing a wedge-shaped tool.
The tool rake angle α, the angle of the cutting face relative to the work, was selected as α = 0°, 20°, 30°, and 40° and the cutting speed was set at four different speeds of 50 mm/s, 550 mm/s, 750 mm/s, and 1250 mm/s being represented, respectively, as low (L), medium (M), medium-high (MH), and high (H). Herein, the experimental design constituted 15 conditions corresponding to a wide range of thermomechanical conditions as listed in Table I. These samples are denoted as 20 L, 20 M, 20 MH, 20 H, etc., where the numbers represent the rake angle and the letters L, M, MH, and H indicate the cutting velocity. The choice of these parameters was motivated by our prior studies that showed a broad range of microstructural responses as a function of deformation parameters.Reference Shekhar, Abolghasem, Basu, Cai and Shankar10,Reference Abolghasem, Basu, Shekhar, Cai and Shankar11,Reference Abolghasem, Basu and Shankar13,Reference Shekhar, Cai, Basu, Abolghasem and Shankar18–Reference Basu, Abolghasem and Shankar20 Herein, the effective strain (ε) imposed on the chip created by LSM is given byReference Shaw21
 $$\varepsilon = {\gamma / {\sqrt 3 }} = {{\cos \alpha } / {\left( {\sqrt 3 \sin \phi \cos \left( {\phi - \alpha } \right)} \right)}}\quad .$$
LSM parameters and the thermomechanical condition for various sample conditions.

In the above equation, γ denotes the shear strain, ϕ denotes the shear plane angle, and α denotes the cutting tool rake angle as shown in Fig. 1. The angle ϕ is calculated by  $\tan \phi = {{\left( {{{{a_0}} / {{a_{\rm{c}}}}}\cos \alpha } \right)} / {\left( {1 - {{{a_0}} / {{a_{\rm{c}}}}}\sin \alpha } \right)}}$ as a function of the ratio of the undeformed bulk thickness (a 0) to the thickness of the deformed chip (a c) as it is shown in Fig. 1. The LSM experiment was performed such that the value for a 0 was set at ∼0.17 mm, and the subsequent a c values were measured for different samples to calculate the imposed effective strain utilizing Eq. (1), which are listed in Table I.
The effective strain-rate of deformation during LSM has been characterized using digital image correlation (DIC). This process involves recording the movement of the material within the deformation zone of LSM in a sequence of high-speed images. This was facilitated using the PCO 1200 HS high-speed camera. Subsequently, image correlation algorithms are deployed in quantifying this movement as displacement fields that are then differentiated spatially and with respect to time to produce the effective strain-rate fields.Reference Shekhar, Abolghasem, Basu, Cai and Shankar10 The mean effective strain-rate imposed in the deformation zone during LSM is a function of the deformation geometry and is encapsulated using the following equationReference Hasting and Oxley22:
 $$\dot{\varepsilon } = {{CV\cos \alpha \sin \varphi } / {\left( {\cos \left( {\varphi - \alpha } \right){a_0}} \right)}}\quad ,$$
where “C” is a material dependent constant that was calibrated for Cu as C ∼ 4.2 using in situ characterization of the strain-field in the deformation zone.Reference Abolghasem, Basu, Shekhar, Cai and Shankar11 The constant C relates the average strain rate to the cutting velocity through Eq. (2) which has been calculated using the data from DIC.Reference Abolghasem, Basu, Shekhar, Cai and Shankar11 Subsequently, this equation was used to estimate shear strain-rates when DIC was not possible due to limitations of our high speed camera, for instance in high speed LSM, viz. 0, 20, 30, and 40 H conditions. The calculated strain-rate values are listed in Table I for each sample condition.
Imposition of severe strains naturally results in dissipation of energy,Reference Hasting and Oxley22 which manifests a thermomechanically coupled temperature rise within the deforming zone. This temperature rise is known to affect the microstructural parameters such as dislocation densityReference Ding and Shin14,Reference Ding, Zhang and Richard Liu15,Reference Jiang, Britton and Wilkinson23,Reference Ding and Guo24 and grain size.Reference Shekhar, Abolghasem, Basu, Cai and Shankar10,Reference Abolghasem, Basu, Shekhar, Cai and Shankar25 In prior work, the thermal fields in LSM were characterized via calibrated infrared (IR) thermography using a FLIR 325A IR (FLIR Systems Inc., Wilsonville, Oregon) camera.Reference Shekhar, Abolghasem, Basu, Cai and Shankar10 Building on the realization that the empirical data are consistent with moving heat-source models of the temperature rise, we utilize these well-established models in the subsequent section.
Following the thermomechanical characterization of the deformation, we performed the electron backscattered diffraction (EBSD) analysis to examine the chips in a scanning electron microscope (Phillips XL30). To do this, we examined the microstructure near the center of the chip, away from the interface of the tool and chip, where the uniformity of the deformation region was confirmed through prior DIC and IR tests.Reference Shekhar, Abolghasem, Basu, Cai and Shankar10 We prepared the samples for this study by metallographically polishing them utilizing SiC and diamond blend. In an extended final step, the samples were polished with a 0.05 μm alumina solution. We acquired the data and analyzed the EBSD micrographs via TSL OIM software. We obtained information about grain characteristics such as subgrain size, defined as domains with misorientation greater than 2°, which were estimated using the number weighted average of the corresponding areas to then calculate the equivalent circle diameter. The measured subgrain size denoted as δm along with the standard deviation is listed in Table II for various LSM conditions. We also characterized the samples using transmission electron microscopy (TEM) in a JEOL 200-CX microscope (JEOL Ltd., Tokyo, Japan). We prepared and polished the samples using a double-jet electrolytic machine from Ballerup, Denmark.
Microstructure results of LSM sample conditions: average measured subgrain size (δm), calculated subgrain size (δr),Reference Abolghasem, Basu, Shekhar, Cai and Shankar11 average measured dislocation densities (ρm), dislocation densities in cell interiors (ρi), the calculated total dislocation densities using Eq. (11),  $\left( {\rho _{{\rm{tot}}}^{\rm{c}}} \right)$, and dislocation densities calculated using Eq. (15), (ρT) are listed for different LSM conditions.

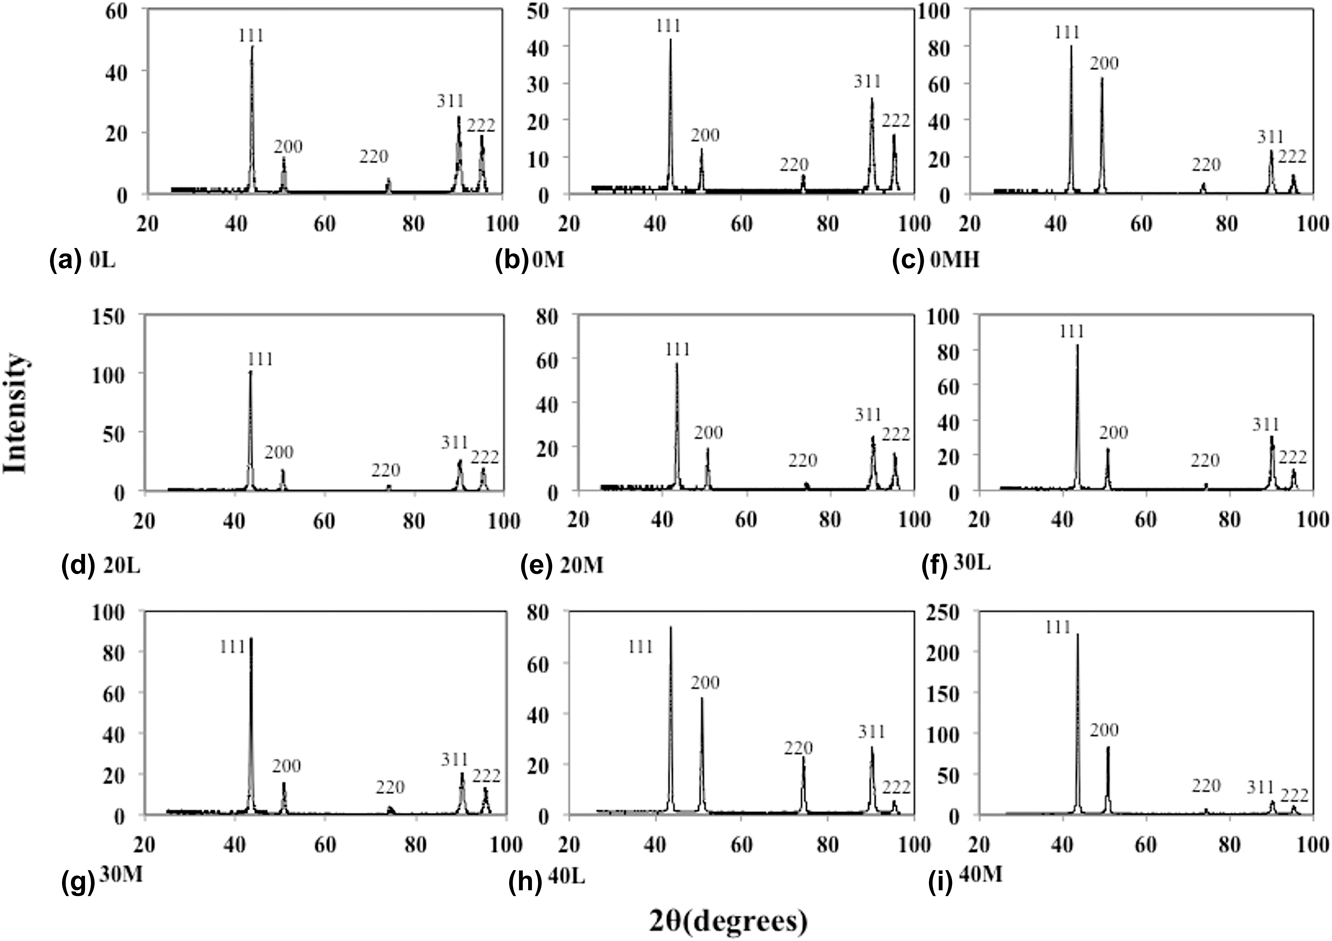
Complementing the characterization of the grain microstructure, using XRD, we measured the dislocation densities performing peak profile broadening examination utilizing a Bruker X-ray diffractometer. The diffractometer utilizes a Lynx Eye detector, which has a resolution of 0.037°. This methodology correlates the broadening of XRD peaks of crystallographic planes due to finite crystallite sizes resulting from dislocations generated during plastic deformation. Toward this, XRD patterns from bulk and machined samples were obtained. Figure 2 shows the XRD profiles, i.e., the intensity scans, for 2θ = 20°–100° of different sample conditions. This resulted in five intensity peaks at the Bragg angles representing the marked crystal planes on Fig. 2 where the highest peak occurred around the 2θ value of 43.47°, which corresponds to the (111) crystallographic plane of C Reference Huang and Morehead26–Reference Jiang, Zhu, Butt, Alexandrov and Lowe29 from which the Kα2 peak was stripped. From the subsequent scans, the dislocation densities in the LSM chips were measured using the parameters associated with each sample condition. A Cu source with X-ray wave length λ = 0.1540 nm was used along with a scan step size of 0.037°. Next, we used the resulting scans to estimate the dislocation densities of the chips using the parameters associated with each sample condition. Finally, to estimate the dislocation densities, we fit the asymptotic parts of the second and the fourth moments of I(q) versus q curve to the subsequent formulae of the momentsReference Borbely and Driver30 as followsReference Wilson31,Reference Borbély and Groma32 :
 $${M_2}\left( q \right) = {1 \over {{\pi ^2}{\varepsilon _{\rm{F}}}}}q - {L \over {4{\pi ^2}{K^2}\varepsilon _{\rm{F}}^2}} + {{\Lambda \left\langle \rho \right\rangle \ln \left( {{q / {{q_0}}}} \right)} \over {2{\pi ^2}}}\quad ,$$
 $${{{M_4}\left( q \right)} \over {{q^2}}} = {1 \over {3{\pi ^2}{\varepsilon _{\rm{F}}}}}q + {{\Lambda \left\langle \rho \right\rangle } \over {4{\phi ^2}}} + {{2\Lambda \left\langle \rho \right\rangle \ln \left( {{q / {{q_1}}}} \right)} \over {{{\left( {2\pi } \right)}^4}q{\varepsilon _{\rm{F}}}}} + {{3{\Lambda ^2}\left\langle {{\rho ^2}} \right\rangle {{\ln }^2}\left( {{q / {{q_2}}}} \right)} \over {4{\pi ^4}{q^2}}}\quad ,$$
where  ${M_{\rm{k}}}\left( q \right) = {{\int_{ - q}^q {{{q'}^{\rm{k}}}I\left( {q'} \right){\rm{d}}q'} } / {\int_{ - \infty }^\infty {I\left( {q'} \right){\rm{d}}q'} }}$ and I(q) is the intensity of the peak of the XRD for
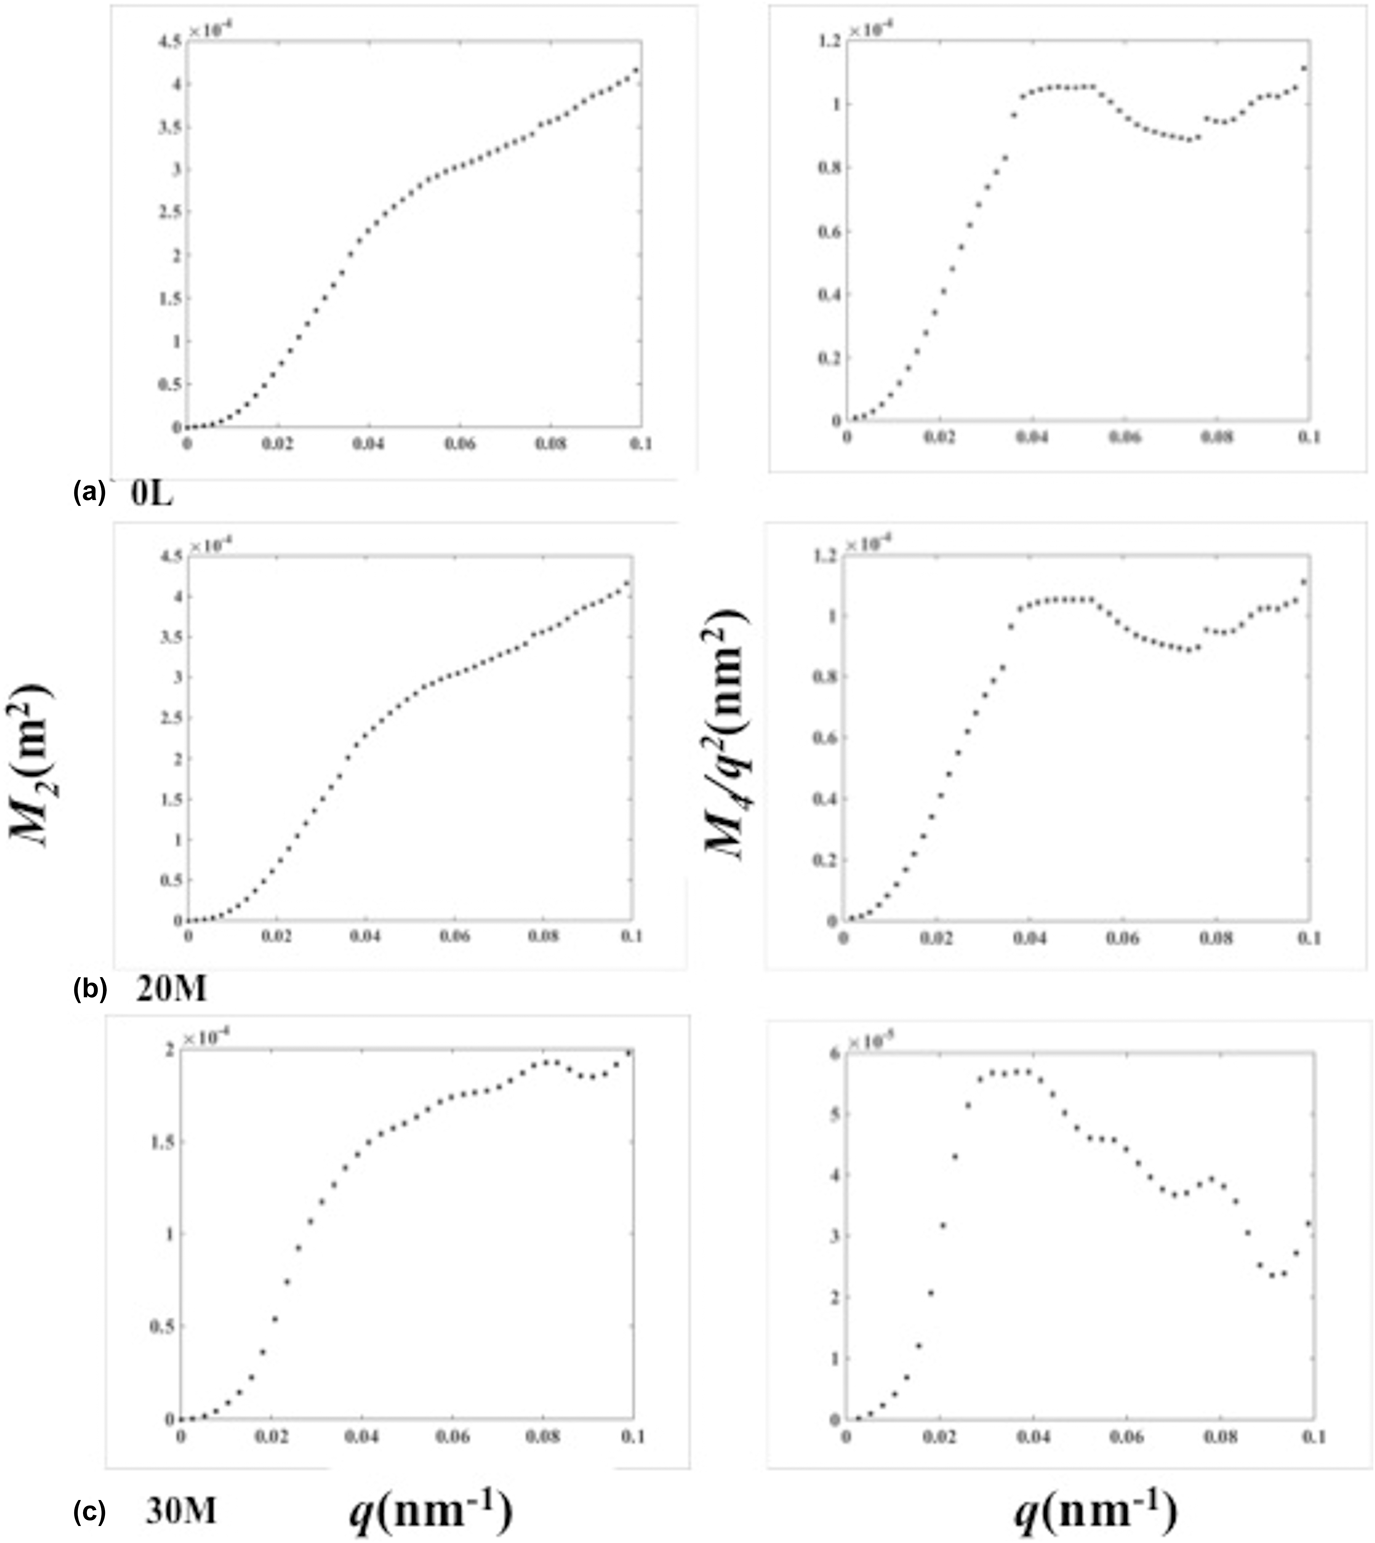
 $q = {2 \over \lambda }\left( {\sin \theta - \sin {\theta _0}} \right)$. λ is the X-ray wave length, θ0 and θ are the Bragg angle and diffraction angle, respectively. The (111) XRD peak was used to obtain the Bragg angle for Cu samples as explained earlier. This value was optimized at the end of the characterization process to account for peak shifts that result from elastic residual stresses. Here, Λ is a geometrical constant describing the strength of dislocation contrast, 〈ρ〉 represents the average dislocation density, K is the Scherrer constant, which gets the value of ∼1, and εF denotes the crystallite size. Parameters of fit include q 0, q 1, and q 2.Reference Borbély and Groma32 Fitting Eq. (4) to asymptotic portion of M 4(q)/q 2 is used to calculate the dislocation densities. The second and the fourth moments of the XRD plot of Cu chips are shown in Fig. 3 for three different sample conditions. The dislocation densities characterized using this technique are listed in Table II and are hereby denoted as ρm.
XRD profile of Cu obtained in different sample conditions (x axis is the diffraction angle and y axis is the intensity in arbitrary units): (a) 0 L, (b) 0 M, (c) 0 MH, (d) 20 L, (e) 20 M, (f) 30 L, (g) 30 M, (h) 40 L, and (i) 40 M.

The 2nd order restricted moment (M 2λ = 0.1540) and 4th order restricted moment divided by q 2 (M 4/q 2) for three different LSM conditions: (a) 0 L, (b) 20 M, and (c) 30 M.

III. EXPERIMENTAL RESULTS
Performing LSM, the thermomechanical results and the microstructure consequences are analyzed as a function of LSM parameters. Also, we seek to understand the variations of the subgrain size and the dislocation densities over the range of strain, strain-rate, and the coupled temperature in the following subsections.
A. Strain and strain-rate from SPD in LSM
Effective strain ε imparted to the workpiece during chip formation was estimated using Eq. (1). This was done by measuring the ratio a 0/a c from the chips that were generated during LSM, wherein the shear plane angle ϕ was characterized. Subsequently, this angle was substituted in Eq. (1) to find the respective strain values.
The effective strains calculated using this approach are listed in Table I for various LSM conditions. We see a general trend, wherein strain values increase for decreasing rake angle, i.e., more negative values of α (see Fig. 1), covering an extensive range between 1–10. Moreover, for a fixed α, the strain values drop with rising cutting tool velocities. Table I also lists the corresponding strain-rates. Characterization of the strain-rate field in LSM using DIC methods can be found in our prior work.Reference Shekhar, Abolghasem, Basu, Cai and Shankar10–Reference Abolghasem, Basu and Shankar13 Results from this exercise also delineate other trends, wherein strain-rates are proportional to the velocity of LSM for a fixed rake angle. Concomitantly, these values increase with increasing rake angle for a given velocity.
B. Deformation zone temperature
The thermomechanically coupled temperature rise in LSM was calculated theoretically, using the well-established Oxley’s extended model.Reference Hasting and Oxley22 The applied thermal model involves a moving heat source over which mass transport occurs concurrently. This heat dissipated from plastic deformation renders the characteristics of a moving heat source to the deformation zone of LSM. Nonetheless, a fraction β of this heat is carried away by the workpiece that is in constant motion during LSM, due to its contiguity with the chip.Reference Shekhar, Abolghasem, Basu, Cai and Shankar10–Reference Abolghasem, Basu and Shankar13 Herein, temperature rise dT in the chip is instigated by the remaining fraction of the heat, i.e., 1 − β, as prescribed in  $\rho {C_{\rm{p}}}{\rm{d}}T = \left( {1 - \beta } \right) \times \sigma \left( {\varepsilon ,\dot{\varepsilon },T} \right){\rm{d}}\varepsilon$, where σ is the flow stress and (ρC) is the heat capacity of Cu = 3.63 MJ/m3.Reference Shekhar, Abolghasem, Basu, Cai and Shankar10–Reference Abolghasem, Basu and Shankar13 Assuming the Johnson–Cook model for describing the flow stress σ, and simultaneously coupling it with the characterized mechanics, i.e., strain and strain-rate, the total temperature rise can be integrated to obtain the temperature in the deformation zone. These calculations were then validated against the measured temperaturesReference Shekhar, Abolghasem, Basu, Cai and Shankar10 denoted as T calc and listed in Table I.
C. Microstructure characterization
In this work, we used LSM to deform copper through superposition of high levels of strain (1–10), high range of strain-rates (10–103/s), and the coupled deformation temperature (from ambient to 470 K). This process results in an ultra-fine microstructure with subgrain sizes in the range of 0.23–0.43 µm.Reference Shekhar, Abolghasem, Basu, Cai and Shankar10,Reference Abolghasem, Basu, Shekhar, Cai and Shankar25 Application of large shear strains involves progressive microstructure refinement, which is manifested by the measured average subgrain sizes listed in Table II. The inverse pole figure (IPF) maps achieved from EBSD analysisReference Shekhar, Abolghasem, Basu, Cai and Shankar10–Reference Abolghasem, Basu and Shankar13 as well as more details on the characterized microstructure can be found in our previous work.Reference Shekhar, Cai, Basu, Abolghasem and Shankar18,Reference Shekhar, Abolghashem, Basu, Cai, Shankar, Shekhar, Abolghashem, Basu, Cai and Shankar19 As shown in our prior publications, it would be interesting to discuss the variety of microstructures from LSM by considering the three conditions: 0 L, 20 M, and 30 M. The 0 L condition (ε = 8.7,  $\dot{\varepsilon } = 60{\rm{/s}}$) corresponding to the highest effective strain and the smallest strain-rate is characterized by the most refined subgrain size (Table I). However, the 20 M condition corresponds to smaller level of strain and higher value of strain-rate (ε = 3.9,
 $\dot{\varepsilon } = 1290{\rm{/s}}$). Furthermore, as this sample condition corresponds to higher strain rate, it hence involves higher temperature rise as well. It is rational to expect a less refined microstructure in this sample in comparison to the 0 L condition by intuition, which is confirmed by EBSD imagesReference Shekhar, Abolghasem, Basu, Cai and Shankar10,Reference Abolghasem, Basu and Shankar13 and Table II indeed. On the other hand, 30 M condition is deformed at considerable lower levels of strain, but higher strain-rates (ε = 2.6,
 $\dot{\varepsilon } = 1740{\rm{/s}}$) and temperatures.
We have also looked at the recrystallization mechanism for LSM thermomechanical condition in our previous work,Reference Abolghasem, Basu and Shankar13 where we have shown the recrystallized fraction of the deformed grains as a function of strain through filtering the original EBSD scans for the Grain Orientation Spread (GOS) criterion to be less than 2.6° (the threshold value to characterize the state of the microstructure as being deformed or recrystallized). This examination in EBSD analysis allows estimating recrystallization fraction utilizing intragranular orientation variations for which the details can be found in our prior publication.Reference Abolghasem, Basu and Shankar13 Based on this filtration, the fraction of the dynamically recrystallized portions of the microstructure (f rec) can be calculated for which the average values were found as 0.55 for the 0 L sample (the maximum among the sample condition studied here), 0.11 for the 30 M sample, and 0.19 for 20 M.Reference Abolghasem, Basu and Shankar13 The relevance of this analysis will be discussed in the forthcoming sections.
Additionally, in our previous work,Reference Abolghasem, Basu, Shekhar, Cai and Shankar11 the TEM images corresponding to the IPF maps from EBSD, are found to closely resemble one another. The TEM images for 0 L and 20 M samples demonstrate different dislocation contents for the various sample conditions. As expected from our characterized recrystallization fractions, the highly deformed 0 L sample consists of a structure that is nearly free of dislocations within the interiors of the refined subgrains, whereas the specimen that underwent deformation labeled as 20 M displays a more disperse distribution of dislocation tangles. In our previous work,Reference Shekhar, Abolghasem, Basu, Cai and Shankar10 the misorientation distributions for these sample conditions were studied where a typical mixture of low-angle and high-angle boundaries were observed. This combination validates the declining involvement of the high angle boundaries as we switch from the highly strained 0 L condition to the moderately deformed 20 M and to the less deformed 30 M condition.
D. Dislocation densities accumulated in chips
Table II lists the average measured dislocation densities ρm characterized using the method of moments from the chips created during LSM. The magnitude of the measurements in Table II confirms well the results in related stutides.Reference Huang and Morehead26,Reference Lee, Yoon, Ahn, Park, Park, Park, Estrin and Kim33–Reference Dalla Torre, Lapovok, Sandlin, Thomson, Davies and Pereloma36 For example, from ECAP experiment on Cu, the dislocation density after one pass (ε = ∼1) has been measured using X-ray peak profile analysis as ρ = ∼1.0 × 10¹⁵ m−2.Reference Lee, Yoon, Ahn, Park, Park, Park, Estrin and Kim33,Reference Gubicza, Balogh, Hellmig, Estrin and Ungár34 The dislocation density in annealed bulk Cu was measured using the same method as ∼6.0 × 10¹⁴/m2 which is in agreement with previous measurement.Reference Gubicza, Balogh, Hellmig, Estrin and Ungár34 Plastic deformation in Cu is sustained by the generation, storage, and accumulation of dislocation densities. This interplay results in complex evolution trajectories that are mediated by the thermomechanics imposed during LSM, as evident in the empirically characterized values of ρm. For instance, chips produced at low speeds with 30° rake angle, i.e., 30 L, exhibit a ρm = 4.8 × 10¹⁵/m2, whereas those created with LSM condition 20 M exhibit a smaller ρm = 3.1 × 10¹⁵/m2. Given the fact that this variation exists despite similar levels of strains imposed across the two LSM conditions, i.e., ε = 4, 3.9, origins of the same can be found in their strain-rate and temperature that are  $\left( {\dot{\varepsilon },T} \right)$ = (100/s, 332 K) and (1290/s, 412 K), respectively. A similar trend is found across LSM conditions 40 L and 30 M that exhibit ρm = 3.3 × 10¹⁵/m2 and ρm = 2.1 × 10¹⁵/m2, both at ε = 2.6, while differing substantially in their strain-rate and temperature conditions, these featuring,
 $\left( {\dot{\varepsilon },T} \right)$ = (140/s, 321 K) and (1740/s, 380 K), respectively.
It is notable that 0 L sample condition  $\left( {\varepsilon ,\dot{\varepsilon }} \right)$ = (8.7, 60/s) although undergoing the highest effective strain among the conditions but exhibits lower dislocation density ρm = 4.9 × 10¹⁵/m2 in comparison with samples including lower strains such as 0 M or 20 L with strains and strain-rates as
 $\left( {\varepsilon ,\dot{\varepsilon }} \right)$ = (5.9, 940/s) and
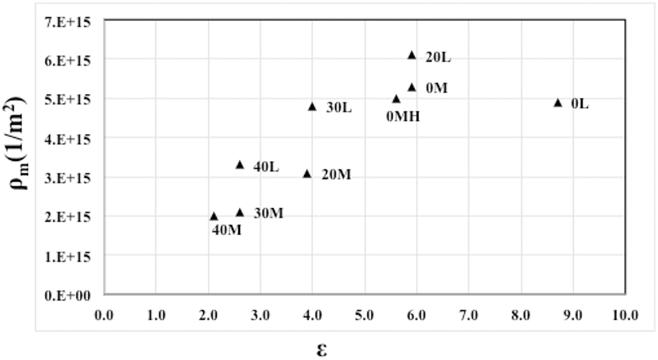
 $\left( {\varepsilon ,\;\dot{\varepsilon }} \right)$ = (5.9, 80/s), respectively. The low dislocation content in the 0 L sample is also confirmed by the TEM image in Ref. Reference Abolghasem, Basu, Shekhar, Cai and Shankar11 and this is rooted in the existence of high fraction of high angle grain boundaries (HAGBs) in this sample condition as concluded in Ref. Reference Abolghasem, Basu and Shankar13. The calculated fraction of recrystallization (f rec) in 0 L was obtained as the highest among the sample conditions confirming the low dislocation densities since recrystallized grains are relatively free of internal dislocations. This is also confirmed by the recrystallized microstructure scans of IPF images in Ref. Reference Abolghasem, Basu and Shankar13, which are filtered to demarcate the recrystallized sections of the microstructure using the above-mentioned GOS-based methods. Nonetheless, an increase in imposed effective strains results in a near monotonic rise in dislocation densities. Figure 4 shows the variation in ρm with respect to strain. The results clearly indicate that the total dislocation density increases nearly linearly with increasing effective strains where 0 L seems to be an outlier due to the aforementioned reasons.
Variation in ρm as a function of effective strain.

IV. DISCUSSION
Our results suggest a complex material response during LSM, emerging from the combined effects of severe strains, high strain-rates, and temperatures. Previous studies have shown that these thermomechanical conditions concomitantly instigate the evolution of a range of microstructure parameters. Consequently, the formulation of holistic predictive frameworks as a coupled approach motivates the aim of this work. Additionally, this premise is reinforced by the fact that several microstructural parameter-pairs naturally depend on each other, as described in this section. Herein, we outline the underlying principles that will enable the realization of this modeling objective.
A. Rate-strain-microstructure mapping of dislocation densities
Material response during imposition of plastic deformation comprises the interplay of dislocation densities involving their generation, storage, and annihilation. This interplay is accompanied by the evolution of microstructural parameters including grain size, subgrain size, and crystallographic textures. Herein, this response can be classified in four stages that are largely determined by imposed effective strains and the corresponding work-hardening characteristics of the material. Previous studies have shown that the onset of stage IV in Cu takes place well before an effective strain ε = 2 is imposed, wherein the specimens studied for this research featuring effective strains ε > 2.1 can be safely assumed to follow stage IV plasticity laws. Nonetheless, it is envisioned that modeling approaches as described in this section will delineate unique response characteristics relevant to the less than well understood thermomechanical regimes characterized by severe plastic strains ε ≫ 1, moderate to high strain-rates  $\left( {\dot{\varepsilon } > {{10}^2}{\rm{/s}}} \right)$ and near ambient to high temperatures.
As a first step toward modeling evolution of dislocation densities during LSM, we realize that plastic material response in stage IV is mediated by dynamics of subgrain evolution simultaneously involving athermal fragmentation and thermally induced growth. In this regard, the concomitant evolution of dislocation densities involving generation, movement, and storage can be classified as that (i) in the grain-interior, and that (ii) in the vicinity of the pre-existing grain-boundaries resulting in their consolidation.Reference Nes37,Reference Nes, Marthinsen and Brechet38 This realization has motivated the additive decomposition of existing dislocation densities as those residing in the grain interior, i.e., ρi, and those residing in the grain boundary, i.e., ρb. Furthermore, these components are related by the volume fraction of grain boundaries in the plastically deforming volume. This volume fraction is denoted by f ≈ κh/δ, where h is the nominal grain boundary thickness,Reference Nes37 δ is the subgrain size, and κ ∼ 3 is a geometric constant.Reference Nes37 The total dislocation density ρtot can be expressed asReference Nes37
 $${\rho _{{\rm{tot}}}} = \left( {1 - f} \right){\rho _{\rm{i}}} + f{\rho _{\rm{b}}}\quad .$$
Using a reasonable value for f ∼ 0.2,Reference Nes37 Eq. (5) can be expressed in various ways such as the following:
 $${\rho _{{\rm{tot}}}} = \left( {1 + f\left( {q_{\rm{b}}^2 - 1} \right)} \right){\rho _{\rm{i}}}\quad ,$$
where q b is a microstructure scaling parameter given by  ${q_{\rm{b}}} = \sqrt {{{{\rho _{\rm{b}}}} / {{\rho _{\rm{i}}}}}}$. The origin of this parameter lies in the self-similar nature of dislocation structures.Reference Nes, Marthinsen and Brechet38 The scaling parameter q b in Eq. (6) is originally presented as a fitting parameter in Ref. Reference Nes, Marthinsen and Brechet38. Prior work has shown that this parameter assumes values around 5 in Cu.Reference Nes37 This enables the decomposition of parameter ρi using Eq. (6), from the total dislocation densities ρtot. Using the total dislocation densities ρm, characterized by the method of moments and equivalent to ρtot, the dislocation values in the grain-interior ρi are listed in Table II. The interior dislocation densities obtained using this approach exhibit values between
 ${\rho _{\rm{i}}} = 3.4 \times {{{{10}^{14}}} / {{{\rm{m}}^2}}}$ for LSM condition 40 M, this featuring thermomechanical conditions
 $\left( {\varepsilon ,\dot{\varepsilon },T} \right)$ = (2.1, 1930/s, 367 K) and ρi = 1.0 × 10¹⁵/m2 for LSM condition 20 L featuring
 $\left( {\varepsilon ,\dot{\varepsilon },T} \right)$ = (5.9, 80/s, 346 K).
We expect that the parameter ρi should scale with the prevalent subgrain size as prescribed by the principle of similitude, i.e.,  $\delta \sqrt {{\rho _{\rm{i}}}} = {q_{\rm{c}}}$, where q c is a constant.Reference Nes37 Similarly, the scaling parameter q c was originally presented in Ref. Reference Nes, Marthinsen and Brechet38 as a constant for the fitting purpose. According to this principle of scaling, LSM results in a microstructure that is “self-similar” for different strain levels excluding for the scale, i.e., the dislocation density and the subgrain size evolve in a manner that preserves self-similarity of the deformed microstructure for different levels of strain. Figure 5 illustrates the values of
 $\delta \sqrt {{\rho _{\rm{i}}}}$ with respect to imposed effective strains ε across the suite of thermomechanical conditions studied on which the dashed line shows the average value. This figure clearly elucidates a near lack of sensitivity of the parameter
 $\delta \sqrt {{\rho _{\rm{i}}}}$ with respect to imposed effective strains ε, i.e.,
 $\delta \sqrt {{\rho _{\rm{i}}}} \; \sim \;9.09$ with variance = 1.65 thereby validating the aforementioned approach. Interestingly, the results in this plot agree well with the values reported in Ref. Reference Lee, Yoon, Ahn, Park, Park, Park, Estrin and Kim33, where
 $\delta \sqrt {{\rho _{\rm{i}}}}$ was consistently found to range between 5 and 10 during imposition of severe strains on Cu. Note that 0 L in Fig. 5 seems to be an outlier since although being superimposed to highest effective strain (ε = 8.7) but this has led to loss of dislocation by dynamic recovery which is noticeable from the dislocation density value for this sample (not being the maximum value).
Preservation of similitude,  $\delta \sqrt {{\rho _{\rm{i}}}}$, across the strain values for different LSM conditions.

Note that the principle of similitude suggests ρi = (q c/δ)2, thus enabling deployment of insights relevant to evolution of subgrain sizes in the formulation of predictive frameworks for dislocation density. We motivate this formulation from our prior work that modeled the subgrain size as a bijective function of the imposed thermomechanical conditions in OFHC Cu, i.e., δr = 0.25 − 0.03ε + 0.058R + 0.0003εR μm.Reference Abolghasem, Basu, Shekhar, Cai and Shankar11 The calculated subgrain sizes δr are listed in Table II. In this model from our prior work, the evolution of subgrain sizes was additively decomposed into an athermally instigated fragmentation attributable to imposed effective strains ε, i.e.,  ${{\partial {\delta ^ - }} \over {\partial \varepsilon }} \propto \varepsilon$ and thermally induced grain growth attributable to the parameter R, i.e.,
 ${{\partial {\delta ^ + }} \over {\partial \varepsilon }} \propto R$. The parameter
 $R = \left( {{{G{b^3}} \over {kT}} + \eta } \right)\left( {{1 \over {\ln \left( {{C_1}} \right) + \ln \left( Z \right)}}} \right)$ was identified from the saturation characteristics of work hardening in stage IV relevant to subgrain sizes, i.e., in the limit ε → ∞ given a certain strain-rate and temperature.Reference Abolghasem, Basu, Shekhar, Cai and Shankar11 In this equation, b is the Burgers vector (0.256 nm for Cu), G is the shear modulus = 47 GPa, η = 190.43 is a correction factor, and ln(C 1) = 14.77 (see Ref. Reference Abolghasem, Basu, Shekhar, Cai and Shankar11 for more details). A straightforward coupling with the principle of similitude therefore results in
 $$\rho _{\rm{i}}^{\rm{c}} = {\left( {{{q_{\rm{c}}^{{\rm{av}}}} / {\left( {0.25 - 0.03\varepsilon + 0.058R + 0.0003\varepsilon R} \right)}}} \right)^2}\quad ,$$
where  $q_{\rm{c}}^{{\rm{av}}}$ is the average of the q c obtained for the LSM sample conditions. Using Eq. (6), we can rewrite Eq. (7) as
 $$\rho _{{\rm{tot}}}^{\rm{c}} = \left( {1 + f\left( {q_{\rm{b}}^2 - 1} \right)} \right){\left( {{{q_{\rm{c}}^{{\rm{av}}}} / {\left( {0.25 - 0.03\varepsilon + 0.058R + 0.0003\varepsilon R} \right)}}} \right)^2}\quad ,$$
which is used to calculate the total dislocation densities for different sample conditions  $\rho _{{\rm{tot}}}^{\rm{c}}$ as listed in Table II. However, we notice discrepancies between the measured dislocation densities and the values obtained through Eq. (8), which may result from volume fraction of the cell walls. Here, we are using a constant value for volume fraction. However, as noted in Ref. Reference Lee, Yoon, Ahn, Park, Park, Park, Estrin and Kim33, the volume fraction of the cell wall is shown to be a function of strain.
From here, we approximate Eq. (8) using a quadratic Taylor series expansion. Considering Eq. (8) as f(ε, R), a multivariable function of strain and R, we can write the quadratic Taylor series expansion in a vector notation considering x = 〈ε, R〉 and a = 〈ε1, R 1〉 as
 $$f\left( {\bi{x}} \right) = f\left( {\bi{a}} \right) + \left[ {\left( {{\bi{x}} - {\bi{a}}} \right).\nabla f\left( {\bi{a}} \right)} \right] + \left[ {\left( {{\bi{x}} - {\bi{a}}} \right).\left( {H\left( {\bi{x}} \right) \cdot \left( {{\bi{x}} - {\bi{a}}} \right)} \right)} \right]\quad ,$$
where H is the matrix of second derivatives called the Hessian matrix as
 $$H\left( {\varepsilon ,R} \right) = \left[ {\matrix{ {{f_{\varepsilon \varepsilon }}\left( {\varepsilon ,R} \right)} & {{f_{\varepsilon R}}\left( {\varepsilon ,R} \right)} \cr {{f_{R\varepsilon }}\left( {\varepsilon ,R} \right)} & {{f_{RR}}\left( {\varepsilon ,R} \right)} \cr} } \right]\quad .$$
Ignoring the second-order terms in ε and R, we can rewrite Eq. (9) as
 $$f\left( {\varepsilon ,R} \right) \approx f\left( {{\varepsilon _1},{R_1}} \right) + {f_{\rm{\varepsilon }}}\left( {{\varepsilon _1},{R_1}} \right)\left( {\varepsilon - {\varepsilon _1}} \right) + {f_{\rm{R}}}\left( {{\varepsilon _1},{R_1}} \right)\left( {R - {R_1}} \right) + {1 \over {2!}}\left[ {2{f_{\varepsilon R}}\left( {{\varepsilon _1},{R_1}} \right)\left( {\varepsilon - {\varepsilon _1}} \right)\left( {R - {R_1}} \right)} \right]\quad .$$
It is important to select the expansion point a = 〈ε1, R 1〉 to the extent that it enables us to estimate the f(ε, R) as the total dislocation density for any given ε and R. It is recommended that this expansion point be selected such that it is closer to the points for which the function will be evaluated. The issues of suitably approximating the error are of importance here as well as making a choice that will increase the speed of convergence. Accordingly, we chose a = 〈3.4, 4.0〉 as this is around the center point in the design space and showed to possess the minimum average error (≈0.136) for the differences from the total dislocation densities [Eq. (8)] and the estimated values using Eq. (11). Around this point, Eq. (11) can be simplified as
 $${\rho _{\rm{T}}} = 2.60 \times {10^{15}} + 1.48 \times {10^{15}}\varepsilon - 2.30 \times {10^{14}}R - 2.00 \times {10^{14}}\varepsilon R\quad .$$
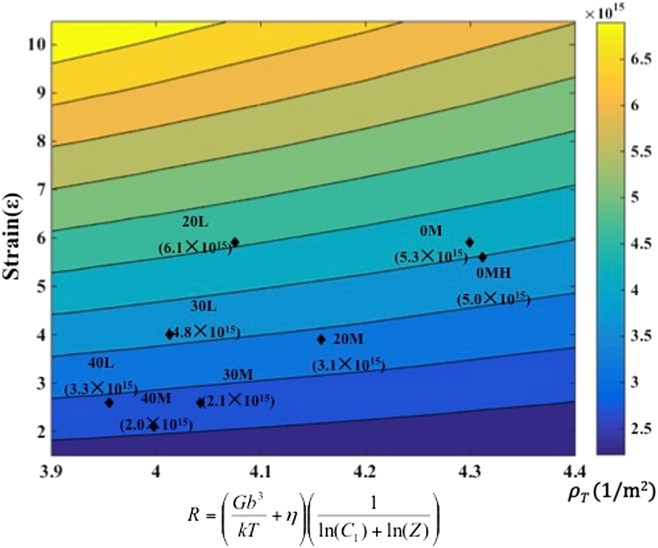
Eq. (12), as a function of ε and R, forms the framework elements of the rate-strain-microstructure (RSM) space. This equation describes the variation of dislocation densities across the swathe of the thermomechanical conditions for the broad range of LSM parameters in Table I. Although this equation captures the evolution of the dislocation density, its predictive role is only limited over the spectrum of the LSM thermomechanical conditions studied here. It is unclear if this relationship will hold beyond this regime. The total average dislocation densities (ρT) are calculated for different sample conditions as in Table II which show reasonable agreement with the experimental measurements (R Squared = 0.92) as it is noticeable by the contour map in Fig. 6. We should add that the above estimation does not include the 0 L case due to the fact that the thermomechanical conditions in this case render it an outlier.Reference Abolghasem, Basu and Shankar13 In Fig. 6, a contour map of dislocation densities illustrate the variation across strains, strain-rates, and temperatures according to Eq. (12). On this plot, we have marked the experimentally measured values for chip dislocation densities to facilitate the comparison for the corresponding deformation conditions.
RSM map of the dislocation densities (ρT) on the effective strain (ε) and R space. The experimental values of average dislocation density are marked on the contour plot to elucidate the fidelity of Eq. (15) in capturing the mean dislocation densities for the various LSM conditions.

Considering Eq. (12) as a Taylor series expansion function of the two variables R and ε, serving an analytic continuity in the form of below function we can write
 $${\rho _{\rm{T}}} = {\rho _0} + {{\partial {\rho _{\rm{T}}}} \over {\partial \varepsilon }}\varepsilon + {{\partial {\rho _{\rm{T}}}} \over {\partial \left( R \right)}}R + {{{\partial ^2}{\rho _{\rm{T}}}} \over {\partial \varepsilon \partial \left( R \right)}}\varepsilon R\quad ,$$
ignoring the second-order effect in R and ε.
Comparison of Eq. (13) with Eq. (12) implies the nature of the interactions between ε and the parameter R in elucidating the evolution and accumulation of dislocation densities. It is noteworthy that the positive coefficient for strain term in Eq. (12) confirms the expectation of higher dislocation densities with accumulation of deformation levels. Hence due to the role of the large strain in generating higher dislocations, for a constant R, we would hope for the following from Eq. (12):
 $${{\partial {\rho _{\rm{T}}}} \over {\partial \varepsilon }}\left| {R = {\rm{Const}} \approx {{\partial {\rho _{\rm{T}}}} \over {\partial \varepsilon }}} \right. + {{{\partial ^2}{\rho _{\rm{T}}}} \over {\partial \varepsilon \partial \left( R \right)}}R > 0\quad .$$
Replacing the coefficient values from Eq. (12) in Eq. (14), we obtain  $\left. {{{\partial {\rho _{\rm{T}}}} \over {\partial \varepsilon }}} \right|R = {\rm{Const}} \approx 1.48 \times {10^{15}} - 2.00 \times {10^{14}}R$, which is positive for the range of R here. According to the form of the equation for R, as temperature goes up, R usually increases for the thermomechanical conditions studied here, which leads to an increase in subgrain size. Consequently due to the principle of similitude, the increase in subgrain size correlates with the decrease in dislocation density. Thus, for a constant strain value, Eq. (12) should manifest a negative correlation to confirm a decreasing dislocation density with increasing deformation temperature:
 $${{\partial {\rho _{\rm{T}}}} \over {\partial \left( R \right)}}\left| {\varepsilon = {\rm{Const}} \approx {{\partial {\rho _{\rm{T}}}} \over {\partial \left( R \right)}}} \right. + {{{\partial ^2}{\rho _{\rm{T}}}} \over {\partial \varepsilon \partial \left( R \right)}}\varepsilon \lt 0\quad .$$
Substituting the coefficient values from Eq. (12) in Eq. (15), we obtain  $\left. {{{\partial {\rho _{\rm{T}}}} \over {\partial \left( R \right)}}} \right|\varepsilon = {\rm{Const}} \approx - 2.30 \times {10^{14}} - 2.00 \times {10^{14}}\varepsilon \lt 0$, which is negative for all strain values.
Finally, we would like to perform the complementary verifications, which is the interactive effect of strain, strain-rate, and temperature being exhibited in the last term on the right side of Eq. (12), which is a second-order expression in terms of strain and R (a function of strain-rate and temperature). This second-order term captures the frequently acknowledged consequence that the rate of dislocation density accumulation becomes less positive derivative with respect to strain as the deformation temperature increases, i.e.,  ${{\partial {\rho _{\rm{T}}}} \over {\partial \varepsilon }}\left| {T = {T_1} \lt {{\partial {\rho _{\rm{T}}}} \over {\partial \varepsilon }}} \right|T = {T_2}$ if T 1 > T 2. Since increasing T results in increasing R over the range of thermomechanical conditions in this study, we should expect that
 ${{\rm{d}} \over {{\rm{d}}\left( R \right)}}\left( {{{{\rm{d}}{\rho _T}} \over {{\rm{d}}\varepsilon }}} \right) \lt 0$ or
 $\approx {{{\partial ^2}{\rho _{\rm{T}}}} \over {\partial \varepsilon \partial \left( R \right)}} \lt 0$ based on which from Eq. (15) we find
 ${{{\partial ^2}{\rho _{\rm{T}}}} \over {\partial \varepsilon \partial \left( R \right)}} = - 2.00 \times {10^{14}} \lt 0$.
We anticipate that the present elucidation along with our previous accomplishments would help in the modeling of mechanical strength manifested by the benefits from modeling of the evolution of the grain size, subgrain size, and dislocation density, which might ultimately result in demarcation of property mappings of the final microstructure. In addition to this, a similar analysis could be accomplished for the stored energies, and finally these mappings could lead to capturing the process–structure–performance triad for a wide-ranging gamut of LSM thermomechanical settings.
B. Inferences on the RSM mapping
The presented RSM mapping is expected to offer process design tools by relating the microstructural features, here dislocation densities to subregions of a physically based parameterized space. This is a reasonable expectation given the unique role of R as a “finger print” of thermomechanical material dependent response and from the even more recognized role of deformation strain in determining microstructure evolution. This analytical approach could potentially assist in design and control of microstructures obtained by shear-based metal cutting processes, which play the role of the mainstay in the manufacture of metallic components. These include the ubiquitous machining manufacturing processes that impart a severely shear deformation on manufactured components in milling, drilling, turning, shaping, etc.
Interestingly, the LSM framework may also offer opportunities for capturing the microstructures on machined surfaces resulting from conventional machining technologies that are almost universally used as the last manufacturing step. The freshly generated surface from machining is subjected to severe deformation, very similar to the chip although the level of deformation declines into the bulk. Controlling and predicting the microstructure response here in the form of dislocation densities on machined surfaces to achieve tunable characteristics may be beneficial, given its direct relevance to the physics of grain refinement. This approach can offer the possibility of avoiding secondary steps in the process of surface modification to achieve enhanced final properties. The modified surface microstructure can affect product life-cycles and multifunctional properties as a function of the crystal structure. Mappings akin to that in Fig. 6 could be utilized in conjunction with suitably parameterized finite element models of machining processes, i.e., turning, milling, and drilling to identify the thermomechanical parameters of SPD to predict and control the surface grain structures. We believe that such broader aims could be accomplished through a constant enhancement of the reliability of the RSM mappings, which requires gathering of more experimental data sets. Furthermore, this step is vital for evaluating the constants in Eq. (15) for a more fundamental examination of the underlying mechanisms.
V. CONCLUSION
This study used LSM to understand the microstructure evolution under severe shear conditions characterized by strain, ε ∼ (1 − 10), strain-rates,  $\dot{\varepsilon }\; \sim \;\left( {10 - {{10}^3}{\rm{/s}}} \right)$, and thermomechanically coupled temperature rise, through the correlation between the subgrain size and dislocation densities. The LSM configuration allows for in situ measurements of the thermomechanical conditions leading to examination of the relationship between the subgrain sizes and the stored dislocation densities. Building on this correlation, the mapping parameterization of dislocation densities was derived based on the “similitude” principle in stage IV of work hardening, i.e., the dislocation density storage and the subgrain size evolutions maintain self-similarity during the progressive refinement of the microstructure during deformation. The robustness of this principle was explored under broadly varied deformation conditions involving combinations of large strains and strain-rates that surpass that examined in prior studies.
The principal contribution arises from capturing the process–structure relationships on a RSM map with the x axis as a “rate” parameter R being a function of strain-rate, temperature, and material-dependent constants and the y axis as strain. A quadratic Taylor series expansion was approximated to project the microstructural consequences (average dislocation density, subgrain size). This tool would essentially enable mapping each point on the space to the axes (thermomechanical conditions) in a one-to-one manner thus offering a simple framework for predicting/controlling microstructure response (here dislocation densities). Establishing on the mappings, we demonstrated that under the LSM-relevant conditions, the principle of similitude is preserved in the form where,  $\delta \sqrt {{\rho _{\rm{i}}}} \; \sim \;9.09$; the dislocation density (ρi) scales in a self-similar manner with the subgrain size (δ).
ACKNOWLEDGMENTS
The authors gratefully acknowledge support from the National Science Foundation (Award Nos. 1635966 and 1635926). S. Abolghasem acknowledges the funding support from Colciencias grant code 120474557650 and the 2017 grant from school of engineering at Universidad de los Andes, Bogotá, Colombia. S. Basu also acknowledges partial support from faculty startup funds from the Harold and Inge Marcus Department of Industrial and Manufacturing Engineering and the support of the College of Engineering Multidisciplinary Seed Grant program at Penn State University.