Politicians are thought to love public works. Bridges, highways, and subways can be named after politicians, opened in ribbon-cutting ceremonies, and advertised on billboards. Construction contracts are traded for jobs, personal rents, and campaign donations (Boas, Hidalgo, and Richardson Reference Boas, Hidalgo and Richardson2014; Garfias, Lopez-Videla, and Sandholtz Reference Garfias, Lopez-Videla and Sandholtz2021; Samuels Reference Samuels2002). Yet, globally, spending on critical public works—transport, utilities, communications, and so on—lags. Developing countries, and particularly their burgeoning cities, have substantial infrastructure deficits that hinder economic growth and reduce social welfare (McKinsey Global Institute 2013).
These shortfalls are acute in the case of public transportation. Unlike many other problems, traffic initially tends to get worse, not better, with development, as more individuals can afford cars and take to the roads.Footnote 1 Urbanization often proceeds more rapidly than investments in transportation infrastructure. The costs of infrastructure deficits fall most heavily on the poor, who depend on public transit and often live on the urban periphery. They waste hours in traffic and lose out on many of the job opportunities, productivity gains, and social networks that come with urbanization (Bryan, Glaeser, and Tsivanidis Reference Bryan, Glaeser and Tsivanidis2019). Transit fare increases and service disruptions have threatened to bring down governments in Brazil, Indonesia, and South Africa, and protests led to calls for a new constitution in Chile.
Conventional wisdom is that uneven geographic benefits make it hard to finance needed public works. Public works, such as transit projects, are physically situated state investments. Unlike pure public goods that provide diffuse benefits to all citizens, public works serve those who live nearby, and often are useless to those far away. If governments use general taxation to pay for infrastructure projects, they can provoke political opposition from more distant areas (Altshuler and Luberoff Reference Altshuler and Luberoff2003; Weingast, Shepsle, and Johnsen Reference Weingast, Shepsle and Johnsen1981). While logrolling can build political compromises through the exchange of small projects, it works poorly for large investments and those that generate uneven benefits within districts. The solution favored by economists, drawing on the classic ideas of George (Reference George1879), is to tax the land value increases generated by public works (Arnott and Stiglitz Reference Arnott and Stiglitz1979; Bergstrom Reference Bergstrom1979; Posner and Weyl Reference Posner and Weyl2018). Indeed, Taiwan, Singapore, Japan, and Hong Kong all use land-based instruments to fund their mass transit systems (Suzuki, Murakami, and Hong Reference Suzuki, Murakami and Hong2015). Yet, the underlying assumptions remain untested. Does support for public works vary primarily based on where an individual lives? If so, can a land tax strengthen political coalitions and increase transportation investments?
Existing public opinion data are ill suited to understand who benefits and who is willing to pay for public works. Public works tend to be valence issues, that is, issues on which almost all voters have the same directional preferences, like reducing crime or increasing economic growth (see, for example, Stokes Reference Stokes1963). People primarily differ in their willingness to prioritize or pay for investments when judged against other uses of public funds. In the costless environment of surveys, these trade-offs are not considered. Furthermore, representative surveys rarely consider geographic proximity to measure personal stakes in public works.
This study enriches demand-side theories of public works by incorporating the local geography and intensity of citizen preferences. I conducted a unique survey that, for the first time, sampled respondents living at different functional distances from a proposed transportation project: a subway in Bogotá, Colombia. I then assigned respondents to answer questions about spending priorities using a novel technique from economics known as “quadratic voting” (QV) (Cavaillé, Chen, and Van der Straeten Reference Cavaillé, Chen and Van der Straeten2019; Cavaillé, Chen, and Van der Straeten Reference Cavaillé, Chen and Van der Straeten2022; Lalley and Weyl Reference Lalley and Weyl2018; Quarfoot et al. Reference Quarfoot2017). In essence, individuals allocate a budget across a set of issues to make talk “less cheap.” The method does much better than traditional survey items in separating weak and strong supporters, while retaining a natural interpretation of support and opposition. The Bogotá subway is an ideal case study because the project had a defined route at the time of the survey, which made the uneven geographic access concrete. Yet, substantial uncertainty remained around the financing.
I test whether geographic models are a good description of public views of the subway, and whether taxes tied to nearby land values strengthen political coalitions. I find limited support for both hypotheses, for reasons consistent with each other. There is limited support for the idea that preferences vary by distance, and proposing land value capture or logrolling in a survey experiment does little to budge public support. Instead, I find original observational, experimental, and qualitative evidence consistent with a view of support for public works that is driven by concerns about externalities. The strongest supporters of the metro are upper-class groups that care about quality-of-life issues, such as traffic, pollution, and economic investment. An experiment to make the externalities salient in a natural way—by taking the survey just after the evening rush hour—increases support, particularly among the wealthiest respondents. Focus groups support an interpretation of the results in which upper-class respondents want others to take public transit to reduce congestion and improve their quality of life. I consider the implications for the provision of public transportation, survey research, and urban politics in the developing world in the conclusion.
The Public Works Problem
Political scientists differ in how they characterize the “problem” of public works. I review three major perspectives, which differ in their conception of the scope of beneficiaries, the likely opponents of public works, and the mechanisms likely to expand political coalitions.
Throughout, I focus on the political demand, rather than supply, of public works. Compared to other policy spheres, public opinion may be particularly important because large public works often require explicit popular approval to build or fund, such as Panama's referendum to expand the canal or California's mass transit ballot initiatives. That said, broader features of the institutional environment like administrative capacity, political competition, interest group pressure, and campaign finance needs can shape how public preferences translate into investment outcomes (see, for example, Garfias, Lopez-Videla, and Sandholtz Reference Garfias, Lopez-Videla and Sandholtz2021; Jacobs Reference Jacobs2011; Min Reference Min2015; Nall Reference Nall2018).
A Geographic Theory
Uneven geographic benefits are at the heart of how numerous social scientists view the public works problem. Those who live near public investments receive greater benefits than those who live far away. Geographically defined benefits lead preferences to cluster in space (Rodden Reference Rodden2010). Heterogeneous spatial preferences are a primary justification for decentralization (Alesina and Spolaore Reference Alesina and Spolaore2003; Treisman Reference Treisman2007). In the United States, states took charge of large public works because most areas of the country were made worse off through tax increases and so construction projects could not command a majority of votes in national legislatures (Wallis and Weingast Reference Wallis and Weingast2005). In Colombia and Ecuador, strong regional elites historically undermined public works projects because areas that saw few benefits from large projects voted against their provision (Soifer Reference Soifer2016).
An informal way to build support for public works is through logrolling. Politicians trade projects across local constituencies that each want public works for their geographic area (Evans Reference Evans2004; Wallis and Weingast Reference Wallis and Weingast2005). However, such a strategy of “something for everyone” works poorly for large investments and those with uneven benefits within the same geographic area (Altshuler and Luberoff Reference Altshuler and Luberoff2003). While “point” projects, such as schools and hospitals, can be swapped across districts, “line” projects, such as subways, highways, and utilities, involve unequal access within districts.
Within districts, public works often have differential effects on property owners and renters due to their impact on land values. Public works can create rents for landowners by making their property and neighborhoods socially desirable. Increases in land values can be substantial for public works that offer positive amenities, such as parks, schools, and subways. For instance, the extension of the Jubilee Line of the London Underground increased land values by US$3.9 billion in nearby areas (Harrison Reference Harrison2006, 15). High-quality public transit also increased property values and private investment in Latin American cities (Gonzalez-Navarro and Quintana-Domeque Reference Gonzalez-Navarro and Quintana-Domeque2016; McIntosh et al. Reference McIntosh2018). Meanwhile, renters often pay higher rents and face gentrification from large public works.
One classic mechanism to resolve these conflicts across space and ownership categories is land value capture. George (1884) developed the idea that individuals should pay the “unearned increment” of land values. For example, if the government builds a road that increases market access and thereby raises land values, the owner should pay the government some fraction of the increased value. If the road is distant from a second person's property, they should pay nothing (or much less than the first). Land taxes, and related “value capture” instruments, charge individuals for the benefits that governments create in the least distortionary way possible. Property taxes discourage development because owners pay taxes on the investments they make, as well as those that result from government action. In contrast, individuals cannot change the supply of land.
Formal models suggest that land taxes expand political coalitions in support of public works. Arnott and Stiglitz (Reference Arnott and Stiglitz1979) formalized the “Henry George theorem,” showing that a land tax is efficient and necessary to finance desirable public works. In its absence, beneficial projects will not be built because strong supporters make inadequate payments to fund the project. Those who live far away refuse to foot the bill. Land taxes, in contrast, ask individuals to pay in proportion to the benefits that they receive (see also Bergstrom Reference Bergstrom1979). Those who live far away pay less, and thereby should increase their support for specific public works. Those who live nearby pay more, but still should remain in favor of the project given the windfall benefits received. The result is a more even base of support for public works across space.
Due to the difficulties funding urban infrastructure and rising wealth inequality, land taxes are experiencing a revival (see, for example, Bloomberg View 2017; Orszag Reference Orszag2015; The Economist 2018; Vanity Fair 2017). Nonetheless, the principle behind geographic models and associated land-tax instruments remains untested. Governments assume that benefits vary based on distance and ownership status. A geographic model has several distinct empirical predictions that I examine: (1) individuals who live near projects are more supportive than those who live far away; (2) nearby property owners are more supportive than renters; and (3) value capture creates a more spatially homogeneous support base for public works compared to general taxation.
A Redistributive Theory
There are several reasons why the benefits from public works may not be tied to location. An alternative redistributive approach sees the divisions around public works in class terms. From this perspective, the problem of public works is that the capital costs (that is, the average cost) exceed what can be recovered through user fees (that is, the marginal cost). As Hotelling (1938, 248) puts it: “Public works will frequently be of great social value even though there is no possible system of charging for their services that will meet the cost.” Governments, then, must step in to fund public works through taxes, opening the door to class conflict.
Class tensions develop because the rich pay more than they get from public works. As in classic material theories of redistribution (see, for example, Meltzer and Richard Reference Meltzer and Richard1981) or models of public goods (see, for example, Lizzeri and Persico Reference Lizzeri and Persico2001), taxes are proportional to income, whereas government benefits are flat with income. Public works thus raise divergent views on the size of government and become a partisan issue. Especially in the United States, antigovernment conservatism has been shown to motivate opposition to public works (Galbraith Reference Galbraith1960; Jacobs and Matthews Reference Jacobs and Matthews2017; Nall Reference Nall2018, ch. 4). Subways are among the most expensive infrastructure projects in a country and therefore can generate tensions around how to pay for investments.
Different use patterns can further exacerbate redistributive conflict. In many places, the poor use public works, like parks, public schools, or public transportation, more intensively than the rich, who can afford higher-quality private alternatives. An additional source of class resistance occurs when public works make upper-class neighborhoods accessible to the poor. Affluent areas have blocked the extension of subway lines in Washington DC in the United States, Beirut in Lebanon, and São Paulo in Brazil.
From this perspective, the structure of taxes affects the likelihood of class conflict. Direct taxes—or ballot initiatives that make needed tax increases visible—heighten class divisions around public works compared to indirect funding models. Empirically then, a redistributive model makes two core predictions: (1) support for public works decreases with income; and (2) support among the upper class declines with more visible and progressive taxes.
An Externality Theory
A third externality perspective emphasizes the broad benefits of public works. In the previous approaches, attitudes derived from the land rents or use value created by public works. However, public works matter for their externalities, which are poorly valued by markets and are what Besley et al. (Reference Besley2004) call “high spillover goods,” where benefits extend beyond the direct catchment area.
Externalities are thought to drive public attitudes toward a variety of state investments. For instance, it has been argued that firms favor education expenditure because it increases their productivity (Romer Reference Romer1990). The rich support redistribution in part to reduce crime (Rueda and Stegmueller Reference Rueda and Stegmueller2016). The high density of cities means that citizens are sensitive to others' actions. The rich, for instance, may subsidize local public goods in poor areas to prevent power outages, disease outbreaks, or crime from spilling into their communities (McRae Reference McRae2015; Min Reference Min2015; Xu Reference Xu2020). Subways are promoted in part for their indirect effects, such as reduced car traffic, greater road safety, and improved air quality (Gendron-Carrier et al. Reference Gendron-Carrier2021).
The usual thinking is that concern about externalities increases with income. Inglehart (Reference Inglehart1981) developed the concept of post-materialism to distinguish whether European voters cared about “materialist” issues, such as redistribution, security, and inflation, or “post-materialist” issues, such as participation, the environment, and social values. Many of the externalities from public works fall into the latter, post-materialist category. Wealthier individuals have the luxury to focus on broader concerns about quality of life, whereas the poor worry about immediate consumption. Another way to think about it is that the marginal utility of private consumption declines with income, leading public goods to become more attractive. Public works (say, paying to improve a badly paved road) can do more to boost upper-class welfare than increased private spending (such as buying another fancy car) (Galbraith Reference Galbraith1960, ch. 17). Individuals also may care more about public works when aware of their positive externalities. Events that make salient the need for public works, such as traffic jams, a disease outbreak, or a collapsed bridge, might build popular support.
An externality approach contrasts with the previous theories. Min (Reference Min2015), for instance, provides an excellent account of how there are few pure public goods because most public goods can be made excludable through choices about their implementation and local distribution, creating geographic cleavages. An externalities approach makes the opposite point: there are few truly spatially bounded public goods. Local geography thereby matters little for public support, especially in dense urban areas. Unlike redistributive theories, it is upper-class groups that care most about the spillover effects. Taken together, an externality approach thus predicts: (1) upper-class groups support public works more than lower-class ones; and (2) upper-class support increases with the salience of externalities.
Context: The Bogotá Subway
I test these competing theories in the context of the subway in Bogotá, Colombia, for several reasons. First, subways are salient political issues in many cities in the developing world like Bogotá. Bogotá is Colombia's capital and home to nine million people. Traffic is a major problem: the average resident of Bogotá spends ninety-seven minutes commuting to and from work, and a third of residents spend more than two hours (Moovit 2018). Most cities of similar size and wealth have subways (see Figure A.1 in the Online Appendix). The subway is a frequent topic of debate in city elections. In 2011, for instance, Gustavo Petro promised to build a metro, while his main opponent, Enrique Peñalosa, vacillated. Many analysts believe that Peñalosa's resistance to the metro cost him the election. Peñalosa reversed his position and said he would build a subway when he ran for election again in 2015. He then won office.
Secondly, the Bogotá metro is at an ideal stage of project development. One challenge in studying public works is when to capture attitudes. The more that construction advances, the more the specific details of implementation influence popular attitudes. People also begin to move in and out of neighborhoods based on their expectations for a given project. Yet, geographic theories are difficult to test with a purely abstract project, with no defined route to make the winners and losers concrete to survey respondents. I therefore looked for a project that had a defined route with clear spatial beneficiaries but where construction had not begun and there was minimal selection into the project.
The Bogotá subway plan studied here comes from the Petro administration. As mayor, Petro commissioned a study of the metro and proposed a mostly underground project stretching eighteen miles with twenty-seven stops. President Juan Manuel Santos presented a symbolic check to fund the subway for US$20 billion, expressing the national government's commitment to the project. However, mayors in Colombia cannot run for reelection, so Petro left office with the project plans in place and campaign promises from the major candidates to continue a metro. The survey for this article occurred in August 2016, when it looked like the route developed under Petro would be built.Footnote 2
Thirdly, Bogotá resembles many cities in the developing world characterized by geographic segregation, unmet basic needs, and government constraints. As in many cities that grew through unplanned sprawl, the poor primarily live on the urban periphery in Bogotá and have longer commutes. The rich are concentrated in the city center and north. They not only have more direct access to a subway project in the city center, but also tend to own cars.Footnote 3 The empirical findings likely apply best to other cities in which the poor live on the city outskirts and upper-class groups can use or experience spillover effects from a downtown metro.
Even if the poor benefit from improved transportation, it is unclear that it ranks as a top priority given other unmet needs, such as schools, parks, or public security. Bogotá would need to suspend other transit works to build an underground metro (El Tiempo 2014). At US$7.5 billion, or roughly US$400 million per mile, the underground metro proposed by Petro would cost ten times more than a bus rapid transit (BRT) line. For comparison, Colombia's conditional cash transfer program (Familias en Acción) has a national budget of just US$583 million per year. For these reasons, the metro can be seen as an upper-class aspiration in conflict with the poor's needs. Peñalosa opposed the metro in 2011 out of concern for the mobility of those Bogotá residents whom the metro would not serve, the limited funds available for alternative projects, and the more limited visibility of the poor on the subway compared to BRT routes that travel alongside cars (Al Garete 2016; El Tiempo 2011).
Bogotá is like many other cities in the developing world, in that distrust in government and how to fund infrastructure hinder its provision. The Bogotá metro proposal studied came on the heels of a corruption scandal in which a previous mayor, Samuel Moreno, took kickbacks for BRT contracts. In my survey, 89 per cent of respondents believe that money will be lost to corruption in building a metro project (see Table A.1 in the Online Appendix). How to pay for the project remains disputed. Colombia has a strict formula to limit national contributions to 70 per cent of mass infrastructure costs. Bogotá has debated land value capture to fund about half of the city's financial contribution to the project (Instituto de Desarrollo Urbano 2015). In my survey, 28 per cent of Bogotá residents have paid value capture contributions in the past, on par with the 31 per cent who pay income taxes (see Table A.3 in the Online Appendix). However, Petro vacillated on the use of land value capture.Footnote 4
Existing surveys provide limited leverage to gauge opinion on who supports the metro and how support varies with the financing options. Bogotá's urban development agency conducted a survey that asked respondents: (1) “How much do you approve of the metro?”; (2) “Do you think a metro will benefit the city?”; and (3) “How should the metro be financed?” More than three-quarters of residents strongly support the construction of a metro and 90 per cent think that the metro will benefit the city. Yet, two-thirds of city residents also say that the national government should pay the full cost of the project (Instituto de Desarrollo Urbano 2015). By law, this will not happen. I now turn to how a new survey technique from economics can make sense of the real trade-offs between public priorities.
Measuring Preference Intensity
In the real world, more spending entails taxes, debt, or program cuts elsewhere. Public investments in one area also can divert funds from other areas. Political attention also is limited. Building a metro means that politicians and bureaucrats spend less time discussing or working on solutions to crime, environmental degradation, or unemployment. Yet, standard public opinion surveys ask respondents to answer a battery of questions with no consideration of such funding and agenda constraints. Political scientists also tend to bracket issues of differing preference intensity. Gilens (Reference Gilens2012, 37–8), for instance, acknowledges that citizens differ in the extent to which they care about different issues and that these differences in what citizens want to hear about may change our judgments about democratic responsiveness. Nevertheless, data constraints prevent incorporating preference intensity into most surveys.
Most public opinion research still relies on the Likert scale—an ordinal scale that runs between extremes (that is, “strongly disagree” to “strongly agree”). This scale has known shortcomings. Respondents are free to give extreme answers, even on issues that they care little about. Answers mix the “response style” of an individual, meaning whether they favor extreme or moderate categories, with the actual intensity of views. Valence issues have a skewed distribution, clumped at the most extreme responses on a Likert scale. Individuals nonetheless may differ substantially in their willingness to pay to achieve various objectives and their desire that governments prioritize a given issue. Stokes (Reference Stokes1963: 372–3) himself recognized that position issues are “lurking behind valence issues” given associated budget and attention trade-offs.
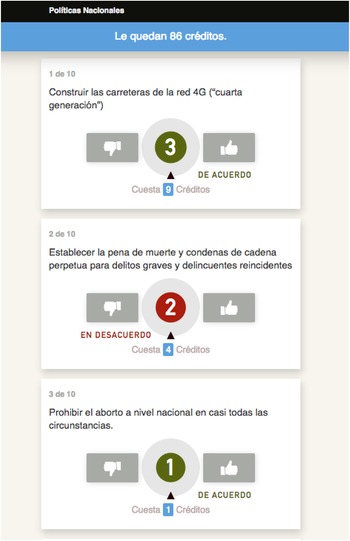
I rely on a new approach to the measurement of preferences from economics known as “quadratic voting” that has started to be applied to survey research (Cavaillé, Chen, and Van der Straeten Reference Cavaillé, Chen and Van der Straeten2019; Cavaillé, Chen, and Van der Straeten Reference Cavaillé, Chen and Van der Straeten2022; Lalley and Weyl Reference Lalley and Weyl2018; Quarfoot et al. Reference Quarfoot2017). QV is a budget method that measures preference intensity by asking respondents to allocate credits across a set of issues, or a choice set. Figure 1 shows the user interface. Respondents vote in favor (thumbs up) or against (thumbs down) each issue, revealing the direction of their opinion as in a standard Likert survey. In addition, respondents choose how many credits to place on each issue, capturing the intensity of their views across the choice set.Footnote 5
Quadratic voting platform.

The price for each vote is quadratic, so it becomes increasingly costly to acquire additional votes to express support or opposition to the same issue. Circles illustrate the number of votes purchased on a given proposition, while the small boxes below show the cost in credits. The counter at the top shows the credits available for response items. The mathematical intuition of the quadratic price is that the marginal cost—the additional credits that a voter must pay to cast an additional vote—is proportionate to the number of votes purchased. Therefore, the respondent who values an issue twice as much is faced with having to use double the credits to express their stronger support (Lalley and Weyl Reference Lalley and Weyl2018). The survey intuition is that QV avoids the “bunching” of votes on a single issue observed on standard Likert scales. Respondents can revise their answers as many times as they want and, in this way, think about the tradeoff in dedicating more resources to a single issue versus distributing their credits across different issues. A linear budget is less cognitively intensive but runs the risk that respondents allocate all their points to one issue (for discussion, see the Online Appendix). In focus groups, most Colombians understood the idea of using more credits to show greater passion for an issue, though they did not understand the precise quadratic form.
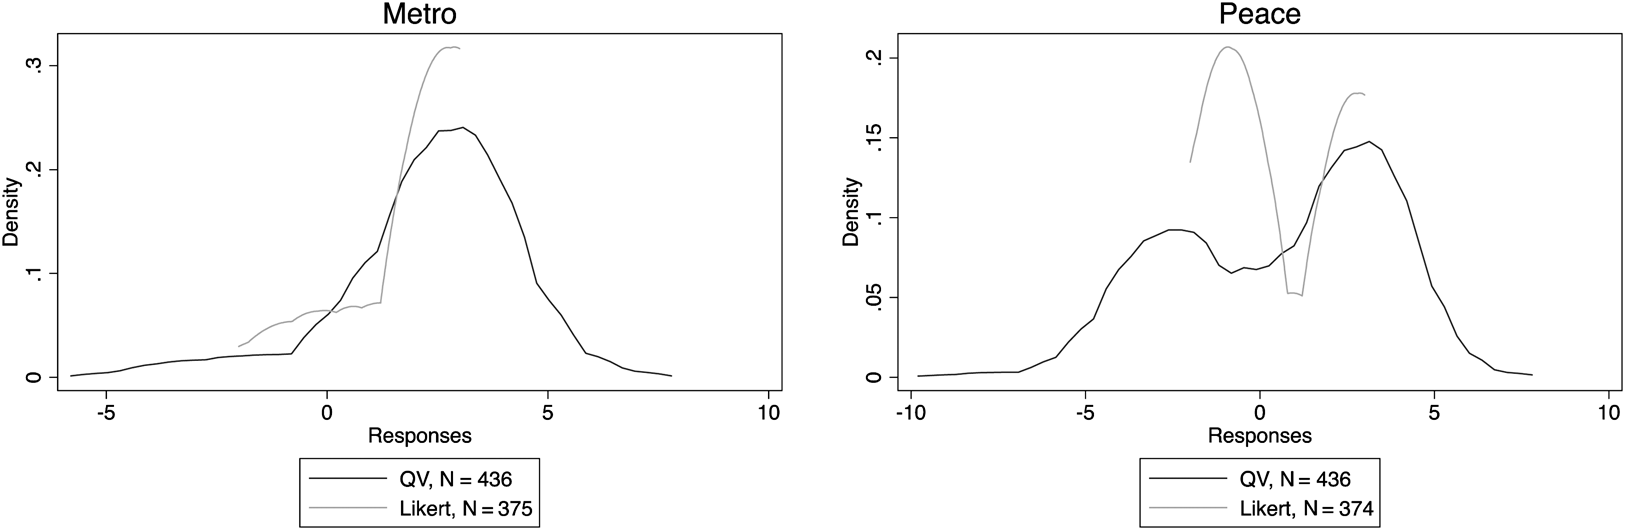
The advantage of budget methods like QV is that they separate more moderate and extreme views on an issue. To make this more concrete, I conducted an initial probe in which I asked half of respondents to allocate 100 credits in favor and against ten national issues, which I explain further in the following. The other half evaluated the same issues on a standard seven-point Likert scale. The left panel of Figure 2 shows that for a valence issue like the metro, Likert truncates responses. More than 70 per cent of respondents strongly agree (rescaled as a “3” on a scale from −3 to 3) that the city should build the metro, so the curve shoots up for the strongest support category. QV produces a bell-shaped distribution of responses, which disentangles the strength of support across individuals.Footnote 6 The right panel shows responses on a polarizing issue: peace. My survey took place a month before Colombians narrowly rejected the peace agreement in a plebiscite, with Bogotá residents largely voting in favor. Both survey methods reveal the bimodal structure of preferences over the peace deal, but QV separates those with more moderate to extreme views.
Comparing QV and Likert responses.

While QV can capture preference intensity, it measures intensity with respect to a defined choice set. In this sense, QV is like ranking questions (as opposed to rating ones), which ask respondents to order a set of researcher-designed options, and conjoint experiments in which respondents choose between defined bundles of attributes. Nothing guarantees that respondent choices would be similar if the researcher changed the options. Moreover, as I return to later, the interpretation depends on the ways in which issues are linked. The goal is to figure out how respondents allocate attention or funds across a plausible set of issues, rather than in an unconstrained setting in which all policies and expenditures are possible.
Sampling and Data
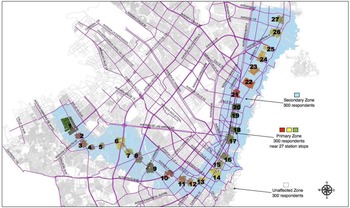
I ran an original public opinion survey of 900 respondents living in Bogotá, Colombia. A representative survey was inappropriate to probe geographic theories of public works. I instead designed a stratified sample to guarantee an adequate sample size living within key distances from proposed metro stations and drawn from each major class group. Following standard practice in urban planning, I divided the city into three zones, as shown in Figure 3. These consist of: (1) a primary zone (500 m, or roughly one-third of a mile) around each metro station (the colored areas); (2) a secondary zone within walking distance (1,000 m, slightly under one mile) of a station (shaded in blue); and (3) an unaffected zone far (more than 1,000 m) from a station (no color). Each respondent saw a map (without the zones) of the proposed metro route. The sampling was done to vary distance from metro stations, rather than linear distance from the metro line, which that might not capture functional proximity.
Sampling around Bogotá's metro stations.

To test redistributive theories, I ensured an adequate sample size drawn from different class groups. Unlike other developing countries, the Colombian government reifies class distinctions by classifying each household into strata that range from 1 (the poorest) to 6 (the highest). These strata are used to set utility rates and property taxes, but they also take on social meaning.Footnote 7 Individuals know their strata assignment, and politicians discuss “low” and “high” strata groups. Strata 1 and 2 are considered low-income households, 3 as lower-middle class, and 4 and above as upper-middle class. I refer to the highest strata as “upper class” to indicate that the group includes the upper-middle class and not just the rich. Within each of the three geographic zones around the metro, I randomly selected 130 lower-, 130 middle-, and 40 upper-class respondents. These shares are in line with the relative population shares (Bogotá's population is 49 per cent low, 36 per cent lower-middle, and 14 per cent upper strata [for additional details, see Table A.2 in the Online Appendix]).
The survey instrument was administered on computers. Enumerators were trained to assist respondents with any difficulties using the computers and to help explain the novel QV module. Not all areas of the city have reliable wireless connections, and high crime rates made it difficult for enumerators to carry portable electronic devices and modems to certain neighborhoods. To ensure the coverage of even more dangerous neighborhoods, survey enumerators therefore recruited respondents (based on their class group) to take the survey in a nearby Internet cafe. This method of recruitment allowed for greater control over the geography and timing of the survey relative to an online convenience sample. In the Online Appendix, I describe the nonstandard recruitment approach and response rates, along with descriptive statistics in Table A.3.
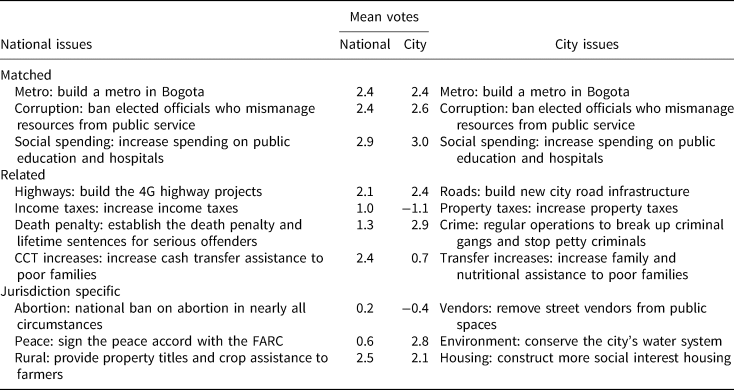
I designed two rounds of QV questions based on national and city issues on the political agenda. All governments in Colombia write legally binding development plans that set out their public policy priorities across a range of areas. I used the development plans to define the choice set. The first round of questions asked respondents to allocate 100 points across the ten national issues shown in the left column of Table 1 and included in the Plan Nacional de Desarrollo (National Development Plan). I then embedded an experiment about how the metro project would be financed within the survey, followed by a second round of QV questions about city priorities shown in the right column of Table 1 and drawn from Bogotá's Plan de Desarrollo Distrital (Development Plan).
The choice set for national and city issues

Notes: CCT = Conditional cash transfer; FARC = Revolutionary Armed Forces of Colombia.
The choice sets differ to reflect each level of government's powers and priorities. I included several issues on which both national and city authorities have responsibility. As the central column in Table 1 shows, average support for these issues is quite similar, even though the other issues in the choice set changed. Other issues were related but formulated to reflect the distinct powers of each level of government. The national government, for instance, sets income taxes, whereas the city government sets property tax rates. Other issues, like the peace process or street vending, are only controlled by one level of government. An alternative design would have included only expenditure items in the choice set to emphasize the financial trade-offs that many individuals and policymakers see in the metro. However, development plans include a mixture of spending and regulatory priorities, and there is no clear plan for alternative uses of resources over the decades that the metro would demand funds.
There were two embedded experiments. The first was a traditional survey experiment that varied information about the metro financing. The control condition described a vague funding mechanism. Two treatments then probed whether geographic divisions exist in the public and therefore whether making instruments like value capture or logrolling salient can alleviate conflicts. The third treatment tried to make taxes more visible and progressive by suggesting that the metro would be funded through a property tax (controlled by the city government). I emphasized that the property tax would be based on the commercial value of property, which is more closely tied to wealth than Bogotá's existing system, which puts entire neighborhoods into tax brackets. The exact treatment conditions were as follows:
Control: As you may have heard, the city has completed studies to build a metro in Bogotá. The project will be financed through the city's general revenue and national funds.
Value capture: [control] … and a new value capture in which those who live near the project will pay more than those who live far away.
Logrolling: [control] … and new investments will be made in roads and public works in districts that have less access to the metro line.
Property tax: [control] … and a new property tax in which owners pay based on the commercial value of their property.
In a second, less conventional experiment, I assigned enumerators to administer the survey to neighborhoods before or just after rush hour. Taking the surveys at the end of the evening commute was intended to make traffic problems in the city salient in a realistic way. If respondents are more supportive of the metro when traffic is salient, it would be consistent with an externality theory which posits that support is conditioned by the anticipated spillovers from an investment. I also probed the importance of externalities through six focus groups held in neighborhoods that varied in their class profile and distance from the metro.
The treatments were assigned through simple randomization. Balance tests uncover a slight difference in the mean age of respondents across the treatment groups, but an omnibus F-test is not significant (see Table A.4 in the Online Appendix).
Descriptive Results
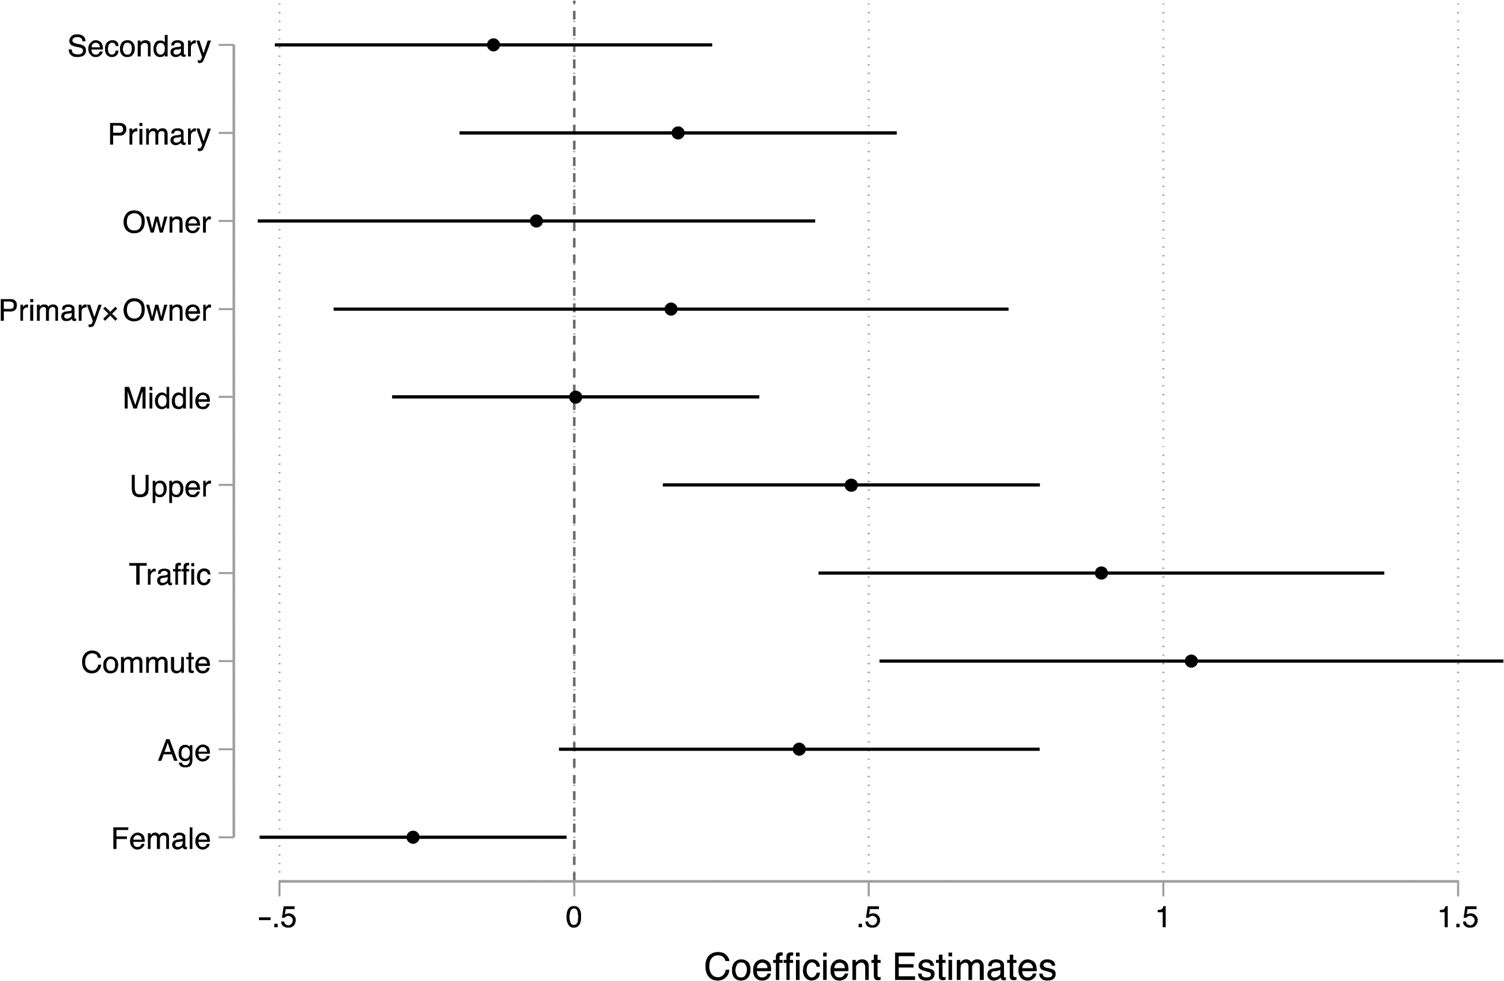
I first test the competing predictions about who supports the metro in the observational data. I measure support by the number of votes that respondents place on the metro, compared to other possible priorities. Geographic theories see the key determinant of attitudes as proximity. I set the baseline category as a respondent in an unaffected zone and then include indicator variables for the secondary (Secondary) and primary (Primary) affected zones. If geographic theories hold, then I expect residents who live in the primary zone to be its strongest supporters. I also include an indicator of property ownership (Owner) and its interaction with living in the primary zone (Primary × Owner) to test whether distance impacts attitudes through changes in property values. Owner takes on a value of 1 if the person owns their house or apartment, and 0 otherwise.Footnote 8
A contrasting redistributive perspective emphasizes the importance of class. If redistributive theories hold, then lower-class groups offer more support for the metro than upper-class ones. These effects likely are linear given a progressive tax system, but I allow for nonlinear effects by setting the lower class as an excluded group. I then include an indicator variable for middle- (Middle) and upper-class (Upper) respondents.
An externality theory makes opposite class predictions: upper-class respondents should be more supportive of public transit than lower-class ones. As an additional measure of whether concerns about externalities motivate support, I asked respondents whether they expect the metro to decrease traffic in the city (Traffic) and whether their personal commute will be shorter by taking the metro (Commute). Externality-based theories expect increased support for the metro based on those who perceive broader network effects, even if an individual does not personally use public transit. I control for age and gender given that these factors may condition the use and valuation of public transit.
Figure 4 presents the core results on support for the metro visually. I find little evidence for geographic theories. Even sampling carefully at different distances from metro stations, proximity has no significant relationship with attitudes. The coefficient for respondents in the primary zone is positive, as would be expected, but does not reach statistical significance. Property ownership also has no association with metro support, nor is the interaction with proximity significant.
Support for the metro by geography, property ownership, and class.
Notes: The dots represent the estimated coefficients from an ordinary least squares (OLS) model with robust standard errors. The bars indicate 95 per cent confidence intervals. The dependent variable is the number of votes placed on the metro using QV (mean = 2.45; s.d. = 1.96). Each ordinal independent variable is rescaled from 0 to 1. The excluded categories are residents in the unaffected area (for geographic theories) and the lower class (for redistributive theories). The coefficients represent how a change from the lowest to the highest level of the covariate is associated with a change in the number of votes placed on the metro project.

The survey was done before construction began, so it is possible that respondents were concerned about negative construction externalities or uncertain about the valuation effects of the metro. However, I find no evidence of higher support for the metro in the secondary zone, where residents can access the metro with fewer nuisances and less risk of eminent domain. I also asked respondents directly if they believe that their property value will increase with the metro. Beliefs vary with distance: less than half of property owners in the unaffected zone think the metro will increase their property value, whereas 57 per cent of those in the secondary zone and 67 per cent in the primary zone do. Nonetheless, expectations of property value changes are not related to support for the metro (see Table A.5 in the Online Appendix).
The class results are more consistent with an externality theory than a redistributive one. Upper-class respondents are the most supportive of the metro. Belonging to the upper-class strata relative to the baseline lowest-class strata is associated with an additional half vote on the metro (relative to a sample mean of 2.45 and standard deviation of 1.96). Consistent with an externality interpretation, individuals who expect the metro to reduce traffic place 0.9 additional votes in support of the metro (almost half a standard deviation) compared to those who think traffic will be unaffected. This effect holds even after accounting for whether respondents personally believe they will have a shorter commute by taking the metro. One interpretation of these results is that spatial spillovers are substantial in the case of public transit infrastructure and valued by upper-class groups.
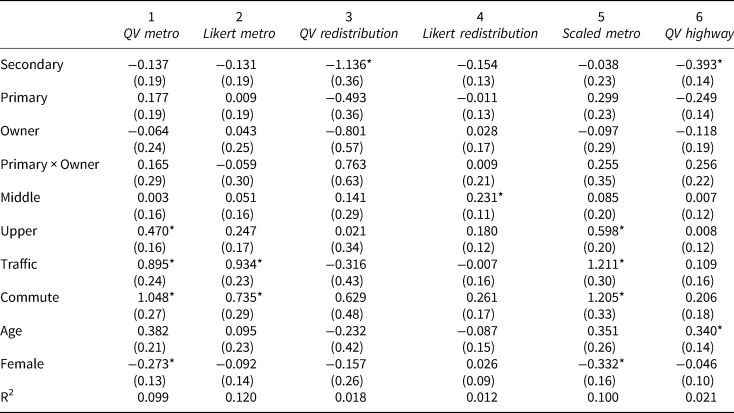
An advantage of QV is that it separates individuals who care most about the metro from those who care less about the issue, increasing the variance to analyze. Model 1 in Table 2 compares the QV results (also plotted in Figure 3) with those measuring support for the metro through a standard Likert item in Model 2. The results are similar, but the class differences in preferences are smaller and insignificant under Likert.
Comparing models of support for the metro

Notes: OLS regressions with robust standard errors in parentheses; * p < 0.05. Model 1 replicates the results shown in Figure 4.
A disadvantage of QV is that the results must be interpreted with respect to the choice set, raising the possibility that the class differences on the metro under QV are induced by preferences on unrelated issues, such as redistribution. To be clear, budgeting survey techniques aim to create such tensions. However, if class differences on redistribution drive views on the metro, they also change the interpretation and suggest contexts in which opinions might reverse. For instance, if the national government manages social programs and the city government makes transportation investments, then redistribution is not pitted against transportation investments and the QV survey would overstate class tensions around the metro.
I examine whether class cleavages over other issues, especially redistributive issues thought to divide the poor and rich, drive the results. Model 3 shows that class does not predict the votes placed on redistributive issues (I combine taxes, transfer increases, and social spending and show the separate results in Table A.6 in the Online Appendix). Model 4 shows that the middle class, not the poor, is more supportive of redistribution using the standard Likert questions (similar to Blofield and Luna Reference Blofield, Luna and Blofield2011; Holland Reference Holland2018).Footnote 9
More broadly, I conduct a sensitivity analysis to see how issues are linked under QV (see the formal derivation in the Online Appendix). I remove items from the choice set by subtracting the number of votes that an individual puts on those items. I then reweight the data by a scaling factor. The dependent variable, then, is the proportion of remaining votes put on the metro for each respondent. Model 5 shows that class differences on the metro persist and even strengthen somewhat once redistributive issues are excluded from the agenda. The reweighting method assumes the irrelevance of independent alternatives, which may not hold if respondents change the votes assigned to an issue depending on the presence of other issues. Yet, given that the poor do not express greater support for redistribution even on costless Likert surveys, it is unlikely that they were constrained by their redistributive choices to voice support for the metro. The strongest class differences emerge around the removal of street vendors and corruption control, but their removal from the choice set only further magnifies class differences on the metro (see Table A.6 in the Online Appendix).
Another possible interpretation of the results is that upper-class groups simply support more capital expenditures in general. Large projects like metros may be associated with modernity and therefore gain support irrespective of their externalities. To test whether the upper class likes physical infrastructure projects in general, I compare support for the metro with support for highways in Model 6. The class differences disappear around highways, suggesting that there is not a more general appreciation for infrastructure. Table A.5 in the Online Appendix also demonstrates that there is limited support for theories that emphasize commuting patterns or trust in government as determinants of metro attitudes.
Experimental Results
To further disentangle the bases of popular support, I now turn to the experimental treatments. I make the costs and benefits of the metro project salient, and look for a pattern of results consistent with each theoretical approach.
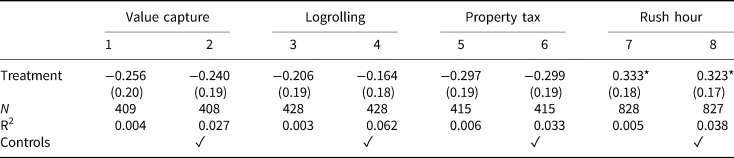
Table 3 shows the average effects for the treatments: value capture, logrolling, property taxes, and rush hour. I estimate the results without and with controls for each treatment. I tested geographic theories by providing information about land value capture and logrolling. Both are expected to increase overall support for public works by increasing the support of the majority distant from major projects. However, the coefficients point in the wrong direction. I find some support for redistributive theories. The property tax treatment reduces support, as expected, and comes closes to statistical significance. I can rule out only effects larger than an additional 0.5 votes, or roughly one-quarter of a standard deviation, with 95 per cent confidence (for power calculations, see the Online Appendix). Since the estimated coefficient is less than this minimum detectable effect, I cannot rule out the existence of a substantively small effect of making property taxes salient.
Effect of experimental treatments on support for the metro

Notes: * p < 0.10; ** p < 0.05; *** p < 0.01. The table shows estimates of the effects of each treatment conditioned on the number of votes placed on the metro using QV. Controls: proximity, class, age, and gender.
Consistent with an externality theory, individuals who took the survey just after rush hour placed an additional third of a vote on the metro compared to those who took the survey in nonpeak hours. The full sample received either the rush hour timing or control, so I can detect effects as small as 0.3 votes.
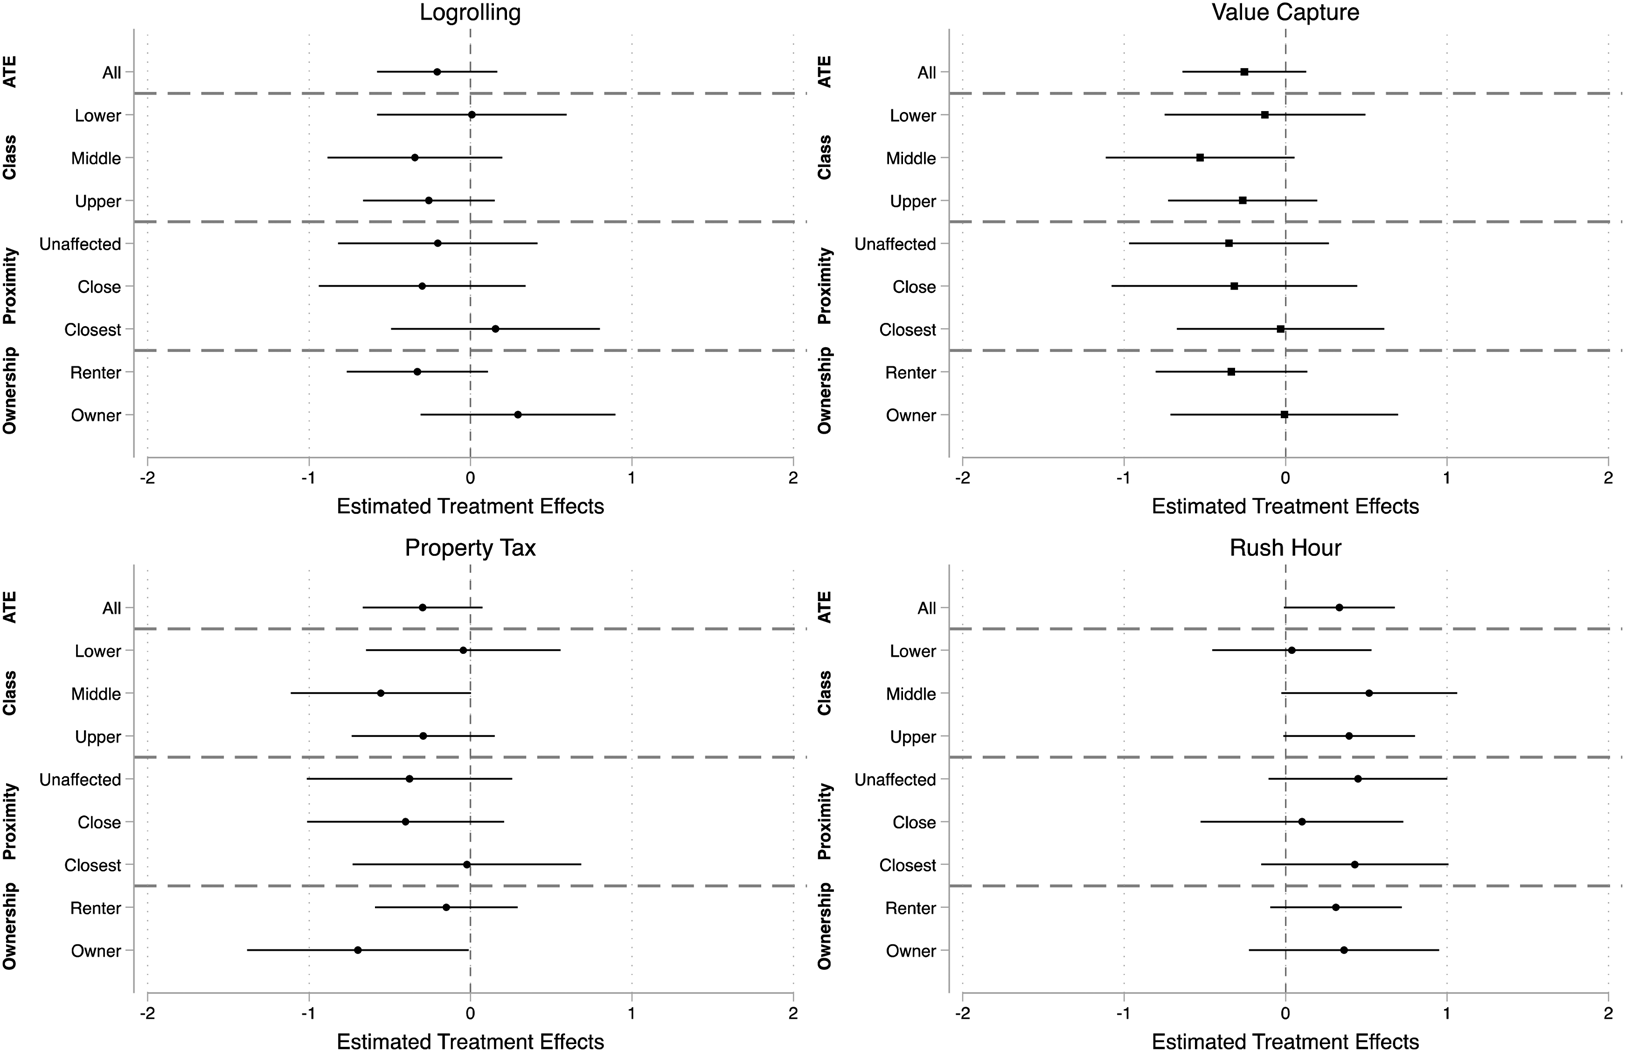
To give a sense of possible heterogeneous effects, Figure 5 presents the results from each treatment arm as a separate panel with demographic controls. The top row in each panel shows the average treatment effect. I then show the conditional average treatment effects (CATEs) by class, proximity, and property ownership. Each theory makes sharper predictions about heterogeneous effects than the average treatment effect. Geographic theories predict that distant respondents should increase their support under value capture and logrolling, while nearby ones should decrease their support. Redistributive theories expect the wealthy and property owners to be most sensitive to changes in the tax burden. Likewise, an externality theory expects the wealthy to be most sensitive to traffic. Unfortunately, I can detect only relatively large effects (1.15 additional votes for the vignette and 0.9 votes for rush hour) once the sample is divided by class or proximity. This magnitude is larger than the difference across class groups, so I mainly examine whether the direction of the effects is consistent with theoretical expectations.
Conditional average treatment effects by class, proximity, and ownership.
Notes: All treatment effects (dots) are calculated as the difference in mean votes placed on the metro between the treatment and control groups. Bars represent 95 per cent confidence intervals. Controls: proximity, class, ownership, age, and gender (excluding the conditioning variable).

Again, there is no evidence in favor of geographic theories. If anything, against the theoretical predictions, logrolling and value capture lead respondents in the unaffected zone and renters to reduce their support for the metro somewhat more than affected respondents and owners. The experimental results are more consistent with redistributive theories. The property tax treatment affects owners more strongly than renters, reducing their support by about two-thirds of a vote compared to owners in the control condition (though not reaching statistical significance in the small subsample). As in the descriptive results, I also find evidence in favor of externality theories. The effect of taking the survey at rush hour is driven by middle- and upper-class respondents, who should be most sensitive to externalities.
The experimental results have several limitations. First, it is possible that the shift in salience, particularly in the vignettes, does little to change attitudes even though the theoretical mechanisms operate in the real world. Secondly, I chose to use QV to evaluate the effects of the survey treatments. Respondents heard a treatment and then allocated points across a range of issues. This design adds realism to survey experiments, in the sense that frames or information may do little to change behavior once mixed in with real-world problems. However, it also makes it harder to change attitudes and produce large enough effects to detect with modest subsamples. A final challenge comes in the traffic experiment: individuals who were home to take a survey prior to rush hour may have differed from those who returned from an evening commute. Balance tests suggest that those who took the survey after rush hour and in non-rush hours are similar on observables (see Table A.4 in the Online Appendix). Nonetheless, I cannot rule out that unobserved differences based on the type of people who answered the survey at different times of the day could explain the externality results. Some of the most obvious ways in which people might differ—such as having jobs with longer hours or more distant locations that lead respondents to take the survey after rush hour—similarly would lead respondents to care more about the metro under an externalities theory.
Given the limitations of the experimental results, I used focus groups to further probe the importance of geographic access and externalities to different class groups. When asked about the primary impact of the metro, low-income respondents overwhelmingly discussed their direct use of the project. Many were concerned about whether the city would integrate the bus and metro fares, so that they could switch between transit types without additional costs. In contrast, middle- and upper-class respondents voiced very different aspirations for the metro. Many spoke about the importance of reducing overall congestion in the city, including reduced traffic, greater safety, and improved air quality. A minority expected to take the metro and mainly discussed its possible use on days in which the city restricted their car use. Qualitative conversations thus reinforce an externalities interpretation, where upper-class groups care about the broad spillover effects from the metro, whereas lower-income groups worry about the project's accessibility.
Conclusion
Public transit is a core part of daily life for many citizens. It can be one of the most frequent ways people interact with government services. Transportation is also an especially pressing issue in the Global South due to rapid urban growth and slow government investments.
Public works are thought to be hard to provide in contexts of spatial and economic inequalities. Those far away pay for public works that serve those nearby, and upper-class groups pay for public works that benefit the poor. Yet, surprisingly, I found little support for these theories—particularly geographic theories—in the context of a major subway project. Those that live close and far from the subway differed little in their views. Upper-class groups were more supportive of the metro than the poor, cutting against theories that stress redistributive cleavages. Making salient the tax burden did dampen support among the wealthy, as expected by redistributive theories, though. The descriptive, experimental, and qualitative results were most consistent with externality theories that stress the spatial spillovers of public works. Public works, such as metros, deliver broad benefits and improvements in quality of life that matter most to those with income to spare.
Although scholars have theorized the political conflicts that arise around public works, few surveys have looked at preferences over their provision. This neglect reflects a more general difficulty in crafting survey questions around valence issues on which individuals have the same direction of preferences but differ in how much they care or prioritize given issues. By applying a new survey method from economics, that is, QV, which makes explicit the trade-off across public policies, this article puts forward a new approach that could be extended to a range of public works studies. Specifically, this article showed how this technique did a much better job separating strong and weak supporters of public works, and could help make sense of a concrete empirical problem. Future research may compare different methods of using a budget to sort out the intensity of support, including simpler linear budgeting questions, and probe how sensitive the results are to the selection of the choice set. Beyond strengths, I also demonstrated trade-offs in the use of QV for survey experiments. Many survey experiments create a direct connection between a treatment and set of evaluation questions, abstracting from any real-world behavior. QV instead asks respondents to evaluate competing priorities after a treatment. This approach creates greater realism but dilutes treatment effects.
I selected a single project for close study: the Bogotá subway. This narrow focus raises the question of how the results extend to other projects and countries. I expect the findings to apply best to cities in low- and middle-income countries where the poor live on the urban periphery and governments face spending trade-offs. In these contexts, upper-class groups are integrated into the city, so that they value positive externalities for urban life like improved air quality, traffic, and renewed investment. At the same time, lower-class groups may doubt whether they can use metro projects and whether metros will crowd out more immediate forms of social expenditures or local public goods. My suspicion is that upper-class groups may place less weight on these diffuse urban benefits in cities where they live in the suburbs. Yet, some evidence from the most-studied American context suggests similar patterns occur even in wealthier contexts in which the poor live in the urban core. Nall (Reference Nall2018, 91), for instance, comments on a “surprising” result that higher-income respondents are more supportive of urban transportation infrastructure in the United States. Wealthy respondents voted in favor of public transit ballot initiatives more than lower-class ones in California (Manville and Cummins Reference Manville and Cummins2015). The approach used here could be replicated to understand popular pressures in other cities that vary in their spatial structure.
Finally, this article has intriguing implications for how a growing middle class may shape urban politics in the Global South. Pollution, traffic, and public health hazards cannot be easily controlled through private action. The results of this study suggest that there is the potential for a cross-class coalition behind public goods provision in pursuit of common interests in improving the quality of life in burgeoning cities. Furthermore, this study has emphasized the rather old point that spillovers in dense environments, whether from crime, traffic, or disease, can create self-interested reasons to support public goods provision.
While focused on public preferences, this article also has implications for how politicians can build broad support for urban public works. Politicians often need to convince the public of the broad benefits from government projects, rather than responding to preformed ideas about what projects are necessary and beneficial. This point may be particularly important for public transit, where there is substantial disagreement among experts on the extent to which projects (and metros in particular) reduce traffic and pollution (see, for example, Gendron-Carrier et al. Reference Gendron-Carrier2018). The political challenge, then, is to convince the upper class who foot more of the bill of the positive externalities that come from government action—or, to use Tocqueville's (1835) phrase, politicians must convey one's “self-interest rightly understood.”
Supplementary Material
Online appendices are available at: https://doi.org/10.1017/S0007123422000679
Data Availability Statement
Replication data for this article can be found in the BjPolS Dataverse, available at: https://doi.org/10.7910/DVN/TDB0C5
Acknowledgments
I thank Cristina Bodea and four reviewers for helpful suggestions to improve this manuscript. Cameron Ballard Rosa, Allison Carnegie, Charlotte Cavaillé, Sarah Daly, Rafaela Dancygier, Sean Ingham, Lindsay Mayka, Gwyneth McClendon, Hillel Soifer, Glen Weyl, Enrique Silva, and Silvia Schor provided feedback on previous drafts and research designs. I acknowledge the helpful feedback of workshop participants at Harvard University, Yale University, Princeton University, Lincoln Institute of Land Policy, and REPAL. Doug von Kohorn, Natalia Duarte, and Óskar Fletscher helped with the survey and focus group implementation. Christine Li, Samuel Maeglin, and Madai Urteaga provided valuable research assistance.
Financial Support
This work was supported by the Lincoln Institute for Land Policy (Grant Number LAH1023415), the Bobst Center for Peace and Justice at Princeton University, and the William F. Milton Fund at Harvard University.
Competing Interests
Holland has a family member who is a beneficiary of a trust managing a patent on quadratic voting. The trust does not enforce the patent for non-commercial and public interest applications, and has made available several open-source, free software to implement quadratic voting. The trust made no profit and had no input into the research design, implementation, or data analysis for this project.
Ethical Standards
The research was conducted in accordance with the protocols approved by Harvard University's IRB (#15-3150). All survey participants provided verbal consent and were compensated for their participation.