


Introduction
Traditionally, innovation has been a relatively marginal theme in Italian economic history. Over the last decade, however, a stream of contributions drawing on historical patent data (Nuvolari and Vasta Reference Nuvolari and Vasta2015a, Reference Nuvolari and Vasta2017) has been able to shed new light on some crucial features of the Italian innovation system from the national unification of 1861 to the first spurt of industrialization of the early twentieth century. In particular, it has been shown that patent activities were dominated by foreign inventors, highlighting in this way both the openness of the Italian patent system and the dependence of the country from foreign technology flows.Footnote 1 Additionally, these contributions maintained that domestic independent inventors featured prominently in patenting activity, even after the onset of the Second Industrial Revolution and that there was a remarkable North-South divide in patenting activity with a strong concentration in the provinces of the so-called “Industrial triangle” (Genova, Torino, and Milano).
This article aims to expand on this line of research by providing a comprehensive study of the social, institutional, and spatial patterns of Italian inventive activities during the first 80 years of Italian history, covering both the Liberal Age (1861–1914) and the Fascist period (1922–1943, up to 1939 in our database). To this end, we have constructed a new, large-scale dataset, HIP (Historical Italian Patents) containing all 270,000 patents registered in Italy between 1861 and 1938. This represents a substantial advance with respect to the previous work by Nuvolari and Vasta (Reference Nuvolari and Vasta2015a, Reference Nuvolari and Vasta2017), whose patent dataset comprised only six benchmark years, corresponding to 10,124 patents. Drawing on our new database, we seek to establish a set of stylized facts about the sources of inventive activities, analyzed from geographical, social, and institutional perspectives.Footnote 2
Our main objective is to introduce a new empirical characterization of the Italian innovation system (Freeman Reference Freeman1987; Lundvall Reference Lundvall1992; Nelson Reference Nelson1993) using the new HIP database as primary evidence.Footnote 3 Specifically, we assess how the large share of foreign patenting in the Italian system has affected the accumulation of domestic technological capabilities in a latecomer country during the Second Industrial Revolution (von Tunzelmann Reference Von Tunzelmann1995). Additionally, we examine whether, and in what ways, the institutional discontinuity brought about by the rise of Fascism in the early 1920s and the subsequent adoption of autarkic policies in the mid-1930s changed the trajectory of Italian inventive activities. Finally, our article also explores the spatial characteristics of Italian innovative activity, linking them to the literature on regional disparities (Federico et al. Reference Federico, Nuvolari and Vasta2019; Felice Reference Felice2013). Admittedly, our data cannot pretend to capture the whole complexity of the national innovation system which encompasses also other dimensions such as the education system, governance structures, and financial institutions that are not directly reflected in patent records. However, we believe that our variables still can offer a new, although raw, characterization of the Italian innovation system that can open the avenue for further research and international comparisons.
Large-scale historical patent databases like the one presented in this article are being constructed for an increasing number of countries. For the United States, Petralia et al. (Reference Petralia, Balland and Rigby2016), Kogan et al. (Reference Kogan, Papanikolaou, Seru and Stoffman2017), Berkes (Reference Berkes2018), and Sarada et al. (Reference Sarada, Andrews and Ziebarth2019) have compiled large-scale databases from the US patent records (for a systematic overview, see Andrews Reference Andrews2021). This stream of research has successfully exploited this micro-data to shed new light on the demographics of inventors and on the drivers of innovation (Akcigit et al. Reference Akcigit, Grigsby and Nicholas2017, Reference Akcigit, Grigsby and Nicholas2022; Akcigit and Nicholas Reference Akcigit and Nicholas2019). In Europe, large-scale historical patent databases have also been developed, despite the challenges posed by reporting and classification systems that changed frequently over time. The most prominent cases are Germany (Donges and Selgert Reference Donges and Selgert2019a, Reference Donges and Selgert2019b, Reference Donges and Selgert2021; Streb et al. Reference Streb, Baten and Yin2006); France (Galvez-Behar Reference Galvez-Behar2008, Reference Galvez-Behar2019; Nuvolari et al. Reference Nuvolari, Tortorici and Vasta2023), United Kingdom (Bottomley Reference Bottomley2014; Berkes et al. Reference Berkes, Lee Chen and Tranchero2026; Nuvolari et al. Reference Nuvolari, Tartari and Tranchero2021), Sweden (Andersson and La Mela Reference Andersson and La Mela2020; Andersson and Tell Reference Andersson and Tell2019), and Spain (Sáiz Reference Sáiz2004, Reference Sáiz2014).Footnote 4 In this perspective, our contribution does not deal only with Italian industrialization but relates also to this emerging stream of literature.
The article is structured as follows. We first introduce the reader to the Italian Patent Law of the time. We then present the historical sources and explain the construction of the HIP database. Next, we highlight the new stylized facts about Italian invention in Italy, focusing first on the quantitative and qualitative differences between inventions registered by domestic and foreign inventors, and then studying the geographical patterns of inventive activities. Finally, we discuss the implications of our findings.
The Italian patent system, 1855–1938
The patent law n. 1657 of January 31, 1864 (Gazzetta Ufficiale 1864, n.24) extended the applicability of the formerly Piedmontese patent law across the whole of Italy.Footnote 5 This law, originally introduced in 1855, provided inventors with a relatively cheap and flexible patent system. The law established the Ufficio della proprietà intellettuale, a central office where creative works could be deposited and registered. In practice, however, inventors could apply for patents directly at the local offices of the Prefettura.Footnote 6
The Italian patent system was based on registration rather than on formal examination.Footnote 7 This means that there was no screening process besides an administrative check by the Prefettura. Furthermore, unlike other countries such as the United States of America before 1883 (Akcigit et al. Reference Akcigit, Grigsby and Nicholas2022) and the German state of Wuerttemberg (Lehmann-Hasemeyer and Streb Reference Lehmann-Hasemeyer and Streb2020), the law did not discriminate between foreign and domestic inventors. Furthermore, Italian patents did not distinguish between assignees (those to whom the patent was assigned to) and patentees (the inventor). Another peculiarity of the Italian patent system is that patents could be registered also directly by firms, making it possible to directly ascertain whether a patent was ascribed to an individual or to a firm (Nuvolari and Vasta Reference Nuvolari and Vasta2015a). Unlike other countries such as France, England, or Sweden, the Italian patent records did not contain systematic information about the occupations of the patentees.Footnote 8 Finally, the Italian patent system did not contemplate a description of prior art via patent citations.
The patent law also set out fees for each type of patent: ordinari, prolungamenti, and completivi. For “ordinary” patents (brevetti ordinari), inventors could freely select the duration of the patent, anywhere from one to fifteen years. The total cost increased with the length of the patent. An initial fee was charged based on the number of years of protection requested: 10 Italian lira (around 40–50 euros at 2025 prices) for one year, 20 lira for two years, and so on, up to 150 lira for a full 15-year patent (around 600–700 euros at 2025 prices).Footnote 9 This initial fee was fixed, but patentees also had to pay an annual renewal fee to keep the patent alive, and this fee increased over time: 40 lira for the first three years, 65 lira from the fourth to the sixth year, 90 lira for the seventh up to the ninth year, 115 lira for the tenth to the twelfth year, and 140 lira for the final three years. For example, a patent registered for only one year cost a total of 50 lira (around 400–500 euros at 2025 prices), while a ten-year patent cost 800 Lira (100 lira in initial fees plus 700 lira in correspondingly escalating renewal fees). In comparison to other countries, these relatively low fees enabled independent inventors with limited financial resources to access the patent system. Prolungamento patents were extensions requested by inventors wishing to prolong the validity of an existing patent, still within the maximum duration of fifteen years. This type of patent required an additional fee of 40 lira, on top of the standard fees required for the corresponding duration. The duration of the patents could also be reduced through a “patent of reduction” (brevetto di riduzione), but this option was rarely used. Completivo patents, which included technical improvements to existing patents, were priced at 20 lira. As completivo patents only supplemented information for already registered patents, they did not have their own duration. When an invention was already patented abroad and then it was imported into Italy, the typology was “import” (importazione).Footnote 10
In accordance with the Fascist rhetoric emphasizing the modernization of the country, one could have expected that the regime would have introduced profound revisions in the Italian patent system.Footnote 11 In contrast, despite various discussions of patent reform, the Italian patent law remained substantially unchanged throughout the whole period 1864–1939), with the only exception of the new rule of 1923 (R.D. 23 July 1923 no. 1970). According to this rule, patentees could no longer decide the patent duration, which was always fixed to fifteen years, with the requirement of a fixed annual renewal fee to keep the patent in force. Figure B1 in Supplementary materials builds on Nuvolari and Vasta (Reference Nuvolari and Vasta2015a: 863) and shows the evolution of patent costs in a comparative context in three benchmark years (1875, 1900, and 1925). During the Fascist period, despite several proposals of reforms concerning the introduction of a formal examination procedure following the model of the German law, nothing substantial was achieved (Gabbuti, Nuvolari, and Sganga Reference Giacomo, Nuvolari, Sganga and Morris2024). Furthermore, the jurisprudence continued to reflect a system designed for independent inventors, rather than those working in corporate laboratories or similar settings, and patent examination never materialized.
In summary, the Italian patent system was flexible and relatively cheap by international standards, making it, at least potentially, a “democratic” one (Khan Reference Khan2005). In fact, Nuvolari and Vasta (Reference Nuvolari and Vasta2015a: 863) show that even when the annual fees are measured in terms of the average weekly wages of workers in the engineering sectors, the cost of maintaining a patent in Italy was much lower than in Germany and the UK. It was thus “democratic” for domestic inventors because no major financial resources were required to submit and renew the patent, and it was “democratic” for international inventors because they were not discriminated against.
Figure 1 provides a comparative snapshot on the degree of openness, measured as the share of foreign patents registered in different patent systems. In comparison with countries of similar population size, such as France, Germany, and the United Kingdom, the Italian patent system is characterized by a considerably high degree of openness, with foreign patents ranging between 40 and 75 percent. In this respect, Italy displays a degree of openness similar to that of small open economies such as the Netherlands, Belgium, and Sweden. In Figure 1, Russia, which was a backward country with a very limited industrial base, has a higher degree of openness.
Degree of openness of patent systems to foreign invention, 1883–1938.
Source: WIPO (2011) and our elaborations for Italy.

Figure 1. Long description
A line graph showing the degree of openness of patent systems to foreign invention from 1883 to 1938. The horizontal axis represents the year, ranging from 1883 to 1940. The vertical axis represents the percentage, ranging from 0 to 90 percent. The graph includes data lines for Belgium, Germany, Netherlands, Switzerland, United States of America, France, Italy, Sweden, and United Kingdom. Each line represents a different country and shows the trend of openness over time. Belgium’s line is orange, Germany’s is yellow, Netherlands’ is teal, Switzerland’s is gray, United States of America’s is dark blue, France’s is magenta, Italy’s is red, Sweden’s is light blue, and United Kingdom’s is dark blue with dots. The trends show varying degrees of openness, with some countries experiencing fluctuations and others maintaining more stable trends over the years.Source: Our elaborations on
Figure B2 in Supplementary materials adds to Figure 1 by showing the share of foreign inventors in the United States. In comparison with countries such as France, Germany, and the United Kingdom, the share of Italian inventors who filed patents in the United States is among the lowest. It is interesting to note that although Italy had a much larger population than countries such as Sweden, Belgium, and the Netherlands, its share of foreign patents in the United States was on par with that of these countries.Footnote 12 Overall, this points to a structural weakness of the Italian innovation system in this period (for more on this, see Stylized Fact # 11).
The new Italian historical patent database
The sources of this study are the official serial publications of the Ministero di Agricoltura, Industria, e Commercio MAIC (1862, 1860–1863, 1864–1885, 1886–1893, 1894-1901, 1902–1938). We collected and digitized the 55 volumes of patent indices from online archives and from various libraries.Footnote 13 The information has been integrated with the patent database previously constructed for benchmark years by Nuvolari and Vasta (Reference Nuvolari and Vasta2015a).Footnote 14 The new dataset provides a full coverage of the period 1861–1938 and contains a total of 276,839 patents, of which 107,658 are filed by Italian residents, 169,987 are filed by foreign residents, and 194 jointly by Italian and foreign residents. In this article, we focus on “ordinary” patents, thus excluding extensions (prolungamenti) and additions (completivi). These categories refer to already patented inventions, and their inclusion would result in double counting.Footnote 15 Table A2 in Supplementary materials provides four examples of different kinds of patents, while Figure A1 illustrates the construction of the records of our dataset.
As the geographical data are fine-grained enough to distinguish patentee residence at the level of municipalities (comuni), we coded the residence at this level.Footnote 16 When a patent is registered by inventors in different municipalities, we take this into account using a fractional count.Footnote 17
In addition to geographical information, each patent record contains the following details: the name of the patentee(s), which is especially useful for distinguishing between firm patentees and independent inventors; the date of application (data di deposito); the date of grant (data di rilascio); the official patent registration number; the province of residence of the Italian patentee(s) at 1911 borders (69 provinces); the country of residence of the patentee(s) at 1911 borders, which allows a separation of Italian and foreign patents;Footnote 18 the initial patent duration; the number and duration of the extensions (prolungamento) of the patent; the patent typology (ordinario, rivendicazione, prolungamento, importazione, riduzione, and completivo); and a short description of the invention. Each patent is also classified into one of 25 technological categories (i.e., textiles, chemicals, etc.) by the Ufficio della Proprietà Intellettuale (see Table A1 in Supplementary materials); additional information covers specific aspects of the patent’s lifecycle, such as changes in the inventor’s city of residence of prolungamento or completivo patents, and modifications to the patent title in completivo patents.
The technological categories allow us to distinguish between “high-tech” and “low-tech” patents. We use the classification introduced by Nuvolari and Vasta (Reference Nuvolari and Vasta2015a: 872) in which high-tech patents are those related to the technological classes that were crucial to the First and Second Industrial Revolutions: steam engines, weapons, machine tools and machinery, chemicals, and electricity (see Table A1 in the Supplementary materials for more details on the classification). This classification fits well for a relatively latecomer country such as Italy, where the First Industrial Revolution arrived with some delay (Fenoaltea Reference Fenoaltea2011: 233–5; Toniolo Reference Toniolo and Toniolo2013: 9–18).
As many patentees filed more than one patent, in order to also conduct analyses at the level of inventor and not just at the level of each patent, we devoted extra care to ensure that the names of each inventor were correctly spelled and then linked the same inventor across the database according to their name (see Supplementary materials for further details).
Stylized facts on Italian invention, 1861–1938
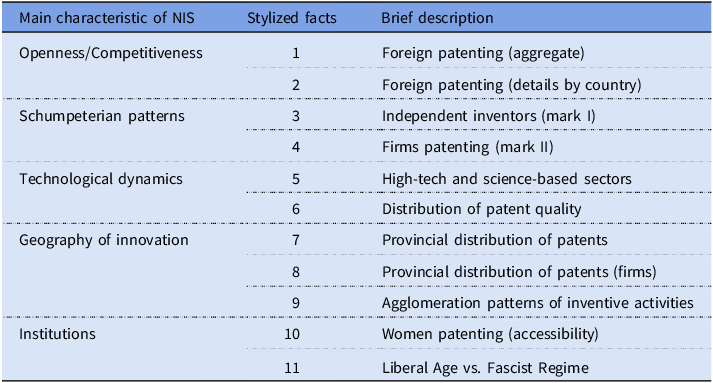
In this section, we outline eleven stylized facts on Italian inventive activities distilled from the HIP database and covering two major historical phases: the Liberal Age (from the unification up to the outbreak of World War I) and the Fascist period (from 1922 onward). Table 1 summarizes the main dimensions of the Italian innovation system investigated by using the HIP database. These dimensions cover some key characteristics of the system such as openness and competitiveness, technological patterns and their evolution along time, geography of innovation, and institutional setup (understood as the transition to the Liberal Age to the Fascist regime).
Main characteristics of the Italian Innovation System studied with the HIP dataset

Table 1. Long description
A table summarizing characteristics of the Italian innovation system using the HIP dataset. The table has four columns: Main characteristic of NIS, Stylized facts, Brief description. The table has eleven rows. Row 1: Openness/Competitiveness, 1, Foreign patenting (aggregate). Row 2: Openness/Competitiveness, 2, Foreign patenting (details by country). Row 3: Schumpeterian patterns, 3, Independent inventors (mark I). Row 4: Schumpeterian patterns, 4, Firms patenting (mark II). Row 5: Technological dynamics, 5, High tech and science-based sectors. Row 6: Technological dynamics, 6, Distribution of patent quality. Row 7: Geography of innovation, 7, Provincial distribution of patents. Row 8: Geography of innovation, 8, Provincial distribution of patents (firms). Row 9: Geography of innovation, 9, Agglomeration patterns of inventive activities. Row 10: Institutions, 10, Women patenting (accessibility). Row 11: Institutions, 11, Liberal Age vs. Fascist Regime.
Openness and competitiveness
Stylized Fact # 1. Patents registered in Liberal Age Italy were mostly foreign, with foreign patents accounting for between 45 percent and 75 percent of total patenting activity each year. On average, 60.1 percent of patents were foreign.
The total number of patents registered in Italy increased dramatically since political unification (see Figure 2), growing from a yearly average of 281 patents in the 1860s to 6,098 in the five years preceding World War I, with a peak of 23,295 in 1924, likely related to the administrative backlog determined by the change in law (R.D. 23 July 1923 no. 1970) regulating the duration of patents, and to 9,961 in the last five years of the period ended in 1938. The number of foreign inventions outnumbered the domestic ones, with the only exception of the period 1866–1872 (see Figure B3 in Supplementary materials). This exception was led by a short-lived increase in the number of domestic patents and was accompanied by a stagnation of foreign patents, possibly driven by the Franco-Prussian War (1870–1871). Figure B3 in Supplementary materials shows a drop in terms of patenting activity in the period 1914–18 both for domestic and foreign inventors. This is clearly associated with World War I and is more marked for foreign inventors than for Italian ones (see Figure 2).
Patents registered in Italy, 1861–1938.
Source: Our own elaborations on HIP.

Stylized Fact # 2. France is the country with the most patents in Italy until the 1880s (followed by Great Britain and Germany). After that, Germany becomes the main country patenting in Italy, with the exception of the interlude of World War I.
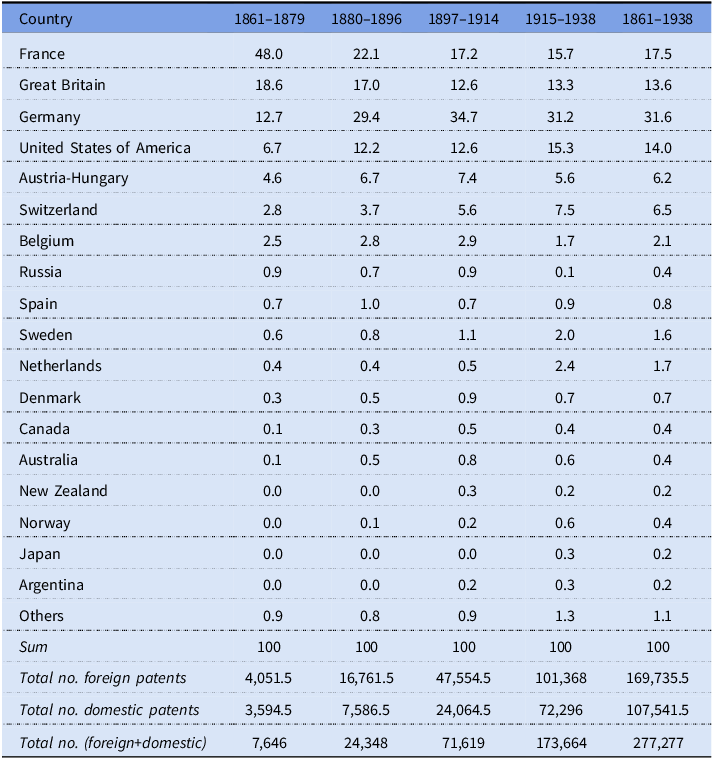
Figure 3 shows the distribution of patents by country of residence of patentees. It is interesting to note that, over a period of eighty years, only two countries consistently held the leading position in patenting activity in Italy: France and Germany, with a brief interruption during World War I. Figure 3 also shows that up to 1880 the largest share of foreign patents was French (48 percent during the period 1861–1879; see Table 1). German patents begin to increase in the 1880s, quickly displacing the French ones. From 1897 to 1914, German patents represented 34.7 percent of all foreign patents, while the French share was just half of them (17.2 percent).
Share of foreign patents registered in Italy by country of residence of the patentee, 1861–1938.

Germany’s overtaking of France in terms of foreign patents in the 1880s is closely linked with the emergence of Germany as the technological leader of the Second Industrial Revolution. German patents in Italy were mostly concentrated in the technologies of the Second Industrial Revolution, such as chemicals and electrical engineering, whereas French patents in Italy tended to focus on older, First Industrial Revolution technologies (Martinez Reference Martinez2025a: 398). Despite the significant technological gap between Germany and Italy at the time, the openness of the Italian patent system may explain the influx of substantial patenting activity from Germany. Anecdotal evidence suggests that market conditions in Germany, with entry barriers in high-tech sectors, prompted some German inventors to take patents in Italy where they could develop their inventions in a less competitive environment.
A particularly illustrative case is provided by Trainer (Reference Trainer2006), who studies the company of the Einstein family and their patenting activity. Jakob Einstein and his brother Hermann (uncle and father of Albert Einstein, the 1922 Nobel laureate in physics) formed a partnership in Munich to produce electrical equipment. Jakob filed a few patents in Germany and Switzerland during the 1890s. Their company, however, failed – most likely due to high entry barriers and the advanced state of German electrification, which made competition difficult for new entrants. In 1894, the Einstein brothers moved their business and their families to Italy (Milano and later Pavia), where competition in high-tech sectors was less forbidding. In Italy, Jakob patented two electrical inventions (patent no. 39,098 in 1895 and patent no. 42,143 in 1896) and their business prospered. Albert Einstein himself was keenly aware of the importance of protecting inventions internationally. For example, he registered a patent (no. 284413 of 1931) for refrigerators in Italy.
The growth of German patenting in Italy coincides with a similar but more limited rise of US patenting. Indeed, the US had the primacy of patenting activity in Italy during World War I (1915–1918). Finally, the British share seems relatively stable throughout the entire period. Patents registered by countries assigned to the “Others” category in Figure 3 increased especially after the 1880s, mostly driven by Switzerland, Austria, Sweden, and Australia (see Table 2).
Schumpeterian patterns
Stylized Fact # 3. The share of independent inventor patents is characterized by a decreasing trend throughout the period, in line with similar dynamics of other countries. For domestic patents, the share of independent inventors’ patents is roughly stable between 85 percent and 90 percent until the 1920s and then declines.
Figure 4 shows the share of independent patents across different patent systems. All series are characterized by a decreasing and roughly concomitant trend starting at least since the 1870s. This is consistent with the notion of “industrialization of invention” introduced by Bernal (Reference Bernal1953: 151) to describe the organizational shift from independent invention to corporate laboratories taking place during the Second Industrial Revolution. During the period of World War I, the decreasing trend of the share of Italian independent inventors (Figure 4) shows an upward rebound. This can be accounted for by the decline of foreign patenting taking place during World War I and gradually continuing in the Fascist period (see Figure 2). Considering only domestic patents, one finds a similar pattern (Figure B5 in Supplementary materials): in particular, for Italy, we find a long-run stability with a share ranging between 85 percent and 90 percent up to the mid-1920s is visible, while starting to decline again in the 1930s. This points to a possible gap in the organization of inventive activities between Italy and the leaders of the Second Industrial Revolution such as Britain and the US (Nuvolari and Vasta Reference Nuvolari and Vasta2015a).
Share of patents registered by all independent inventors, 1861–1938.
Sources: This study for Italy; Nicholas (Reference Nicholas2011: 1003) for Britain, Japan, and the United States; Sàiz (Reference Sáiz2014) for Spain, and Andersson and Tell (Reference Andersson and Tell2018) for Sweden.

Figure 4. Long description
A line graph showing the share of patents registered by all independent inventors from 1861 to 1938. The horizontal axis represents the year, ranging from 1860 to 1940. The vertical axis represents the percentage of patents, ranging from 50 percent to 100 percent. The graph includes data lines for Britain, Italy, Japan, United States, Sweden, and Spain. Each line is color-coded and labeled accordingly. The trends show a general decline in the share of patents over time for all countries. Britain and the United States show a steady decline. Italy shows fluctuations with a notable drop around the early 1920s and mid-1930s. Japan, Sweden, and Spain also exhibit declines, with Japan showing a sharp drop around the early 1900s.
Stylized Fact # 4. The share of firm patents increases slowly up to the 1890s. Then, the share of foreign patents registered by firms in Italy rises dramatically, while the domestic one remains stable up to the early 1920s.
The onset of the Second Industrial Revolution coincided with an increase in the number of firms filing patents (Figure 5a). Up to the 1890s, France is the leading country in terms of firm patents in Italy (Figure 5b and Table B1 in Supplementary materials). Between the 1890s and 1914, there is a clear dominance of German firms, which is interrupted by World War I. In the post-World War I period, Germany is able to recover its leading role even if there is a considerable increase of US firm patents.
Patents registered by firms in Italy, 1861–1938.
Source: Our own elaborations on HIP.

Technological dynamics
Stylized Fact # 5. The share of high-tech patents increases over time for both domestic and foreign inventors. Looking at science-based sectors, the gap between domestic and foreign inventions grows considerably from the 1920s.
Figure 6 displays the share of “high-tech” patents filed by foreign and domestic inventors. Clearly, the share of foreign patenting activity seems more oriented towards high-tech sectors than the domestic one. Figure 6 also shows the share of patents in the two main science-based sectors of the Second Industrial Revolution: electricity and chemicals. The patterns are similar to the ones of all high-tech patents. At the end of the period, the share of science-based patents among foreign inventors is about 30 percent, while the domestic one is below 15 percent. Remarkably, since the from the early 1920s up to the end of the period, the domestic science-based patents account for less than one-fifth of the total, while in the period 1900–1920 it was almost one-third.
Share of high-tech patents in Italy, 1861–1938.
Source: Our own elaborations on HIP.
Note: Following Nuvolari and Vasta (Reference Nuvolari and Vasta2015a), high-tech patents belong to the following sectors: chemicals (industrie chimiche diverse ed apparecchi relativi and Industrie chimiche), electrical (elettrotecnica, illuminazione e industrie relative, riscaldamento ventilazione e apparecchi di raffreddamento), machineries (generatori di vapore motori macchine diverse ed organi delle macchine), and weapons (armi e materiale da guerra da caccia e da pesca).

Figure 6. Long description
A line graph showing the share of high-tech patents in Italy from 1861 to 1938. The horizontal axis represents the year, ranging from 1860 to 1940. The vertical axis represents the share of patents in percent, ranging from 0 to 70 percent. The graph includes four data lines: All High-tech Domestic, All High-tech Foreign, Science-based Domestic, and Science-based Foreign. The All High-tech Domestic line shows fluctuations with a general downward trend until the early 1900s, followed by a slight increase. The All High-tech Foreign line also shows fluctuations but maintains a higher share compared to the domestic line. The Science-based Domestic and Science-based Foreign lines show relatively stable trends with lower shares compared to the high-tech lines.
Altogether, the evidence summarized in the stylized facts #4–6 suggests that the Italian innovation system suffered from structural weaknesses that did not allow it to catch up with the technological frontier, both in terms of the organization of invention and the type of technologies developed.
Stylized Fact # 6. The average quality of inventions registered in Italy by foreign inventors was higher than the quality of domestic inventions, whereas the average quality of inventions registered by firms was higher than that of independent inventors.
Patent quality is usually measured through patents’ renewals and patents’ citations (see Streb Reference Streb2023 for a review).Footnote 19 In the Italian case, citations are not available since the patent law did not require a systematic description of prior art. Accordingly, one could consider renewals, although this requires both to make some specific assumptions on the overall distribution of inventions’ quality and detailed data on the lifetime of each individual patent (Magazzini et al. Reference Magazzini, Nuvolari, Vasta, Lenel, Nutzenadel, Streb and Kohler2025). Considering patents with one or more completivo (addition) patents as high quality would also be an informative indicator of patent quality, but this would require precise linking of each patent with its additions.Footnote 20
In this context, a shortcut approach to the measurement of patent quality is to consider the scheduled duration of a patent, which is the number of years for which a patent has been initially registered.Footnote 21 The intuition is very simple: patents with longer duration are more costly for the patentee, and so they should be of higher quality than patents with shorter duration.Footnote 22 We can use the duration as a measure of quality only up to 1922, when, as previously said, the duration was fixed to fifteen years for all patents.
Figure 7 compares the quality of independent and firm patents, and it points to a sort of stable ranking with foreign firm patents with the highest quality (average duration of 7.3 years), then foreign independent patents (6.3 years), followed by domestic firm patents (4.6 years), and finally domestic independent patents (3.6 years). This pattern is fully consistent with the interpretation of Nuvolari and Vasta (Reference Nuvolari and Vasta2015a) of the limited contribution to technological change in this period of Italian independent inventors, which were operating in a country with limited investments in human capital and in research & development (R&D), and rudimentary markets for technology, as testified by the presence of very few patent agents (Guagnini Reference Guagnini2002; Nuvolari and Vasta Reference Nuvolari and Vasta2015a).Footnote 23 Figure B6 in Supplementary materials shows the evolution of the share of domestic patents on total high-quality patents (duration ≥ 10 years). Initially, the level is relatively high (40–50 percent), also because foreign patents were relatively few. However, since the 1880s, there is a steady decline, so that the share for the following period is around 10 percent. There is a resurgence associated with World War I and the early 1920s, again associated with the years of limited presence of foreign inventors, in particular the Germans.
Quality (average duration) of patents registered in Italy, 1861–1923.
Source: Our own elaborations on HIP.

Figure 7. Long description
A line graph titled ‘Quality (average duration) of patents registered in Italy, 1861–1923.’ The horizontal axis represents the year, ranging from 1860 to 1925. The vertical axis represents the average duration of patents in years, ranging from 1 to 15. The graph includes four data lines: Domestic Firms (solid red), Domestic Independent (dashed red), Foreign Firms (solid blue), and Foreign Independent (dashed blue). Domestic Firms show a fluctuating trend with peaks around 1865 and 1870, followed by a general decline. Domestic Independent follows a similar pattern but with lower values. Foreign Firms exhibit higher average durations with notable peaks around 1870 and 1890, followed by a gradual decline. Foreign Independent shows a similar trend to Foreign Firms but with slightly lower values. Overall, Foreign Firms and Foreign Independent consistently have higher average durations compared to Domestic Firms and Domestic Independent.
One can consider the behavior of the gap in duration between foreign and Italian patents represented in these figures as a rough measure of the technology gap of the Italian economy vis-à-vis the technological frontier. However, we should adopt some caution since foreign patents in Italy are probably positively selected, as it is unlikely that a foreign inventor would patent in another country an invention with limited prospects of success.
Geography of innovation
Stylized Fact # 7: There is a North-Center vs. South divide in patenting activity. Furthermore, there is an expected cluster of patenting activity in the Industrial Triangle (Torino, Milano, Genova), but we see other smaller inventive clusters in Roma (the capital), Napoli, Tuscany (Livorno and Firenze), and Bologna.
The share of patent registrations has been consistently dominated by the Northern regions, which account for more than 60 percent of total filings throughout the period (Figure 8a). The Centre and the South have always followed at a considerable distance. Interestingly, when focusing on high-tech patents, the pattern remains remarkably similar (Figure 8b): the North’s predominance does not increase further, and the existing territorial hierarchy appears unchanged. As shown in Figure B7 in Supplementary materials, the gap in patenting per capita between the North and the South has deep historical roots and has remained wide over time with the share of the South further deteriorating since World War I. After the Unification, the disparity was already striking: the North registered about 9.5 patents per million inhabitants, compared to 1.9 in the Centre and a negligible 0.1 in the South. At the end of the period (1934–1938), the North registered about 199 patents per million inhabitants, compared to 99 in the Centre and a still very low level of 14 in the South.
Share of patents by macro-area (Italy = 100), 1861–1938.
Source: Our own elaborations on HIP.

When we zoom further into the geographical distribution of inventive activities in Italy and we consider patents per capita at provincial level, we find a pattern of increasing dispersion of patenting activity over time (Figure 9a–d), even if patenting activity remains predominantly concentrated in the provinces of the Industrial Triangle (Milano, Torino, and Genova). Broadly, similar patterns hold for high-quality and high-tech patents (Figures B8 and B9 in Supplementary materials).
Number of patents per million inhabitants.
Source: Our own elaborations on HIP.
Notes: *The provincial population for this figure and for the following ones is interpolated between the corresponding census years. **The count of patents is fractional: if a patent was filed by two inventors resident in different provinces, each province gets a patent count of 0.5; if a patent was filed by three inventors resident in different provinces, each province gets a patent count of 0.33.

Figure 9. Long description
Panel (a): 1861–1879. This map shows the distribution of patents per million inhabitants in Italy from 1861 to 1879. The color scale ranges from light green (0.0 to 0.1 patents per million inhabitants) to dark blue (100 to 400 patents per million inhabitants). Most regions are in the light green to medium green range, indicating lower patent activity. Panel (b): 1880–1896. This map shows the distribution of patents per million inhabitants in Italy from 1880 to 1896. The color scale is the same as in Panel (a). There is a slight increase in patent activity, with more regions showing in the medium green to light blue range. Panel (c): 1897–1914. This map shows the distribution of patents per million inhabitants in Italy from 1897 to 1914. The color scale is the same as in previous panels. There is a noticeable increase in patent activity, with more regions in the light blue to dark blue range. Panel (d): 1915–1938. This map shows the distribution of patents per million inhabitants in Italy from 1915 to 1938. The color scale is the same as in previous panels. There is a significant increase in patent activity, with many regions in the dark blue to black range, indicating high patent activity.
At close inspection, the geographical distribution of patents reveals an articulated pattern of invention that goes beyond the usual North-South gradient of Italy’s dualistic development (Figure 9 and Figures B8 and B9 in Supplementary materials). We define an inventive “cluster” as a province which, through all the four periods, consistently features among the top ten provinces in terms of: (i) total per capita patents; (ii) high-quality patents (duration of ten or more years), By this definition, as expected, the Northern provinces of Milano, Torino, and Genova (the Industrial Triangle) were already driving inventive activities in Italy in the period 1861–1879 and continued to do so in the subsequent periods. However, in addition to the Industrial Triangle and the large towns of Napoli and Roma, somewhat surprisingly, we can identify two further neighboring clusters of inventive activities: Tuscany (the provinces of Livorno and Firenze) and Emilia (the province of Bologna) (see Figure 9 and Figures B8 and B9 in Supplementary materials).
To further investigate the type of inventors driving the high levels of patenting activity in the geographical clusters identified in Figure 10, and Figures B8 and B9 in Supplementary materials, Table B2 in Supplementary materials provides a short description of the top three independent and firm inventors in these provinces. In Bologna and in Firenze (in the last sub-period), the top inventors were a mix of firms and individuals, while in Livorno a predominant role was played by individuals. In all these three provinces, top independent inventors tend to file more patents than firms, while the opposite was true for the inventive clusters of the Industrial Triangle and Napoli and Roma. To sum up, it seems that in the Industrial Triangle, Napoli, and Roma, inventive activities are by and large driven by firms, while in Bologna, Firenze, and Livorno, they are driven by individual inventors.
Share of patents registered by firms.
Source: Our own elaborations on HIP.
Notes: Total corresponds to the number of patents registered by firms in period 1861–1879 (Panel a), 1880–1896 (Panel b), 1897–1914 (Panel c), and 1915–1938 (Panel d).

The technology sectors also differed across clusters. The three sectors with the most active inventors in Bologna were textile manufacturing, food processing, and manufacturing of agricultural machines, while in Firenze, the top inventors patented in metallurgy, the processing of food and wine, and construction sectors. Livorno’s technological profile of active inventors mirrored Florence. The technological sectors of the most inventive inventors in the Industrial Triangle were mostly high-tech, and the top inventors of Roma and Napoli predominantly had high-tech inventions (Table B2 in Supplementary materials). Thus, compared to the regions of the Industrial Triangle, the innovative clusters in Bologna, Livorno, and Firenze appear to be more focused on traditional technological sectors, but they nevertheless had very high patenting activities, which were also of high quality.
Stylized Fact # 8. Firm patenting is much more geographically concentrated than total patenting.
Figure 10a shows that in the initial period between 1861 and 1879, the fraction of patents filed by firms was relatively widely dispersed across Italy. However, in the following periods, the growth of firms’ patent remains geographically concentrated (Figure 10b–d). As a result, the geography of the inventive activity of firms became substantially more concentrated than the overall geography of inventive activities. This suggests that inventive activities by firms required increasingly specialized resources, such as scientific and engineering capabilities and transport infrastructure, that were strongly spatially localized.
Stylized Fact # 9. Inventive activity is more concentrated than population.
Figure 11 presents Lorenz type of curves comparing the concentration of patents and population across Italian provinces, in the decade that followed Unification (1861–1871) and in the final decade of the period (1928–1938). The horizontal axis shows the cumulative share of population (from the smallest to the largest province), whereas the vertical axis shows the cumulative share of patents. The further the curve lies from the bisecting line, the higher the concentration of patents.Footnote 24 Inventive activity appears to be heavily concentrated in both periods with the three provinces of the “Industrial Triangle” placed in the top three ranks during the first period, with Torino in the first place and Milano second, while in the second period, Milano is the leading province, Roma is in third place, and Genova fourth. The overall concentration measured by the Gini index declines (from 0.632 to 0.588), but the C4 index, measuring the share in total patenting of the top four provinces, increases from 59.1 percent to 67.1 percent. This suggests a process of diffusion and diminishing concentration in the lower tail of the distribution, but increasing concentration in the upper tail, reflecting the tendency of invention to be clustered in large urban settings.Footnote 25 It is interesting to note that this pattern of decrease in the Gini and increase in the C4 index concerns only the Northern provinces, and it is probably due to the specific dynamic of the “Industrial triangle” (Figures B10a and B10b in Supplementary materials). In contrast, when considering only the provinces of the South or those of the Centre-South, we find a consistent diminishing concentration of inventive activities over time both in the Gini and C4 indices (Figure B10, Panel c–f in Supplementary materials). This latter result indicates that in the South and in the Centre-South there are no provinces that consolidated their role as innovation hubs capable of triggering the spatial agglomeration of patenting activities. For instance, the province of Napoli holds a share of 60 percent in the 1861–1871 period, while shrinking to 34.9 percent in 1928–1938.
Concentration of population and inventive activities by province (Lorenz curves).
Source: Our own elaborations on HIP.

Institutions
Stylized Fact # 10. The share of women’s patents is small and relatively stable (about 0.7 percent), with some growth in absolute value.
Figure 12 shows the number of patents registered in Italy in which at least one patentee is a woman.Footnote 26 The number of women patenting in Italy was very small. However, we can see a growth in the number of women patenting in Italy over time. This increase in female patenting is even more remarkable given that the female labor force participation was initially high but declined from almost 80 percent to 50 percent during this period 1861–1936 (see Mancini Reference Mancini2018). Only after 1920, there are more than 10 female-linked patents per year. The share of women patents, however, declines during the Fascist period, after an upward trend in the periods 1890–1910 (early industrialization) and 1915–1918 (World War I).
Number and share of female patents in Italy, 1861–1938.
Source: Our own elaborations on HIP.

Figure 12. Long description
A line graph showing the number and share of female patents in Italy from 1861 to 1938. The horizontal axis represents the year, ranging from 1860 to 1940. The left vertical axis represents the number of patents, ranging from 0 to 200. The right vertical axis represents the share of female patents in percent, ranging from 0 to 2. The graph includes two data lines: one for the total number of female patents (left axis) and one for the share of female patents (right axis). The total number of female patents line shows a general upward trend with fluctuations, peaking around 1915 and again in the late 1930s. The share of female patents line also shows fluctuations, with notable peaks around 1915 and the late 1930s.
In Italy, female inventors accounted for just 0.7 percent of patents over the period 1861–1938. This share is higher in France (1.6 percent) during the second half of the nineteenth century (Merouani and Perrin Reference Merouani and Perrin2026), in Great Britain (2 percent) over the period 1800–1930 (Khan Reference Khan2023: 7–8) and in the US (about 5 percent) in the period 1845–1924 (Andrews et al. Reference Andrews, Berkes and Nur Gozen2025). This latter study uses a sophisticated methodology which employs both first names and census linking.Footnote 27 Moreover, the share of patents filed by foreign female inventors in Italy is higher than the share of patents filed by Italian female inventors (Figure B4 in Supplementary materials).Footnote 28 Thus, despite the low patent fees, the access to the Italian patent system for the women inventors remained very limited throughout the period, especially for Italian women.
Stylized Fact # 11. Italy experienced a rise in inventive capabilities during the Liberal Age, which was later followed by a decline under the Fascist regime.
Here, we assess the internationalization of Italian inventors by looking at patenting in the US, the most important technology market of the time, the so-called “third-country” approach (Soete and Wyatt Reference Soete and Wyatt1983). This proxy is usually considered a synthetic, but significant indicator of innovation performance. Figure 13 shows the dynamics of Italy in the total share of foreign patents in the US. The figure points to a pattern of growing performance throughout the entire Liberal Age, at least since 1883 when data become available. In contrast, following the rise of Fascism with the Marcia su Roma in 1922, Italy’s performance deteriorated steadily, with its share declining from about 2.7 percent in 1922 to 1.5 percent in 1938.
Patents granted to Italian residents in the United States as a percentage of total patents granted to foreign residents, 1883–1938.
Source: Our own elaboration on US Department of Commerce, Patent, and Trademark Office (1977).

The thesis advanced by Petri (Reference Petri2002), based primarily on qualitative evidence, that the Fascist period witnessed a significant accumulation of knowledge, laying the foundations for Italy’s postwar “Golden Age” of the 1950s–1960s, is therefore not supported by the steady decline in Italian patenting in the US during the Fascist era. Indeed, several authors have convincingly disputed Petri’s interpretation. After World War I, the Italian system of scientific research was reorganized, leading to the creation of the Consiglio Nazionale delle Ricerche (CNR) in 1923. Although presented by the Fascist regime as a major reform to strengthen science and its links with industry, especially for military purposes, in practice it remained largely rhetorical and did not translate into substantial improvements. Other changes introduced by the Fascist regime in the innovation system proved to be similarly ineffective (Maiocchi Reference Maiocchi and Micheli1980; Nuvolari and Vasta Reference Nuvolari and Vasta2015b). Furthermore, both evidence on productivity growth (Giordano and Giuliano Reference Giordano and Giugliano2015) and productivity levels in comparative perspective (Salamone Reference Salamone2025) also point to a persistently weak innovation performance.
Conclusions
By introducing a new large-scale dataset, the HIP, this article provides fresh evidence on invention patterns over the eighty years between Italian Unification and the eve of World War II (1861–1938). In particular, we have highlighted eleven major stylized facts that characterize Italian inventive activity during this period.
The new data enable us to shed new light on several debates regarding the history of innovation and Italian economic development. The finding that foreign inventions outnumber Italian ones in both quantity and quality suggests that Italy serves as a compelling case study in discussions on the role of openness vis-à-vis discrimination in the development of domestic technological capabilities. On the one hand, an open patent system may stimulate intensive flows of technologies from abroad, but at the same time, this foreign competition can hamper the accumulation of domestic technological capabilities. On the other hand, discrimination (de iure or de facto) may help domestic inventors to enhance their own capabilities, but at the same time reduce the technology flows from abroad. Since the Italian innovation system remained structurally characterized by limited investments in R&D activities and education throughout this period, our evidence seems to suggest that a very open patent system is surely not a sufficient condition for technological catching up. Indeed, the Italian patent system was characterized by a large presence of foreign inventions over the entire period, especially by German and French inventors. Foreign inventions were of higher quality and were more concentrated in high-tech sectors, mainly due to firms, than domestic inventions, suggesting a structural technological dependence of the Italian industry. Additionally, domestic innovative patterns were very geographically concentrated. We find a sizeable and long-lasting North-Center vs. South gap in patenting output, with the large contribution of the “Industrial Triangle” and of Roma and Napoli, alongside a cluster located in Tuscany and Bologna.
In our analysis, we cover both the Liberal Age (1861–1921) and the Fascist period (1922–1938). It is remarkable that the data show a substantial continuity in many dimensions of inventive activities. This suggests that the historiography that has maintained an acceleration in the development of domestic technological capabilities during the Fascist period (Petri Reference Petri2002) may be wide off the mark. Indeed, the emphasis on the construction of a system of scientific research during the Fascist period was more rhetoric than real. Overall, we can point to a continuity of the structural weakness of Italian invention that spans from the Liberal Age to the Fascist period (Nuvolari and Vasta Reference Nuvolari and Vasta2015b). Other indicators, such as labor productivity, confirm this argument, as the industry composition remained very concentrated into traditional sectors (Ciccarelli and Fachin Reference Ciccarelli and Fachin2017 for the Liberal Age, and Salamone Reference Salamone2025 for the Fascist period).
HIP offers several opportunities for further research at the micro and macro level. It can be exploited to study the main drivers of inventive activities in different historical periods, such as various types of human capital (basic, technical education, and upper-tail human capital), physical and intangible infrastructures (railways, roads, knowledge repositories such as libraries and scientific societies), and the effectiveness of markets for technology at the local level. Furthermore, our patent dataset can be used as a starting point for further research into more detailed aspects of the history of invention, such as the role of geographical or sectoral inventive clusters. For geography, this requires a detailed look at the localization choices of inventors throughout their lifetime. At the sectoral level, this needs to combine the patent data with other data on production, employment, and wages (e.g., Ciccarelli and Fenoaltea Reference Ciccarelli and Fenoaltea2013; and Ciccarelli and Missiaia Reference Ciccarelli and Missiaia2013; Federico et al. Reference Federico, Nuvolari and Vasta2019), or data about firms’ demography (creation and mortality). Additionally, at the micro level, this dataset allows exploration of the inventive capacity of single firms or single industrial sectors. Finally, HIP can be integrated with other national patent databases to conduct international comparisons, considering the mobility of inventors and patents across countries.
Distribution of foreign patents in Italy according to 1911 State borders (%)

Table 2. Long description
A table showing the distribution of foreign patents in Italy by country from 1861 to 1938. The table has 19 rows and 6 columns. The columns are labeled with the years 1861-1879, 1880-1896, 1897-1914, 1915-1938, and 1861-1938. The rows are labeled with the countries: France, Great Britain, Germany, United States of America, Austria-Hungary, Switzerland, Belgium, Russia, Spain, Sweden, Netherlands, Denmark, Canada, Australia, New Zealand, Norway, Japan, Argentina, and Others. The table also includes the sum of patents, total number of foreign patents, total number of domestic patents, and the total number of foreign and domestic patents for each period. Row 1: France, 48.0, 22.1, 17.2, 15.7, 17.5. Row 2: Great Britain, 18.6, 17.0, 12.6, 13.3, 13.6. Row 3: Germany, 12.7, 29.4, 34.7, 31.2, 31.6. Row 4: United States of America, 6.7, 12.2, 12.6, 15.3, 14.0. Row 5: Austria-Hungary, 4.6, 6.7, 7.4, 5.6, 6.2. Row 6: Switzerland, 2.8, 3.7, 5.6, 7.5, 6.5. Row 7: Belgium, 2.5, 2.8, 2.9, 1.7, 2.1. Row 8: Russia, 0.9, 0.7, 0.9, 0.1, 0.4. Row 9: Spain, 0.7, 1.0, 0.7, 0.9, 0.8. Row 10: Sweden, 0.6, 0.8, 1.1, 2.0, 1.6. Row 11: Netherlands, 0.4, 0.4, 0.5, 2.4, 1.7. Row 12: Denmark, 0.3, 0.5, 0.9, 0.7, 0.7. Row 13: Canada, 0.1, 0.3, 0.5, 0.4, 0.4. Row 14: Australia, 0.1, 0.5, 0.8, 0.6, 0.4. Row 15: New Zealand, 0.0, 0.0, 0.3, 0.2, 0.2. Row 16: Norway, 0.0, 0.1, 0.2, 0.6, 0.4. Row 17: Japan, 0.0, 0.0, 0.0, 0.3, 0.2. Row 18: Argentina, 0.0, 0.0, 0.2, 0.3, 0.2. Row 19: Others, 0.9, 0.8, 0.9, 1.3, 1.1. Sum: 100, 100, 100, 100, 100. Total no. foreign patents: 4,051.5, 16,761.5, 47,554.5, 101,368, 169,735.5. Total no. domestic patents: 3,594.5, 7,586.5, 24,064.5, 72,296, 107,541.5. Total no. (foreign+domestic): 7,646, 24,348, 71,619, 173,664, 277,277.
Note: The count of patents is fractional.
Source: Our own elaborations on HIP.
Supplementary material
The supplementary material for this article can be found at https://doi.org/10.1017/ssh.2026.10143
Acknowledgments
We wish to thank Sara Pecchioli for her outstanding research assistance. We are grateful to the participants of the “Patent data” sessions in the Social Science History Association Conference (Washington DC, 2023) for their valuable comments. This article has also benefited of suggestions by participants of the XIX World Economic History Congress (Paris, 2022). In particular, we would like to thank Mike Andrews, Bernardita Escobar, and Matti La Mela for their invaluable comments. We are also grateful to Alexander Donges, Gabriel Galvez-Behar, Tom Nicholas, Patricio Saiz, Jochen Streb, and Fredrik Tell for many years of stimulating discussions on historical patent datasets. Finally, we thank Stefano Susini for significant advice in the construction of the dataset. We acknowledge the financial support from the Italian Ministry of University and Research (MUR), PRIN 2017 project: “Lost highway: skills, technology and trade in Italian economic growth, 1815-2018” (prot. 2017YLBYZE).





 Open access

